the new economics of the nhl - mowat...
TRANSCRIPT
The New Economics of the NHLWHY CANADA CAN SUPPORT 12 TEAMS
April 2011
Tony Keller

APPLIED PUBLIC POLICY RESEARCH INFORMED BY ONTARIO’S REALITY
A digital copy of this report is available at the Mowat Centre’s website at www.mowatcentre.ca. To order printed copies of this publication for a fee, please contact us by email at [email protected].
The New Economics of the NHL: Why Canada Can Support 12 Teams By Tony Keller with
ISBN 978-0-9867464-7-5
©Mowat Centre for Policy Innovation

1Why Canada Can Support 12 Teams
Executive Summary
For four decades, the NHL has pursued a Southern Strategy, increasing the number of teams in the United States, particularly in the fast-growing Sun Belt, in an effort to grow interest in hockey in the US. These efforts have been largely unsuccessful, with many of these
franchises suffering from low fan interest and low revenues. As a result, there is increased pressure to relocate some of these teams to Canada where demand for hockey is stronger. In this Mowat Commentary, we estimate how much stronger this demand is, and identify which Canadian cities would be the best locations for new NHL teams.
We conclude that Canada can likely support 12 NHL teams, or double the current number of Canadian franchises.
We analyzed 10 Canadian markets, assessing their ability to support an NHL team. We conducted a regression analysis, along with a qualitative analysis of the demographic and economic strengths of each market. Each of the potential NHL cities was compared to our benchmark city, Edmonton.
Edmonton is the NHL’s smallest market and has the league’s second smallest arena, yet thanks to the higher level of interest in hockey in Canada, the Oilers consistently generate higher arena revenues than most American NHL teams.
Using the main variable identified as being essential for the success of an NHL team—the size of its home city—but controlling for whether a city is in Canada, we estimate that a team located in Canada can expect to take in roughly US$23 million a year in extra gate revenue, relative to an American market of the same size. This greater level of fan interest north of the border means that small Canadian cities are bigger hockey markets than most large American cities.
Our analysis shows that:
• The best location for a new team is Ontario’s Greater Golden Horseshoe, a market of 9 million people that can support 3 NHL teams.
• The best location within the Horseshoe is the Greater Toronto Area, which can support a second NHL team.
• A new team would also be successful in one of the following cities to the west of Toronto: Hamilton, Kitchener-Waterloo or London.
• Vancouver and Montreal each have enough demand to support a second NHL team.
• Despite their small populations, teams would be viable in Winnipeg and Quebec City.

2 Mowat Centre for Policy Innovation
Teams in any of the above locations would likely generate higher gate revenues than the average US team. If owners and entrepreneurs were free to either move existing teams or create new teams, our findings suggest that Canada would have 12 NHL franchises.
Why has the league not moved more of the supply of hockey to where the demand is? Why has the NHL not allowed investors to establish new teams in those six underserviced Canadian markets?
The answer has to do with the monopoly structure of the league. Professional hockey in North America is not a free market. NHL owners are not competitors but instead collaborators in a cartel. The NHL, just like the MLB, NFL and NBA, artificially restricts the supply of top-tier professional sport for the benefit of its members, by limiting the number of franchises and controlling where they play.
This artificial scarcity in turn causes cities to compete for the right to host a big league pro team, with most American state and local governments using taxpayer funds to lure or keep a franchise. Those taxpayer subsidies—omnipresent in the US, uncommon in Canada—significantly distort the market. Absent those subsidies, which are often large enough to offset a lack of ticket sales and local fan interest, teams would move to where the demand is. The Phoenix Coyotes are a long-standing case in point.
Several Canadian markets are large enough hockey markets to support a new NHL team. The demand is there. They do not have a team because of the structure of the NHL, which undermines the free market to the detriment of Canadian hockey fans. The barrier to more NHL teams in Canada is not economic. The problem is political and legal, as are the solutions.

3Why Canada Can Support 12 Teams
THE NEW ECONOMICSOF THE NHLWHY CANADA CAN SUPPORT 12 TEAMS
On April 30, 2010, the National Hockey League proudly announced a signifi-cant increase in its United States TV audience. Viewership for the first round
of the playoffs was up 24 per cent, compared to the year before, with NBC and cable channel Versus recording a combined average of 742,000 viewers per telecast.1
At the same time in Canada, people were also watching hockey. From April 26 to 28, TSN broadcast the final games of the first round of the playoffs, averaging 2.3 million viewers for early evening games and 1.4 million for late games. When the second round of playoffs began later that week, games on CBC’s Hockey Night in Canada pulled in an average audience of 2.4 million viewers. Late evening second-round games on TSN averaged 1.2 million viewers.2
Given the difference in population between the two countries, the results suggest that Canadians outside of Quebec were roughly 40 times as likely as Americans to have been watching a national broadcast of NHL hockey during the week of April 26.3 And the French-language hockey audience was proportionally even bigger: a Quebecer was as much as 90 times as likely as an American to have been watching a hockey game. Games six and seven of the first-round playoff series between the Montreal Canadiens and the Washington Capitals drew an average of 1.7 million viewers on French-language cable station RDS. The first two games of the second round between the Canadiens and Penguins drew an average of 1.4 million view-ers. Even the post-game shows after the Penguins games were among the most watched programs on French-language TV that week: 829,000 viewers.4
Canadians are certainly aware that TV ratings, ticket sales and ticket prices are all higher north of the border. But the magnitude of the difference may not be fully appreciated, nor its impact on the viability of franchises. (See Tables 1, 2, 3,4 and Figure 1). Small Canadian NHL cities—Edmonton, Calgary and Ottawa—are bigger hockey markets than most large American cities, and their fran-chises generate significantly higher local revenues. Despite not enjoying the significant taxpayer sub-sidies offered to many American teams, Canada’s NHL franchises appear to be highly profitable.
DURING THE EARLY ROUNDS OF THE 2010 PLAYOFFS, CANADIANS OUTSIDE OF QUEBEC WERE 40 TIMES AS LIKELY AS AMERICANS TO HAVE BEEN WATCHING HOCKEY. QUEBECERS WERE AS MUCH AS 90 TIMES AS LIKELY TO HAVE BEEN WATCHING HOCKEY.

4 Mowat Centre for Policy Innovation
This study quantifies the impact of that excess Canadian demand: call it the “Hoser Effect.” We looked at the estimated revenues for each NHL team, and considered a number of key demographic and economic factors in each city. We then performed a regression analysis to measure how an NHL franchise’s ability to generate revenue correlates with the size, wealth and geographic location of its home city. Using those findings, we then looked at 10 Canadian cities to determine which would be the best locations for new NHL teams. We ranked these aspiring Canadian NHL cities from best to worst using two methods: a model derived from regression and qualitative analyses.
We find that Canada can support 12 NHL teams: in addition to the current six NHL franchises, there are six Canadian markets where a new NHL team would likely be able to generate local revenues equal to or greater than the NHL median.
AMERICAN TEAMS ARE ENTITLED TO AT LEAST 80% OF THE NATIONAL TV BROADCAST FEES PAID BY TSN, RDS AND THE TAxPAYER-SUPPORTED CBC. AND AFTER TAKING INTO ACCOUNT REVENUE SHARE PAID TO POOR US TEAMS, THE PERCENTAGE OF CANADIAN TV REVENUE GOING TO AMERICAN TEAMS MAY BE AS HIGH AS 90%.
Table 1RegulaR season vieweRship foR Canadian nhl bRoadCasTs
broadcaster audience # games
Local: Rogers Sportsnet
Toronto Maple Leafs (Ontario only) 655,800 28
Vancouver Canucks (BC and Yukon) 400,100 44
Ottawa Senators (Ottawa and Eastern Ontario)*
152,700 40
Edmonton Oilers (West) 176,800 40
Calgary Flames (West) 219,800 44
National: CBC & TSN
Hockey Night in Canada: CBC** 1,351,000 61
NHL Hockey: TSN*** 707,700 71
NHL Hockey: TSN2**** 122,200 13
Source: Sportsnet. 2009-2010 Estimates: Audiences based on 2010 PPM actuals.*RDS also broadcasts 17 Senators games in French, not included in this table.** Games 1 and 2, and afternoon average (at least one Canadian team).*** At least one Canadian team. **** Live games only, at least one Canadian team.
5Why Canada Can Support 12 Teams
For four decades, the NHL has pursued a Southern Strategy. The US has nine times as many people as Canada, and the fast-est growing part of the US is the Sun Belt, where the NHL has especially sought to expand. Given the much larger US popu-lation, if Americans become only half as interested in hockey as Canadians—or even one quarter or one-sixth as interested—the American hockey audience would be much bigger than the Canadian audience.
By placing new teams in the largest US markets, especially in the fast-growing Sun Belt, the league hoped to land its Holy Grail: a major US national TV contract. It would significantly raise the league’s revenues and team owners would see a significant increase in the value of their investments.
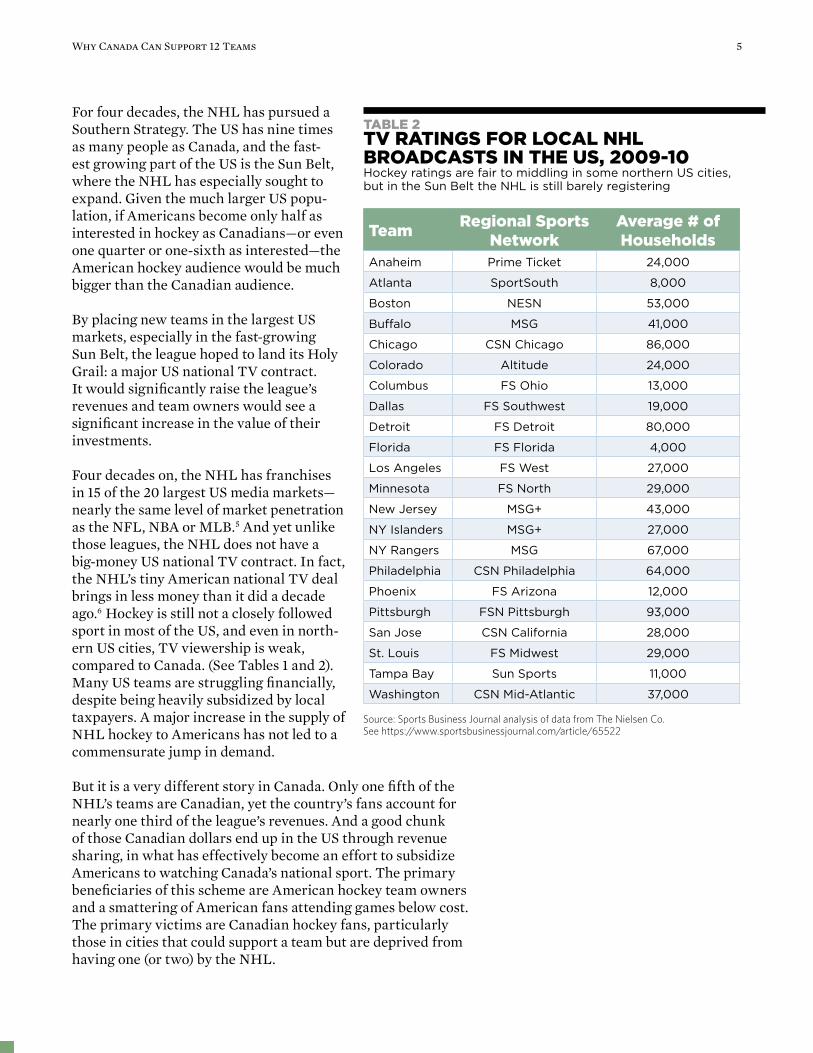
Four decades on, the NHL has franchises in 15 of the 20 largest US media markets—nearly the same level of market penetration as the NFL, NBA or MLB.5 And yet unlike those leagues, the NHL does not have a big-money US national TV contract. In fact, the NHL’s tiny American national TV deal brings in less money than it did a decade ago.6 Hockey is still not a closely followed sport in most of the US, and even in north-ern US cities, TV viewership is weak, compared to Canada. (See Tables 1 and 2). Many US teams are struggling financially, despite being heavily subsidized by local taxpayers. A major increase in the supply of NHL hockey to Americans has not led to a commensurate jump in demand.
But it is a very different story in Canada. Only one fifth of the NHL’s teams are Canadian, yet the country’s fans account for nearly one third of the league’s revenues. And a good chunk of those Canadian dollars end up in the US through revenue sharing, in what has effectively become an effort to subsidize Americans to watching Canada’s national sport. The primary beneficiaries of this scheme are American hockey team owners and a smattering of American fans attending games below cost. The primary victims are Canadian hockey fans, particularly those in cities that could support a team but are deprived from having one (or two) by the NHL.
Table 2Tv RaTings foR loCal nhl bRoadCasTs in The us, 2009-10Hockey ratings are fair to middling in some northern US cities, but in the Sun Belt the NHL is still barely registering
TeamRegional sports
networkaverage # of households
Anaheim Prime Ticket 24,000
Atlanta SportSouth 8,000
Boston NESN 53,000
Buffalo MSG 41,000
Chicago CSN Chicago 86,000
Colorado Altitude 24,000
Columbus FS Ohio 13,000
Dallas FS Southwest 19,000
Detroit FS Detroit 80,000
Florida FS Florida 4,000
Los Angeles FS West 27,000
Minnesota FS North 29,000
New Jersey MSG+ 43,000
NY Islanders MSG+ 27,000
NY Rangers MSG 67,000
Philadelphia CSN Philadelphia 64,000
Phoenix FS Arizona 12,000
Pittsburgh FSN Pittsburgh 93,000
San Jose CSN California 28,000
St. Louis FS Midwest 29,000
Tampa Bay Sun Sports 11,000
Washington CSN Mid-Atlantic 37,000
Source: Sports Business Journal analysis of data from The Nielsen Co. See https://www.sportsbusinessjournal.com/article/65522

6 Mowat Centre for Policy Innovation
For example, the CBC is paying approximately $100 million a year for the broadcast rights to Hockey Night in Canada. Be-cause these are so-called national broadcast rights, the monies involved belong to the league, not the six Canadian franchises, and the league redistributes them to all NHL teams. As a result, out of the $100 million a year paid by the taxpayer-owned CBC for hockey rights, only $20 million is allocated to Canadian teams—the other $80 million is sent to the US. The same treat-ment applies to the estimated $40 million a year paid by TSN for its national TV rights, as well as the portion of the RDS rights fee that is treated as a national broadcast. In contrast, US national TV revenues from Versus and NBC are believed to be less than US$100 million a year.7 (All subsequent figures in $US un-less otherwise indicated). Given the size of the US market and the number of US teams, that is tiny. The bottom line is that two-thirds of the NHL’s national TV rev-enues are earned in Canada, and then redistributed across all of the NHL’s—primarily American—franchises.8
And the actual distribution of Canadian TV money to American teams, once the effects of league-wide revenue sharing are taken into consideration, is even more unfavourable to Canadian teams.9 NHL revenue sharing assistance to poorer NHL teams, all currently American, is partly funded by national TV revenues. It is estimated that at least $40 million a year is paid into the pool by Canadian teams. The exact composition and division of the revenue sharing pool is complex and secretive, but we know that the pool is partly drawn from television revenues. In other words, American teams are entitled to at least 80 per cent of the national broadcast fees paid by CBC, TSN and RDS. But after revenue share is paid out to poor US teams, the actual percentage of Canadian national TV revenue going to American teams is higher—perhaps as high as 90 per cent.
CANADA HAS ONE FIFTH OF THE NHL’S TEAMS, YET THE COUNTRY’S FANS ACCOUNT FOR NEARLY ONE THIRD OF THE LEAGUE’S REVENUES.
figuRe 1The pRiCe of admissionThanks to fan demand, tickets are much more expensive up north. Of the seven teams with the highest prices, five are Canadian—and even that remarkable fact understates the cross-border disparity. This table shows the official ticket price, but US teams often deeply discount seats, even giving them away—practices unknown in Canada.
AVERAGE TICKET PRICE ($US)
AVERAGE PREMIUM TICKET PRICE ($US)
“Average ticket price” represents a weighted average of season ticket prices for non-premium seats. “Premium seats” are seats that come with at least one amenity (does not include corpo-rate boxes). All ticket prices converted to $US by Team Marketing Report.Source: Team Marketing Report
2010
-11
2009-10
2008-
09
2007-
08
2006-0
7
2005-
06
2004-0
5
2003-
04
2002-
0320
30
40
50
60
70
80
90
100
110
$120
50
80
110
140
170
$200
2010
-11
2009-10
2008-
09
2007-
08
2006-0
7
2005-
06
2004-0
5
2003-
04
2002-
03
Ottawa
Toronto
Montreal
Calgary
Vancouver
Edmonton
League Average
7Why Canada Can Support 12 Teams
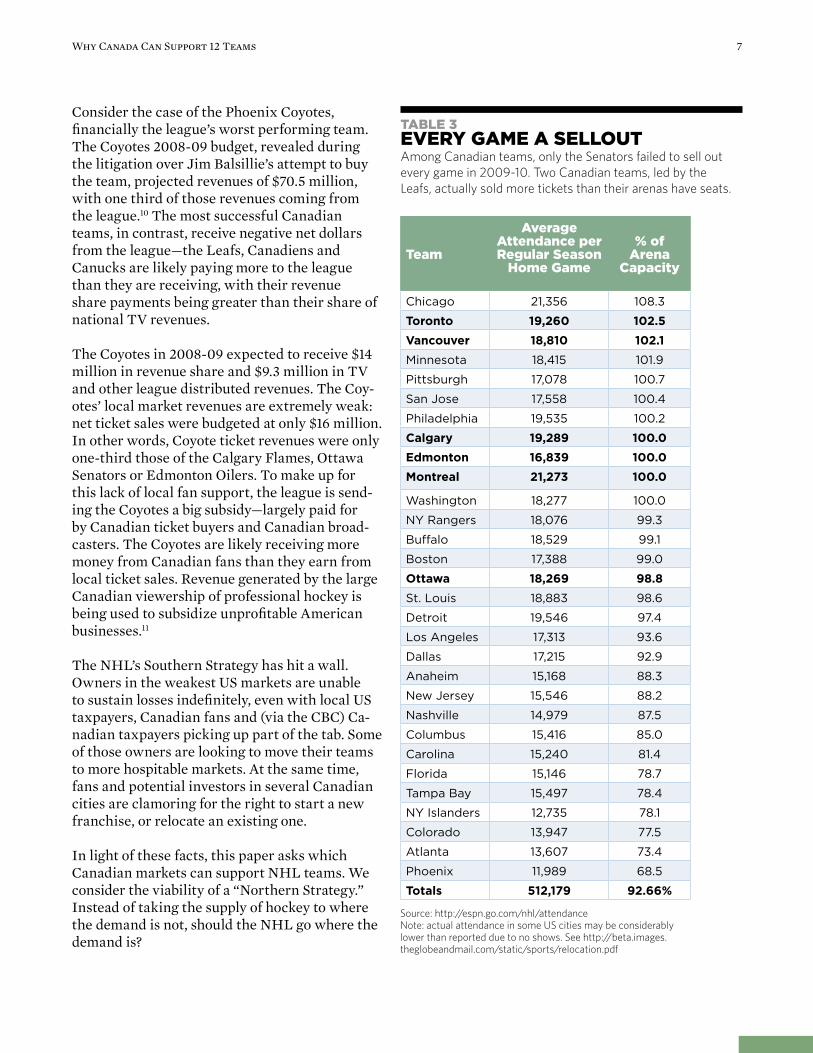
Consider the case of the Phoenix Coyotes, financially the league’s worst performing team. The Coyotes 2008-09 budget, revealed during the litigation over Jim Balsillie’s attempt to buy the team, projected revenues of $70.5 million, with one third of those revenues coming from the league.10 The most successful Canadian teams, in contrast, receive negative net dollars from the league—the Leafs, Canadiens and Canucks are likely paying more to the league than they are receiving, with their revenue share payments being greater than their share of national TV revenues.
The Coyotes in 2008-09 expected to receive $14 million in revenue share and $9.3 million in TV and other league distributed revenues. The Coy-otes’ local market revenues are extremely weak: net ticket sales were budgeted at only $16 million. In other words, Coyote ticket revenues were only one-third those of the Calgary Flames, Ottawa Senators or Edmonton Oilers. To make up for this lack of local fan support, the league is send-ing the Coyotes a big subsidy—largely paid for by Canadian ticket buyers and Canadian broad-casters. The Coyotes are likely receiving more money from Canadian fans than they earn from local ticket sales. Revenue generated by the large Canadian viewership of professional hockey is being used to subsidize unprofitable American businesses.11
The NHL’s Southern Strategy has hit a wall. Owners in the weakest US markets are unable to sustain losses indefinitely, even with local US taxpayers, Canadian fans and (via the CBC) Ca-nadian taxpayers picking up part of the tab. Some of those owners are looking to move their teams to more hospitable markets. At the same time, fans and potential investors in several Canadian cities are clamoring for the right to start a new franchise, or relocate an existing one.
In light of these facts, this paper asks which Canadian markets can support NHL teams. We consider the viability of a “Northern Strategy.” Instead of taking the supply of hockey to where the demand is not, should the NHL go where the demand is?
Table 3eveRY game a sellouTAmong Canadian teams, only the Senators failed to sell out every game in 2009-10. Two Canadian teams, led by the Leafs, actually sold more tickets than their arenas have seats.
Team
average attendance per Regular season
home game
% of arena
Capacity
Chicago 21,356 108.3
Toronto 19,260 102.5
Vancouver 18,810 102.1
Minnesota 18,415 101.9
Pittsburgh 17,078 100.7
San Jose 17,558 100.4
Philadelphia 19,535 100.2
Calgary 19,289 100.0
Edmonton 16,839 100.0
Montreal 21,273 100.0
Washington 18,277 100.0
NY Rangers 18,076 99.3
Buffalo 18,529 99.1
Boston 17,388 99.0
Ottawa 18,269 98.8
St. Louis 18,883 98.6
Detroit 19,546 97.4
Los Angeles 17,313 93.6
Dallas 17,215 92.9
Anaheim 15,168 88.3
New Jersey 15,546 88.2
Nashville 14,979 87.5
Columbus 15,416 85.0
Carolina 15,240 81.4
Florida 15,146 78.7
Tampa Bay 15,497 78.4
NY Islanders 12,735 78.1
Colorado 13,947 77.5
Atlanta 13,607 73.4
Phoenix 11,989 68.5
Totals 512,179 92.66%
Source: http://espn.go.com/nhl/attendanceNote: actual attendance in some US cities may be considerably lower than reported due to no shows. See http://beta.images.theglobeandmail.com/static/sports/relocation.pdf
8 Mowat Centre for Policy Innovation
NHL hockey is an attendance business. A high level of local fan support is essential for a team’s success because,
unlike the situation in other North American professional sports leagues, ticket sales are by far the largest single source of revenue. According to the 2004 Levitt report on league finances, prepared for the NHL by former US Securities and Exchange Commission chair Arthur Levitt in 2002-03, in that year, gate accounted for 52 per cent of league revenues.12 (See Figure 4).
NHL teams also earn significant additional attendance-related money after selling a seat through food sales, other concessions and advertising inside the arena. What the Levitt report termed “in arena revenue”—which included some fees from luxury boxes and premium seats—made up an additional 21 per cent of the average NHL team’s revenue in 2002-03.
In other words, according to the most credible public source on league finances, tickets to a game, corporate boxes, spon-sorships and other attendance-related activities account for nearly three quarters of the average team’s revenue stream.13
To a much greater extent than teams in the NBA, MLB or NFL—leagues that, unlike the NHL, enjoy extremely lucrative national US TV contracts—the name of the game in the NHL is “bums in seats.”
THE NBA HAS A TV DEAL WORTH MORE THAN $900 MILLION A YEAR; BEFORE SELLING A SINGLE TICKET, EACH NBA TEAM STARTS THE SEASON WITH $30 MILLION IN HAND. THE NFL DISTRIBUTES MORE THAN $140 MILLION A YEAR IN MEDIA REVENUES TO EACH FRANCHISE. AND THE NHL? EACH NHL TEAM RECEIVES jUST $8 MILLION OR SO FROM NATIONAL TV DEALS. NHL TEAMS SURVIVE ALMOST ENTIRELY ON LOCAL REVENUES, ESPECIALLY TICKET SALES.
The new eConomiCs of The nhlwhY moRe Canadian Teams make sense

9Why Canada Can Support 12 Teams
The other three big North American sports leagues enjoy massive revenues from US TV deals. Those national TV revenues mean that teams are much less dependent on local fans. For example, consider the comparison between the NBA and NHL. Both leagues allow teams to keep 100 per cent of their local TV earnings, but pool national TV revenues. The NHL is believed to receive C$155 million a year from CBC, TSN and the portion of the Montreal Canadiens RDS deal that is treated as a national broadcast. The NHL’s US deal with Versus is worth $72.5 million a year, and the league also has a revenue sharing deal with NBC for the limited number of games the network broad-casts. Altogether, the league takes in approximately $250 million worth of national TV revenues. Divide that by 30 teams, and each franchise is entitled to ap-proximately $8 million.
The NBA, in contrast, has a US national TV deal worth more than $900 million a year. Before selling a single ticket in its home arena, each NBA team starts the season with $30 million in its pocket.14
NFL teams are even less dependent on local fans. Thanks to the league’s exceptionally lucrative TV contracts with multiple network and non-network TV operations, the NFL distributes more than $140 million a year to each team.15 The NHL’s entire US TV contract is worth less than the TV revenue share of just one NFL team.
All of which means that NFL and NBA owners are in a very different position than NHL owners. The median NFL team receives more than half of its revenue from the proceeds of national TV contracts. NHL teams, in contrast, are almost entirely dependent on revenues from local fans: ticket sales and other arena revenues.
The Edmonton Oilers are a good example of how a small Canadian market with a high level of interest in hockey can be a better location for a team than a large American city whose residents have only a middling level of interest in the game. All else being equal, a team located in a big American market such as Phoe-nix, Miami or Atlanta should have nothing but ad-vantages when compared to a small-market Canadian team. But all else is not equal. A Canadian city of just over one million has far more hockey fans than a Sun Belt city of more than four million. (See Table 4).
Table 4loTs of bums in eXpensive seaTsThanks to higher ticket prices and higher attendance, Canadian teams record league-beating ticket revenues. According to these figures, leaked to the Toronto Star, in 2007-08 the Oilers had a higher gate than 23 out of 24 American teams.
TeamTicket revenue per game ($us)
2006-07 2007-08 %change
Toronto $1.5m $1.9m 26.7
Montreal 1.3m 1.7m 30.8
Vancouver 1.1m 1.4m 27.2
Calgary 1m 1.3m 30
NY Rangers 1.1m 1.3m 18.2
Ottawa 950,000 1.2m 26.3
Edmonton 1m 1.2m 20
Minnesota 1m 1.1m 10
Colorado 1.05m 1m -4.8
Detroit 1.1m 1m -10
Philadelphia 1m 1m 0
Dallas 1m 950,000 -0.5
San Jose 850,000 950,000 11.8
Anaheim 800,000 900,000 12.5
New Jersey 600,000 850,000 41.6
Columbus 850,000 800,000 -5.9
Pittsburgh 600,000 800,000 33.3
Tampa Bay 800,000 800,000 0
Boston 800,000 800,000 0
Buffalo 650,000 750,000 15.4
Carolina 700,000 700,000 0
Los Angeles 700,000 650,000 -7.1
St. Louis 450,000 600,000 33.3
Nashville 550,000 600,000 9
Washington 500,000 550,000 10
Atlanta 500,000 550,000 10
NY Islanders 500,000 550,000 10
Chicago 350,000 500,000 42.8
Florida 500,000 500,000 0
Phoenix 550,000 450,000 -18.2
Source: http://www3.thestar.com/static/PDF/080530_nhl_tick-ets_revenue.pdf

10 Mowat Centre for Policy Innovation
The Oilers also illustrate how dependent NHL teams are on lo-cal revenues generally, and ticket sales in particular, compared to teams in other leagues. In 2009-10, according to Forbes, the Oilers generated $49 million in gate receipts. Total revenue, as estimated by Forbes, was $87 million. In other words, gate accounted for 56 per cent of revenues. As per the Levitt report, another 20 per cent likely came from other in-arena revenues including sponsorships and corporate boxes. And the Oilers local TV contract with Rogers Sportsnet likely accounts for another 10 per cent or so. In other words, the Oilers generate at least 80 cents on every dollar themselves, in Edmonton.
Contrast the Oilers, the smallest market team in the NHL, with the Jacksonville Jaguars, the smallest market team in the NFL, and a city only slightly larger than Edmonton. Last year, accord-ing to Forbes, the Jaguars had gate receipts of only $38 million—but the team’s total revenue was $220 million. Gate accounted for just 17 per cent of revenue. Money redistributed from the NFL’s huge US national TV contracts accounts for the bulk of Jaguars’ revenues.
100m
200m
300m
400m
500m
US$600mLeafs’ Team Value
Leafs’ Revenue
2009-10
2008-
09
2007-
08
2006-0
7
2005-
06
2003-
04
2002-
03
2001-
02
2000-0
1
figuRe 2gRowTh in leafs’ value/RevenueLeafs’ revenues have doubled over the last decade and so has the value of the team. According to Forbes, the average NHL team had $98 million in revenue last year, compared to $187 million for the Leafs.
Sources: Forbes Magazine (http://www.forbes.com/lists/2009/31/hockey-values-09_Toronto-Maple-Leafs_312012.html) 2004-2005 omitted due to year-long strike

11Why Canada Can Support 12 Teams
The Levitt Report took a stab at analyzing which NHL markets are successful and why. Levitt found that, in considering the 19 unnamed NHL teams identified as losing money in 2002-03, “there appears to be no clear relationship between the size of the loss and revenue ranking or market size.”16 That absence of correlation is explained by two factors that Levitt did not consider. The lack of relationship between revenues and losses is likely in part attributable to the vary-ing levels of government subsidy received by most American NHL teams—something we return to later in this paper. And his finding of no relationship between profitability and market size stems in part from his failure to take into account the Canada-US border.
Our analysis controls for the border and we come to a different conclusion: a team’s ability to generate revenues correlates strongly with the population of its home market—so long as you control for the presence of the Canada-US border. Toronto is a more profitable market than Ottawa and New York is a more profitable market than Buffalo. But a small Canadian city the size of Edmonton is a more profitable market than a big Sun Belt city the size of Atlanta. Levitt, in effect, concluded that because Edmonton is a more profitable market than Atlanta there is no correlation between the size of a city and its profitability; instead he should have concluded that being a Canadian city—even a small one—makes a team much more likely to be profitable.
Consider:
• Canada’s six NHL teams are only one-fifth of the NHL’s 30 fran-chises—yet Canada generates nearly a third of the league’s rev-enues.
• Edmonton, Calgary and Ottawa are three of the smallest markets in the NHL, yet these franchises enjoy arena gate revenues that exceed almost every American franchise.
• The rights to broadcast NHL hockey are the most important deals in the Canadian television market. In the US, the NHL does not even have a proper national network TV deal.
The fans are in Canada. The question is: what Canadian cities have them in sufficient numbers to support an NHL team?

12 Mowat Centre for Policy Innovation
The Case foR moRe Canadian Teamsusing The league’s measuRes
It is widely assumed that the league has four conditions that a city or owner seeking to acquire a team would have to
satisfy. The league has never officially stated these, but they can be surmised from commissioner Gary Bettman’s public state-ments, including a number of comments about the possibility of teams returning to Canada. An aspiring city must have:
1. Adequate fan support.
2. Serious investors behind the team .
3. An NHL-sized arena: An 18,000 seat facility is the league norm. However, Bettman has said that in the case of Winni-peg, the 15,000 seat MTS Centre is adequate. (Note that few US teams consistently fill their 18,000 plus seats).17
4. No territorial conflicts with existing teams: The league ap-parently uses a 50 mile (80km) exclusive territorial zone. However, expansion teams have in the past moved into existing franchise’s zones: the Islanders and later the Devils entered into the Rangers’ New York area, and the Ducks were an expansion team placed into the L.A. Kings’ exclu-sive market. New teams have in the past been forced to pay indemnities to incumbents for moving into their exclusive zone, but Bettman has recently stressed that the NHL con-stitution does not give incumbent teams a veto over moves into their zone.18
The league’s Southern Strategy is focused on items 2, 3 and 4: the infrastructure of professional hockey is put in place in a large US city in the hope that this will over time produce item 1—fans. Supply is expected to, eventually, generate demand. The plan has had very mixed success. In some US expansion cities demand has, over time, risen—though not to Canadian levels. In many other cities, particularly in the Sun Belt, it has not. And a major US national TV contract is still nowhere to be seen.
The Northern Strategy, in contrast, starts with demand. Item 1, a sufficiently large and committed fan base, already exists in several Canadian cities. What is missing is supply—and the will-ingness of the NHL to permit the market to function normally.

0
1,000,000
2,000,000
3,000,000
4,000,000
5,000,000
6,000,000
9,000,000
Po
pu
lati
on*
Saska
toon
Halifa
x
Win
nipeg
Edmont
on
Buffa
lo
Ottaw
a
Calgar
y
Que
bec C
ity
Nas
hville
Ralei
gh
Colum
bus
Pittsb
urgh
Vanco
uver
St. Lo
uis
Mont
real
Toro
nto/
Gold
en H
orses
hoe
13Why Canada Can Support 12 Teams
In the following section we assess the potential of Canadian cities as homes to NHL teams. We consider the criteria of adequate fan support and the presence of an NHL-sized arena. To measure potential fan support, we considered the size of each city’s population and the economic strength of the market as measured by such variables as median income, the number of high-income households and corporate head offices. We do not assess the presence of serious investors, assuming instead that if demand is strong enough, a profit-seeking investor would be eager to make the investments necessary to bring the product to market.
Similarly, we ignore territorial conflict because the league has shown in both the New York and L.A. markets that, when offered a sufficiently compelling value proposition, it is willing to allow large markets to have more than one team. We also ignore territorial conflicts because our objective is not to divine what the NHL cartel will allow, but rather what the free market will support.
figuRe 3CompaRing The size of hoCkeY maRkeTsOntario’s Golden Horseshoe is the largest hockey market in the world—with as many people as ten Winnipegs. It is also growing rapidly, adding the equivalent of the population of Manitoba every decade. The table compares 10 Canadian city-regions against the six smallest US NHL markets.
Sources: http://www12.statcan.ca/census-recensement/2006/dp-pd/prof/92-591/index.cfm?Lang=Ehttp://www.census.gov/popest/datasets.html*Regional population, see Appendix 2 for definition.

Ranking poTenTial nhl siTes

15Why Canada Can Support 12 Teams
QuanTiTaTive analYsis
We constructed a model where we sought to estimate team gate revenues.19 Estimates were derived from three
factors related to the home city: population, wealth and geo-graphic location.
We found no effect from the wealth of a city and, all other things being equal, wealthier cities generated slightly lower revenues. This was unexpected, and could stem from the poor quality and/or poor cross-border comparability of the data. It may also be due to the fact that in North America differences in city-by-city income are relatively small in the context of global income disparities because both Canada and the US are high-income countries. We know that Calgary has a slightly higher median income than Montreal, and Chicago is somewhat wealthier than Detroit, but the effect of these differences in income on team gate revenues appears to be nil. What matters is population and geographic location.
We therefore present the simplest model possible: a prediction of a team’s gate revenues based on the size of the market and whether the city is in Canada or not. Taken together, being a larger city and being in Canada tell most of the story about whether a team can generate revenues. On their own, being large (e.g. Los Angeles) or in Canada (e.g. Edmonton) appears to be sufficient to make an NHL team viable. But if a market is both large and in Canada (Toronto and Montreal), the team’s gate revenues will be enormous.
The regression found, not surprisingly, that the population of a market is a key factor determining its potential to generate gate revenues (see Appendix 1 for results). The NHL is an attendance-based league, with the bulk of revenues derived from fan attendance at games. This explains why a larger market such as Toronto can generate higher revenues than a smaller city such as Ottawa, and why giant New York City is a better hockey market than tiny Buffalo. Although this may seem obvious, in leagues with significant national TV contracts and more elaborate revenue sharing arrangements, large markets do not have as much of an advantage over small markets, since arena revenues are a much smaller share of total revenues.
In the NHL, all other things being equal, a team in a city with a population of 2 million can expect gate receipts of

16 Mowat Centre for Policy Innovation
approximately $2 million higher than a city with a population of 1 million. A city of 3 million can expect revenues of $4 million higher. All other things being equal, each additional 1 million in population is likely to result in an additional $2 million in gate revenue.
Additional population is also likely to lead to more revenue from other local sources: in-arena revenues, advertising, local TV revenues, etc. However, we do not have enough data to precisely measure these other revenue sources.
Being Canadian is even more important than size. Compared to the average city in the US, we estimate that being in Canada provides an additional $23 million in gate revenues, when controlling for the size of the city.
On the surface, this seems enormous, but in fact it is evident even from a simple examination of the average revenues of Canadian teams when compared to American ones. The average gate revenue for the six Canadian teams was about $63 million, while the average gate for the 24 American teams was about $35 million. This is a difference of $28 million, despite the fact that three of the four smallest NHL markets are Canadian.
Our regression analysis and resulting model are rough. (For more details on methodology and results, please see Appendix 1). The comparability of data between Canada and the US is imperfect. For example, a market’s size can be measured in a variety of ways, and metro areas can be defined differently for different purposes. The US Census and Statistics Canada use different definitions, and we have made adjustments to make them as comparable as possible. We also recognize that additional factors can influence a team’s gate revenues, such as a winning or losing record, making the playoffs, etc., and we have not controlled for these. And the small number of cases means that one or two outliers can throw off the results. But the combination of size and geographical location explain a great deal of a city’s likelihood to successfully host an NHL franchise and the resulting model, while imperfect, provides a solid foundation for concluding that Canada can support significantly more teams.
COMPARED TO THE AVERAGE NHL CITY IN THE US, WE ESTIMATE THAT BEING IN CANADA PROVIDES A TEAM WITH AN ADDITIONAL $23 MILLION IN GATE REVENUES, WHEN CONTROLLING FOR THE SIzE OF THE CITY.
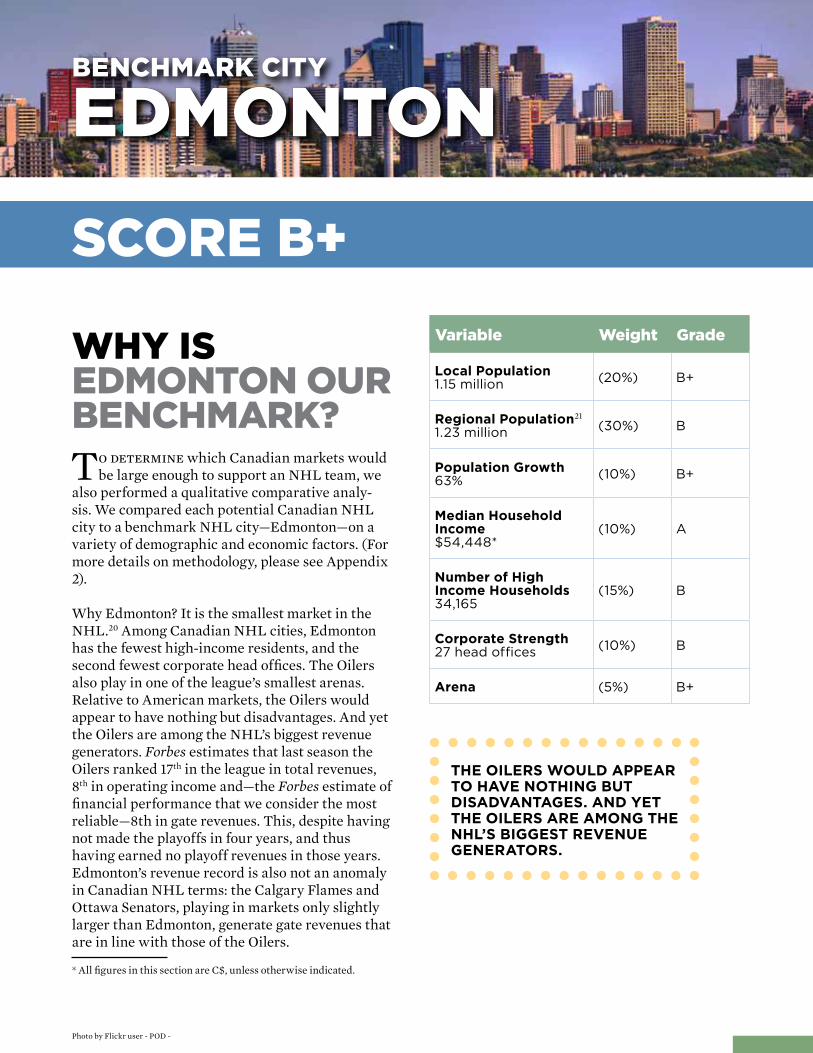
Photo by Flickr user - POD -
benChmaRk CiTY
edmonTon
variable weight grade
Local Population1.15 million (20%) B+
Regional Population21
1.23 million (30%) B
Population Growth63% (10%) B+
Median Household Income$54,448*
(10%) A
Number of High Income Households34,165
(15%) B
Corporate Strength27 head offices (10%) B
Arena (5%) B+
sCoRe b+
whY isedmonTon ouR benChmaRk?
To determine which Canadian markets would be large enough to support an NHL team, we
also performed a qualitative comparative analy-sis. We compared each potential Canadian NHL city to a benchmark NHL city—Edmonton—on a variety of demographic and economic factors. (For more details on methodology, please see Appendix 2).
Why Edmonton? It is the smallest market in the NHL.20 Among Canadian NHL cities, Edmonton has the fewest high-income residents, and the second fewest corporate head offices. The Oilers also play in one of the league’s smallest arenas. Relative to American markets, the Oilers would appear to have nothing but disadvantages. And yet the Oilers are among the NHL’s biggest revenue generators. Forbes estimates that last season the Oilers ranked 17th in the league in total revenues, 8th in operating income and—the Forbes estimate of financial performance that we consider the most reliable—8th in gate revenues. This, despite having not made the playoffs in four years, and thus having earned no playoff revenues in those years. Edmonton’s revenue record is also not an anomaly in Canadian NHL terms: the Calgary Flames and Ottawa Senators, playing in markets only slightly larger than Edmonton, generate gate revenues that are in line with those of the Oilers.1
* All figures in this section are C$, unless otherwise indicated.
THE OILERS WOULD APPEAR TO HAVE NOTHING BUT DISADVANTAGES. AND YET THE OILERS ARE AMONG THE NHL’S BIGGEST REVENUE GENERATORS.

18 Mowat Centre for Policy Innovation
sCoReCaRd on Canadian CiTies
We find that the megalopolis centered on Toronto and known as the Greater Golden Horseshoe is the best loca-
tion in North America for a new NHL team. This fast-growing group of cities and suburbs covers a semi-circle within roughly 120 km of downtown Toronto. From the Greater Toronto Area (GTA) it stretches to Barrie in the north, Peterborough to the east and Hamilton, Niagara and Waterloo region to the west. It contains more than one-quarter of the Canadian population. If you were considering bringing another NHL team to Canada, this is the first place where you would look—which is why Jim Balsillie has on three occasions tried to buy an American NHL team and move it to Hamilton, on the Western end of the Horseshoe.
The Golden Horseshoe should be able to support three NHL teams. The region has nearly 9 million people, and in 20 years it will have more than 12 million.22 Since 2001, it has added more than a million residents, and it will repeat the performance in the next decade. That’s equivalent to adding the population of Manitoba, every ten years. It is likely the world’s largest hockey market, yet it currently has only one NHL franchise. Artificially constrained supply combined with exceptionally high local demand means that the Maple Leafs are able to sell out games, year after year, while charging what are by far the league’s highest ticket prices.
The Golden Horseshoe is growing very quickly, faster than almost anywhere else in Canada, but that growth is not evenly distributed. Nearly all of the region’s growth is taking place near the centre, where most of the people, money and head of-fices already are: the Greater Toronto Area (GTA). And most of the GTA’s growth is taking place in suburban Durham, Halton Peel and York regions, with the last two each already having more than 1 million residents. All of these reasons suggest that, despite the presence of the Leafs, Toronto or its suburbs would be the single best location for a new NHL franchise.
We also find that second teams should be successful in both Montreal and Vancouver. And in addition to a second team in the GTA, a third Southern Ontario team would be highly viable in either Hamilton, Kitchener-Waterloo or London. Winnipeg and Quebec City, the places most often named when the subject of Sun Belt teams returning to Canada is raised, could be good

19Why Canada Can Support 12 Teams
NHL cities. They would almost certainly generate more local revenues than the average Sun Belt team. However, given that several other Canadian cities are much larger and richer, if the NHL were a free market, with entrepreneurs free to create or move teams to where demand is strongest, Winnipeg would probably not be the preferred destination for the Phoenix Coyotes.
Fan demand is strong enough to support second teams in Toronto, Montreal and Vancouver—but likely not a second privately-owned, NHL-sized arena in each of those cities. But that’s a problem that can be solved. It has been before.
In the early 1990s, the Toronto Raptors’ original owners started construction of the Air Canada Centre, at a time when Toronto already had one major arena: the Leafs’-owned Maple Leaf Gar-dens. The Raptors and their ACC were eventually bought out by MLSE, but for a time MLSE was looking at building its own replacement for Maple Leaf Gardens, which would have given Toronto two privately-owned, competing, big league arenas.
The buyout of the Raptors and the consolidation of two teams in one building was the most rational business decision for all parties, reducing construction and carrying costs by half, and almost certainly raising rental rates for outside concerts and other events, since the market now has only one big arena, rather than two competing buildings. The Raptors and their arena came to Toronto as business partners of the Leafs, not competitors. MLSE doubled the number of major league tenants without doubling the number of arenas, thereby increasing the profitability of the building, and that of both teams.
A replay of the Leafs’ partnership with the Raptors, and the maintenance of a one-arena city, would almost certainly be the best way, and perhaps the only way, for a second NHL team to come to Toronto, Vancouver or Montreal. If a second Toronto-area NHL team were to consider building an 18,000 seat arena, as the Raptors once did, threatening to seriously undercut the profitability of both the Leafs and the Air Canada Centre, MLSE’s best bet would be to turn threat into opportunity. It could seek to develop an arena partnership with the Newcom-ers or even seek to own the second franchise, although that is not currently permitted in the NHL. The Newcomers and the Leafs could then both play in the Air Canada Centre, reducing one another’s costs. Both teams would benefit. The approach has been used by a number of competing teams in multi-team cities. For example, New York’s two NFL teams shared Giant Stadium for years, and they are now 50-50 partners in the New Meadowlands Stadium. In Los Angeles, two NBA teams share the Staples Center—and the NHL’s L.A. Kings also call Staples home, which could be a model for a second team in Toronto.

gReaTeR ToRonTo aRea
sCoRe: aToa+
9.4/10Despite the size and wealth of the Toronto market, and the fact the Leafs consistently pull in
league-beating revenues, there remain barriers to the satisfaction of Toronto’s enormous fan demand.
A team moving into the Toronto Maple Leafs exclusive 50 mile zone, if the league allowed it, would almost certainly be required by the NHL to pay an indemnity to the Leafs. That indemnity, assuming it is legal under Canadian law, would likely be substantial.
And then there is the question of where the new Toronto Newcomers franchise would play: the MLSE-owned Air Canada Centre is the only NHL-sized arena in the GTA. That is a situation that is unlikely to change, absent a substantial government subsidy to build and maintain a new arena—which we do not support.
Both of these problems would be solved, however, if the ownership-group behind the Leafs were permit-ted to own the new Toronto franchise—though the NHL has traditionally frowned on one owner owning multiple teams—or if it was otherwise in their interest to allow a second NHL team to play in their build-ing. The ACC is already one of the busiest and most successful arenas in the world; having three major league tenants—the NBA Raptors, the Leafs and the Toronto Newcomers—would dramatically increase the building’s profitability. For MLSE, a second team in the Toronto-area is a threat, but also an opportunity.
loCal populaTion: a+6.1 million/2 = 3.05 million
The GTA has 6.1 million people, making it by far the largest urban area in Canada.23 Even dividing that population in half to take account of a second NHL team yields a local population of just over 3 million for each team. That is more than two and a half times the population of Edmonton, and almost as many people as Montreal, whose Canadiens have the league’s second highest revenues.
Photo by Flickr user James D. Schwartz
Regional populaTion: a+8.9 million/2 = 4.45 million24 or (3 teams) 3.45 million
If we assume only one new NHL team located in Southern Ontario, the regional population that the Leafs and the Toronto Newcomers could draw on would be almost 9 million. Even di-vided in half to account for the presence of two teams, that population is nearly four times the size of the Edmonton market, and slightly larger than the Montreal market.
Even assuming three NHL franchises in South-ern Ontario—two in the GTA and one to the west of the GTA—the two Toronto teams would each be more than viable. The Golden Horse-shoe, less residents living west of the GTA, is a

21Why Canada Can Support 12 Teams
market of 6.9 million people. Divided in two to account for the presence of two Toronto teams yields a population that is bigger than Vancou-ver, more than three time the size of the Edmon-ton market, and four times the population of the Winnipeg region.
populaTion gRowTh: a+89%
Between 2001 to 2031, Statistics Canada expects the Toronto Census Metropolitan Area (CMA) population to grow by 89 per cent. Among major cities, that is second only to Calgary’s expected population increase of nearly 100 per cent. Most of the Toronto area’s growth is in the suburban 905 region. Over the next 25 years, the 905 region is expected to gain 2.4 million people—equivalent to the population of Vancouver, or Edmonton and Calgary combined.25
median afTeR-TaX household inCome: a $55,313
That is high by Canadian standards, and just slightly above Edmonton median income.
high-inCome households: a+ 216,225
Even assuming three teams in Southern Ontario, and counting only Golden Horseshoe residents living to the east of Hamilton, Toronto has 216,255 high income households.26 That is 15 times as many wealthy families as Winnipeg or Quebec City, six times as many as Edmonton, and three times more than Vancouver or Montreal.
CoRpoRaTe sTRengTh: a+369 head offices
As on the previous measures, Toronto is in a league of its own. More than 40 per cent of the country’s largest companies are headquartered in the Golden Horseshoe, nearly all of them in the GTA.
aRena: f oR a+
Other than the MLSE-owned Air Canada Cen-tre, home of the Leafs, there is no arena in the GTA that is even close to being large enough for the NHL. Given that Canadian governments, unlike their American peers, are unlikely to build an arena for the Toronto Newcomers, this would seem to be a significant impediment.
But as noted above, the Leafs faced the same dilemma when the NBA Raptors first arrived, and threatened to build their own arena. If the NHL agreed to allow MLSE to own a second NHL team, or if MLSE was to sell the Toronto Newcomers a share in the Air Canada Centre or find some other way of allowing them to play in the building, the only economic impediment to a second Toronto NHL franchise would be removed.
NExT: hamilTon

hamilTon
sCoRe: a-
9.4/10Hamilton is the place most often mentioned as the site for a new team in Southern Ontario. Even
though it is a relatively small city, its location on the western end of the Horseshoe means that it is surrounded by larger population centres. Eight million Canadians—the equivalent of the combined popu-lation of Alberta and BC—live within an hour’s drive of Hamilton. What is more, Hamilton’s Copps Coli-seum, though lacking in some income-generating amenities, is the only NHL-sized arena between Toronto and Detroit. That explains why, over the years, there have been at least a dozen attempts to bring a team to the city. The Calgary Flames, New York Islanders, St. Louis Blues and Edmonton Oilers have all at one time or another threatened a move to Hamilton, as a tactic for wringing financial concessions out of their home city’s government.27 Jim Balsillie has on three occasions tried to buy a US-based NHL team and move it to Hamilton.
Copps Coliseum is 70km from Toronto’s Air Canada Centre, and thus within the 50 mile (approximately 80 km) zone that the NHL uses to determine a team’s market. And even though Copps Coliseum is more than 50 miles from the Buffalo Sabres HSBC Arena, a team in Hamilton would pose a threat to the Buffalo Sabres, a struggling franchise dependent on Southern Ontario fans: the Sabres report that Canadians coming to their games are responsible for approximately 100,000 border crossings per year.28
loCal populaTion: b+1.2 million
The Hamilton CMA has three quarters of a mil-lion people, as many as Winnipeg or Quebec City. Including as local population the two urban areas immediately adjacent to Hamilton CMA—Brantford to the west, and Oakville to the east—Hamilton’s local population rises to 1.2 million, the same size as Edmonton.
Photo by Flickr user Kreative Eye - Dean McCoy
Regional populaTion: a+3.8 million to 3.2 million
Assuming only two NHL teams in Southern Ontario, a franchise in Hamilton would have a regional market conservatively estimated at 3.8 million people—a population base smaller only than that of the Maple Leafs and Canadiens. A more ambitious estimate, assuming the divi-sion of Southern Ontario among the Leafs and Hamilton New Team, would give a market of 4.8 million.29
Even assuming three teams in Southern On-tario—one in Hamilton and two in the GTA—a Hamilton team would serve a market of 3.2 million people, or nearly three times as large as Edmonton.30

23Why Canada Can Support 12 Teams
populaTion gRowTh: b40%
The Hamilton CMA’s expected population growth between 2001 and 2031 is 40 per cent. The Waterloo region and Halton are growing faster, but other areas that would fall within a Hamilton team’s market, such as Niagara, London and Brantford, are growing more slowly.
median afTeR-TaX household inCome: a-$51,936
high-inCome households: a+ 79,000 to 97,000
Even assuming three NHL teams in Southern Ontario, the Hamilton market would have more than twice as many high-income families as Edmonton. Assuming only two Southern Ontario teams, Hamilton’s region would include more than 97,000 upper income households, or three times as many as Edmonton.
CoRpoRaTe sTRengTh: b+37 head offices
The city of Hamilton itself has no FP500 head offices. However, when head offices in the nearby Waterloo region, Niagara peninsula, Brantford, Burlington and Oakville are included, the Hamilton market has 37 major company head offices—a third more than Edmonton. This is a very conservative count given that it includes no GTA head offices.
aRena: b
Other than the ACC, Copps Coliseum is the only NHL-sized arena between Detroit and Ottawa. It can hold more people than Edmonton’s Rexall Place. However, Copps is not fully up to date in terms of luxury boxes and other revenue-maximizing amenities. In 2009, Jim Balsillie proposed upgrading Copps, at a cost of $150 million—less than half the cost of building a new arena from scratch.
NExT: monTReal

monTReal
sCoRe: a-
9.4/10The Canadiens are the second highest revenue-generator in the league, just behind the Leafs—and
with revenues nearly double those of the Edmonton Oilers. They play in the league’s biggest arena, and sell it out consistently. Montreal is not growing as quickly as Toronto, nor is it as wealthy a city, but it is still Canada’s second largest metropolitan area by a wide margin. It could likely support a second NHL team, as it did back in the 1920s and 30s, when the Canadiens and Montreal Maroons shared the Forum.
As with Toronto and Vancouver, the economics of a second team come down to the arena. A second arena in the Montreal area is unlikely to be viable (absent a massive public subsidy, of course, which can make anything viable). But if two NHL teams played at the Canadiens-owned Bell Centre, it would reduce both of their costs, and boost both of their bottom lines.
loCal populaTion: a3.8 million/2 = 1.9 million
Even divided in half to account for the presence of a second team, Montreal’s population is 50 per cent larger than Edmonton, and nearly triple Winnipeg or Quebec City.
Regional populaTion: a+4.8 million/2 = 2.4 million31
Montreal’s regional population is four times the size of the Edmonton market, or double when divided in half to account for two NHL teams.
populaTion gRowTh: b45%
Montreal is not a fast growing city like Toronto or Calgary, but its growth rate is well above the Ca-nadian average, and ahead of Canada’s smaller and mid-sized cities.
Photo by Flickr user andl611
median afTeR-TaX household inCome: b-$41,462 (lowest income of any city studied)
high-inCome households: b 73,570/2 = 36,770
Even divided in half to account for the presence of two NHL teams, the market would still have slightly more high income households than Ed-monton. Nevertheless, there is far less wealth in Montreal than in Southern Ontario.
CoRpoRaTe sTRengTh: a-130/2 = 65 head offices
Even divided in two to account for the presence of two NHL teams, the market still has more than twice as many head offices as Edmonton.
aRena: f oR a+
If the new team can play at the Bell Centre, it will be playing in the largest building in the NHL.

kiTCheneR-waTeRloo
sCoRe: b+
9.4/10The region on the far western edge of the Horseshoe has nearly as many people as Winnipeg or Que-
bec City and is growing quickly. By 2031, the combined population of Waterloo and Wellington coun-ties will exceed 1 million, or more than Quebec City or Winnipeg. And the regional population within an hour’s drive is much larger. The disadvantage of Kitchener-Waterloo is that it is located on the western edge of the Horseshoe. It is a good site, but not as good as Hamilton.
However, KW’s location does have the advantage of lying more than 50 miles from both the ACC and Buffalo’s HSBC Arena—outside of an NHL club’s exclusive zone. This may explain why, when TSN inter-viewed him last year on the subject of Southern Ontario expansion, NHL Commissioner Gary Bettman was cold on the idea of Hamilton, but mentioned KW as a site worth studying.
loCal populaTion: b-650,000
Regional populaTion: a2.9 million32
Even assuming three teams in Southern Ontario, with two in the GTA, and assuming that a KW team would draw almost zero fans from the GTA, a team in KW would have a regional population of 2.9 mil-lion. That is larger than the Vancouver market, and more than double the size of the Edmonton market. However, we discount slightly for the fact that a high percentage of those people live at the very edge of the catchment area.
populaTion gRowTh: b45%
Population growth is slower than Edmonton, and much slower than Toronto, but faster than most cities we studied.
median afTeR-TaX household inCome: a$54,715
The CMA’s median after-tax household income in 2005 was slightly above both Toronto and Edmonton.
high-inCome households: a- 67,572
A team based in KW would be able to draw on far fewer high income supporters than teams in Toronto—but the market would still have twice as many high earners as Edmonton, and five times as many as Winnipeg or Quebec City.
Photo by Flickr user Sean_Marshall

26 Mowat Centre for Policy Innovation
CoRpoRaTe sTRengTh: b37 head offices
KW has 37 head offices—more than the number in Edmonton. However, all of Edmonton’s HQs are in the city, while many of the head offices that we count as being in KW’s region are located on the periphery of the market, in communities having no particular economic connection to KW.
aRena: f
No viable arena.
NExT: vanCouveR

vanCouveR
sCoRe: bTob+
9.4/10The key to a second team in Vancouver, as in Toronto and Montreal, is the arena: there likely is not
enough demand on non-hockey nights to warrant the construction of a second NHL-sized arena in the city (or the expansion/renovation of the old Pacific Coliseum). But if both teams were to play at the Canucks home, the Rogers Arena, the economics of a second team appear to be attractive.
loCal populaTion: b+2.3 million/2 = 1.15 million
Even divided in two to account for the presence of two teams, Vancouver would have the same local population as Edmonton.
Regional populaTion: b2.6 million33/2 = 1.3 million
Divided in two to account for the presence of two teams, Vancouver’s regional market is the same size as Edmonton.
populaTion gRowTh: a-75%
Vancouver is growing faster than Edmonton and faster than any other Canadian city except Toronto and Calgary.
median afTeR-TaX household inCome: b+$48,527
high-inCome households: b 65,635/2 = 32,818
Even after dividing by two to account for a sec-ond team, Vancouver has as many high-income households as Edmonton.
CoRpoRaTe sTRengTh: b+87/2 = 48.5 head offices
Vancouver has the fourth highest tally of head offices, after Toronto, Calgary and Montreal. It also has more than three times as many head offices as Edmonton.
aRena: f oR a+
As with second teams in Toronto or Montreal, the score here depends on whether a second Vancouver team could play at the Rogers Are-na. It would be in the interest of the Canucks ownership to own the second NHL team, or to partner with it, to prevent a second franchise from constructing a competing arena that would undermine the profitability of both teams.
Photo by Flickr user lassi.kurkijarvi

london
sCoRe: b
9.4/10London is the sleeper candidate in our study, scoring surprisingly well. The city of London is small,
but the number of people living within a one hour drive is much larger than Edmonton, Winnipeg or Quebec City. However, most of those people live on the edge of the market’s 120 km zone.
London’s excellent score comes with a very large caveat: if an NHL team were located in Hamilton or Kitchener-Waterloo, then the case for London fails, because most of the people and wealth counted below as part of the London market reside in or near Hamilton and KW.
loCal populaTion: C+489,000
Regional populaTion: a-2.3 million34
The population of all counties and cities within roughly 120 km of London is 2.3 million. That is nearly double the size of the Edmonton market, though we discount for the fact that most of those potential London fans live at the outer edge of the 120 km zone.
populaTion gRowTh: b-27%
London’s growth rate is well below Edmonton or Toronto but comparable to Winnipeg and far ahead of Quebec City.
median afTeR-TaX household inCome: b+ $48,293
Photo by Flickr user haljackey
high-inCome households: b 51,265
Assuming no NHL team in Hamilton or Waterloo, the London catchment area would include a larger popula-tion of high-income households than Edmonton. Most of those people would, however, live on the edge of the region, far from London.
CoRpoRaTe sTRengTh: b-16 head offices
Only one major company has its HQ in London. Lon-don’s score improves after including companies head-quartered within its region. However, London’s total is more than a third below Edmonton, and behind both Quebec City and Winnipeg.
aRena: C-
The John Labatt Centre is a modern venue and the biggest arena between Hamilton and Detroit. With fewer than 10,000 seats, it is nowhere near big enough for the NHL—but we award points for the fact that, in concert and event attendance as measured by Pollstar, it consistently outdraws Hamilton’s Copps, showing the strength of the market and the fact that there may be advantages to being far from Toronto. In 2009, the Labatt Centre had more concert and event attendees than NHL arenas in Denver, Boston, Pittsburgh, Phoe-nix, Calgary, Columbus and Chicago.

winnipeg
sCoRe: b-
9.4/10Winnipeg’s MTS Centre is NHL ready. It is a modern building, newer than Edmonton’s Rexall
Place but slightly smaller, and probably the right size for a smaller market. At 15,000 seats, it would be the smallest building in the league—but if the New Jets could sell it out, and do so at ticket prices compa-rable to Edmonton or Ottawa, the team would enjoy greater ticket revenues than most American NHL teams.
Last season, seven out of 24 American NHL teams had average attendance of less than the MTS Centre’s capacity; so far in 2010-11, one-third of American teams report attendance of fewer than 15,000 per game, and at ticket prices well below the Canadian average. The owners of the Florida Panthers recently cur-tained off more than 2,000 seats in their perennially undersold arena, reducing capacity in a building the team president described as “too big.” The team said it hoped to bring back the “intimate” atmosphere of its former arena—which seated fewer than 15,000.35
loCal populaTion: b742,000
Winnipeg is a third smaller than Edmonton.
Regional populaTion: b-900,000
There are no other major cities close to Winnipeg. Counting everyone within roughly 120kms of Win-nipeg yields a population of less than a million.36
populaTion gRowTh: b-31%
Winnipeg’s population growth from 2001 to 2031 is considerably slower than Edmonton, but faster than Quebec City.
median afTeR-TaX household inCome: b$44,049
This is markedly lower than Edmonton. Winnipeg has one of the lowest median incomes among cities studied.
high-inCome households: C 12,255
That is barely one third of Edmonton’s total—and one-eighteenth as many as the Toronto market. Winnipeg, however, has considerably more high-income residents than Halifax or Saskatoon.
CoRpoRaTe sTRengTh: b33 head offices
Winnipeg has slightly more head offices than Edmonton. It also has more head offices than Halifax and Saskatoon combined, and 50 per cent more than Quebec City. However, Winni-peg has only one-eleventh the number of head offices in the Golden Horseshoe.
aRena: b
The MTS Centre, built at one third the cost of the proposed new arena in Quebec City, will be the smallest facility in the league—but one-third of US NHL teams record attendance below its 15,000 seat capacity, and at ticket prices below the Canadian average.
Photo by Flickr user Omega Man
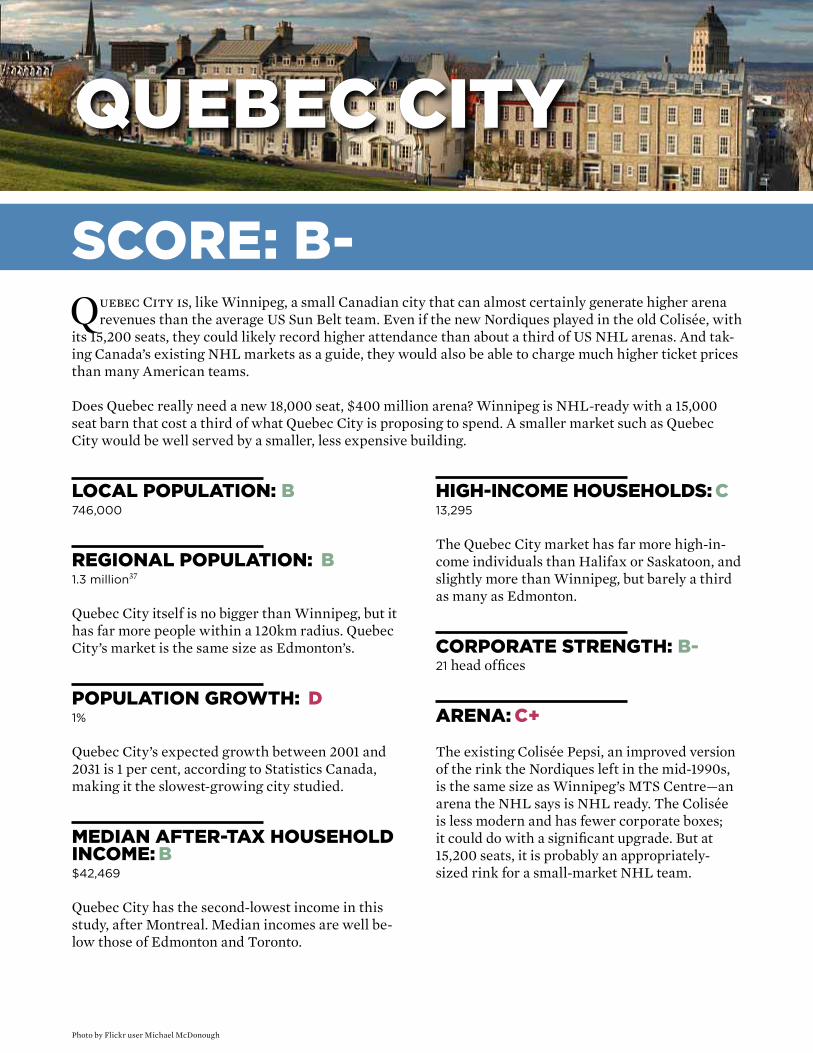
Photo by Flickr user Michael McDonough
QuebeC CiTY
sCoRe: b-
9.4/10Quebec City is, like Winnipeg, a small Canadian city that can almost certainly generate higher arena
revenues than the average US Sun Belt team. Even if the new Nordiques played in the old Colisée, with its 15,200 seats, they could likely record higher attendance than about a third of US NHL arenas. And tak-ing Canada’s existing NHL markets as a guide, they would also be able to charge much higher ticket prices than many American teams.
Does Quebec really need a new 18,000 seat, $400 million arena? Winnipeg is NHL-ready with a 15,000 seat barn that cost a third of what Quebec City is proposing to spend. A smaller market such as Quebec City would be well served by a smaller, less expensive building.
loCal populaTion: b746,000
Regional populaTion: b1.3 million37
Quebec City itself is no bigger than Winnipeg, but it has far more people within a 120km radius. Quebec City’s market is the same size as Edmonton’s.
populaTion gRowTh: d1%
Quebec City’s expected growth between 2001 and 2031 is 1 per cent, according to Statistics Canada, making it the slowest-growing city studied.
median afTeR-TaX household inCome: b$42,469
Quebec City has the second-lowest income in this study, after Montreal. Median incomes are well be-low those of Edmonton and Toronto.
high-inCome households: C 13,295
The Quebec City market has far more high-in-come individuals than Halifax or Saskatoon, and slightly more than Winnipeg, but barely a third as many as Edmonton.
CoRpoRaTe sTRengTh: b-21 head offices
aRena: C+
The existing Colisée Pepsi, an improved version of the rink the Nordiques left in the mid-1990s, is the same size as Winnipeg’s MTS Centre—an arena the NHL says is NHL ready. The Colisée is less modern and has fewer corporate boxes; it could do with a significant upgrade. But at 15,200 seats, it is probably an appropriately-sized rink for a small-market NHL team.

saskaToon
sCoRe: C+
9.4/10A Saskatoon NHL team would have to aim to be like the Green Bay Packers of the NFL: located in a
very small city, but drawing fans from a wider area. The Packers are based in a metro area smaller than Saskatoon, but within a two hour drive are Milwaukee, with more than two million residents, Madi-son with more than half a million, and several cities of more than 100,000. Problem: the entire province of Saskatchewan has only one million people. And the Packers, like the rest of the NFL, and unlike NHL teams, get the bulk of their revenues from national TV, not local ticket sales. An NHL team in Saskatoon, in contrast, would be overwhelmingly dependent on revenues generated in its local market.
Saskatoon may have extremely dedicated hockey fans, but it probably does not have enough of them to support an NHL team.
loCal populaTion: C257,00038
Regional populaTion: C400,00039
Saskatoon is the smallest market in our study. There are no other significant population centres nearby. Re-gina’s quarter million people are nearly 300 km away.
populaTion gRowTh: C16%
According to Statistics Canada, Saskatoon’s actual and estimated growth from 2001 to 2031 will be 16 per cent. That is well behind all major Canadian cities except Quebec City. However, Statistics Canada’s figures post-2009 are only estimates—and Saskatoon has recently grown so rapidly that it has already nearly reached the 2031 projection.
median afTeR-TaX household inCome: a$55,908
Saskatoon’s median household income is slightly higher than Edmonton or Toronto, and well ahead of Winnipeg, London, Halifax and Quebec City.
high-inCome households: C-4,895
Saskatoon has the smallest number of high-income households of any of the cities studied: a third as many as Winnipeg or Quebec City, a sev-enth as many as Edmonton—and about one-sixti-eth the number in the Greater Golden Horseshoe.
CoRpoRaTe sTRengTh: C+10 head offices
Saskatoon has the fewest head offices of any city measured.
aRena: C+
The Credit Union Centre seats just over 15,000, or as many as Winnipeg’s MTS Centre. It is less modern than Winnipeg’s building, but it is not too small for a small-market NHL team: as with Quebec’s Colisée Pepsi, there are many US NHL buildings that consistently record lower at-tendance than the capacity of the Credit Union Centre, and do so at ticket prices well below those of Canada’s NHL teams.
Photo by Flickr user nickweinrauch
halifaX
sCoRe: C
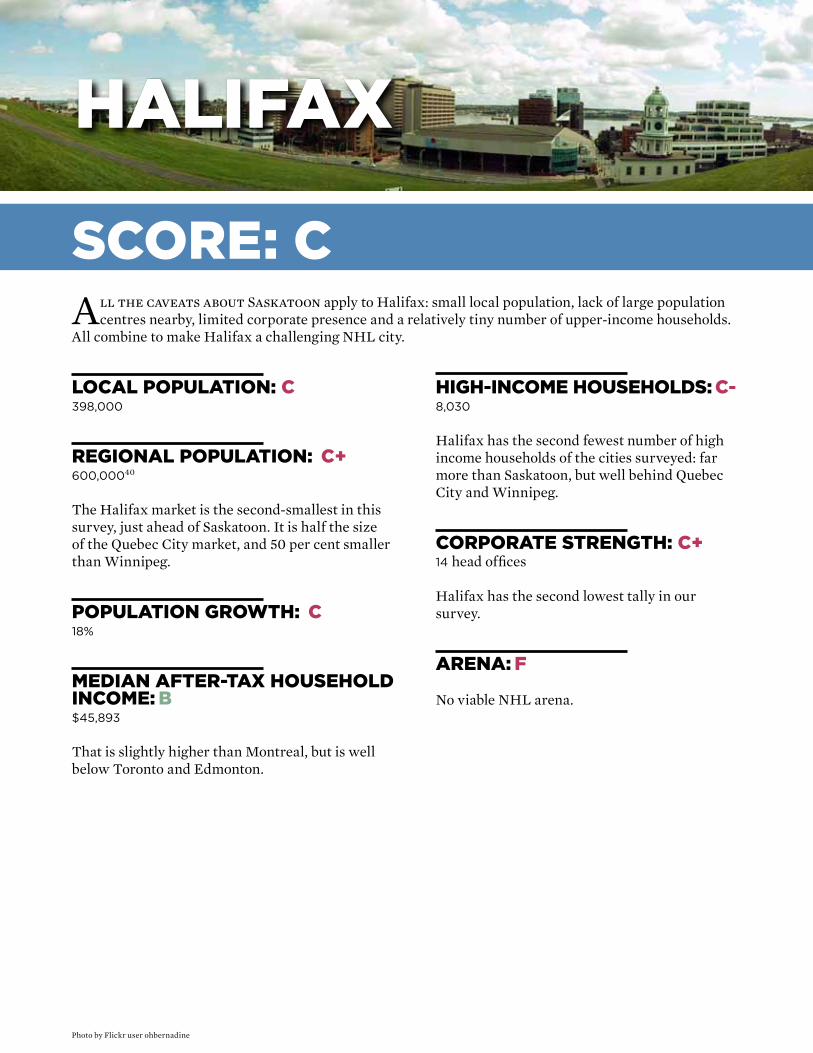
9.4/10All the caveats about Saskatoon apply to Halifax: small local population, lack of large population
centres nearby, limited corporate presence and a relatively tiny number of upper-income households. All combine to make Halifax a challenging NHL city.
loCal populaTion: C398,000
Regional populaTion: C+600,00040
The Halifax market is the second-smallest in this survey, just ahead of Saskatoon. It is half the size of the Quebec City market, and 50 per cent smaller than Winnipeg.
populaTion gRowTh: C18%
median afTeR-TaX household inCome: b$45,893
That is slightly higher than Montreal, but is well below Toronto and Edmonton.
Photo by Flickr user ohbernadine
high-inCome households: C- 8,030
Halifax has the second fewest number of high income households of the cities surveyed: far more than Saskatoon, but well behind Quebec City and Winnipeg.
CoRpoRaTe sTRengTh: C+14 head offices
Halifax has the second lowest tally in our survey.
aRena: f
No viable NHL arena.

33Why Canada Can Support 12 Teams
Can one CiTY suppoRT Two nhl Teams? a global peRspeCTive
Could Toronto, Montreal and Vancouver each support two NHL teams? Could the Greater Golden Horseshoe
support three? The answer is yes. Surprisingly, these ques-tions—and the answers—have been systematically ignored by the NHL.
In other leagues, multi-team cities are not unusual. They are not even unusual in the NHL. They are simply unusual for the NHL in Canada. The Los Angeles area has two NHL teams; the New York City area has three. Given the evidence of the exceptionally high level of demand in Canada, the fact that L.A. has two NHL teams and Toronto has but one is absurd, and an indication that the NHL is deliberately restricting the supply of professional hockey in Canada.
The NBA, MLB and NFL all have cities with multiple teams. Major League Baseball has two teams each in Chicago, Los Angeles, the San Francisco Bay Area and New York. New York’s two NFL teams share a stadium. L.A.’s two basketball teams share an arena. In fact, the L.A. market may be on the verge of gaining a third NBA team, with the Sacramento Kings planning a move to the Honda Center in Anaheim.
The most extreme case of team concentration may be the Eng-lish Premier Football League, one of the world’s most successful sports leagues, with a huge international TV followership. The league has 20 teams, 18 of which are located in or close to just five major metropolitan areas. There are five teams in London, five in Manchester and environs, four in or near Birmingham, two in greater Newscastle and two in Liverpool.
The structure of the English Premiership largely reflects the distribution of that country’s population, which is, like Canada’s, highly concentrated in a handful of urban centres. Fourteen million people, or roughly one quarter of the English population live in greater London. The Golden Horseshoe similarly has more than one quarter of the Canadian population. Nearly half of all Canadians live in just three mega regions: Greater Montreal, Greater Vancouver and the Golden Horseshoe.
Having two or more teams in close proximity can divide the fan base, but it can also multiply it, by creating rivalries. NHL fans
THE NBA AND NFL BOTH HAVE CITIES WITH MULTIPLE TEAMS: L.A.’S TWO BASKETBALL TEAMS SHARE AN ARENA; NEW YORK’S TWO NFL TEAMS SHARE A STADIUM. L.A. MAY BE ABOUT TO RECEIVE A THIRD NBA TEAM. MAjOR LEAGUE BASEBALL HAS TWO TEAMS EACH IN CHICAGO, L.A., NEW YORK AND THE SAN FRANCISCO BAY AREA. MULTI-TEAM CITIES ARE NOT EVEN UNUSUAL IN THE NHL: L.A. HAS TWO TEAMS AND NEW YORK HAS THREE. THEY ARE SIMPLY UNUSUAL FOR THE NHL IN CANADA.

34 Mowat Centre for Policy Innovation
are, after all, not just going to watch an exhibition of hockey skill. They are going to watch a competition, in whose outcome they are invested.
The NHL had strong local rivalries in the past, such the “Battle of Quebec.” During the 1980s and early ‘90s, the rivalry be-tween the Quebec Nordiques and the Montreal Canadiens con-sumed the province and boosted interest in both teams. That fan interest remains: one of the top-rated programs on French-language television in 2009-10 was “La Série Montréal-Québec,” a reality TV show based on the old Nordiques-Canadiens feud, in which two teams of non-professional hockey players battled it out, wearing the colours of the respective cities, trying to recapture the rivalry. A similar rivalry continues between the Edmonton Oilers and Calgary Flames, the so-called Battle of Alberta.
Teams in the English premiership, as well as other European soccer leagues, enjoy exceptionally intense (and profitable) rivalries, some stretching back more than a century. In base-ball, New York has been the site of numerous “subway series” playoffs, involving the Yankees, the Mets, the former Brooklyn Dodgers and the former New York Giants. In 2000, the Yankees and Mets met in a subway series World Series. And since the introduction of interleague play in the 1990s, regular season games between the Yankees and Mets are similarly anticipated as a subway series.
THE DISTANCE FROM L.A.’S STAPLES CENTER, HOME OF THE KINGS, TO THE HONDA CENTER, HOME OF THE DUCKS, IS LESS THAN THE DISTANCE FROM HAMILTON’S COPPS COLISEUM TO TORONTO’S ACC. THE HOME ARENAS OF THE DEVILS AND ISLANDERS ARE SIMILARLY CLOSER TO THE RANGERS’ MADISON SQUARE GARDEN THAN HAMILTON IS TO DOWNTOWN TORONTO.
figuRe 4The nhl is an aTTendanCe leagueAccording to the Levitt Report, prepared for the league in 2004, three-quarters of league revenues come from ticket sales and other arena activities. What is more, a significant percentage of broadcasting revenues come from local TV contracts, revenues that remain in the local market and are not shared with other teams.
Source: The Levitt Report, data for 2002-03. Includes pre-season, regular season and playoffs. Note: Figures do not sum to 100% due to rounding.
Gate receipts52%
In arena revenue
21%
Broadcast & new media
22%
Oth
er 4
%

35Why Canada Can Support 12 Teams
The new eConomiCs of The nhl and The gRowing sTRengTh of Canadian maRkeTs
In the early 1990s, the Winnipeg Jets and Quebec Nordiques were turned into roadkill by factors beyond their control:
rapidly rising player salaries and a falling Canadian dollar. Both imposed significant new costs on Canadian teams. These devel-opments were painful for all Canadian teams, but for Quebec and Winnipeg, the two smallest-market franchises, the trends were fatal.
Both of these factors are addressed by the Collective Bargain-ing Agreement (CBA), and in ways that are game changers for franchises in all markets, large or small.
Just as gate is the most important revenue source for an NHL team, player salaries are its most important expense. Accord-ing to Levitt, in 2002-03, player compensation accounted for 75 per cent of league revenues. Levitt found that, as a result, 19 of 30 NHL franchises were losing money.41 That is why the league forced the 2004-05 lockout that resulted in the signing of the CBA. The CBA imposes a salary cap and floor on all teams, based on total league revenues.
The CBA brought an end to a situation where player salaries were rising faster than league revenues. Under the CBA, player salaries can only rise if league revenues rise.
The CBA means that the players are now partners in the busi-ness. Compensation has become a form of revenue sharing be-tween employees and employers. The more revenue the league brings in, the more players are paid. The average salary can only rise if league revenues rise. Players and owners are more than ever on the same team.42 It is similar to the kind of com-pensation arrangement one might find at an investment bank.
For NHL teams, the CBA’s salary cap means that they are better protected against unexpected salary increases. A league-wide salary explosion of the kind that helped to kill the Jets and Nordiques is only possible if there is a sharp increase in league-wide revenues. That is a significant change to the league’s eco-nomic structure. It is an important protection for all teams, and particularly for those in smaller markets. It provides a degree of stability in an NHL team’s biggest single cost centre.

36 Mowat Centre for Policy Innovation
But Canadian teams in the 1990s were not just harmed by rising sala-ries. They were also run down by a falling Canadian dollar. Canadian NHL teams earn their money in Canadian dollars, but must pay salaries in US dollars. In the 1990s and early 2000s, a falling Canadian dollar meant that the league-wide increase in payroll costs hit hardest for Canadian teams, as their Canadian dollar revenues bought fewer and fewer US dollars. As the Canadian dollar fell, their payroll costs rose.
But over the last half decade the Canadian dollar has risen sharply—turning a problem into a financial advantage. In US dollar terms, team payroll costs have increased 36 per cent over the past 9 years. But in Canadian dollar terms, payroll cost have fallen 5 per cent, saving Cana-dian team owners millions of dollars each year.
Even absent the rise in the Canadian dollar, the CBA would have of-fered Canadian teams some currency protection. The CBA contains what is effectively a built-in, partial currency hedge. Because the league’s salary cap is based on total league-wide, US dollar revenues, and because one-fifth of the league’s teams (and far more than one-fifth of the league’s revenues) are Canadian, the tally of total league revenues is influenced by movements in the Canadian dollar. All other things being equal, the lower the value of the Canadian dollar, the lower total league revenues in US dollars, and the lower the cap. The higher the value of the Canadian dollar, the higher total league US dol-lar revenues, and the higher the cap.
figuRe 5in The 1990s, Rising CosTs killed Canadian TeamsThe combination of rising player salaries and a falling Canadian dollar was too much for two small market Canadian teams. In 1995, the Quebec Nordiques moved to Denver. The next year, the Winnipeg Jets moved to Phoenix.
Source: Financial World MagazineNote: No figures available for 1994-95 due to strike. Nordiques figures for 1995-96 are for the team they became, the Colorado Avalanche.
5m
10m
15m
20m
25m
30m
$35m
Winnipeg Jets C$
Quebec Nordiques C$
1995-961994-951993-941992-931991-921990-911989-90
Payroll

37Why Canada Can Support 12 Teams
The league also created a system of revenue sharing or revenue equalization to assist less financially successful teams. Thus far its beneficiaries have been struggling American franchises. However, the program is limited both in terms of the amount of money transferred, and in terms of eligibility. Franchises must clear a minimum paid attendance hurdle, must be in the bottom half of league earners, and must show that they are steadily increasing their revenues. What is more, franchises located in markets with more than 2.5 million TV households are not eligible for revenue sharing, regardless of financial performance. One-third of the league—teams in New York, Los Angeles, Chicago, Philadelphia, Dallas and San Francisco-San Jose—cannot collect revenue share, regardless of financial performance. Three other US NHL teams are located in markets whose populations could soon cross the 2.5 million threshold: Washington D.C., Boston and Atlanta.43
Limited revenue sharing, combined with the lack of a large US national television contract, means that an NHL team must generate most of its revenues itself, through ticket sales, in-are-na services and advertising, and local media deals. Unlike other major professional leagues, NHL teams are largely dependent on local revenue, generated primarily by putting bums in seats. And local demand is clearly strongest in Canada, making under-served Canadian markets the logical destination for struggling Sun Belt teams.
figuRe 6inCRease in aveRage nhl plaYeR salaRY, 2001-02 To 2009-10In US dollar terms, the average team’s payroll has increased by nearly 40% over the last 10 years. However, thanks to a rising Canadian dollar, Canadian teams, which earn their money in loonies but pay players in US dollars, have seen their payroll costs fall.
60
70
80
90
100
110
120
130
140
150
$C
$US
2009-10
2008-
09
2007-
08
2006-0
7
2005-
06
2004-0
5
2003-
04
2002-
03
2001-
02
2001 = 100
Source: Mowat calculations based on data from USA Today. Note: No data available for 2004-05.
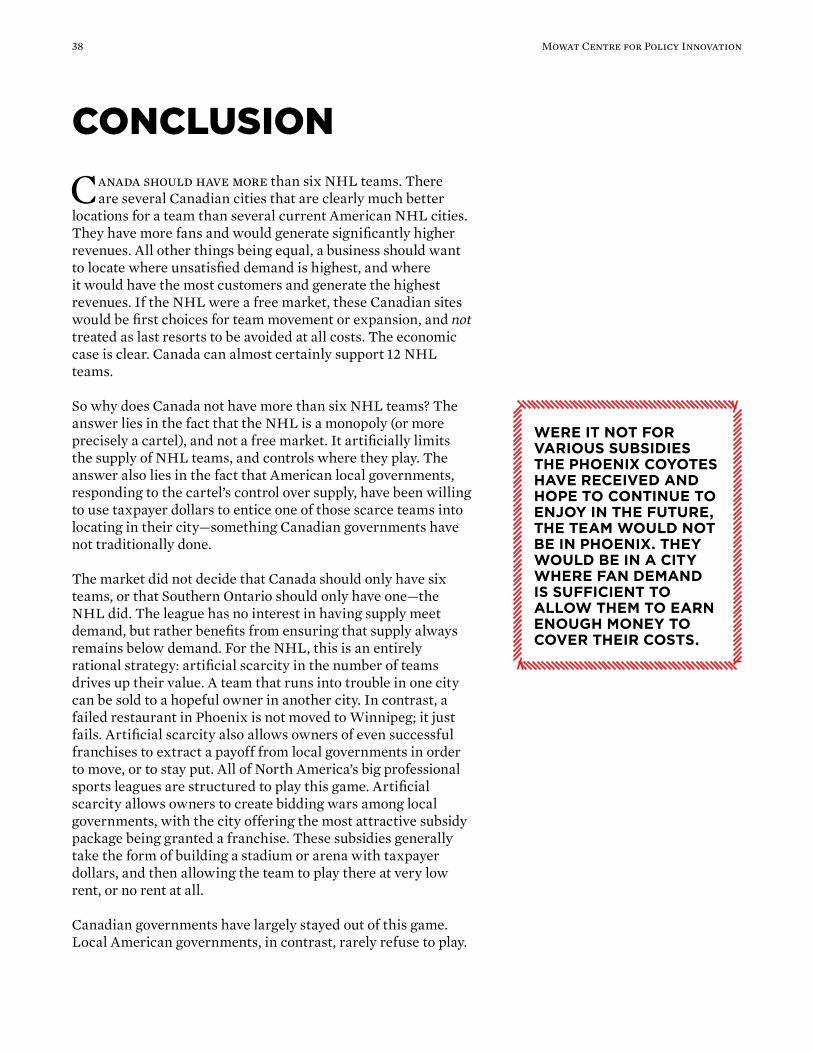
38 Mowat Centre for Policy Innovation
ConClusion
Canada should have more than six NHL teams. There are several Canadian cities that are clearly much better
locations for a team than several current American NHL cities. They have more fans and would generate significantly higher revenues. All other things being equal, a business should want to locate where unsatisfied demand is highest, and where it would have the most customers and generate the highest revenues. If the NHL were a free market, these Canadian sites would be first choices for team movement or expansion, and not treated as last resorts to be avoided at all costs. The economic case is clear. Canada can almost certainly support 12 NHL teams.
So why does Canada not have more than six NHL teams? The answer lies in the fact that the NHL is a monopoly (or more precisely a cartel), and not a free market. It artificially limits the supply of NHL teams, and controls where they play. The answer also lies in the fact that American local governments, responding to the cartel’s control over supply, have been willing to use taxpayer dollars to entice one of those scarce teams into locating in their city—something Canadian governments have not traditionally done.
The market did not decide that Canada should only have six teams, or that Southern Ontario should only have one—the NHL did. The league has no interest in having supply meet demand, but rather benefits from ensuring that supply always remains below demand. For the NHL, this is an entirely rational strategy: artificial scarcity in the number of teams drives up their value. A team that runs into trouble in one city can be sold to a hopeful owner in another city. In contrast, a failed restaurant in Phoenix is not moved to Winnipeg; it just fails. Artificial scarcity also allows owners of even successful franchises to extract a payoff from local governments in order to move, or to stay put. All of North America’s big professional sports leagues are structured to play this game. Artificial scarcity allows owners to create bidding wars among local governments, with the city offering the most attractive subsidy package being granted a franchise. These subsidies generally take the form of building a stadium or arena with taxpayer dollars, and then allowing the team to play there at very low rent, or no rent at all.
Canadian governments have largely stayed out of this game. Local American governments, in contrast, rarely refuse to play.
WERE IT NOT FOR VARIOUS SUBSIDIES THE PHOENIx COYOTES HAVE RECEIVED AND HOPE TO CONTINUE TO ENjOY IN THE FUTURE, THE TEAM WOULD NOT BE IN PHOENIx. THEY WOULD BE IN A CITY WHERE FAN DEMAND IS SUFFICIENT TO ALLOW THEM TO EARN ENOUGH MONEY TO COVER THEIR COSTS.
39Why Canada Can Support 12 Teams
The most egregious recent case is that of the Phoenix Coyotes: as this report goes to press the city of Glendale, in the face of mounting criticism and the possibility of legal challenge under the Arizona constitution, is still trying to borrow more than US$100 million on behalf of the Coyotes, as part of a plan to give the team’s intended buyer a subsidy greater than the team purchase price. Were it not for these subsidies, along with revenue transfers from Canadian fans and taxpayers (the latter via the CBC TV contract), the Coyotes would not be in Phoenix. They would be in a city where fan demand is sufficient to allow them to earn enough money to cover their costs.
The barrier to Canada hosting more NHL teams is not economic. The barrier is legal and political.
This leaves Canadian cities waiting for an NHL team with three options:
• Hope that American taxpayers eventually turn off the subsidy tap.• Join the bidding war, using taxpayer dollars to subsidize billionaire
owners and millionaire players—as Quebec City is preparing to do with the help of the province of Quebec, and as the Oilers owner is demanding of Edmonton.
• Look at legal and political approaches for opening up the NHL monopoly and ending its market-distorting practices.
That last option could involve looking at Canada’s Competition Act. The Act ensures that businesses do not conspire to harm consumers by undermining the free market. Under section 79(1) of the Act, a person, company or group of companies violates the Act if it meets all of the following tests:
a. One or more persons substantially or completely control, throughout Canada or any area thereof, a class or species of business.
b. That person or those persons have engaged in or are engaging in a practice of anti-competitive acts.
c. The practice has had, is having, or is likely to have the effect of preventing or lessening competition substantially in a market.
It is hard to see how the NHL does not meet all of these tests. Yet the Competition Bureau, in a 1997 decision, found that the NHL is not engaged in anti-competitive behavior.44 The Competition Bureau should revisit this analysis as it seems flawed in several respects, which will be the subject of a separate analysis by the authors. In the meantime, the federal government may wish to reconsider revisiting the Competition Act and make it clear that the Act contains no exemption for the NHL or other professional sports. A clarification of the Act would be helpful because, given the interest in relocating teams to Canada, and particularly to Southern Ontario, the Competition Bureau may very well be asked to revisit the matter in the near future. MC

40 Mowat Centre for Policy Innovation
appendiX 1meThodologY and ResulTs of RegRession analYsis
We looked at the estimated revenues for each NHL team, and how they relate to key demographic and economic factors in each city. We then performed a regression analysis to measure how an NHL franchise’s ability to attract fans and generate revenue correlates with the size, wealth and geographic loca-tion of its home city.
A community’s size and its wealth are usually considered the two main factors determining whether it can support an NHL franchise. What is also anecdotally understood is that a city’s geographical location in North America matters. So we added a control variable to determine how much being in Canada helps a team. We excluded wealth from our final estimates due to its poor performance in the model.
Our dependent variable is gate revenues, as per Forbes estimates from “The Business of Hockey 2009.” Our two independent variables were market size, as measured by population and whether the city was in Canada, with the variable taking on the value of “1” if located in Canada and “0” if located in the US.
“Population” was defined the same way as in the qualitative analysis. We used “regional” population, not “local” population. For US cities, we used the most recent population estimates for the Combined Statistical Area (CSA), except in the case of a small number of cities without a CSA, in which case the Metro-politan Statistical Area (MSA) population was used. To arrive at a comparable market size for Canadian cities, we used the most recent Statistics Canada data to estimate the population within 120km of city centre.
simple pRediCTive model of Team’s gaTe Revenues
Coefficientstandard error
T-score
Population 1.99 .77 2.6
Canada 23.48 5.2 4.5

41Why Canada Can Support 12 Teams
appendiX 2meThodologY foR QualiTaTive analYsis
We scored 10 Canadian cities, ranking them relative to Edmonton. We assume that a Canadian city with demographic and economic attributes equivalent to those of Edmonton would be able to generate as much local fan support and revenue as the Oilers—and thus would be, like the Oilers, a viable NHL location, generating greater revenues than the median NHL team, and considerably greater revenues than the median Sun Belt team. A Canadian city with a lower score than Edmonton might still successfully host an NHL team, but the farther below Edmonton a city’s score falls, the less likely a team would be able to earn sufficient revenue to support itself—at least without calling on government subsidies like those enjoyed by many American teams.
We scored potential NHL sites on seven indicators of market viability, with each of the factors assigned a weight. An A+ on any indicator is worth 10 points, A = 9, A-minus = 8, B+ = 7, etc., counting all the way down to an F, which is worth zero points. To get an overall viability score for each city, the score on each indicator was multiplied by that indicator’s weighting. The resulting number was then converted into a grade. To allow for a wide margin of error, scores were rounded to the nearest whole number; for example, any overall score between 6.5 and 7.49 would earn a B+.
On all variables except “arena,” the benchmark city of Edmonton’s scores were determined in comparison with the other examined Canadian cities. Edmonton’s arena score was determined in light of its size, amenities and modernity, relative to existing NHL arenas.
Definition of attributes (with percentage weighting in brackets):
Local Population (20%): Statistics Canada Census Metropolitan Area (CMA), except where otherwise noted.
Regional Population (30%): Population within approximately 120kms of city centre, as calcu-lated by Mowat Centre based on Statistics Canada data, except where otherwise noted.
Population growth (10%): Mowat calculations based on Statistics Canada actual/estimated population growth for the CMA, 2001-2031.
Median after-tax household income (10%): As per Statistics Canada, 2005 Census, for each CMA (i.e. “local population”).
Number of high-income households (15%): Households with after-tax income of more than $125,000. Mowat calculations derived from Statistics Canada 2005 Census data, using the 120 km zone in “Regional Population”.
Corporate strength (10%): Number of corporate head offices on the Financial Post FP500, Next 300 and Top 100 Subsidiaries list found within the 120 km zone, as calculated by Mowat Centre, based on 2009 Financial Post 500 online data.
Arena (5%): Suitability of the arena for hosting an NHL team, based on public information regarding seating capacity, corporate boxes, age of the facility, etc., as well as information on non-hockey attendance as provided by the annual Pollstar Top 100 ranking of the world’s busi-est concert and event arenas.

42 Mowat Centre for Policy Innovation
endnoTes1. Associated Press, “NHL’s 1st-round TV audience up 24 per
cent in US,” USA Today, April 30, 2010. http://www.usato-day.com/sports/hockey/nhl/2010-04-30-3776567903_x.htm
2. “Top Programs Total Canada (English) Apirl 26-May 2, 2010,” BBM Canada. http://bbm.ca/_documents/top_30_tv_programs_english/2010/nat04262010.pdf
3. The Canadian population, at 34 million, is slightly more than 1/9th the US population. The Canadian population outside of Quebec is 1/12th the US population. For regular season local and national TV ratings in Canada and the US, see Tables 1 and 2.
4. “Top Programs Total Canada (French) Apirl 26-May 2, 2010,” http://bbm.ca/_documents/top_30_tv_programs_french/2010/que04262010.pdf
5. The NHL has franchises in 15 of the 20 largest US TV markets, and 19 of the top 30. Comparative figures for the other leagues are: NBA: 18/20 and 21/30; MLB: 18/20 and 22/30; NFL: 17/20 and 24/30. http://www.nielsen.com/content/dam/corporate/us/en/public%20factsheets/tv/2010-2011%20DMA%20Ranks.pdf
6. Kevin McGran, “NHL ready to cash in on TV deal,” Toronto Star, Nov. 8, 2010. http://www.thestar.com/sports/hockey/nhl/article/887781--nhl-ready-to-cash-in-on-tv-deal
7. Ibid8. William Houston, “TSN scores with more Maple Leaf
games,” The Globe and Mail, June 4, 2008. http://www.friends.ca/news-item/3264
9. Sean Gordon, Allan Maki and David Shoalts, “The Giant Sucking Sound,” The Globe and Mail, October 11, 2008.
10. SB Nation, “A portrait of a team on the brink: The Coyotes’ revenues revealed,” May 22, 2009. http://webcache.googleusercontent.com/search?q=cache:ck51gtEIbjoJ:www.fromtherink.com/2009/5/22/883351/a-portrait-of-a-team-on-the-brink+coyotes+and+revenue+sharing&cd=1&hl=en&ct=clnk&gl=ca&client=firefox-a&source=www.google.ca
11. Revenues from US and Canadian “national” broadcasts are redistributed across all NHL teams. However, revenue from “local” broadcasts on Rogers Sportsnet and its US equiva-lents are not redistributed, and remain with the local team.
12. Levitt, Arthur Jr, “Independent Review of the Combined Financial Results of the National Hockey League 2002-2003 Season,” p. 22. http://www.nhl.com/nhlhq/cba/archive/levitt/levittreport.pdf
13. The Levitt Report was commissioned by the NHL, and the NHLPA, then in negotiations with the NHL, initially rejected its findings, saying that it underestimated league revenues. However, the figure for total league revenues in year 1 of the 2005 CBA, arrived at using a methodology similar to Levitt’s, differs only slightly from Levitt’s tally of total revenues in 2002-03.
14. Kevin McGran, “NHL ready to cash in on TV deal,” Toronto Star, Nov. 8, 2010. http://www.thestar.com/sports/hockey/nhl/article/887781--nhl-ready-to-cash-in-on-tv-deal
15. Kurt Badenhausen, Michael K. Ozanian and Christina Settimi, “The Most Valuable NFL Teams,” August 25, 2010. http://www.forbes.com/2010/08/25/most-valuable-nfl-teams-business-sports-football-valuations-10-intro.html
16. Levitt Report, p. 22. 17. “Would a return to Winnipeg work for NHL?” TSN/
Globe and Mail, July 6, 2010. http://www.tsn.ca/nhl/story/?id=326714
18. See July, 2010 interview with Gary Bettman at http://www.tsn.ca/whynotcanada/
19. Data is taken from Forbes, “The Business of Hockey 2009.” Note that we used each team’s gate revenue, rather than total revenue. We used gate because, as noted earlier, the NHL is an attendance-driven league. What’s more, Forbes estimates for total team revenue include league-wide shared revenues, and may also directly or indirectly take into account some taxpayer subsidies in some US cities. Gate revenue is thus the best metric for measuring what we are after: a local market’s revenue generating potential.
20. Buffalo is, by US Census count, slightly smaller than Edmonton. However, the US census does not include several hundred thousand Canadians living just across the river from Buffalo. And as pointed out in the Hamilton market analysis, this population attends Sabres games in large numbers. Counting those people, the Buffalo market is quite a bit larger than Edmonton.
21. Census Division 11 (Edmonton) plus counties of Ponoka, Lacombe, Camrose, Beaver, Lamont, Thorhild, Westlock, Lac Ste. Anne, Barrhead, Smoky Lake.
22. Statistics Canada, “Projections of the Diversity of the Canadian Population, 2006 to 2031,” Catalogue Number 91-551-X.
23. The Greater Toronto Area and Statistics Canada’s Toronto CMA have slightly different boundaries, with the former having 6.1 million residents and the latter 5.6 million. We have used GTA rather than Toronto CMA. The GTA is made up of the city of Toronto and the surrounding regional municipalities of Peel, York, Durham and Halton. Statistics Canada places Burlington, part of Halton, in the Hamilton CMA. Statistics Canada also classifies the Oshawa area, which is in Durham and hence inside the GTA, as its own CMA. See: http://www.statcan.gc.ca/pub/91-214-x/2008000/t045-eng.htm
24. Includes Toronto, York, Peel, Halton, Durham, Simcoe, Nor-thumberland, Kawartha Lakes, Peterborough, Hamilton, Brant, Niagara, Waterloo and Wellington census divisions.
25. Ontario Ministry of Finance (2010). “Ontario Population Projections Update.” Government of Ontario. http://www.fin.gov.on.ca/en/economy/demographics/projections/projections2009-2036.pdf
26. The Greater Toronto Area plus the census divisions of Sim-coe, Northumberland, Kawartha Lakes and Peterborough, as per data supplied by Statistics Canada.
27. Steve Milton, “Copps: Always an NHL bridesmaid,” thespec.com, Nov.20, 2010. http://www.thespec.com/news/local/article/277723--copps-always-an-nhl-bridesmaid; Nicole MacIntyre, “Coliseum called ‘economically obsolete,’” Nov.20, 2010. http://www.thespec.com/news/local/article/277742--coliseum-called-economicallyobsolete
28. The Sabres recently persuaded Canadian Border Services to expand the NEXUS program in their area, making it easier than ever for Canadians to cross the border to spend money watching hockey in the US. http://sabres.nhl.com/club/news.htm?id=515796

43Why Canada Can Support 12 Teams
29. The conservative estimate of 3.8 million assumes that there would be zero Hamilton fans in the central and eastern GTA—we exclude the population of Toronto, Durham, York and points north and east. We assign to the Hamilton market half of the population of Peel, because it is located between Toronto and Hamilton. And we assign to Hamilton all Horseshoe population west of Peel, plus the non-Horseshoe populations of Middlesex, Perth, Oxford and Haldimand-Norfolk counties, which are located to the west of the Horseshoe, but within driving range of Hamilton. A more ambitious estimate of the Hamilton regional market would simply take the Horseshoe population, plus the population of those areas to the west of the Horseshoe, divide by two, and assign half of the result to the Hamilton Team and half to the Maple Leafs. The result would be two markets of 4.8 million.
30. Calculating the Hamilton market as all of the Golden Horseshoe west of Peel Region, plus the populations of Middlesex, Perth, Oxford and Haldimand-Norfolk census divisions (which are west of the GTA, but within an hour of Hamilton) results in a population of 3.1 million. Calculating the Hamilton market as the sum of Golden Horseshoe plus the above-named regions within an hour of Hamilton, divided by three (to account for the presence of three NHL teams) yields 3.2 million.
31. Quebec census divisions 45 to 61 and 63 to 78.32. Census divisions of Hamilton, Waterloo, Wellington,
Niagara, Middlesex, Oxford, Haldimand-Norfolk, Perth, Brant, Dufferin, Huron plus ½ of Halton.
33. Vancouver plus Fraser Valley regional district.34. Census division of Middlesex, Chatham-Kent, Lambton,
Elgin, Huron, Perth, Oxford, Nofolk, Brant, Waterloo, Hamilton, plus Guelph CMA.
35. George Richards, “Florida Panthers to reduce seating capac-ity at BankAtlantic Center,” The Miami Herald, May 20, 2010. http://www.miamiherald.com/2010/05/20/1638096/floridapanthers-to-reduce-seating.html
36. Statistics Canada Manitoba census divisions 2, 3, 9, 10, 11, 12, 13 and 14.
37. Quebec census divisions 16, 17, 18, 19, 20, 21, 22, 23, 25, 26, 27, 28, 29, 31, 32, 33, 34, 37, 38.
38. Saskatoon CMA. 39. Population of Saskatchewan Census Divisions 11, 12 and 15.40. Halifax plus Kings, Hants, Lunenburg and Colchester
counties.41. Levitt Report, pp. 21-22.42. They may be more than ever on the same team, but their
interests are still not 100% aligned. Players, regardless of how well or how poorly their team is doing at the box office, can only benefit from rising league revenues. Owners, in contrast, will be hurt if revenues at other teams rise faster than their own, because under the CBA this will cause their salary obligations to rise faster than their revenues. Owners also have different interests than players because the value of a team is not only or even primarily in the annual cash flow that it generates, but in the prospects for long-term appreciation of the team’s value, which may be captured through a sale and/or move. Players, in contrast, are holders of depreciating assets: their own hockey-playing bodies. They have a much shorter time horizon than owners.
43. National Hockey League, National Hockey League Players’ Association (2005). “Collective Bargaining Agreement Be-tween the NHL and the NHLPA: July 22, 2005 - September 15, 2011.” http://www.nhl.com/ice/page.htm?id=26366. For list of media markets ranked by number of households, see: http://www.nielsen.com/content/dam/corporate/us/en/public%20factsheets/tv/2010-2011%20DMA%20Ranks.pdf
44. In 2007, when Jim Balsillie was trying to buy the Nashville Predators with the aim of moving them to Southern Ontario, the Competition Bureau conducted an inquiry into whether the NHL was engaging in anti-competitive practices (http://www.competitionbureau.gc.ca/eic/site/cb-bc.nsf/eng/02640.html and http://www.competitionbureau.gc.ca/eic/site/cb-bc.nsf/eng/02641.html). The Bureau, in a analysis that was shockingly brief, found that the NHL’s rules on team relocation did not violate the Competition Act, pargraph 79(1)(b); the Bureau did not conduct an analysis under paragraphs 79(1)(a) or 79(1)(c). However, the Bureau seems to have arrived at this conclusion by assuming that NHL teams do not have a 50 mile exclusive territory, and do not have a veto over the movement of a new team in to that territory. This is surprising because the team under the microscope in this case, the Leafs, insist that they have a veto, and the NHL constitution seems to agree (http://www.thestar.com/sports/hockey/article/694707). If the Leafs have a veto that prevents competitors from entering their market, then section 79(1)(b) is violated, and the Competi-tion Bureau’s decision suggests as much.

About the Authors
525 University Avenue, Suite 820 Toronto, ON M5G 2L3 T 416.978.7858 F 416.978.7203 E [email protected]
About the Mowat CentreThe Mowat Centre for Policy Innovation is an independent, non-partisan public policy research centre located at the School of Public Policy and Governance at the University of Toronto.
The Mowat Centre undertakes collaborative applied policy research and engages in public dialogue on Canada’s most important national issues, and proposes innovative, research-driven public policy recommendations, informed by Ontario’s reality.
We believe a prosperous, equitable and dynamic Canada requires strong provinces, including a strong Ontario, and strong cities.
Visit us at www.mowatcentre.ca