the new discoveries of basic researchers: bile acids, oxygen radicals, intestinal glucose metabolism...
TRANSCRIPT

The new discoveries of Basic Researchers: bile acids,
oxygen radicals, intestinal glucose metabolism
reprogramming, others?Gilles Mithieux
« Nutrition and Brain » Inserm U855, universityof Lyon, France

CONTROL OF GLYCEMIA
Insulin
glucose
Endogenous Glucose
Production liver Intestinekidney

Glucose-6 phosphatase : the key enzyme of EGP

EVIDENCE for its EXPRESSIONIn the INTESTINAL MUCOSA
Gastroenterology, 1999

PRODUCTION OF GLUCOSE – FASTING
Normal state
15%
80%
5%
Fasting state
20%45%
35%
G6PC
PEPCK
Diabetes, 2001

WHAT’S HAPPENING IN THE DIABETIC STATE ?

CONTROL OF GLYCEMIA - DIABETES
Insulin
glucose
Endogenous Glucose
Production liver Intestinekidney

1) Insulin resistance takes place
0
20
40
60
80
100
0 15 30 45 60
Time (mn)
% b
asal
glu
cose
§ §§
normal
diabetic
Insulin tolerance test

2) This results in glucose intolerance
0
100
200
300
400
0 20 40 60
Time (mn)
% b
asal
glu
cose
** **
normal
diabetic
glucose tolerance test

3) Endogenous glucose production is increased
1) Peripheral glucose utilization is decreased
4) End-point: fasting plasma glucose is increased, when insulin
secretion becomes insufficient to compensate insulin resistance
2) Insulin secretion is increased, partly compensating insulin resistance
A probable sequence of events is:

WHAT ARE THE MODIFICATIONS OBSERVED AFTER OBESITY SURGERY?
especially after bypass procedures…

In morbid obese:
- marked decrease in appetite (hunger sensations)
- modifications of liking for some foods
In diabetic obese:
- dramatic and rapid amelioration of diabetes

The rationale the most often put forward to account for
this amelioration is based on the restoration of postprandial
secretion of incretin hormones (e.g.GLP-1), promoting
a restored secretion of insulin.

Ileum
Duodenum
Esophagus
ProximalJejunum
Stomach
DistalJejunum
Ileum
Esophagus
ProximalJejunum
Stomach
DistalJejunum
banding bypass = EGA
What’s happening in obese diabetic mice (HF-HS diet) ?
restrictive
procedure
malabsorptive
procedure

The differential efficiency of the various gastric
surgeries is an early event

Pair-fed sham band EGA
0
1
2
3
4
-6 -4 -2 0 2 4 6 8 10
Days
Fo
od
in
take
(g
/d)
Surgery
Daily food intake
15
20
25
30
35
40
45
-6 -4 -2 0 2 4 6 8 10
Days
Bo
dy
wei
gh
t (g
)
Surgery
Body weight on pair-feeding
Decreased food intake No malabsorption
EGABand

Time (mn)
Pair-fed sham GLB EGA
0
1
2
3
4
0 40 60
Insu
lin
emia
(n
g/m
L)
$$
A
0
100
200
300
400
0 20 40 60
Time (m n)
% b
asal
glu
cose
*
*
$
$
glucose
tolerance
Insulin
secretion
EGA
EGA

0
5
10
15
20
25
SD HFD Pair-fedsham
GB EGA
GL
P-1
(p
mo
l/l)
T0T40
$#
§
*
GLP-1 plasma levels during OGTT
0
20
40
60
80
100
0 15 30 45 60
Time (mn)
% b
asal
glu
cose § §
§
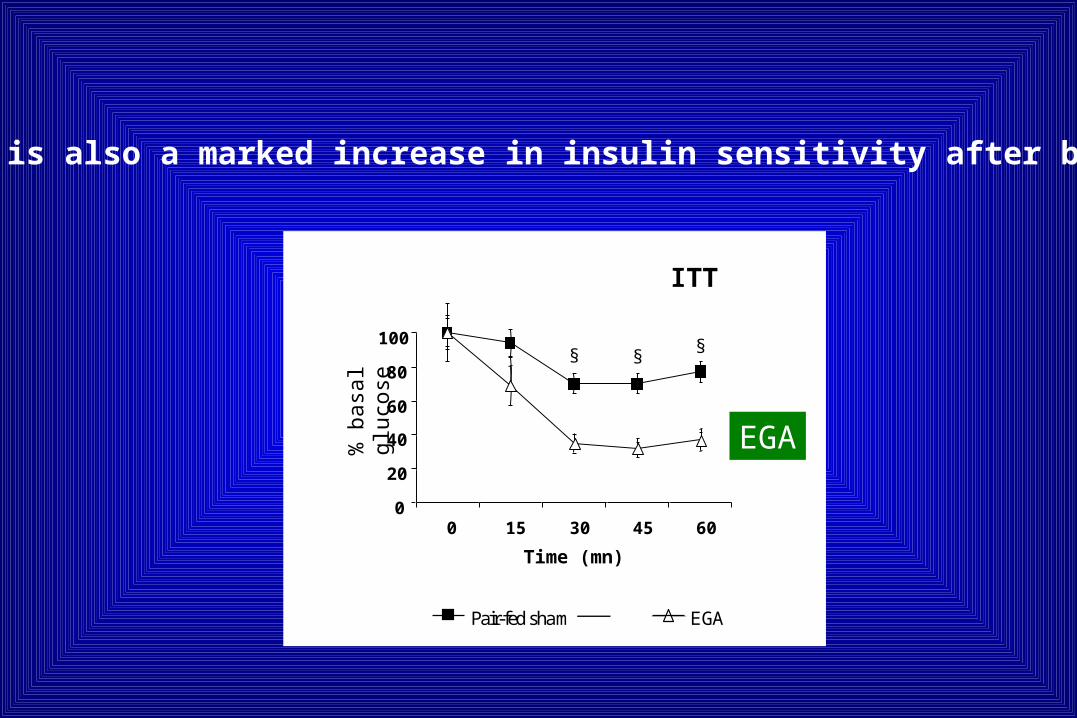
ITT
Pair-fed sham EGA
There is also a marked increase in insulin sensitivity after bypass
EGA

Which is the function improved in terms of insulin
sensitivity after bypass?
EGP of peripheral glucose utilization?

sham
mg
/kg
/mn
Glucose infusion rate (GIR)Endogenous Glucose Production (EGP)Peripheral glucose utilization (Rd)
0
10
20
30
40
50
60
SD HFD Pair-fed GLB EGA
*
*
*
§
$ $
$
Euglycemic hyperinsulinemic clamps reveals improved suppression of EGP
by insulin, and no effect on glucose utilization

CONTROL OF GLYCEMIA - DIABETES
Insulin
glucose
Endogenous Glucose
Production liver Intestinekidney

0
0.5
1.0
HFD Sham GLB EGA
Segment n°4
G6P
ase
(arb
itra
ry u
nit
s)
*
G6Pase
actin
0
0.5
1.0
HFD Sham GLB EGA
Segment n°4*
actin
PEPCK
PE
PC
K (
arb
itra
ry u
nit
s)
Segment n°1
0
5
10
HFD Sham GLB EGA
G6P
ase
acti
vity
(µ
mo
l/m
in/g
) *
0
5
10
HFD Sham GLB EGA
Segment n°3
G6P
ase
acti
vity
(µ
mo
l/m
in/g
)
*
0
5
10
HFD Sham GLB EGA
Segment n°4
G6P
ase
acti
vity
(µ
mo
l/m
in/g
)
Ileum
Duodenum
Esophagus
Proximal
Jejunum
Stomach
Distal
Jejunum

0
5
10
15
20
25
HFD Pair-fed sham GLB EGA
Mic
rom
ole
/
min
/g
NS
$
NS
*
Hepatic G6Pase activity

PRODUCTION OF GLUCOSE – BYPASS
Before surgery
5%
After bypass
15-20%
45%
35%
15-20%
80%
50%
30%

Early after bypass in mice: there is a dramatic change in
whole body glucose metabolism
- recovery of insulin sensitivity (of EGP)
- recovery of pancreatic function (GLP-1and insulin secretions)
- amelioration of glucose tolerance
- no change in basal EGP, but a new repartition among the 3
gluconeogenic organs, with an increased participation of the gut

Hayes et al, OBES SURG (2011) 21:759–762
Is Intestinal Gluconeogenesis a Key Factor in the Early Changes in Glucose homeostasis following
Gastric Bypass?