the network of global corporate control
DESCRIPTION
The network of global corporate controlTRANSCRIPT

arX
iv:1
107.
5728
v1 [
q-fi
n.G
N]
28
Jul 2
011
S. Vitali, J.B. Glattfelder, and S. Battiston:The network of global corporate control
The network of global corporate control
Stefania Vitali1, James B. Glattfelder1, and Stefano Battiston1⋆
1 Chair of Systems Design, ETH Zurich, Kreuzplatz 5, 8032 Zurich, Switzerland,⋆corresponding author, email: [email protected]
Abstract
The structure of the control network of transnational corporations affects global market com-
petition and financial stability. So far, only small national samples were studied and there was
no appropriate methodology to assess control globally. We present the first investigation of the
architecture of the international ownership network, along with the computation of the control
held by each global player. We find that transnational corporations form a giant bow-tie struc-
ture and that a large portion of control flows to a small tightly-knit core of financial institutions.
This core can be seen as an economic “super-entity” that raises new important issues both for
researchers and policy makers.
Introduction
A common intuition among scholars and in the media sees the global economy as being domi-
nated by a handful of powerful transnational corporations (TNCs). However, this has not been
confirmed or rejected with explicit numbers. A quantitative investigation is not a trivial task
because firms may exert control over other firms via a web of direct and indirect ownership rela-
tions which extends over many countries. Therefore, a complex network analysis [1] is needed in
order to uncover the structure of control and its implications. Recently, economic networks have
attracted growing attention [2], e.g., networks of trade [3], products [4], credit [5, 6], stock prices
[7] and boards of directors [8, 9]. This literature has also analyzed ownership networks [10, 11],
but has neglected the structure of control at a global level. Even the corporate governance litera-
ture has only studied small national business groups [12]. Certainly, it is intuitive that every large
corporation has a pyramid of subsidiaries below and a number of shareholders above. However,
economic theory does not offer models that predict how TNCs globally connect to each other.
Three alternative hypotheses can be formulated. TNCs may remain isolated, cluster in separated
coalitions, or form a giant connected component, possibly with a core-periphery structure. So
far, this issue has remained unaddressed, notwithstanding its important implications for policy
making. Indeed, mutual ownership relations among firms within the same sector can, in some
cases, jeopardize market competition [13, 14]. Moreover, linkages among financial institutions
have been recognized to have ambiguous effects on their financial fragility [15, 16]. Verifying to
1/36

S. Vitali, J.B. Glattfelder, and S. Battiston:The network of global corporate control
AB
C D
Figure 1: Ownership and Control. (A&B) Direct and indirect ownership. (A) Firm i has Wij
percent of direct ownership in firm j. Through j, it has also an indirect ownership in k and l. (B)
With cycles one has to take into account the recursive paths, see SI Appendix, Sec. 3.1. (C&D)
Threshold model. (C) Percentages of ownership are indicated along the links. (D) If a shareholder
has ownership exceeding a threshold (e.g. 50%), it has full control (100%) and the others have
none (0%). More conservative model of control are also considered see SI Appendix, Sec. 3.1.
what extent these implications hold true in the global economy is per se an unexplored field of
research and is beyond the scope of this article. However, a necessary precondition to such inves-
tigations is to uncover the worldwide structure of corporate control. This was never performed
before and it is the aim of the present work.
Methods
Ownership refers to a person or a firm owning another firm entirely or partially. Let W denote
the ownership matrix, where the component Wij ∈ [0, 1] is the percentage of ownership that the
owner (or shareholder) i holds in firm j. This corresponds to a directed weighted graph with
firms represented as nodes and ownership ties as links. If, in turn, firm j owns Wjl shares of firm
l, then firm i has an indirect ownership of firm l (Fig. 1 A). In the simplest case, this amounts
2/36
S. Vitali, J.B. Glattfelder, and S. Battiston:The network of global corporate control
trivially to the product of the shares of direct ownership WijWjl. If we now consider the economic
value v of firms (e.g., operating revenue in USD), an amount Wijvj is associated to i in the direct
case, and WijWjlvl in the indirect case. This computation can be extended to a generic graph,
with some important caveats [17, SI Appendix, Secs. 3.1 and 3.2].
Each shareholder has the right to a fraction of the firm revenue (dividend) and to a voice in
the decision making process (e.g., voting rights at the shareholder meetings). Thus the larger
the ownership share Wij in a firm, the larger is the associated control over it, denoted as Cij.
Intuitively, control corresponds to the chances of seeing one’s own interest prevailing in the
business strategy of the firm. Control Cij is usually computed from ownership Wij with a simple
threshold rule: the majority shareholder has full control. In the example of Fig. 1 C, D, this yields
Cijvj = 1 vj in the direct case and CijCjlvl = 0 in the indirect case. As a robustness check, we
tested also more conservative models where minorities keep some control (see SI Appendix, Sec.
3.1). In analogy to ownership, the extension to a generic graph is the notion of network control :
cneti =
∑
j Cijvj +∑
j Cijcnetj . This sums up the value controlled by i through its shares in j,
plus the value controlled indirectly via the network control of j. Thus, network control has the
meaning of the total amount of economic value over which i has an influence (e.g. cneti = vj + vk
in Fig. 1 D).
Because of indirect links, control flows upstream from many firms and can result in some share-
holders becoming very powerful. However, especially in graphs with many cycles, the computation
of cnet, in the basic formulation detailed above, severely overestimates the control assigned to
actors in two cases: firms that are part of cycles (or cross-shareholding structures), and share-
holders that are upstream of these structures. An illustration of the problem on a simple network
example, together with the details of the method are provided in SI Appendix, Secs. 3.2 – 3.4. A
partial solution for small networks was provided in [18]. Previous work on large control networks
used a different network construction method and neglected this issue entirely [11, SI Appendix,
Secs. 2 and 3.5]. In this paper, by building on [11], we develop a new methodology to overcome the
problem of control overestimation, which can be employed to compute control in large networks.
Results
We start from a list of 43060 TNCs identified according to the OECD definition, taken from
a sample of about 30 million economic actors contained in the Orbis 2007 database (see SI
Appendix, Sec. 2). We then apply a recursive search (Fig. S1 and SI Appendix, Sec. 2) which
singles out, for the first time to our knowledge, the network of all the ownership pathways
originating from and pointing to TNCs (Fig. S2). The resulting TNC network includes 600508
nodes and 1006987 ownership ties.
Notice that this data set fundamentally differs from the ones analysed in [11] (which considered
only listed companies in separate countries and their direct shareholders). Here we are interested
3/36
S. Vitali, J.B. Glattfelder, and S. Battiston:The network of global corporate control
AB
C D
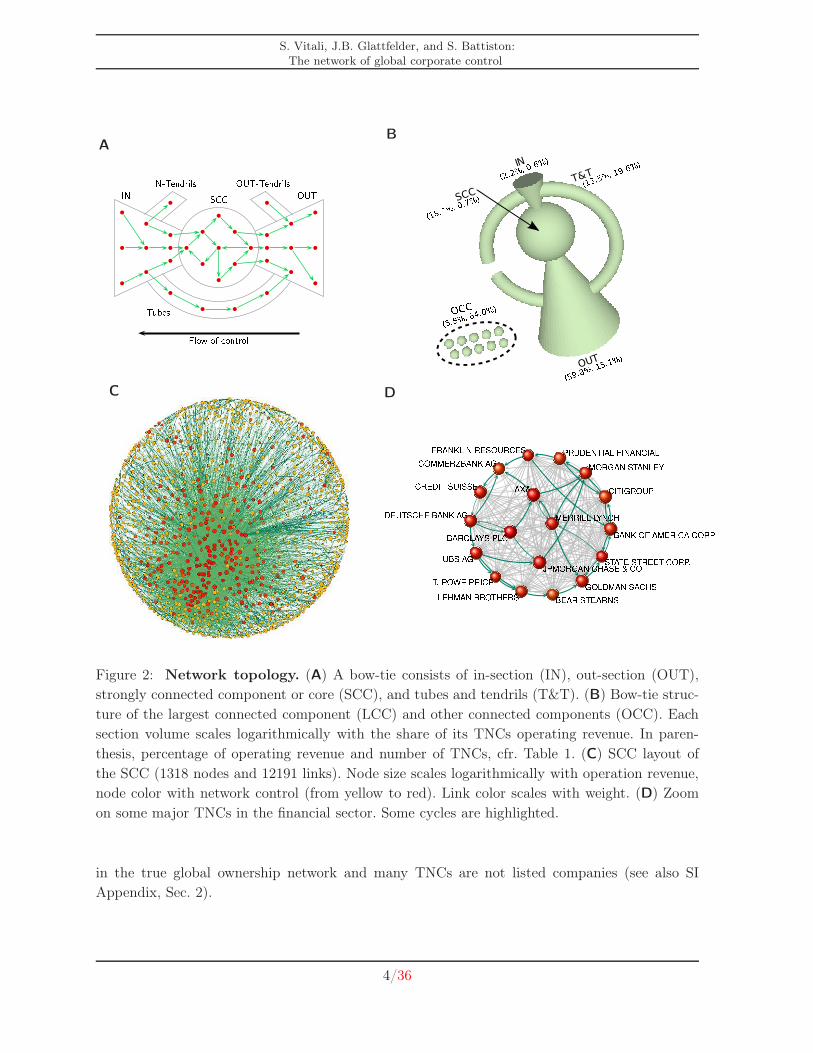
Figure 2: Network topology. (A) A bow-tie consists of in-section (IN), out-section (OUT),
strongly connected component or core (SCC), and tubes and tendrils (T&T). (B) Bow-tie struc-
ture of the largest connected component (LCC) and other connected components (OCC). Each
section volume scales logarithmically with the share of its TNCs operating revenue. In paren-
thesis, percentage of operating revenue and number of TNCs, cfr. Table 1. (C) SCC layout of
the SCC (1318 nodes and 12191 links). Node size scales logarithmically with operation revenue,
node color with network control (from yellow to red). Link color scales with weight. (D) Zoom
on some major TNCs in the financial sector. Some cycles are highlighted.
in the true global ownership network and many TNCs are not listed companies (see also SI
Appendix, Sec. 2).
4/36
S. Vitali, J.B. Glattfelder, and S. Battiston:The network of global corporate control
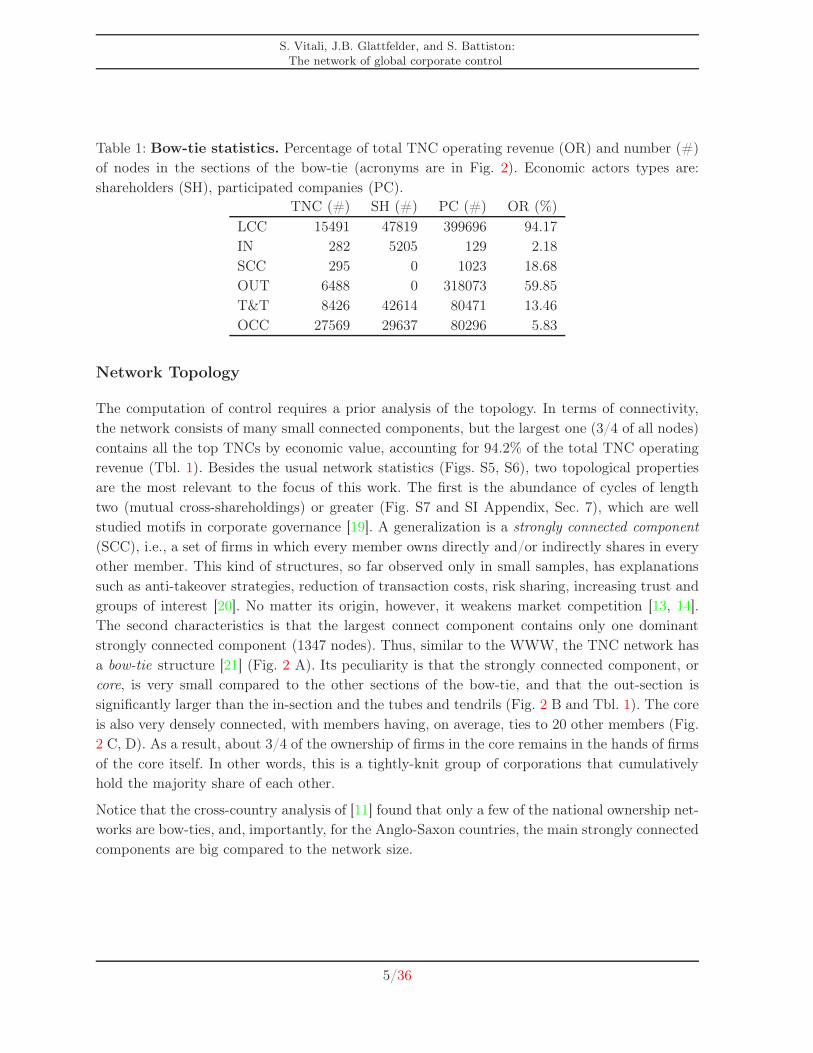
Table 1: Bow-tie statistics. Percentage of total TNC operating revenue (OR) and number (#)
of nodes in the sections of the bow-tie (acronyms are in Fig. 2). Economic actors types are:
shareholders (SH), participated companies (PC).
TNC (#) SH (#) PC (#) OR (%)
LCC 15491 47819 399696 94.17
IN 282 5205 129 2.18
SCC 295 0 1023 18.68
OUT 6488 0 318073 59.85
T&T 8426 42614 80471 13.46
OCC 27569 29637 80296 5.83
Network Topology
The computation of control requires a prior analysis of the topology. In terms of connectivity,
the network consists of many small connected components, but the largest one (3/4 of all nodes)
contains all the top TNCs by economic value, accounting for 94.2% of the total TNC operating
revenue (Tbl. 1). Besides the usual network statistics (Figs. S5, S6), two topological properties
are the most relevant to the focus of this work. The first is the abundance of cycles of length
two (mutual cross-shareholdings) or greater (Fig. S7 and SI Appendix, Sec. 7), which are well
studied motifs in corporate governance [19]. A generalization is a strongly connected component
(SCC), i.e., a set of firms in which every member owns directly and/or indirectly shares in every
other member. This kind of structures, so far observed only in small samples, has explanations
such as anti-takeover strategies, reduction of transaction costs, risk sharing, increasing trust and
groups of interest [20]. No matter its origin, however, it weakens market competition [13, 14].
The second characteristics is that the largest connect component contains only one dominant
strongly connected component (1347 nodes). Thus, similar to the WWW, the TNC network has
a bow-tie structure [21] (Fig. 2 A). Its peculiarity is that the strongly connected component, or
core, is very small compared to the other sections of the bow-tie, and that the out-section is
significantly larger than the in-section and the tubes and tendrils (Fig. 2 B and Tbl. 1). The core
is also very densely connected, with members having, on average, ties to 20 other members (Fig.
2 C, D). As a result, about 3/4 of the ownership of firms in the core remains in the hands of firms
of the core itself. In other words, this is a tightly-knit group of corporations that cumulatively
hold the majority share of each other.
Notice that the cross-country analysis of [11] found that only a few of the national ownership net-
works are bow-ties, and, importantly, for the Anglo-Saxon countries, the main strongly connected
components are big compared to the network size.
5/36

S. Vitali, J.B. Glattfelder, and S. Battiston:The network of global corporate control
Concentration of Control
The topological analysis carried out so far does not consider the diverse economic value of firms.
We thus compute the network control that economic actors (including TNCs) gain over the TNCs’
value and we address the question of how much this control is concentrated and who are the top
control holders. It should be noticed that, although scholars have long measured the concentration
of wealth and income [22], there is no prior quantitative estimation for control. Constructing a
Lorenz-like curve (Fig. 3) allows one to identify the fraction η∗ of top holders holding cumulatively
80% of the total network control. Thus, the smaller this fraction, the higher the concentration.
In principle, one could expect inequality of control to be comparable to inequality of income
across households and firms, since shares of most corporations are publicly accessible in stock
markets. In contrast, we find that only 737 top holders accumulate 80% of the control over the
value of all TNCs (see also the list of the top 50 holders in Tbl. S1). The corresponding level
of concentration is η∗1 = 0.61%, to be compared with η∗2 = 4.35% for operating revenue. Other
sensible comparisons include: income distribution in developed countries with η∗3 ∼ 5%−10% [22]
and corporate revenue in Fortune1000 (η∗4 ∼ 30% in 2009). This means that network control is
much more unequally distributed than wealth. In particular, the top ranked actors hold a control
ten times bigger than what could be expected based on their wealth. The results are robust with
respect to the models used to estimate control, see Fig. 3 and Tbls. S2, S3.
Discussion
The fact that control is highly concentrated in the hands of few top holders does not determine
if and how they are interconnected. It is only by combining topology with control ranking that
we obtain a full characterization of the structure of control. A first question we are now able to
answer is where the top actors are located in the bow-tie. As the reader may by now suspect,
powerful actors tend to belong to the core. In fact, the location of a TNC in the network does
matter. For instance, a randomly chosen TNC in the core has about 50% chance of also being
among the top holders, compared to, e.g., 6% for the in-section (Tbl. S4). A second question
concerns what share of total control each component of the bow-tie holds. We find that, despite
its small size, the core holds collectively a large fraction of the total network control. In detail,
nearly 4/10 of the control over the economic value of TNCs in the world is held, via a complicated
web of ownership relations, by a group of 147 TNCs in the core, which has almost full control
over itself. The top holders within the core can thus be thought of as an economic “super-entity”
in the global network of corporations. A relevant additional fact at this point is that 3/4 of the
core are financial intermediaries. Fig. 2 D shows a small subset of well-known financial players
and their links, providing an idea of the level of entanglement of the entire core.
This remarkable finding raises at least two questions that are fundamental to the understanding
of the functioning of the global economy. Firstly, what are the implication for global financial
6/36

S. Vitali, J.B. Glattfelder, and S. Battiston:The network of global corporate control
10−5
10−4
10−3
10−2
10−1
100
0
0.1
0.2
0.3
0.4
0.5
0.6
0.7
0.8
0.9
1
η (shareholders rank, %)
θ (n
etw
ork
cont
rol a
nd v
alue
, ope
ratin
g re
venu
e, %
)
cnet (LM)
cnet (TM)
cnet (RM) v (Op. Re.)
Figure 3: Concentration of network control and operating revenue. Economic actors
(TNCs and shareholders) are sorted by descending importance, as given by cnet. A data point
located at (η, θ) corresponds to a fraction η of top economic actors cumulatively holding the
fraction θ of network control, value or operating revenue. The different curves refer to network
control computed with three models (LM, TM, RM), see SI Appendix, Sec. 3.1, and operating
revenue. The horizontal line denotes a value of θ equal to 80%. The level of concentration is
determined by the η value of the intersection between each curve and the horizontal line. The
scale is semi-log.
stability? It is known that financial institutions establish financial contracts, such as lending or
credit derivatives, with several other institutions. This allows them to diversify risk, but, at the
same time, it also exposes them to contagion [15]. Unfortunately, information on these contracts
is usually not disclosed due to strategic reasons. However, in various countries, the existence
of such financial ties is correlated with the existence of ownership relations [23]. Thus, in the
hypothesis that the structure of the ownership network is a good proxy for that of the financial
network, this implies that the global financial network is also very intricate. Recent works have
shown that when a financial network is very densely connected it is prone to systemic risk
[24, 16]. Indeed, while in good times the network is seemingly robust, in bad times firms go
into distress simultaneously. This knife-edge property [25, 26] was witnessed during the recent
financial turmoil.
Secondly, what are the implications for market competition? Since many TNCs in the core have
overlapping domains of activity, the fact that they are connected by ownership relations could
facilitate the formation of blocs, which would hamper market competition [14]. Remarkably, the
7/36

S. Vitali, J.B. Glattfelder, and S. Battiston:The network of global corporate control
existence of such a core in the global market was never documented before and thus, so far, no
scientific study demonstrates or excludes that this international “super-entity” has ever acted as a
bloc. However, some examples suggest that this is not an unlikely scenario. For instance, previous
studies have shown how even small cross-shareholding structures, at a national level, can affect
market competition in sectors such as airline, automobile and steel, as well as the financial one
[14, 13]. At the same time, antitrust institutions around the world (e.g., the UK Office of Fair
Trade) closely monitor complex ownership structures within their national borders. The fact that
international data sets as well as methods to handle large networks became available only very
recently, may explain how this finding could go unnoticed for so long.
Two issues are worth being addressed here. One may question the idea of putting together
data of ownership across countries with diverse legal settings. However, previous empirical work
shows that of all possible determinants affecting ownership relations in different countries (e.g.,
tax rules, level of corruption, institutional settings, etc.), only the level of investor protection is
statistically relevant [27]. In any case, it is remarkable that our results on concentration are robust
with respect to three very different models used to infer control from ownership. The second issue
concerns the control that financial institutions effectively exert. According to some theoretical
arguments, in general, financial institutions do not invest in equity shares in order to exert control.
However, there is also empirical evidence of the opposite [23, SI Appendix, Sec. 8.1]. Our results
show that, globally, top holders are at least in the position to exert considerable control, either
formally (e.g., voting in shareholder and board meetings) or via informal negotiations.
Beyond the relevance of these results for economics and policy making, our methodology can
be applied to identify key nodes in any real-world network in which a scalar quantity (e.g.,
resources or energy) flows along directed weighted links. From an empirical point of view, a bow-
tie structure with a very small and influential core is a new observation in the study of complex
networks. We conjecture that it may be present in other types of networks where “rich-get-richer”
mechanisms are at work (although a degree preferential-attachment [1] alone does not produce a
bow-tie). However, the fact that the core is so densely connected could be seen as a generalization
of the “rich-club phenomenon” with control in the role of degree [28, 3, SI Appendix, Sec. 8.2].
These related open issues could be possibly understood by introducing control in a “fitness model”
[29] of network evolution.
Acknowledgments
We acknowledge F. Schweitzer and C. Tessone for valuable feedback, D. Garcia for generating
the 3D figures, and the program Cuttlefish used for networks layout.
8/36

S. Vitali, J.B. Glattfelder, and S. Battiston:The network of global corporate control
References
[1] Barabási A, Albert R (1999) Emergence of scaling in random networks. Science 286: 509.
[2] Schweitzer F, Fagiolo G, Sornette D, Vega-Redondo F, Vespignani A, et al. (2009) Economic
networks: The new challenges. Science 325: 422-425.
[3] Fagiolo G, Reyes J, Schiavo S (2009) World-trade web: Topological properties, dynamics,
and evolution. Phys Rev E 79: 36115.
[4] Hidalgo C, Hausmann R (2009) The building blocks of economic complexity. Proc Natl
Acad Sci 106: 10570.
[5] Boss M, Elsinger H, Summer M, Thurner S (2004) Network topology of the interbank market.
Quant Financ 4: 677–684.
[6] Iori G, De Masi G, Precup O, Gabbi G, Caldarelli G (2008) A network analysis of the Italian
overnight money market. J Econ Dyn Control 32: 259–278.
[7] Bonanno G, Caldarelli G, Lillo F, Mantegna RN (2003) Topology of correlation-based min-
imal spanning trees in real and model markets. Phys Rev E 68: 046130.
[8] Strogatz S (2001) Exploring complex networks. Nature 410: 268–276.
[9] Battiston S, Catanzaro M (2004) Statistical properties of corporate board and director
networks. Eur Phys J B 38: 345–352.
[10] Kogut B, Walker G (2001) The small world of germany and the durability of national
networks. Amer Sociol Rev 66: 317–335.
[11] Glattfelder JB, Battiston S (2009) Backbone of complex networks of corporations: The flow
of control. Phys Rev E 80.
[12] Granovetter M (1995) Ind. Corp. Change, Oxford University Press, chapter Coase Revisited:
Business Groups in the Modern Economy.
[13] O’Brien D, Salop S (1999) Competitive Effects of Partial Ownership: Financial Interest and
Corporate Control. Antitrust Law J 67: 559.
[14] Gilo D, Moshe Y, Spiegel Y (2006) Partial cross ownership and tacit collusion. RAND J
Econ 37: 81–99.
[15] Allen F, Gale D (2000) Financial contagion. J Polit Econ 108: 1–33.
[16] Stiglitz JE (2010) Risk and global economic architecture: Why full financial integration may
be undesirable. Working Paper 15718, NBER. http://www.nber.org/papers/w15718.
9/36

S. Vitali, J.B. Glattfelder, and S. Battiston:The network of global corporate control
[17] Brioschi F, Buzzacchi L, Colombo M (1989) Risk capital financing and the separation of
ownership and control in business groups. J Bank Financ 13: 747–772.
[18] Baldone S, Brioschi F, Paleari S (1998) Ownership Measures Among Firms Connected by
Cross-Shareholdings and a Further Analogy with Input-Output Theory. 4th JAFEE Inter-
national Conference on Investment and Derivatives .
[19] Dietzenbacher E, Temurshoev U (2008) Ownership relations in the presence of cross-
shareholding. J Econ 95: 189–212.
[20] Williamson O (1975) Markets and hierarchies, analysis and antitrust implications: a study
in the economics of internal organization. Free Press, New York.
[21] Broder A, Kumar R, Maghoul F, Raghavan P, Rajagopalan S, et al. (2000) Graph structure
in the Web. Comput Netw 33: 309–320.
[22] Atkinson A, Bourguignon F (2000) Handbook of income distribution. Elsevier.
[23] Santos J, Rumble A (2006) The American keiretsu and universal banks: Investing, voting
and sitting on nonfinancials’ corporate boards. J Finan Econ 80: 419–454.
[24] Battiston S, Delli Gatti D, Gallegati M, Greenwald B, Stiglitz J (2009) Liaisons dangereuses:
Increasing connectivity, risk sharing and systemic risk. Working Paper 15611, NBER.
[25] Alesandri P, Haldane A (2009). Banking on the state. Speech given at the Bank of Eng-
land. http://www.bankofengland.co.uk/publications/speeches/2009/speech409.pdf.
Available at
[26] May R, Levin S, Sugihara G (2008) Ecology for bankers. Nature 451: 893–895.
[27] La Porta R, de Silanes FL, Shleifer A (1999) Corporate ownership around the world. J
Finance 54: 471–517.
[28] Colizza V, Flammini A, Serrano M, Vespignani A (2006) Detecting rich-club ordering in
complex networks. Nat Phy 2: 110–115.
[29] Garlaschelli D, Capocci A, Caldarelli G (2007) Self-organized network evolution coupled to
extremal dynamics. Nat Phys 3: 813–817.
10/36

Supporting Information:
The Network of Global Corporate Control
Stefania Vitali, James B. Glattfelder and Stefano Battiston
Chair of Systems Design, ETH Zurich, Kreuzplatz 5, 8032 Zurich, Switzerland
Contents
1 Acronyms and Abbreviations 12
2 Data and TNC Network Detection 13
3 Network Control 16
3.1 The Existing Methodology . . . . . . . . . . . . . . . . . . . . . . . . . . . . . . . 16
3.2 The Algorithm: Computing Control While Remedying the Problems . . . . . . . 18
3.3 Proving the BFS Methodology Corrects for Cycles . . . . . . . . . . . . . . . . . 20
3.4 An Illustrated Example . . . . . . . . . . . . . . . . . . . . . . . . . . . . . . . . 22
3.5 Relations To Previous Work . . . . . . . . . . . . . . . . . . . . . . . . . . . . . . 24
4 Degree and Strength Distribution Analysis 25
5 Connected Component Analysis 26
6 Bow-Tie Component Sizes 28
7 Strongly Connected Component Analysis 29
8 Network Control Concentration 31
8.1 Control of Financial Institutions . . . . . . . . . . . . . . . . . . . . . . . . . . . 31
8.2 Relation to the Rich Club Phenomenon . . . . . . . . . . . . . . . . . . . . . . . 31
8.3 Top Control-Holders Ranking . . . . . . . . . . . . . . . . . . . . . . . . . . . . . 32
9 Additional Tables 34
11

S. Vitali, J.B. Glattfelder, and S. Battiston:The network of global corporate control
1 Acronyms and Abbreviations
The list of acronyms and abbreviations used in the main text and this Supporting Online
Material:
BFS: breadth-first search (search algorithm)
CC: (weakly) connected component
FS: financial sector
IN: in-section of a bow-tie
LCC: largest CC
LM: linear model (for estimating control from ownership; see also RM and TM)
NACE: (industry standard classification system )
OCC: other connected components (everything outside the LCC)
OECD: Organization for Economic Co-operation and Development
OR: operating revenue
OUT: out-section of a bow-tie
PC: participated company
RM: relative model (for estimating control from ownership; see also LM and TM)
SCC: strongly connected component (in the main text, this is synonymous with the core of the
bow-tie in the LCC)
SH: shareholder (economic actors holding shares in TNCs)
TCH: top control-holder (list of TNCs and SHs that together hold 80% of the network control)
TM: threshold model (for estimating control from ownership; see also LM and RM)
TNC: transnational corporation (OECD definition)
T&T: tubes and tendrils (sections in a bow-tie that either connect IN and OUT, are outgoing
from IN, or ingoing to OUT, respectively)
12/36
S. Vitali, J.B. Glattfelder, and S. Battiston:The network of global corporate control
2 Data and TNC Network Detection
The Orbis 2007 marketing database∗ comprises about 37 million economic actors, both phys-
ical persons and firms located in 194 countries, and roughly 13 million directed and weighted
ownership links (equity relations). Among many others, information on the industrial classifica-
tion, geographical position and operating revenue of the actors are provided. This data set is
intended to track control relationships rather than patrimonial relationships. Whenever available,
the percentage of ownership refers to shares associated with voting rights.
The definition of TNCs given by the OECD[1] states that they
[...] comprise companies and other entities established in more than one country and
so linked that they may coordinate their operations in various ways, while one or more
of these entities may be able to exercise a significant influence over the activities of
others, their degree of autonomy within the enterprise may vary widely from one
multinational enterprise to another. Ownership may be private, state or mixed.
Accordingly, we select those companies which hold at least 10% of shares in companies located
in more than one country. However, many subsidiaries of large TNCs fulfill themselves this
definition of TNCs (e.g. The Coca-Cola Company owns Coca-Cola Hellenic Bottling Company
which in turn owns Coca-Cola Beverages Austria). Since for each multinational group we are
interested in retaining only one representative, we exclude from the selection the companies for
which the so-called ultimate owner (i.e., the owner with the highest share at each degree of
ownership upstream of a company∗) is quoted in a the stock market. In substitution, we add the
quoted ultimate owner to the list (if not already included). In the example above, this procedure
identifies only the Coca-Cola Company as a TNC. Overall we obtain a list of 43060 TNCs located
in 116 different countries, with 5675 TNCs quoted in stock markets.
Starting from the list of TNCs, we explore recursively the neighborhood of companies in the
whole database. First, we proceed downstream of the TNCs (see Fig. S1) with a breadth-first
search (BFS) and we identify all companies participated directly and indirectly by the TNCs.
We then proceed in a similar way upstream identifying all direct and indirect shareholders of the
TNCs. The resulting network can be divided into three classes of nodes, TNC, SH and PC, as
shown in Fig. S2. The TNC network constructed in this way consists of 600508 economic entities
and 1006987 corporate relations. Notice that it may be possible to reach a PC from several TNCs,
or to reach a TNC from several SHs. In other words, paths proceeding downstream or upstream
of the TNCs may overlap, giving rise to CCs of various sizes.
It is worthwhile to distinguish the data set constructed here from the one analysed in [5], which
was not obtained using a recursive search, but with the simple method of collecting only listed
∗URL: http://www.bvdep.com/en/ORBIS.
13/36

S. Vitali, J.B. Glattfelder, and S. Battiston:The network of global corporate control
A
B
Figure S1: Illustration of the first two steps in the recursive exploration downstream of a TNC.
Starting from “Benetton Group” the BFS explores all the direct neighbors (A), and then the
neighbors’ neighbors (B).
companies and their direct shareholders. This method neglects all indirect paths involving non-
listed companies, so that the true ownership network was only approximated. Moreover, 48
countries were analysed separately, ignoring all cross-country links, an approach which inevitably
leaves out entirely the global structure of ownership. The aim there was to construct disjoint
national stock market networks, from which the backbones were extracted and analyzed. Here,
however, we focus on the entire global topology.
14/36
S. Vitali, J.B. Glattfelder, and S. Battiston:The network of global corporate control
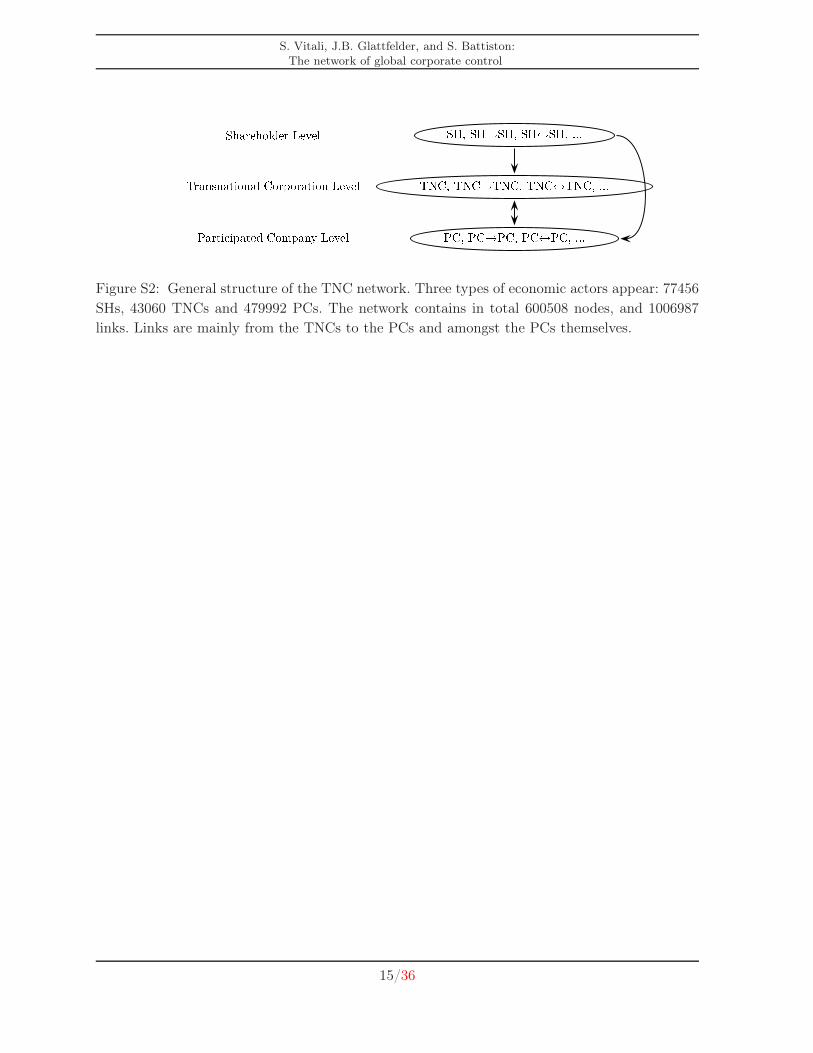
Figure S2: General structure of the TNC network. Three types of economic actors appear: 77456
SHs, 43060 TNCs and 479992 PCs. The network contains in total 600508 nodes, and 1006987
links. Links are mainly from the TNCs to the PCs and amongst the PCs themselves.
15/36

S. Vitali, J.B. Glattfelder, and S. Battiston:The network of global corporate control
3 Network Control
In this section, we first recapitulate in detail the existing method for computing the value or
control in a network. In a second step, we highlight two problems that plague this approach,
especially in networks with bow-tie topology (see main text, Sec. Network Topology). The first is
that the control assigned to firms that are part of cross-shareholding structures is overestimated.
The second is a similar overestimation of the control of the shareholders who are themselves not
owned by others. These two problems require independent solutions. In particular, the second
problem was never raised before in the literature. We provide a novel algorithm that, for the first
time, solves both problems and allows the computation of control also for large networks. This
method represents a fundamental improvement to previous works, including our own one [5], as
explained below in details. Finally, we illustrate the problem and the corrections introduced by
the algorithm using a representative example of a small bow-tie network.
3.1 The Existing Methodology
While ownership is an objective quantity given by the percentage of shares owned in a company,
control, reflected in voting rights, can only be estimated using a model. There are two steps
involved in the derivation of the notion of control we use in this work. Firstly, direct control is
estimated from the direct ownership relations. Network control is then computed on the basis of
direct control considering all paths in the network.
For the computation of the direct control, we use three models: the linear model, applying the
one-share-one-vote rule [2, 3], the threshold model [4] and the relative control model [5]. In
the main part of the text, we denote these three models as LM, TM and RM, respectively.
According to the LM, there is no deviation between ownership and control, thus the direct
control matrix coincides with the ownership matrix, Lij = Wij . In the TM, full control over a
company is assigned to the actor holding a number of shares higher than a predefined threshold
(50% in our case), while the other holders are assigned zero control. The control matrix for the
threshold model is denoted as Tij . Finally, the RM assigns control based on the relative fraction
of ownership shares that each shareholder has (using a Herfindhal-like concentration index). The
control matrix is defined as Rij := W 2ij/(∑kin
j
l=1W2lj). In particular, the RM assigns high control
to a shareholder with a small share in absolute terms, if this share is significantly bigger than the
shares of all the other shareholders. For each of these three control matrices, network control is
computed with the same procedure. In the main text we use the TM as our main measure, and
compare all the results with the LM and the RM. It should be stressed that the global findings
are insensitive to the chosen model of direct control.
As explained in the main text, the value of the portfolio of firms owned directly by i should be
computed taking into account the value of the firms owned by the firms in the portfolio and so
on. Thus, the network portfolio value pneti consists of the value gained indirectly plus the value of
16/36
S. Vitali, J.B. Glattfelder, and S. Battiston:The network of global corporate control
the direct portfolio: pneti =
∑
j Wijvj +∑
j Wijpnetj . The vector v represents the intrinsic value of
the firms (e.g., operating revenue, total assets or market capitalization). Here we use operating
revenue, because it is readily available for the economic actors under investigation and it is
comparable across sectors (this is not true for total assets). In analogy to the definition above,
we introduce the network control (value) [5]. This quantity measures the value controlled by a
shareholder taking into account the network of firms in which it has direct or indirect shares. In
matrix notation,
cnet = Ccnet + Cv, (1)
where C ∈ {L, T,R} is one of the three direct control matrices. The solution to Eq. (1) is given
by
cnet = (I − C)−1Cv =: Cv. (2)
For the matrix (I − C) to be non-negative and non-singular, a sufficient condition is that the
Frobenius root of C is smaller than one, λ(C) < 1. This is ensured by the following requirement:
in each strongly connected component S there exists at least one node j such that∑
i∈S Cij < 1.
This means that there exists no subset of k firms (k = 1, . . . , n) that are entirely controlled by
the k firms themselves, a condition which is always fulfilled.
By taking the series expansion of (I − C)−1, it can be proven that: C(I −C)−1 = (I − C)−1C. As
a consequence, C in Eq. (2) coincides with the solution to the equation
Cij = Cij +∑
k
CikCkj. (3)
This is corresponds to the definition of integrated ownership given in [6]. Hence, as in [5], we
can interpret cnet as the value of control an economic actor gains from all its direct and indirect
paths in the network.
Notice that Eq. (1) is related to the notion of eigenvector centrality used to investigate power and
influence both in social and economic networks [7, 8]. There is also an additional interpretation
of network control in terms a physical system in which a quantity is flowing along the links of
the network [5]. In this picture, nodes associated with a value vj produce vj units of the quantity
at time t = 1. The weight of a link ij, given by the adjacency matrix entry Aij, determines the
fraction of vj that flows through it. Then the inflow, i.e. the flow φi entering the node i from
each node j at time t is the fraction Aij of the quantity produced by j plus the same fraction of
the inflow of j:
φi(t+ 1) =∑
j
Aijφi(t) +∑
j
Aijvj , (4)
In matrix notation, at the steady state, this yields
φ = Aφ+Av, (5)
which is formally identical to Eq. (1). Thus if v corresponds to an intrinsic economic value of the
nodes, then the network control corresponds to the inflow of control over this value. The network
portfolio value of a node is determined by the total inflow of value entering the node.
17/36
S. Vitali, J.B. Glattfelder, and S. Battiston:The network of global corporate control
Next to network control, a related quantity is the so-called network value
vnet = Cvnet + v, (6)
which is akin to a Hubbell index centrality measure [9]. This measure is well-established in the
literature [6]. The solution is vnet = (I − C)−1v. By noting that
Cvnet = C(I − C)−1v = Cv, (7)
we find
vnet = Cv + v = cnet + v. (8)
In other words, the network value of an economic actor is given by its intrinsic value plus the
value gained from network control. It is an estimate of the overall value a corporation has in
an ownership network. Notice that network value and network control of a company can differ
considerably. As an example, Wall Mart is in top rank by operating revenue but it has no equity
shares in other TNCs and thus its network control is zero. In contrast, a small firm can acquire
enormous network control via shares in corporations with large operating revenue.
From Eq. (7), where cnet = Cv = Cvnet, network control can either be understood as the value of
control gained from the intrinsic value reachable by all direct and indirect paths or the value of
control given by the network value of directly controlled firms.
3.2 The Algorithm: Computing Control While Remedying the Problems
Unfortunately, the equations defining network control and network value suffer from three draw-
backs. Firstly, the computation overestimates control when there are cycles in the network (for
example in an SCC), i.e., when the number of inter-firm cross-shareholdings grows [10]. Secondly,
as we have discovered, it also leads to paradoxical situations. Consider for instance an SCC that is
reachable from a single root-node r that owns an arbitrarily small share in one of the firms in the
SCC. The above definition assigns to such a node the sum of the intrinsic value of all the nodes
in the SCC. This is obviously not a correct estimate of the control of the node r. These two issues
are best understood in the flow analogy. Indeed, in a dense SCC control flows through the nodes
many times. The smaller the incoming links from the IN are the longer it takes until the flow
stops, as, in the steady state, everything ultimately flows to and accumulates in the root-nodes.
However, since control corresponds to the total inflow over an infinite time this exaggerates the
control of the nodes in the SCC and all the control ultimately flows to the root-nodes. Thirdly,
for large networks, the computation of the inverse matrix can be intractable. Here, for the first
time, we overcome the aforementioned problems and propose a new methodology that consists
of applying an algorithm to compute network control by treating different components of the
network separately.
We first illustrate the algorithm for the computation of vnet. Then cnet = vnet − v. In order
to calculate the network value for any specific node i, we extract the whole subnetwork that is
18/36
S. Vitali, J.B. Glattfelder, and S. Battiston:The network of global corporate control
downstream of a node i, including i. For this purpose, a breadth-first-search (BFS) returns the
set of all nodes reachable from i, going in the direction of the links. Then, all the links among
these nodes are obtained from the control matrix of the entire network, except for the links
pointing to i which are removed. This ensures that there are no cycles involving i present in the
subnetwork. Let B(i) denote the adjacency matrix of such a subnetwork, including i, extracted
from the control matrix C = (L, T,R). Without loss of generality, we can relabel the nodes so
that i = 1. Since node 1 has now no incoming links, we can decompose B = B(1) as follows:
B =
(
0 d~0 Bsub
)
, (9)
where d is the row-vector of all links originating from node 1, and Bsub is associated with the
subgraph of the nodes downstream of i. The value of these nodes is given by the column-vector
vsub. By replacing the the matrix B in the expression vnet = Cv+v = C(I−C)−1v+v and taking
the first component we obtain:
vnet(1) =[
B(I −B)−1v]
1+ v1
= d(Isub −Bsub)−1vsub + v1 =: d · vsub + v1, (10)
where now cnet(1) := d · vsub = d(Isub −Bsub)−1vsub.
Notice that if node i has zero in-degree, this procedure yields the same result as the previous
formula: B(i,∗) = (0, d) = C(i,∗). The notation A(i,∗) for a matrix is understood as taking its i-th
row. In the next section it is shown that our calculation is in fact equivalent to the correction
proposed by [10] to address the problems of the overestimation of network value in the case of
ownership due to the presence of cycles.
However, both methods still suffer from the problem of root nodes accumulating all the control.
This issue was previously overlooked because the cases analysed did not have a bow-tie structure
and because the focus was not on the empirical analysis of control. To solve this issue, we adjust
our algorithm to pay special attention to the IN-nodes of an SCC. We partition the bow-tie
associated with this SCC into its components: the IN (to which we also add the T&T), the
SCC itself, and the OUT. Then, we proceed in multiple steps to compute the network value
for all parts in sequence. In this way, the control flows from the OUT, via the SCC to the IN.
Finally, the network control is computed from the network value as cnet = vnet − v. In detail, our
algorithm works as follows:
1. OUT: Compute the network value vnet(i) for all the nodes in the OUT using Eq. (10).
2. OUT → SCC: Identify the subset S1 of nodes in the SCC pointing to nodes in the OUT,
the latter subset denoted as O. To account for the control entering the SCC from the OUT,
compute the network value of these selected nodes by applying vnet(s) =∑
o Csovnet(o)+vs
to them. This is an adaptation of Eq. 8, where s and o are labels of nodes in S1 and O,
19/36

S. Vitali, J.B. Glattfelder, and S. Battiston:The network of global corporate control
respectively. Note that we only needed to consider the direct links for this. This computation
is also equivalent to applying Eq. (10), which considers the downstream subnetworks of S1,
i.e., the whole OUT.
3. SCC: Employ Eq. (10) to the SCC-nodes restricting the BFS to retrieve only nodes in the
SCC itself. Note that for those SCC-nodes that were already considered in step 2, their
network value is now taken as the intrinsic value in the computation. This means one first
needs to assign vi 7→ vnet(i) + vi.
4. SCC → IN: In this step we solve the problem of the root-nodes acquiring an exaggerated
fraction of the network value. For the subset of IN-nodes I directly connected to some
SCC-nodes S2, we again apply vnet(i) =∑
s Cisvnet(s) + vi, where i and s are labels of
nodes in I and S2, respectively. However, note that due to the cycles present in the SCC,
this computation is not equivalent to Eq. (10). In this way only the share of network value
over the SCC which is not owned by other SCC-nodes is transferred to the IN-nodes.
5. IN: Finally, use Eq. (10) for assigning the network value to the nodes in the IN-subnetwork.
In this case the BFS should not consider the SCC-nodes since their value has been already
transfer-ed to their first neighbors in the IN. However, it should retrieve the T&T departing
from the IN. Again, for the IN-nodes treated in step 4, first assign vi 7→ vnet(i) + vi.
Notice that if any part of the bow-tie structure contains additional smaller SCCs, these should
be treated first, by applying steps two to four.
This dissection of the network into its bow-tie components also reduces the computational prob-
lems. Although we perform a BFS for each node and compute the inverse of the resulting adja-
cency matrix of the subnetwork as seen in Eq. (10), the smaller sizes of the subnetworks allow
faster computations.
To summarize, using one of the three adjacency matrices estimating direct control, C ∈ {L, T,R},
we can compute the corresponding network value for a corporation: vneti . By deducting the
operating revenue, we retrieve the network control: cneti . Operating revenue is taken for the value
of the TNCs (vi). Fig. S3 shows the distribution of the operating revenue of the TNCs and the
resulting network value.
3.3 Proving the BFS Methodology Corrects for Cycles
Here we show that the BFS algorithm presented in the last section yields an equivalent com-
putation proposed in the literature to address the problems of the presence of cycles leading to
exaggerated network value.
In [6] the notion of network value was introduced based on ownership which corresponds, in the
case of control, to
vnet = Cv + v, (11)
20/36

S. Vitali, J.B. Glattfelder, and S. Battiston:The network of global corporate control
100
101
102
103
104
105
106
107
108
109
1010
10−5
10−4
10−3
10−2
10−1
100
cum
ulat
ive
dist
ribut
ion
func
tion
network control / operating revenue (TNC)
cnet
Operating revenue of TNC
Figure S3: Cumulative distribution function of the network control (TM) in the LCC and the
operating revenue of the TNCs in the LCC, from which it is computed.
which in [10] was identified as being problematic. The authors hence introduced a new model
which overcomes this problem of exaggerated indirect value in presence of cycles by introducing
Cij := Cij +∑
k 6=i
CikCkj. (12)
This means that the original matrix C defined in Eq. (3) is corrected by removing all indirect
self-loops of any node i. If the network has no cycles, then Eqs. (3) and (12) yield identical
solutions.
We introduce here for the first time a correction operator, that incorporates this modification
and makes the associated computations clearer
D := diag((I − C)−1)−1 = I − diag(C), (13)
where diag(A) is the matrix of the diagonal of the matrix A. It can be shown that
C = DC. (14)
The associated corrected network value can be identified as
vnet = Dvnet = Cv +Dv. (15)
Our proposed methodology also corrects for cycles in an equivalent way. This can be seen as
follows. By applying the BFS algorithm to node i, we extract the adjacency matrix B(i) of the
21/36
S. Vitali, J.B. Glattfelder, and S. Battiston:The network of global corporate control
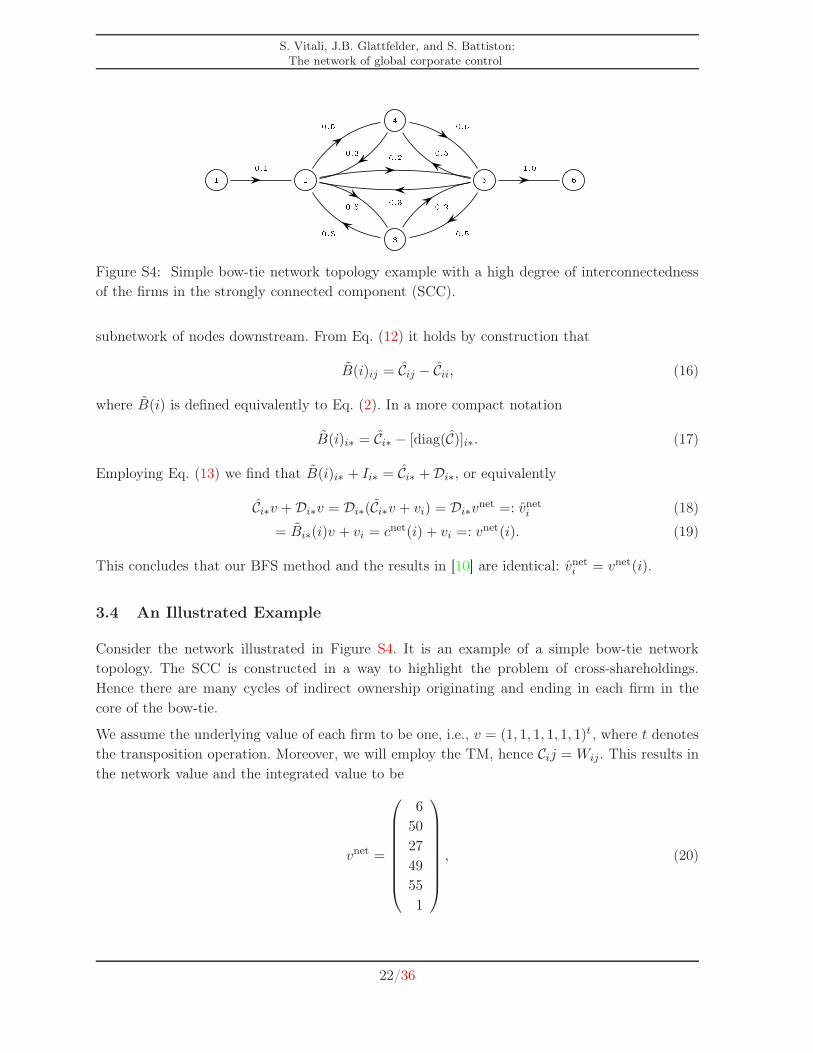
Figure S4: Simple bow-tie network topology example with a high degree of interconnectedness
of the firms in the strongly connected component (SCC).
subnetwork of nodes downstream. From Eq. (12) it holds by construction that
B(i)ij = Cij − Cii, (16)
where B(i) is defined equivalently to Eq. (2). In a more compact notation
B(i)i∗ = Ci∗ − [diag(C)]i∗. (17)
Employing Eq. (13) we find that B(i)i∗ + Ii∗ = Ci∗ +Di∗, or equivalently
Ci∗v +Di∗v = Di∗(Ci∗v + vi) = Di∗vnet =: vnet
i (18)
= Bi∗(i)v + vi = cnet(i) + vi =: vnet(i). (19)
This concludes that our BFS method and the results in [10] are identical: vneti = vnet(i).
3.4 An Illustrated Example
Consider the network illustrated in Figure S4. It is an example of a simple bow-tie network
topology. The SCC is constructed in a way to highlight the problem of cross-shareholdings.
Hence there are many cycles of indirect ownership originating and ending in each firm in the
core of the bow-tie.
We assume the underlying value of each firm to be one, i.e., v = (1, 1, 1, 1, 1, 1)t , where t denotes
the transposition operation. Moreover, we will employ the TM, hence Cij = Wij. This results in
the network value and the integrated value to be
vnet =
6
50
27
49
55
1
, (20)
22/36

S. Vitali, J.B. Glattfelder, and S. Battiston:The network of global corporate control
using Eq. (8).
So although the total value present in the network is 6 =∑
i vi, firm 5 has an disproportionately
large network control of vnet5 = 54, highlighting the problem of overestimating the control in the
presence of cycles.
Employing the corrections proposed in [10], i.e. by computing the correction operator defined in
Eq. (13), one finds
D =
1.000 0 0 0 0 0
0 0.100 0 0 0 0
0 0 0.162 0 0 0
0 0 0 0.095 0 0
0 0 0 0 0.086 0
0 0 0 0 0 1.000
. (21)
From this, the corrected values can be computed from Eq. (15)
vnet =
6.000
5.000
4.378
4.667
4.714
1.000
. (22)
The correction reduces the values of the firms in the core of the bow-tie by approximately one
order of magnitude. This confirms that vnet and cnet are indeed the right measures to consider
in the presence of SCCs in the network.
Unfortunately, this example also highlights the second problem of the methodology. It is clear,
that root nodes accumulating all the control. As mentioned, our proposed algorithm remedies
this problem while still correcting for the overestimation in cycles. One finds from Eq. (10) that
vnet(1)
vnet(2)
vnet(3)
vnet(4)
vnet(5)
vnet(6)
=
1.500
5.000
4.378
4.667
4.714
1.000
, (23)
illustrating the change from vnet1 = vnet
1 = 6 ≥ vnet(1) = 1.5.
To summarize, employing vnet for the computation of control in networks with bow-tie topology
overestimates the level of control in the SCC by construction. Using vnet on the other hand always
assigns the root nodes the highest control. Only the measure vnet(.) puts root and SCC-nodes
on par with each other and the leaf-nodes, allowing for the first time an accurate analysis of the
control of each node in the network.
23/36

S. Vitali, J.B. Glattfelder, and S. Battiston:The network of global corporate control
3.5 Relations To Previous Work
To summarize, the relation the existing work is as follows. The notion of network value† was
introduced in [6], in addition to the integrated ownership matrix. This matrix was later corrected
in [10].
The notion of network control was first defined in [5] without any of the corrections described
above. Because the networks analysed there comprised only listed companies and their direct
shareholders, it was sufficient to apply the uncorrected methodology due to the absence of long
indirect paths, see Sec. 2. In contrast, in the present work, the full-fledged methodology with all
the corrections is required in order to consistently compute the flow of control. This resulted in
the introduction of the correction operator and its application to the network value and network
control. As mentioned, this allowed us to identify a second problem with the methodology.
Subsequently, we have incorporated these insights into an algorithm that is suitable for large
networks, correcting all potential problems with computing control. Finally, we also uncover the
relationship between network control and network value.
†Although the authors only considered the case of ownership and not that of control, their methods are
equivalent to the definition of control employing the LM.
24/36

S. Vitali, J.B. Glattfelder, and S. Battiston:The network of global corporate control
4 Degree and Strength Distribution Analysis
The study of the node degree refers to the distribution of the number of in-going and out-going
relations. The number of outgoing links of a node corresponds to the number of firms in which
a shareholder owns shares. It is a rough measure of the portfolio diversification. The in-degree
corresponds to the number of shareholders owning shares in a given firm. It can be thought of as
a proxy for control fragmentation. In the TNC network, the out-degree can be approximated by
a power law distribution with the exponent -2.15 (see Fig. S5A). The majority of the economic
actors points to few others resulting in a low out-degree. At the same time, there are a few nodes
with a very high out-degree (the maximum number of companies owned by a single economic
actor exceeds 5000 for some financial companies). On the other hand, the in-degree distribution,
i.e., the number of shareholders of a company, behaves differently: the frequency of nodes with
high in-degree decreases very fast. This is due to the fact that the database cannot provide all
the shareholders of a company, especially those that hold only very small shares.
Next to the study of the node degree, we also investigate the strength which is defined as∑
j Wij,
that is, the sum of all the weighed participations a company i has in other companies j (see
Fig. S5B). It is a measure of the weight connectivity and gives information on how strong the
ownership relationships of each node are.
A
100
101
102
103
104
10−6
10−5
10−4
10−3
10−2
10−1
100
cum
ulat
ive
dist
ribut
ion
func
tion
degree
in−degreeout−degreeα = −1.15
B
100
101
102
103
104
105
10−5
10−4
10−3
10−2
10−1
100
cum
ulat
ive
dist
ribut
ion
func
tion
strength degree
α = −1.62
Figure S5: (A) Cumulative distribution function of the in- and out-degree of the nodes in the
LCC (log-log scale). The power-law exponent for the corresponding probability density function
of the out-degree is estimated to be -2.15. (B) Cumulative distribution function of the node
strength in the LCC (log-log scale). As a reference, a power-law with an exponent of −1.62 is
displayed.
25/36
S. Vitali, J.B. Glattfelder, and S. Battiston:The network of global corporate control
5 Connected Component Analysis
Ownership relations between companies create formal ties among them. In a strongly connected
component, all firms reach via an ownership pathway all other firms, thus owning each other
indirectly to some extent. In contrast, in a weakly CC firms can reach each other only if one
ignores the direction of the ownership links. This is still a situation of interest from an economic
point of view because the flow of knowledge and information is not restricted by the direction of
the link. The number and the size distribution of the CC provide a measure of the fragmentation
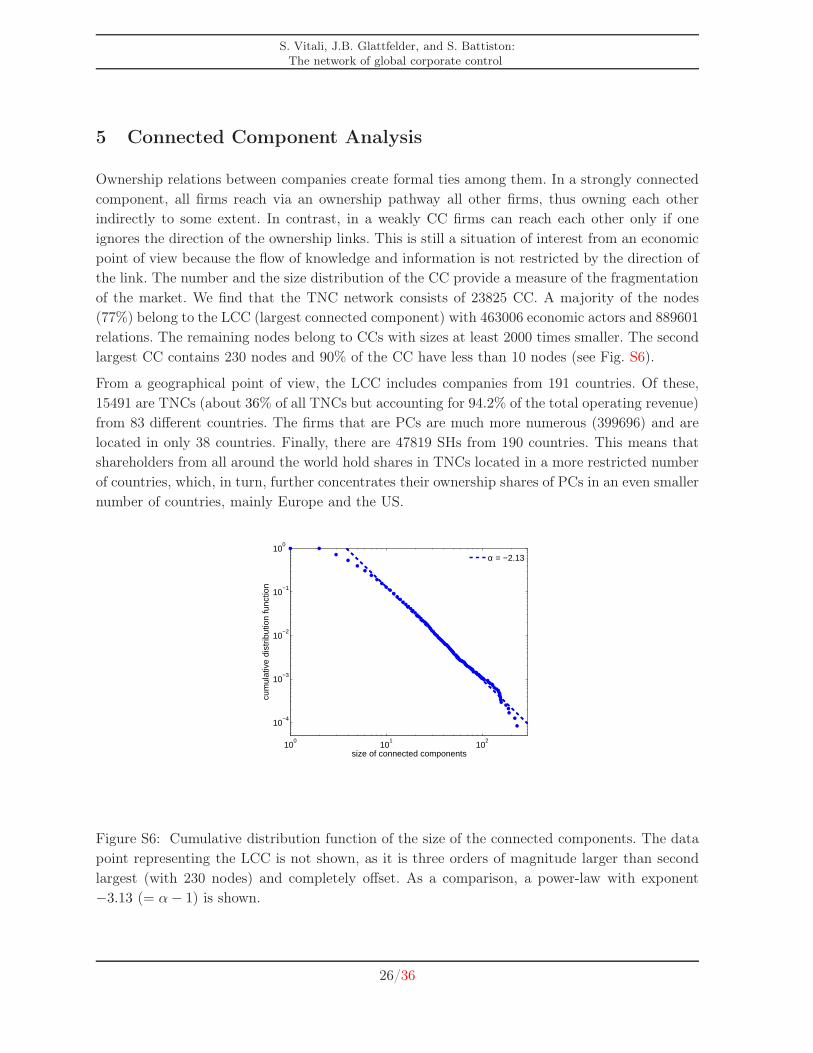
of the market. We find that the TNC network consists of 23825 CC. A majority of the nodes
(77%) belong to the LCC (largest connected component) with 463006 economic actors and 889601
relations. The remaining nodes belong to CCs with sizes at least 2000 times smaller. The second
largest CC contains 230 nodes and 90% of the CC have less than 10 nodes (see Fig. S6).
From a geographical point of view, the LCC includes companies from 191 countries. Of these,
15491 are TNCs (about 36% of all TNCs but accounting for 94.2% of the total operating revenue)
from 83 different countries. The firms that are PCs are much more numerous (399696) and are
located in only 38 countries. Finally, there are 47819 SHs from 190 countries. This means that
shareholders from all around the world hold shares in TNCs located in a more restricted number
of countries, which, in turn, further concentrates their ownership shares of PCs in an even smaller
number of countries, mainly Europe and the US.
100
101
102
10−4
10−3
10−2
10−1
100
cum
ulat
ive
dist
ribut
ion
func
tion
size of connected components
α = −2.13
Figure S6: Cumulative distribution function of the size of the connected components. The data
point representing the LCC is not shown, as it is three orders of magnitude larger than second
largest (with 230 nodes) and completely offset. As a comparison, a power-law with exponent
−3.13 (= α− 1) is shown.
26/36
S. Vitali, J.B. Glattfelder, and S. Battiston:The network of global corporate control
In addition, a sector analysis of the LCC shows that the most represented industries are the
business activities sector, with 130587 companies, followed by the services sector with 99839
companies and the manufacturing sector with 66212 companies. On the other hand, surprisingly,
the financial intermediaries sector counts only 46632 companies. However, if we distinguish be-
tween in-going and out-going relations, the financial intermediaries hold the largest number of
shares (341363). Instead, the manufacturing and services sectors, with respectively 182699 and
170397 companies, have the companies with the most shareholders.
27/36

S. Vitali, J.B. Glattfelder, and S. Battiston:The network of global corporate control
6 Bow-Tie Component Sizes
Does a bow-tie structure and the relative size of its IN, OUT and core result from specific
economic mechanisms, or could it be explained by a random network formation process? For
correlated networks, as in our case, there is no suitable theoretical prediction [11]. Heuristically,
one could address the issue by performing a random reshuffling of links. However, this would
violate economic constraints. For instance, exchanging a 10% ownership share in a small company
with 10% in a big one requires the modification of the budget of the owner. In addition, the
procedure is computationally cumbersome for large data sets.
28/36

S. Vitali, J.B. Glattfelder, and S. Battiston:The network of global corporate control
7 Strongly Connected Component Analysis
Cross-shareholdings, or strongly connected components (SCCs) in graph theory, are sub-network
structures where companies own each other directly or indirectly through a chain of links (see
Fig. S7). Graphically speaking, this means that they form cycles and are all reachable by every
other firm in the SCC.
In economics, this kind of ownership relation has raised the attention of different economic insti-
tutions, such as the antitrust regulators (which have to guarantee competition in the markets),
as well as that of the companies themselves. They can set up cross-shareholdings for coping
with possible takeovers, directly sharing information, monitoring and strategies reducing market
competition.
In our sample we observe 2219 direct cross-shareholdings (4438 ownership relations), in which
2303 companies are involved and represent 0.44% of all the ownership relations (see Fig. S7A).
These direct cross-shareholdings are divided among the different network actors as follow:
• 861 between TNCs;
• 563 between TNCs and PCs;
• 717 between PCs;
• 78 between SHs.
When there is a cross-shareholding involving three companies (see an example in Fig. S7B),
many combinations of indirect paths are possible. In our network we observe the following ones:
• 829 of the type: A → B → C → A;
• 4.395 of the type: A ↔ B → C → A;
• 8.963 of the type: A ↔ B ↔ C → A;
• 3.129 of the type: A ↔ B ↔ C ↔ A.
29/36
S. Vitali, J.B. Glattfelder, and S. Battiston:The network of global corporate control
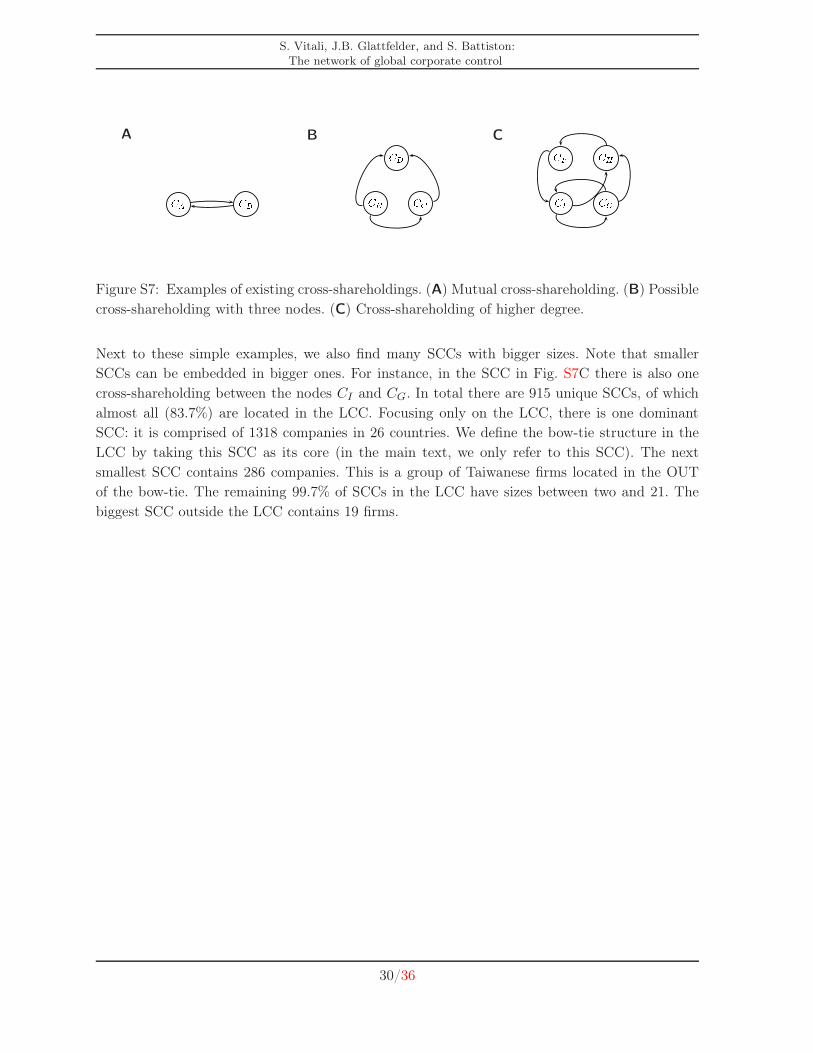
A B C
Figure S7: Examples of existing cross-shareholdings. (A) Mutual cross-shareholding. (B) Possible
cross-shareholding with three nodes. (C) Cross-shareholding of higher degree.
Next to these simple examples, we also find many SCCs with bigger sizes. Note that smaller
SCCs can be embedded in bigger ones. For instance, in the SCC in Fig. S7C there is also one
cross-shareholding between the nodes CI and CG. In total there are 915 unique SCCs, of which
almost all (83.7%) are located in the LCC. Focusing only on the LCC, there is one dominant
SCC: it is comprised of 1318 companies in 26 countries. We define the bow-tie structure in the
LCC by taking this SCC as its core (in the main text, we only refer to this SCC). The next
smallest SCC contains 286 companies. This is a group of Taiwanese firms located in the OUT
of the bow-tie. The remaining 99.7% of SCCs in the LCC have sizes between two and 21. The
biggest SCC outside the LCC contains 19 firms.
30/36

S. Vitali, J.B. Glattfelder, and S. Battiston:The network of global corporate control
8 Network Control Concentration
8.1 Control of Financial Institutions
One meaning of control in the corporate finance literature is the frequency by which a shareholder
is able to influence the firm’ strategic decision during the official voting [12]. Differently, in this
work, by control we mean how much of the economic value of a company a shareholder is able
to influence. Moreover, we did not limit our focus to the control of a shareholder of a single firm.
Instead, we look at the control each shareholder has over its whole portfolio of owned firms. As
a result, the shareholders with a high level of control are those potentially able to impose their
decision into many high-value firms. The highest is the shareholder’s control, the highest is the
shareholder’s power over the final decision. In this sense, our notion of control can be related to
Weber’s definition of “power”, i.e. the probability of an individual to be able to impose its will
despite the opposition of the others [13].
In the literature on corporate control there is a debate on weather financial institutions really
exert the control associated to their ownership shares. On the one hand, they are not supposed
to seek an active involvement in the companies’ strategies. However, some works argue that
institutional investors, including banks and mutual funds, do exert control to some extent [14, 15,
16, 17]. In particular, the outcome of votes can be influenced by means of informal discussions, in
which pro-management votes are used as a bargaining chip (e.g., in exchange of business related
"favors" or in negotiating the extension of credit)‡. On the contrary, [18] and [19] find that
mutual funds, which typically hold large blocks of shares, vote against the management (i.e., in
favor of corporate governance proposals) only 33% of the times (in the case of Fidelity Fund).
However, they do so in more than 60%, on average, in other 11 cases analysed. These results are
suggested to originate mainly from a conflict of interest, where the benefits of providing pension
plan management to client corporations outweighs the possible benefits gained from increased
shareholder value. However, while some mutual funds are reticent to exercise their power during
voting mainly in the US, an activist stance is observed for some smaller funds and when operating
outside the US [19]. In any case, in our study US mutual funds represent only a small fraction
of all global financial institutions.
8.2 Relation to the Rich Club Phenomenon
The so-called rich club phenomenon [20, 21] refers to the fact that in some complex networks
the nodes with the highest degree tend to be connected among each other. Being based solely
‡For example, a mutual fund owning some percent of a large corporation may try to impose job cuts because of
a weak economic situation. This can happen: (i) without voting and (ii) although the fund does not plan to keep
these shares for many years. In this case, the influence of the mutual fund has a direct impact on the company and
its employees. Furthermore, mutual funds with shares in many corporations may try to pursue similar strategies
across their entire portfolio.
31/36
S. Vitali, J.B. Glattfelder, and S. Battiston:The network of global corporate control
on node degree, rich club indices are not suitable for ownership networks, in which indirect and
weighted paths matter. Moreover, in order to benchmark the resulting value of rich club indices,
it is usually necessary to reshuffle the links in the network. This would be a problem in our
network because it would lead to economically unviable ownership networks. Notice, however,
that the core of the TNC network could be seen as a generalization of the rich club phenomenon
with control in the role of degree. Thus, future work should look into this issue more in depth.
8.3 Top Control-Holders Ranking
This is the first time a ranking of economic actors by global control is presented. Notice that
many actors belong to the financial sector (NACE codes starting with 65,66,67) and many of
the names are well-known global players. The interest of this ranking is not that it exposes
unsuspected powerful players. Instead, it shows that many of the top actors belong to the core.
This means that they do not carry out their business in isolation but, on the contrary, they are
tied together in an extremely entangled web of control. This finding is extremely important since
there was no prior economic theory or empirical evidence regarding whether and how top players
are connected.
32/36
S. Vitali, J.B. Glattfelder, and S. Battiston:The network of global corporate control
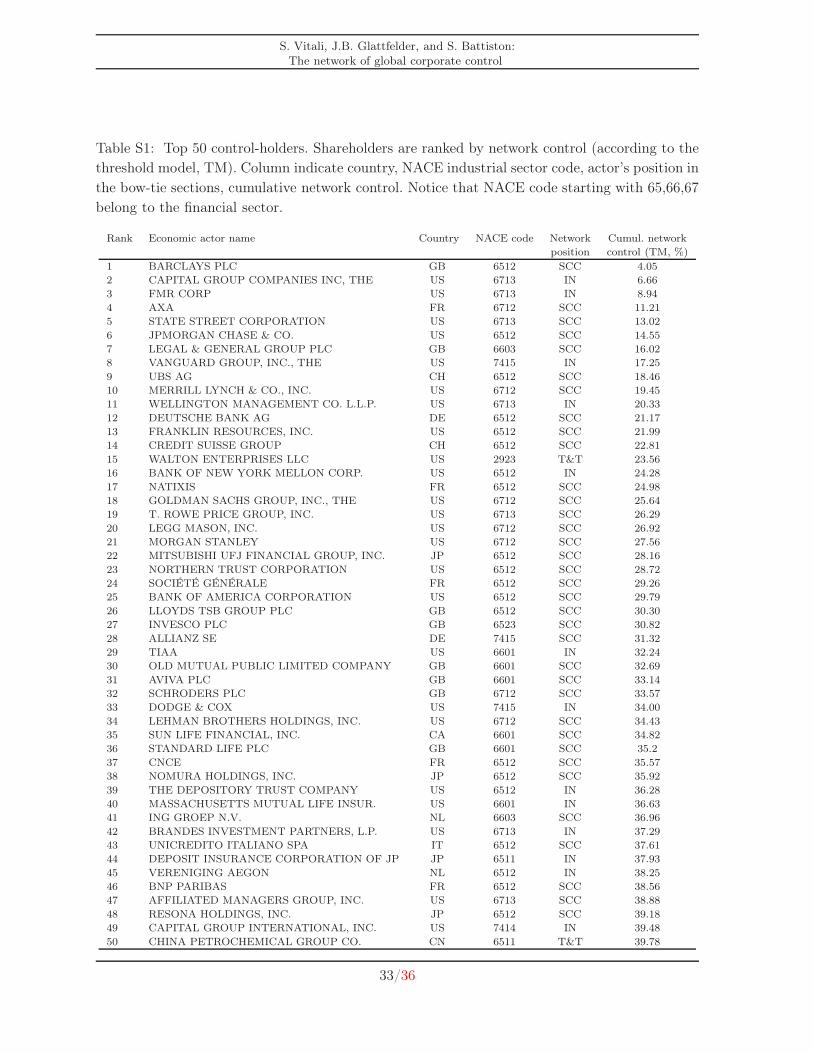
Table S1: Top 50 control-holders. Shareholders are ranked by network control (according to the
threshold model, TM). Column indicate country, NACE industrial sector code, actor’s position in
the bow-tie sections, cumulative network control. Notice that NACE code starting with 65,66,67
belong to the financial sector.
Rank Economic actor name Country NACE code Network Cumul. networkposition control (TM, %)
1 BARCLAYS PLC GB 6512 SCC 4.052 CAPITAL GROUP COMPANIES INC, THE US 6713 IN 6.663 FMR CORP US 6713 IN 8.944 AXA FR 6712 SCC 11.215 STATE STREET CORPORATION US 6713 SCC 13.026 JPMORGAN CHASE & CO. US 6512 SCC 14.557 LEGAL & GENERAL GROUP PLC GB 6603 SCC 16.028 VANGUARD GROUP, INC., THE US 7415 IN 17.259 UBS AG CH 6512 SCC 18.4610 MERRILL LYNCH & CO., INC. US 6712 SCC 19.4511 WELLINGTON MANAGEMENT CO. L.L.P. US 6713 IN 20.3312 DEUTSCHE BANK AG DE 6512 SCC 21.1713 FRANKLIN RESOURCES, INC. US 6512 SCC 21.9914 CREDIT SUISSE GROUP CH 6512 SCC 22.8115 WALTON ENTERPRISES LLC US 2923 T&T 23.5616 BANK OF NEW YORK MELLON CORP. US 6512 IN 24.2817 NATIXIS FR 6512 SCC 24.9818 GOLDMAN SACHS GROUP, INC., THE US 6712 SCC 25.6419 T. ROWE PRICE GROUP, INC. US 6713 SCC 26.2920 LEGG MASON, INC. US 6712 SCC 26.9221 MORGAN STANLEY US 6712 SCC 27.5622 MITSUBISHI UFJ FINANCIAL GROUP, INC. JP 6512 SCC 28.1623 NORTHERN TRUST CORPORATION US 6512 SCC 28.7224 SOCIÉTÉ GÉNÉRALE FR 6512 SCC 29.2625 BANK OF AMERICA CORPORATION US 6512 SCC 29.7926 LLOYDS TSB GROUP PLC GB 6512 SCC 30.3027 INVESCO PLC GB 6523 SCC 30.8228 ALLIANZ SE DE 7415 SCC 31.3229 TIAA US 6601 IN 32.2430 OLD MUTUAL PUBLIC LIMITED COMPANY GB 6601 SCC 32.6931 AVIVA PLC GB 6601 SCC 33.1432 SCHRODERS PLC GB 6712 SCC 33.5733 DODGE & COX US 7415 IN 34.0034 LEHMAN BROTHERS HOLDINGS, INC. US 6712 SCC 34.4335 SUN LIFE FINANCIAL, INC. CA 6601 SCC 34.8236 STANDARD LIFE PLC GB 6601 SCC 35.237 CNCE FR 6512 SCC 35.5738 NOMURA HOLDINGS, INC. JP 6512 SCC 35.9239 THE DEPOSITORY TRUST COMPANY US 6512 IN 36.2840 MASSACHUSETTS MUTUAL LIFE INSUR. US 6601 IN 36.6341 ING GROEP N.V. NL 6603 SCC 36.9642 BRANDES INVESTMENT PARTNERS, L.P. US 6713 IN 37.2943 UNICREDITO ITALIANO SPA IT 6512 SCC 37.6144 DEPOSIT INSURANCE CORPORATION OF JP JP 6511 IN 37.9345 VERENIGING AEGON NL 6512 IN 38.2546 BNP PARIBAS FR 6512 SCC 38.5647 AFFILIATED MANAGERS GROUP, INC. US 6713 SCC 38.8848 RESONA HOLDINGS, INC. JP 6512 SCC 39.1849 CAPITAL GROUP INTERNATIONAL, INC. US 7414 IN 39.4850 CHINA PETROCHEMICAL GROUP CO. CN 6511 T&T 39.78
33/36
S. Vitali, J.B. Glattfelder, and S. Battiston:The network of global corporate control
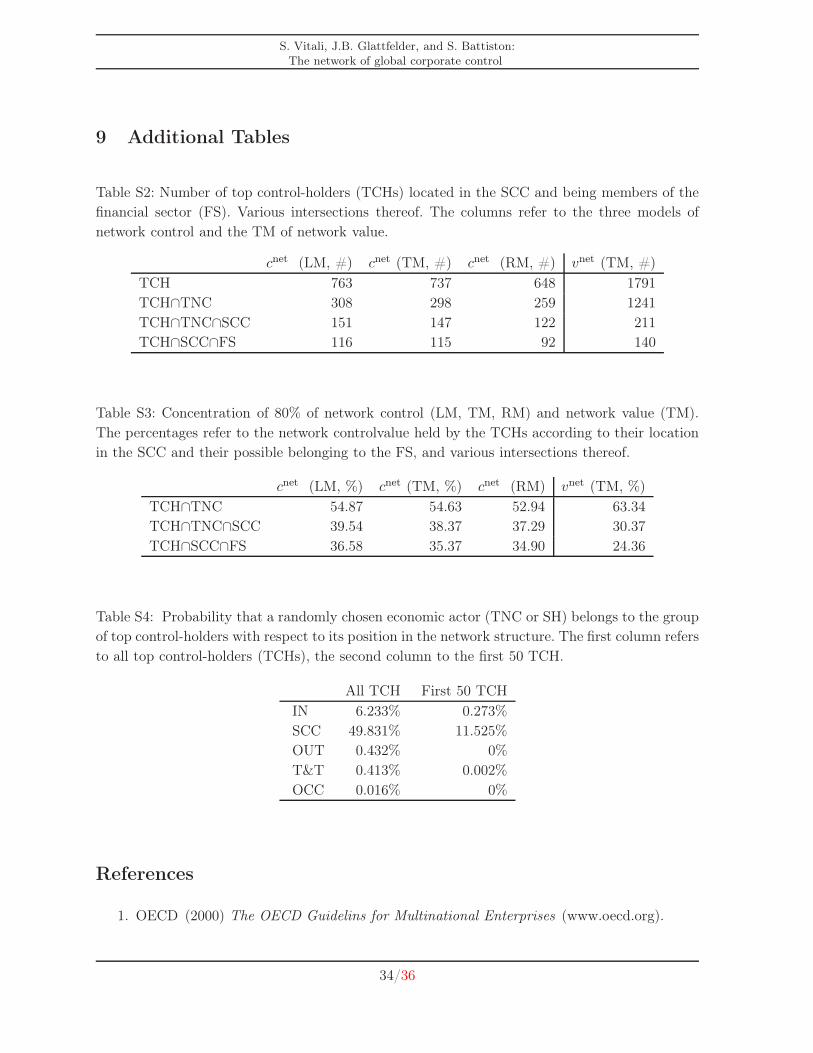
9 Additional Tables
Table S2: Number of top control-holders (TCHs) located in the SCC and being members of the
financial sector (FS). Various intersections thereof. The columns refer to the three models of
network control and the TM of network value.
cnet (LM, #) cnet (TM, #) cnet (RM, #) vnet (TM, #)
TCH 763 737 648 1791
TCH∩TNC 308 298 259 1241
TCH∩TNC∩SCC 151 147 122 211
TCH∩SCC∩FS 116 115 92 140
Table S3: Concentration of 80% of network control (LM, TM, RM) and network value (TM).
The percentages refer to the network controlvalue held by the TCHs according to their location
in the SCC and their possible belonging to the FS, and various intersections thereof.
cnet (LM, %) cnet (TM, %) cnet (RM) vnet (TM, %)
TCH∩TNC 54.87 54.63 52.94 63.34
TCH∩TNC∩SCC 39.54 38.37 37.29 30.37
TCH∩SCC∩FS 36.58 35.37 34.90 24.36
Table S4: Probability that a randomly chosen economic actor (TNC or SH) belongs to the group
of top control-holders with respect to its position in the network structure. The first column refers
to all top control-holders (TCHs), the second column to the first 50 TCH.
All TCH First 50 TCH
IN 6.233% 0.273%
SCC 49.831% 11.525%
OUT 0.432% 0%
T&T 0.413% 0.002%
OCC 0.016% 0%
References
1. OECD (2000) The OECD Guidelins for Multinational Enterprises (www.oecd.org).
34/36

S. Vitali, J.B. Glattfelder, and S. Battiston:The network of global corporate control
2. Goergen, M, Martynova, M, Renneboog, L (2005) Corporate governance convergence:
evidence from takeover regulation reforms in Europe. Oxford Rev. Econ.Pol. 21:243–268.
3. The Deminor Group (2005) Application of the one share - one vote principle in europe.,
(http://www.abi.org.uk/Bookshop/), Technical report.
4. La Porta, R, de Silanes, FL, Shleifer, A (1999) Corporate ownership around the world. J.
Finance 54:471–517.
5. Glattfelder, JB, Battiston, S (2009) Backbone of complex networks of corporations: The
flow of control. Phys. Rev. E 80.
6. Brioschi, F, Buzzacchi, L, Colombo, M (1989) Risk capital financing and the separation
of ownership and control in business groups. J. Bank. Financ. 13:747–772.
7. Bonacich, P (1987) Power and centrality: A family of measures. Amer. J. Sociol. pp
1170–1182.
8. Ballester, C, Calvo-Armengol, A, Zenou, Y (2006) Who’s who in networks. wanted: the
key player. Econometrica pp 1403–1417.
9. Hubbell, C (1965) An input-output approach to clique identification. Sociometry pp
377–399.
10. Baldone, S, Brioschi, F, Paleari, S (1998) Ownership Measures Among Firms Connected
by Cross-Shareholdings and a Further Analogy with Input-Output Theory. 4th JAFEE
International Conference on Investment and Derivatives.
11. Dorogovtsev, S, Mendes, J, Samukhin, A (2001) Giant strongly connected component of
directed networks. Phys. Rev. E 64:25101.
12. Davis, G (2008) A new finance capitalism? Mutual funds and ownership re-concentration
in the United States. Europ. Manage. Rev. 5:11–21.
13. Weber, M (1922) Wirtschaft und Gesellschaft, Tübingen. Max Weber im Kontext. InfoS-
oftWare Karsten Worm, Berlin 2.
14. Santos, J, Rumble, A (2006) The American keiretsu and universal banks: Investing, voting
and sitting on nonfinancials’ corporate boards. J. Finan. Econ. 80:419–454.
15. Becht, M, Bolton, P, Röell, A, Roosevelt, A (2005) Corporate governance and control.
NBER.
16. Gillan, S, Starks, L (2000) Corporate governance proposals and shareholder activism: The
role of institutional investors. J. Finan. Econ. 57:275–305.
35/36

S. Vitali, J.B. Glattfelder, and S. Battiston:The network of global corporate control
17. Davis, G, Thompson, T (1994) A social movement perspective on corporate control.
Admin. Sci. Quart. 39:141–173.
18. Davis, G, Kim, E (2007) Business ties and proxy voting by mutual funds. J. Finan. Econ.
85:552–570.
19. Davis, G (2008) A new finance capitalism? Mutual funds and ownership re-concentration
in the United States. Euro. Manage. Rev. 5:11–21.
20. Colizza, V, Flammini, A, Serrano, M, Vespignani, A (2006) Detecting rich-club ordering
in complex networks. Nat. Phy. 2:110–115.
21. Fagiolo, G, Reyes, J, Schiavo, S (2009) World-trade web: Topological properties, dynamics,
and evolution. Phys. Rev. E 79:36115.
36/36