the negative phase of the blast load - white rose …eprints.whiterose.ac.uk/78295/8/rigby et al. -...
TRANSCRIPT

This is a repository copy of The Negative Phase of the Blast Load.
White Rose Research Online URL for this paper:http://eprints.whiterose.ac.uk/78295/
Article:
Rigby, S.E., Tyas, A., Bennett, T. et al. (2 more authors) (2014) The Negative Phase of the Blast Load. International Journal of Protective Structures, 5 (1). 1 -20. ISSN 2041-4196
https://doi.org/10.1260/2041-4196.5.1.1
[email protected]://eprints.whiterose.ac.uk/
Reuse
Unless indicated otherwise, fulltext items are protected by copyright with all rights reserved. The copyright exception in section 29 of the Copyright, Designs and Patents Act 1988 allows the making of a single copy solely for the purpose of non-commercial research or private study within the limits of fair dealing. The publisher or other rights-holder may allow further reproduction and re-use of this version - refer to the White Rose Research Online record for this item. Where records identify the publisher as the copyright holder, users can verify any specific terms of use on the publisher’s website.
Takedown
If you consider content in White Rose Research Online to be in breach of UK law, please notify us by emailing [email protected] including the URL of the record and the reason for the withdrawal request.

The Negative Phase of the Blast Load
by
Sam E. Rigby, Andrew Tyas, Terry Bennett, Sam D. Clarke, Stephen D. Fay
Reprinted from
International Journal of
Protective Structures
Volume 5 · Number 1 · March 2014
Multi-Science Publishing
ISSN 2041-4196

The Negative Phase of the Blast Load
Sam E. Rigbya*, Andrew Tyasa,b,Terry Bennettc, Sam D. Clarkea, Stephen D. Faya,b
aDepartment of Civil & Structural Engineering, University of Sheffield,Mappin Street, Sheffield, S1 3JD, UK.
bBlastech Ltd., The BioIncubator,40 Leavygreave Road, Sheffield, S3 7RD, UK.
cSchool of Civil, Environmental & Mining Engineering,North N136, North Terrace Campus, The University of Adelaide,
SA 5005, Australia
Received on 06 Nov 2013, Accepted on 2 Dec 2013
AABBSSTTRRAACCTT
Following the positive phase of a blast comes a period where the
pressure falls below atmospheric pressure known as the negative
phase. Whilst the positive phase of the blast is well understood,
validation of the negative phase is rare in the literature, and as such it
is often incorrectly treated or neglected altogether. Herein, existing
methods of approximating the negative phase are summarised and
recommendations of which form to use are made based on
experimental validation. Also, through numerical simulations, the
impact of incorrectly modelling the negative phase has been shown
and its implications discussed.
KKeeyy wwoorrddss:: Blast; Dynamic response; Experiment; Negative phase; SDOF;
Validation
11.. IINNTTRROODDUUCCTTIIOONNAn explosion is characterised by the rapid release of energy as a mass of reactive material is
converted into an extremely dense region of high pressure gas. This gas rapidly expands and
displaces the surrounding air, causing a pressure disturbance – a blast wave – to propagate
away from the centre of the explosive at supersonic speed. As the blast wave travels through
the air, the front of the pressure disturbance ‘shocks up’, resulting in a near-discontinuous
increase in pressure, density and temperature. Following the shock front the pressure decays
until ambient pressure is reached, the duration of which is known as the positive phase
duration. The positive phase of the blast load acting on a structure can be described by the
semi-empirical ‘modified Friedlander equation’ [1]
(1)p t pr r
d
bt tdt
te( )
,max
/–=
−1
International Journal of Protective Structures – Volume 5 · Number 1 · 2014 1
*Corresponding author. Tel.: + 44 (0) 114 222 5724. Email address: [email protected]
where pr,max is the peak reflected pressure, td is the positive phase duration and b is the
coefficient that describes the rate of decay of the pressure-time curve, known as the
waveform or decay parameter.
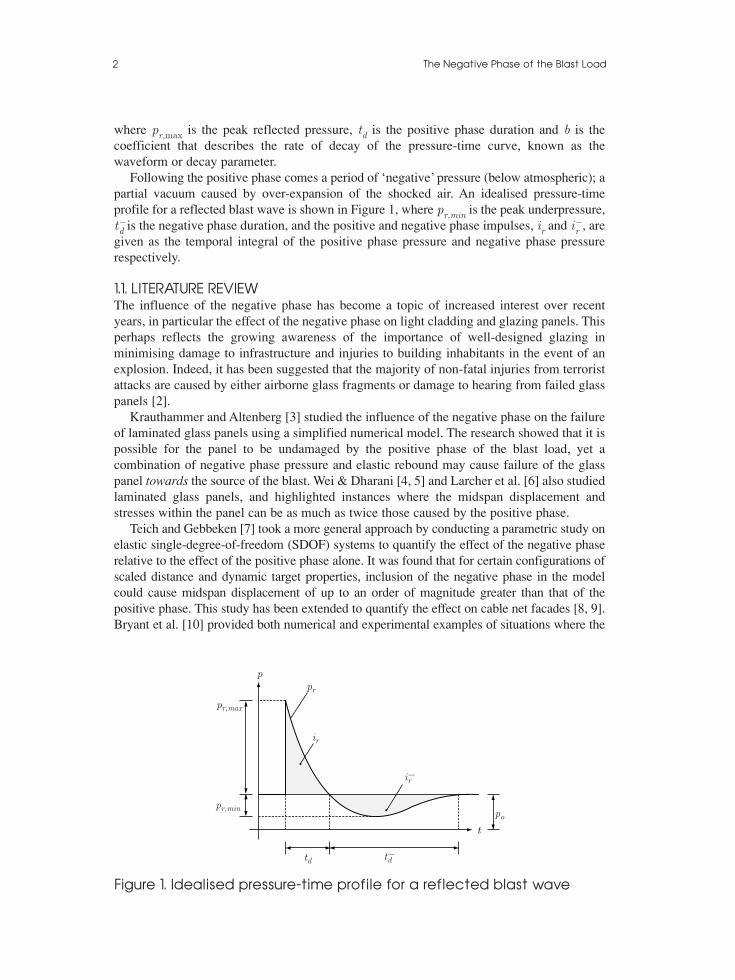
Following the positive phase comes a period of ‘negative’ pressure (below atmospheric); a
partial vacuum caused by over-expansion of the shocked air. An idealised pressure-time
profile for a reflected blast wave is shown in Figure 1, where pr,min is the peak underpressure,
t−d is the negative phase duration, and the positive and negative phase impulses, ir and i−r , are
given as the temporal integral of the positive phase pressure and negative phase pressure
respectively.
1.1. LITERATURE REVIEWThe influence of the negative phase has become a topic of increased interest over recent
years, in particular the effect of the negative phase on light cladding and glazing panels. This
perhaps reflects the growing awareness of the importance of well-designed glazing in
minimising damage to infrastructure and injuries to building inhabitants in the event of an
explosion. Indeed, it has been suggested that the majority of non-fatal injuries from terrorist
attacks are caused by either airborne glass fragments or damage to hearing from failed glass
panels [2].
Krauthammer and Altenberg [3] studied the influence of the negative phase on the failure
of laminated glass panels using a simplified numerical model. The research showed that it is
possible for the panel to be undamaged by the positive phase of the blast load, yet a
combination of negative phase pressure and elastic rebound may cause failure of the glass
panel towards the source of the blast. Wei & Dharani [4, 5] and Larcher et al. [6] also studied
laminated glass panels, and highlighted instances where the midspan displacement and
stresses within the panel can be as much as twice those caused by the positive phase.
Teich and Gebbeken [7] took a more general approach by conducting a parametric study on
elastic single-degree-of-freedom (SDOF) systems to quantify the effect of the negative phase
relative to the effect of the positive phase alone. It was found that for certain configurations of
scaled distance and dynamic target properties, inclusion of the negative phase in the model
could cause midspan displacement of up to an order of magnitude greater than that of the
positive phase. This study has been extended to quantify the effect on cable net facades [8, 9].
Bryant et al. [10] provided both numerical and experimental examples of situations where the
2 The Negative Phase of the Blast Load
pr,max
pr,min
td
p
t
po
t−d
ir
i−r
pr
Figure 1. Idealised pressure-time profile for a reflected blast wave

negative phase causes adverse target response, and also highlighted the limitations of shock
tube testing to accurately replicate free-field negative phase pressures and impulses, on account
of the inability of a shock tube to replicate the effect of the rising fireball [11].
Whilst these studies show that the negative phase cannot be ignored for certain blast
scenarios, and indeed some effort has been undertaken to define the situations where ignoring
the negative phase is un-conservative, there remains some uncertainty on the issue of how to
properly model the form of the negative phase pressure-time history. The purpose of the paper
is therefore two-fold. Firstly, existing methods of modelling the negative phase will be
summarised and recommendations of which form to use will be made based on experimental
validation. Secondly, through numerical simulations, the impact of ignoring or incorrectly
modelling the negative phase will be shown and its implications discussed.
22.. PPRREEDDIICCTTIINNGG BBLLAASSTT WWAAVVEE PPAARRAAMMEETTEERRSSThe positive phase of the blast load is well understood, with the Kingery and Bulmash [12]
empirical blast parameters well-established in the current literature [13, 14, 15]. These blast
predictions are implemented into the automated predictive tool ConWep [16]. Bogosian
et al. [17] showed that there was generally good correlation between the Kingery and
Bulmash (KB) predictions and empirical data from blast trials, but with some considerable
spread. It is possible that this was due to the fact that the empirical data was generally from
field trials involving very large explosions, with the consequent difficulties in carefully
controlling the test parameters. Recent work by the authors [18, 19] indicates that in small
scale, carefully controlled experimental trials, the correlation between empirical data and the
KB predictions for the positive phase parameters is remarkably good.
Negative phase parameters are also available in the literature [13, 15]. However, as
Bogosian et al. [17] noted in their review, “The precise provenance of these curves isunknown at the present time.” They suggested that this uncertainty is due in part to the
fact that “Not all (experimental data records) were of sufficient duration and/or quality as
to be able to extract negative as well as positive values, and while some had dubious peak
pressure readings, others became suspect at later time and therefore could not produce
reliable impulses.” This is perhaps inevitable in the large scale experimental tests that
formed the basis of the data analysed in that work.
The original source of the negative phase parameters presented in [13] is unclear, although
a thorough review of the available literature as part of the current study indicates that it may
have been from analytical work conducted in the 1950 s by Granström [20]. Figure 2 shows
the relationship between reflected positive and negative phase blast parameters with scaled
distance,
(2)
where R is the distance from the target to the source of the explosive and W is the mass of
explosive expressed as an equivalent mass of TNT. Note that impulse and time parameters
are scaled by the cube root of the charge mass, after Hopkinson-Cranz scaling [21].
In this study, simplified parameter expressions have been determined by digitizing the
negative phase data presented in [13] and fitting curves to the data points. Relationships for
negative reflected pressure and impulse (for hemispherical surface bursts) are given in
equations 3 and 4 respectively, and can be used to determine the relevant loading parameters.
=ZR
W3
International Journal of Protective Structures – Volume 5 · Number 1 · 2014 3

(3)
(4)
For small scaled distances, the peak underpressure and negative phase impulse are very
small relative to the positive phase. It is clear, however, from Figure 2 that this observation
is only true for small values of Z, and that the negative phase impulse approaches that of the
positive phase for larger scaled distances and eventually exceeds the positive phase impulse
when Z > 8. In free-field blast experiments, the rising fireball creates a lower pressure near
the ground surface, which draws in the surrounding air. This has the effect of further
lowering the air density, which has already been over-expanded after the shockwave has
passed, and hence results in larger negative phase impulses at larger stand-off distances [11].
= ×
− + +
− +< ≤< ≤< ≤< ≤
−
−
−
i Z W
Z Z
Z Z
Z
Z
Z
Z
Z
Z
( )
,
. ,
,
,
. .
. .
. .
. .
( )r .
.
724 445 553
11 4 315 752
462
434
0 071 0 580
0 580 1 19
1 19 5 25
5 25 37 6
kPa.ms3
2
2
0 880
0 842
p ZZ Z
Zr ,min .( )
,
. . ,
. ,=− + +
−
101
32 9 13 0 106
93 0
2
1 22
773 0
0 071 0 668
0 668 1 27
1 270 978. ,
. .
. .
..Z
Z
Z
−
< ≤< ≤<ZZ
Z
≤< ≤
2 78
2 78 37 6
.
. .
( )kPa
4 The Negative Phase of the Blast Load
Pre
ssu
re (
MP
a),
im
pu
lse
(M
Pa
.ms/k
g1
/3),
tim
e (
ms/k
g1
/3)
10−1 101
pr,maxpr,min
ir/W 1/3
i−r/W 1/3
td/W 1/3
t−d/W 1/3
ta/W 1/3
10010−3
10−2
10−1
100
101
102
103
Scaled distance, Z (m/kg1/3)
Figure 2. Positive and negative phase reflected blast wave parametersfor hemispherical charges of TNT on the surface [12, 13]

33.. TTHHEE FFOORRMM OOFF TTHHEE NNEEGGAATTIIVVEE PPHHAASSEE3.1. LINEAR APPROXIMATIONOne way of modelling the blast pressure is with a piecewise linear function, as is the
approach of Krauthammer and Altenberg [3]. The positive phase is approximated as a
linearly decaying triangular pulse, with the linear load duration, td,lin, set such that the
impulse given by the triangular load matches that given by the empirical method, i.e.
td,lin = 2ir/pr,max. The negative phase is modelled as a bilinear approximation with a rise
time equal to 1/4 of the negative phase duration. As per the positive phase, the linear negative
phase duration, t–d,lin, is specified to preserve negative phase impulse, i.e.
t–d,lin = 2i–r/pr,min. The negative phase begins at td , rather than td,lin, giving a period of zero
pressure between the linear positive and negative phase. This approach is also recommended
in UFC-3-340-02 [13], with the piecewise expression given in equation 5.
3.2. EXTENDED FRIEDLANDERAnother common method of modelling the negative phase is to simply extend the
Friedlander equation (1) to t = ∞, rather than truncating the expression at td. This is the
approach adopted by Wei & Dharani [4, 5], Gantes [22] and the *LOAD_BLAST subroutine in
LS-DYNA [23]. Given the ConWep positive phase parameters for pressure, duration and
impulse, the waveform parameter can be determined by integrating the Friedlander
expression over the positive phase to give
(6)
which can be solved iteratively to determine the value of b which gives the correct impulse
at that particular scaled distance.
As the negative phase is also constructed from this expression, it is clear that the form of
this negative phase is entirely dependent on the positive phase parameters. As such there are
no variables to control negative phase pressure and impulse – the values given by this
approximation may not match the empirical predictions. Integrating the negative phase of the
Friedlander equation gives the impulse as
i pt
te
p
r r
t
d
bt tdd= −
=∫
−
,
r
max01
/ ,,
2b
maxt
b ed b− +( )−1
(5)
International Journal of Protective Structures – Volume 5 · Number 1 · 2014 5

(7)
at Z = 10 m/kg1/ 3, for example, ConWep gives pr,max = 31.54 kPa, ir/W 1/ 3 = 59.33
kPa.ms/kg1/ 3 and td /W 1/ 3 = 4.788 ms/kg1/ 3. Iterating equation 6 gives the waveform
parameter, b = 0.771. When these parameters are used as input in equation 7, the negative
phase impulse is given as i−r /W1/ 3 = 118 kPa.ms/kg1/ 3, whereas the parameter relationship
in the literature, shown in Figure 2 and equation 4, gives the negative phase impulse as
i−r /W1/ 3 = 62 kPa.ms/kg1/3.
3.3. EXTENDED FRIEDLANDER WITH TEICH C –r
In order to better control the form of the negative phase, Teich & Gebbeken [7] introduce the
negative phase reflection coefficient, C –r , which is a function of the scaled distance,
(8)
and also offer a scaled distance relationship for an improved waveform parameter
(9)
This enables the value of extended Friedlander peak underpressure to be better matched to
the published empirical value at that particular scaled distance (e.g. Figure 2 and equation 3),
giving the piecewise positive and negative phase expression1 as
(10)
Although the introduction of the negative phase reflection coefficient allows the peak
negative phase pressure to be controlled, the new waveform parameter, α, is again given to
match the positive phase impulse of the Friedlander expression to empirical predictions, i.e.
there remains no variable to control the negative phase impulse.
The Teich extended Friedlander gives the negative phase impulse as
(11)
where, for Z = 10 m/kg1/3, the ConWep peak incident pressure, pso,max = 14.81 kPa and
the reflection coefficient and waveform parameter, C –r = 1.855 and α = 0.625 from
i C pt
te
C
r r so
d
t td− − −= −
=
,max
/1
α rr so d
t
p te
d
−
−∞
∫ ,max ,α
α
2
=
−
≤
−
≤
α
α
−
−−
p t
pt
te t t
C pt
te t t
( )
,
,
r
r
d
t
t
d
r so
d
t
t
d
,max
,max
d
d
1
1
α= < <−1 5 0 1 300 38. . ..Z Zfor
CZ
ZZ
r
− =−
>1 9 0 45
05. .
for
i pt
te
p
r
d
bt td− −= −
=
r,
r,
max
ma1
/ xxt
ed b
td b2
−∞
∫ ,
6 The Negative Phase of the Blast Load
1In Teich and Gebbeken’s formulation, pr,max is replaced by Crpso,max, however for consistency with the positive phase
expressions in this article, the former notation is adopted

equations 8 and 9 respectively, gives the Teich extended Friedlander negative phase
impulse as i –r /W1/3 = 180 kPa.ms/kg1/3. Again this is far greater than the empirical
prediction. Furthermore, in both ‘extended Friedlander’ approaches, the blast pressure will
have a finite pressure value (albeit very small) for all values of t, hence the duration of the
load, and also the impulse, cannot always be accurately captured with an extended
Friedlander expression.
3.4. CUBIC NEGATIVE PHASEAlternatively, the blast load can be constructed as a piecewise pressure-time function using the
Friedlander positive phase [21] and a cubic expression for the negative phase, shown in
equation 12. This negative phase expression is given by Granström [20], and, although the
origin of the expression is unclear, it appears as though it is a fit to early numerical simulations.
It is worth noting that the negative phase expression given does not vary with scaled distance
and instead is a general fit to the form of the negative phase. The Granström expression is
recommended by the Naval Facilities Engineering Command Design Manual 2.08, Blast
Resistant Structures [24], and the US Army Blast Effects Design Spreadsheet (SBEDS) [25].
(12)
With this expression, the negative phase duration is corrected such that the integral of the
cubic expression gives the same impulse as that given by the empirical prediction in equation
4, i.e. t−d= 16i –
r / 9pr,min.
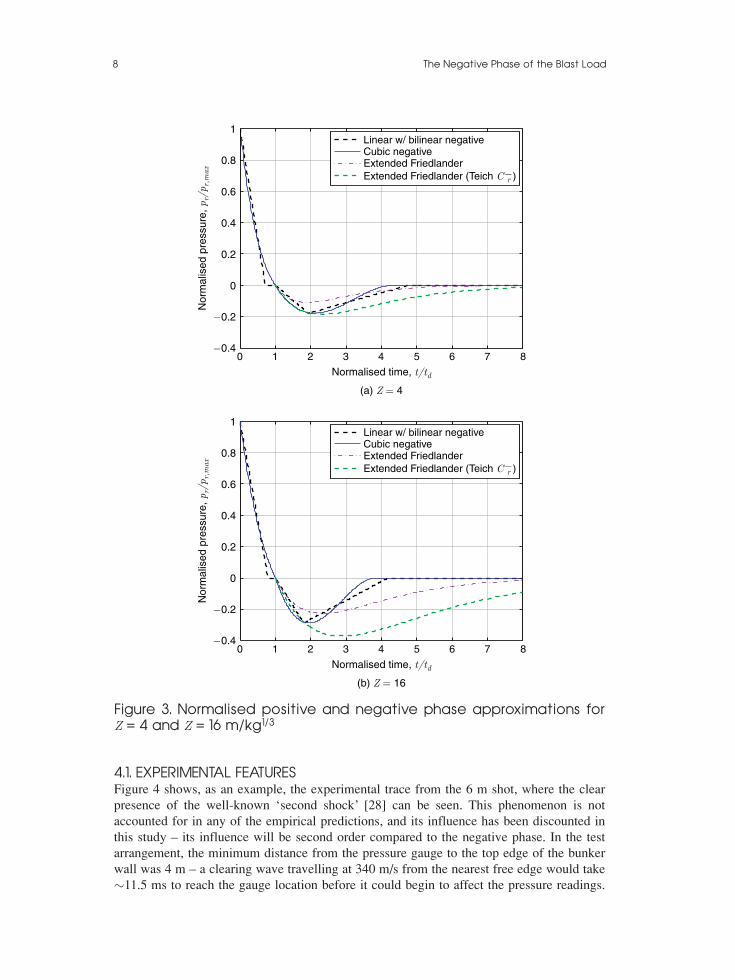
Figure 3 shows normalised pressure-time histories for the different negative phase
approximations at Z = 4 and Z = 16 m/kg1/3. It is clear that the choice of negative phase
approximation has a significant impact on the form of the blast pressure history.
44.. EEXXPPEERRIIMMEENNTTAALL VVAALLIIDDAATTIIOONN OOFF NNEEGGAATTIIVVEE PPHHAASSEE AAPPPPRROOXXIIMMAATTIIOONNSSThe lack of agreement between the different negative phase expressions highlights the need
for a well validated negative phase model. In this section, a simple experimental validation
is provided and recommendations are given on which approximation to use.
A number of blast trials were conducted at the University of Sheffield Blast & Impact
Laboratory, Buxton, UK. 0.25 kg PE4 hemispherical explosive charges were detonated
4 m, 6 m, 8 m and 10 m away from and orthogonal to the external wall of a reinforced
concrete bunker, forming a large, effectively rigid target, such that fluid-structure
interaction effects [26, 27] could be ignored. The charges were detonated on a 50 mm
thick steel plate, placed on a level, flat concrete ground slab, enabling the detonation to
be considered as a hemispherical surface burst. A Kulite HKM 7 bar pressure gauge was
placed 375 mm from the base of the target, and pressure was recorded using a 16-Bit
Digital Oscilloscope at a sample rate of 100 kHz, synchronised with the detonation.
p t
pt
te t t
r
r
d
bt
t
dd
( )
,,max
=
−
≤
−
1
−−−( )
−−
−p
t t
t
t t
r
d
d
,min
.6 751
dd
d
d d dt
t t t t( )
< ≤ +
−
−
2
,
International Journal of Protective Structures – Volume 5 · Number 1 · 2014 7
4.1. EXPERIMENTAL FEATURESFigure 4 shows, as an example, the experimental trace from the 6 m shot, where the clear
presence of the well-known ‘second shock’ [28] can be seen. This phenomenon is not
accounted for in any of the empirical predictions, and its influence has been discounted in
this study – its influence will be second order compared to the negative phase. In the test
arrangement, the minimum distance from the pressure gauge to the top edge of the bunker
wall was 4 m – a clearing wave travelling at 340 m/s from the nearest free edge would take
∼11.5 ms to reach the gauge location before it could begin to affect the pressure readings.
8 The Negative Phase of the Blast Load
0 1 2 3 4 5 6 7 8
0
−0.2
−0.4
0.2
0.4
0.6
0.8
1
Norm
alis
ed p
ressure
, p
r/p
r,m
ax
Normalised time, t/td
(a) Z = 4
0 1 2 3 4 5 6 7 8
0
−0.2
−0.4
0.2
0.4
0.6
0.8
1
Norm
alis
ed p
ressure
, p
r/p
r,m
ax
Normalised time, t/td
(b) Z = 16
Linear w/ bilinear negativeCubic negativeExtended Friedlander
Extended Friedlander (Teich C −r )
Linear w/ bilinear negativeCubic negativeExtended Friedlander
Extended Friedlander (Teich C −r )
Figure 3. Normalised positive and negative phase approximations forZ = 4 and Z = 16 m/kg1/3

Again, this can be seen in the experimental readings in Figure 4 and perhaps more clearly in
Figure 5. This feature should be noted in subsequent analysis, but is clearly of relatively low
relevance and the trace can be considered to be almost unaffected by clearing. The distance
from the pressure gauge to the side edges of the bunker wall was greater than 4 m, ensuring
that clearing effects from the side edges could be neglected.
4.2. VALIDATIONFigure 5 shows the experimental and predicted negative phase pressure-time histories and
Figure 6 shows the experimental and predicted impulse-time histories. Negative phase
approximations were constructed assuming a 1.20 TNT equivalence of PE4 [18], giving a
charge mass, W, of 0.3 kg and scaled distances of 6.0, 9.0, 12.0 and 14.9 m/kg1/3.
Apart from the second shock at the beginning of the negative phase (annotated in Figure
4) on the experimental traces, the cubic negative phase matches the experimental traces
remarkably well, both in terms of peak negative pressure and general form of the negative
phase. The linear expression gives a good approximation to the peak underpressure but is not
quite as accurate at matching the shape of the negative phase. Neither extended Friedlander
expressions match the experimental traces very well, particularly for the larger scaled
distances.
Table 1 gives the values of peak impulse determined from the experimental traces and the
negative phase approximations shown in Figure 6 – the time axis is truncated at 25 ms after
detonation, before the extended Friedlander expressions reach their peak impulse value,
which can be determined from the equations given in the previous section. The cubic
expression can model the negative phase impulse to within 10–25% of the experimental
values – the over-prediction can be primarily attributed to neglecting the second shock. The
linear negative phase expression and cubic expressions are impulse-corrected to match
the values given by the empirical parameter relationships; hence their impulse values are the
same despite the waveforms being different. It is worth pointing out that the positive phase
International Journal of Protective Structures – Volume 5 · Number 1 · 2014 9
0 2 4 6 8 10 12 14 16
0
−5
−10
5
10
15
20
25
30
35
40
Reflecte
d o
verp
ressure
(kP
a)
Time after arrival (ms)
Second shock
Diffraction from top edge
Figure 4. Experimental trace for 0.3 kg TNT at 6 m, with second shockand diffraction features annotated

impulse predictions from ConWep matched the experimental positive phase impulse to
within 5% for the whole test series.
To further illustrate the difference in impulses given by the negative phase
approximations, Figure 7 shows the relationship between normalised net impulse
([ir + i−r ]/ir) and scaled distance, Z. Here it can be seen how much the extended Friedlander
approaches differ from the experimental (and cubic) impulses – the extended Friedlander
expression using the Teich reflection coefficient gives a negative phase impulse of over an
order of magnitude greater than the positive phase impulse for Z > 30 m/kg1/3.
It is acknowledged that the negative phase requires more stringent validation as well as a
larger experimental database than those provided as part of this study. However, at this stage
it is clear that the empirical predictions appear to be a good indication of the loading
10 The Negative Phase of the Blast Load
0 5 10 15 20 25
0
−2
−4
−6
−8
−10
−12
−14
Re
fle
cte
d o
verp
ressu
re (
kP
a)
Time after arrival (ms)
(a) 4 m
0 5 10 15 20 25
0
−2
−4
−6
−8
−10Re
fle
cte
d o
verp
ressu
re (
kP
a)
Re
fle
cte
d o
verp
ressu
re (
kP
a)
0
−3
−2
−1
−4
−5
−6
−7
0
−3
−2
−1
−4
−5
−6
−7
−8
−9
Re
fle
cte
d o
verp
ressu
re (
kP
a)
Time after arrival (ms)
(b) 6 m
0 5 10 15 20 25
Time after arrival (ms)
(c) 8 m
0 5 10 15 20 25
Time after arrival (ms)
(d) 10 m
Experimental
Bilinear negative
Cubic negative
Extended Friedlander
Extended Friedlander (Teich C −r )
Figure 5. Negative phase approximations for a 0.25 kg hemisphericalPE4 (0.3 kg TNT) charge

International Journal of Protective Structures – Volume 5 · Number 1 · 2014 11
0 5 10 15 20 250
20
40
60
80
100
120
140N
eg
ative
ph
ase
re
fle
cte
d im
pu
lse
(kP
a.m
s)
Time after arrival (ms)
(a) 4 m
0 5 10 15 20 250
20
40
60
80
100
120
140
Ne
ga
tive
ph
ase
re
fle
cte
d im
pu
lse
(kP
a.m
s)
Time after arrival (ms)
(b) 6 m
0 5 10 15 20 250
20
40
60
80
100
120
140
Ne
ga
tive
ph
ase
re
fle
cte
d im
pu
lse
(kP
a.m
s)
Time after arrival (ms)
(c) 8 m
0 5 10 15 20 250
20
40
60
80
100
120
140
Ne
ga
tive
ph
ase
re
fle
cte
d im
pu
lse
(kP
a.m
s)
Time after arrival (ms)
(d) 10 m
Experimental
Bilinear negative
Cubic negative
Extended Friedlander
Extended Friedlander (Teich C −r )
Figure 6. Negative phase impulse for a 0.25 kg hemispherical PE4 (0.3 kgTNT) charge
Table 1. Experimental and predicted negative phase reflected impulse
Load approximation Negative phase impulse (kPa.ms)
Stand-off (m)
4 6 8 10
Experimental 52.8 39.9 31.1 27.7
Linear positive and negative 64.5 45.8 36.0 29.8
Cubic negative 64.5 45.8 36.0 29.8
Extended Friedlander 50.0 79.4 70.1 53.6
Extended Friedlander (Teich C−r
) 126.9 119.3 118.5 120.7

parameters (for both negative and positive phases), and that the cubic negative phase not only
allows better control of the negative phase to match these parameters, but also appears to
follow the general form of the negative phase well.
55.. MMOODDEELLLLIINNGG IIMMPPLLIICCAATTIIOONNSSThe first part of this paper has focussed on presenting different methods of approximating
the negative phase and offered experimental validation. It is also important to demonstrate
the influence that incorrectly modelling the negative phase has for certain configurations of
target properties and blast event. This will be the focus of the remainder of this paper.
5.1. THE INFUENCE OF THE NEGATIVE PHASE ON ELASTIC SYSTEMSFor flexible systems subjected to blast loads, the response of the target can be modelled using
the equivalent single-degree-of-freedom (SDOF) method [29]. It is common to ignore
damping in blast-resistant design as it is typically only the first few cycles of displacement
that are of interest, where damping has little effect [3]. In doing so, the equation of motion
for an equivalent SDOF system is given as
(13)
where me and ke are the equivalent mass and stiffness of the system, z̈ and z are the
acceleration and displacement of the system, and Fe(t) is the equivalent externally applied
load. For more information on how to transform a ‘real life’ system into its SDOF equivalent,
the reader is referred to Biggs [29] and Morison [30].
In order to demonstrate the influence that the form of the negative phase has on elastic
systems, the SDOF equivalent equation of motion was solved under the following five load
cases:
m z t k z t F te e eɺɺ( ) ( ) ( ).+ =
12 The Negative Phase of the Blast Load
Cubic negative
Extended Friedlander
Extended Friedlander (Teich C −r )Experimental
0
−2
−4
−6
−8
−10100 101
2
Ne
t im
pu
lse
/pe
ak im
pu
lse
Scaled distance, Z (m/kg1/3)
Figure 7. Normalised net impulse ([ir + i –r ]/ir) with scaled distance fordifferent negative phase approximations

• The experimental load for R = 10 m and W = 0.3 kg TNT
• A linearly decaying positive phase with no negative phase. This triangular pulse shape
is recommended for use with the SDOF method as a ‘first guess’ of the typical target
response to a blast load
• Friedlander positive phase with cubic negative phase (equation 12)
• Friedlander positive phase with extended Friedlander negative phase (equation 1
extended to t = ∞)
• Friedlander positive phase with extended Friedlander negative phase using the Teich
[7] reflection coefficient (equation 10).
The linear negative phase was not modelled in this analysis. The linear expression will
have the same peak negative phase pressure and impulse as the cubic expression for any
scaled distance, and will therefore have little difference on target response for impulse-driven
analyses. For dynamic and quasi-static analyses, however, the pulse shape has been shown
to have an influence on the response of structures to blast loads [22, 31, 32], and it is
therefore recommended that the cubic expression should be used in analysis, on account of
it better matching the experimental pressure waveform seen in Figure 5. For the purpose of
this article, however, it is more important to highlight the difference between the cubic
expression, extended Friedlander expressions and neglecting the negative phase altogether,
rather than focussing on the importance of pulse shape, and therefore the linear
simplification of the negative phase as a bilinear pulse is not considered further.
The time ratio, td/T , where T is the fundamental natural period of the system, gives an
indication of the response time of the structure with respect to the duration of the loading.
Separate equivalent systems were analysed with time ratios of 1.00, 0.10 and 0.01 – these
time ratios indicate structures whose response time is in the static, dynamic and impulsive
regimes respectively. Figures 8, 9 and 10 show the normalised displacement-time histories
of the equivalent SDOF systems.
From Figure 8, it is clear that the negative phase has very little effect on the peak response
of flexible systems near the static regime. The system reaches peak displacement at ∼ 0.5td,before the negative phase starts, hence there is little appreciable difference in the response
International Journal of Protective Structures – Volume 5 · Number 1 · 2014 13
0 0.5 1 1.5 2
0
−0.2
−0.4
−0.6
−0.8
−1
0.2
0.4
0.6
0.8
1
Norm
alis
ed d
ispla
cem
ent, z
/z m
ax,
lin
Normalised time, t/td
2.5 3
Experimental load
Linear, no negative phase
Cubic negative
Extended Friedlander
Extended Friedlander (Teich C −r )
Figure 8. SDOF displacement-time histories under different negativephase approximations and experimental load for td/T = 1.00 Z = 14.9m/kg1 /3 (0.3 kg TNT at 10 m)

for the different load cases – the difference in first peak response is caused only by the
difference in pulse shape between the linear and exponential positive phases and not the
negative phase itself.
For more flexible systems, the negative phase has a more pronounced effect, and it is for
systems such as these where modelling the negative phase becomes crucial. For td /T = 0.1
(Figure 9), the system begins to rebound shortly after the positive phase. If the negative
phase is modelled using the cubic expression, the peak rebound displacement is similar to the
peak inward displacement of the system under the linear load. If the negative phase is
modelled as an extended Friedlander, the rebound effect is much more pronounced. For
14 The Negative Phase of the Blast Load
0 2 4 6 8
−1
−2
−3
0
2
1
3N
orm
alis
ed d
ispla
cem
ent, z
/z m
ax,
lin
Normalised time, t/td
10 12 14 16
Experimental load
Linear, no negative phase
Cubic negative
Extended Friedlander
Extended Friedlander (Teich C −r )
Figure 9. SDOF displacement-time histories under different negativephase approximations and experimental load for td /T = 0.10 Z = 14.9m/kg1/3 (0.3 kg TNT at 10 m)
0 10 20 30 40 50 60
0
−0.5
−1
−1.5
−2
−2.5
−3
−3.5
−4
0.5
1
1.5
Norm
alis
ed d
ispla
cem
ent, z
/z m
ax,
lin
Normalised time, t/td
Experimental load
Linear, no negative phase
Cubic negative
Extended Friedlander
Extended Friedlander (Teich C −r )
Figure 10. SDOF displacement-time histories under different negativephase approximations and experimental load for td /T = 0.01 Z = 14.9m/kg1/3 (0.3 kg TNT at 10 m)

td/T = 0.01 (Figure 10), the system responds relatively slowly compared to the application
of the load. Again, modelling the negative phase as the cubic expression gives excellent
results when compared to the SDOF system under the experimental load. If the system were
analysed using only the linear positive phase, the peak displacement would be over-predicted
in the inward direction. If the system were analysed using the extended Friedlander
approaches, the outward displacement would be grossly over-predicted, particularly if the
Teich reflection coefficient is used.
The displacement ratio is given as the peak displacement of the SDOF system divided by
the peak displacement of the SDOF system under the linear load [7], i.e. zmax/zmax,lin, and is
a quantitative indicator of the influence of the negative phase on dynamic response. Values
of displacement ratio for the systems analysed are summarised in Table 2.
Figure 11 shows the relationship between displacement ratio and time ratio for Z = 14.9
m/kg1/3, i.e. the response spectra for elastic SDOF systems under the experimental, cubic
negative and extended Friedlander load cases. For the whole range of time ratios, modelling
the negative phase using the cubic approximation gives values of peak displacement that are
in excellent agreement compared to the peak displacements of the SDOF system under the
International Journal of Protective Structures – Volume 5 · Number 1 · 2014 15
Table 2. Peak normalised SDOF displacements
Load approximation Displacement ratio, zmax
/zmax, lin
Time ratio, td
/T
1.00 0.10 0.01
Experimental 1.01 1.14 0.17
Cubic negative 0.93 1.13 0.19
Extended Friedlander 0.93 1.85 1.10
Extended Friedlander (Teich C−r
) 0.93 3.16 3.81
100
10−1
10−2 10−1 100
Dis
pla
ce
me
nt
ratio, z m
ax/
z max,
lin
Time ratio, td/T
Experimental load
Cubic negative
Extended Friedlander
Extended Friedlander (Teich C −r )
Figure 11. Elastic SDOF response spectra under different negativephase approximations and experimental load for Z = 14.9 m/kg1/3 (0.3kg TNT at 10 m)

experimental load. The cubic negative phase accurately models the increase in peak
displacement at td /T ∼ 0.25 as a result of elastic rebound coinciding with negative phase
pressures, as well as being able to capture the beneficial aspects of including the negative
phase for impulsive loading. Modelling using either of the extended Friedlander expressions
does not give acceptable results, particularly at the impulsive end of the spectrum.
Referring back to Figure 7, it is clear that the peak normalised elastic displacement of the
SDOF system for impulsive loads (td /T < 0.01) is directly proportional to the normalised net
impulse. At Z = 14.9 m/kg1/3, the normalised net impulses for the cubic, extended
Friedlander and Teich extended Friedlander are −0.2, −1.0 and −4.0 respectively, which are
exactly the normalised peak displacements at the impulsive end of the response spectra. The
difference in net impulse increases further when Z > 14.9 m/kg1/3, which leads to the
conclusion that it is vital to model the negative phase correctly at larger scaled distances.
5.2. THE INFUENCE OF THE NEGATIVE PHASE ON SYSTEMS WITH MATERIALFAILURETo further highlight the impact of the negative phase loading assumptions, a series of
numerical analyses were performed using the explicit FE code LS-DYNA [33]. Simply
supported, one-way spanning, 1 m square, 8 mm thick panels were discretised into a grid of
100×100 Belytschko-Tsay shell elements with four integration points through the thickness
of the shell.
The plates were modelled as elastic-perfectly plastic using the *MAT_PLASTIC_KINEMATIC material model with Young’s modulus, E = 70 GPa, density ρ = 2500 kg/m3,
Poisson’s ratio, ν = 0.25 and zero tangent modulus. A yield strength of 70 MPa was selected
for the panels, which is within the range of values for structural glass given in [5]. The
material properties are summarised in Table 3, and were selected to be indicative of a typical
glazing panel.
Pressure loading was applied at nodal points as force-time histories – the models were
analysed under the loading from an 8 kg hemispherical TNT surface burst at 20 m stand-off,
with separate models run for the following load cases; linear positive with no negative,
Friedlander positive with cubic negative, extended Friedlander and extended Friedlander
with Teich reflection coefficient.
Failure strain was specified as multiples of the elastic strain limit (εe= σy /E), set at 2, 4, 10
and 20εe to represent increasing levels of ductile failure. If any of the elements within the plate
failed, the analysis was terminated and the direction in which the panel failed was recorded.
With large displacements, fluid-structure interaction (FSI) may serve to dampen the blast
16 The Negative Phase of the Blast Load
Table 3. Material properties of the plates analysed
Parameter Symbol Value (unit)
Young’s modulus E 70 (GPa)
Density ρ 2500 (kg/m3)
Poisson’s ratio ν 0.25 (−)
Span L 1 (m)
Thickness d 8 (mm)
Yield strength σy
70 (MPa)
Elastic strain limit εe
0.01 (−)
Failure strain εf
2–20εe
(−)

pressure and result in lower values of displacement. Subramaniam et al. [34] used the ratio
of the peak particle velocity to peak plate velocity to quantify the influence of FSI. In this
numerical study, a peak particle velocity of 88.5 m/s (from ConWep) compared to a
maximum plate velocity of ∼6 m/s gives a ratio of 0.07, at which the influence of FSI is still
second order. Therefore the use of non-FSI empirical loads can be considered valid for this
case.
Table 4 presents the results of the parametric study in terms of pass/fail, where ‘-’
indicates no material failure was present, ‘Fi’ indicates that the panel failed in the inward
direction and ‘Fo’ indicates that the panel failed in the outward direction, i.e. towards the
direction of the blast.
With the exception of the most brittle case, where failure occurs in the inward direction
under all four load cases, there is no other instance where all four models agree on the failure
of the glazing panel. From the evidence provided earlier in this article, it can be said that the
cubic negative phase represents ‘correct’ treatment of the negative phase, with the other load
cases representing ‘incorrect’ treatment. Neglecting the negative phase, therefore, is shown
to be under conservative for εf = 4εe yet conservative for εf = 10εe, whereas modelling it as
an extended Friedlander may falsely predict material failure for ductile systems.
66.. SSUUMMMMAARRYY AANNDD CCOONNCCLLUUSSIIOONNSSFollowing the positive phase of a blast comes a period where the pressure falls below
atmospheric pressure known as the negative phase. Whilst the positive phase of the blast is
well understood, validation of the negative phase is rare in the literature, and as such it is
often incorrectly treated or neglected altogether.
This paper reviews current methods in the literature for representing the negative phase,
and provides experimental validation for comparison. Of the different methods for modelling
the negative phase, the cubic expression of Granström [20] gives the best approximation both
qualitatively and quantitatively.
Elastic single-degree-of-freedom systems are analysed under the different loading
approximations to give an idea of the magnitude of the differences in displacement that will
be seen when using the different load models. Finite element analyses are undertaken on
elastic-plastic panels with material failure to further highlight the lack of agreement between
the results given by the different loading models.
With so many parameters influencing whether the negative phase is conservative, non-
International Journal of Protective Structures – Volume 5 · Number 1 · 2014 17
Table 4. Material failure for a 1 m × 1 m panel subjected to an 8 kghemispherical TNT burst at 20 m (Z = 10.0 m/kg1/3) under differentnegative phase approximations. ‘–’ indicates no material failurewhereas ‘Fi’ and ‘Fo’ indicate material failure in the inward and outwarddirection respectively
Load approximation Panel failure
εf=
2εe
4εe
10εe
20εe
Linear, no negative phase Fi Fi – –
Cubic negative Fi Fo Fo –
Extended Friedlander Fi Fo Fo Fo
Extended Friedlander (Teich C−r
) Fi Fo Fo Fo

conservative or has no effect, it is both difficult and impractical to definitively say when the
negative phase can be neglected or not. In fact, because of this it can be argued that the
negative phase should not be neglected at any stage until the engineer is confident that its
effects are understood.
The numerical cases shown in this study are for a limited number of structural
arrangements under a limited number of blast events and are by no means an attempt at an
exhaustive quantification of the influence of the form of the negative phase. Instead, the
examples shown, for both the ‘real-life’ glazing panels and the equivalent elastic systems,
should serve as a reminder that the negative phase is both important and often the effect of
the negative phase is underestimated. The evidence provided in this paper should provide the
research community with guidance on how to model the negative phase.
AACCKKNNOOWWLLEEDDGGEEMMEENNTTSSThe authors would like to express their gratitude to technical staff at Blastech Ltd. for their
assistance in conducting the experimental work reported herein. The first author
acknowledges the financial support from the Engineering and Physical Sciences Research
Council (EPSRC) Doctoral Training Grant.
RREEFFEERREENNCCEESS[1] F. G. Friedlander. The diffraction of sound pulses. I. Diffraction by a semi-infinite plane. Proceedings of the
Royal Society A: Mathematical, Physical and Engineering Sciences, 186(1006):322–344, 1946.
[2] H. S. Norville, N. Harvill, E. J. Conrath, S. Shariat, and S. Mallonee. Glass-related injuries in Oklahoma City
bombing. Journal of Performance of Constructed Facilities, 13(2):50–56, 1999.
[3] T. Krauthammer and A. Altenberg. Negative phase blast effects on glass panels. International Journal of
Impact Engineering, 24(1):1–17, 2000.
[4] L. R. Dharani and J. Wei. Dynamic response of laminated glass under blast loading: effect of negative phase.
In Structures under shock and impact VIII, pages 181–190, Crete, Greece, 2004.
[5] J. Wei and L. R. Dharani. Response of laminated architectural glazing subjected to blast loading. International
Journal of Impact Engineering, 32(12):2032–2047, 2006.
[6] M. Larcher, G. Solomos, F. Casadei, and N. Gebbeken. Experimental and numerical investigations of
laminated glass subjected to blast loading. International Journal of Impact Engineering, 39(1):42 – 50, 2012.
[7] M. Teich and N. Gebbeken. The influence of the underpressure phase on the dynamic response of structures
subjected to blast loads. International Journal of Protective Structures, 1(2):219–234, 2010.
[8] M. Teich and N. Gebbeken. Structures subjected to low-level blast loads: Analysis of aerodynamic damping
and fluid-structure interaction . Journal of Structural Engineering, 138(5):625 – 635, 2012.
[9] M. Yang and S. Ahmari. Investigation of effect of negative phase of blast loading on cable net curtain walls
through the linearized stiffness matrix method. International Journal of Impact Engineering, 61(0):36 – 47,
2013.
[10] L. M. Bryant, J. M. Erekson, and K. W. Herle. Are you positive about negative phase? In American Society
of Civil Engineers (ASCE) Structures Congress 2013, pages 103–114. Pittsburgh, PA, USA, 2013.
[11] C. E. Needham. Blast Waves. Springer, Berlin, Germany, 2010.
[12] C. N. Kingery and G. Bulmash. Airblast parameters from TNT spherical air burst and hemispherical surface
burst. Technical Report ARBRL-TR-02555, U.S Army BRL, Aberdeen Proving Ground, MD, USA, 1984.
[13] US Department of Defence. Structures to resist the effects of accidental explosions. US DoD, Washington
DC, USA, UFC-3-340-02, 2008.
[14] G. F. Kinney and K. J. Graham. Explosive Shocks in Air. Springer, NY, USA, 1985.
[15] D. Cormie, G. Mays, and P. Smith. Blast effects on buildings, 2nd ed. Thomas Telford, London, UK, 2009.
[16] D. W. Hyde. Conventional Weapons Program (ConWep). U.S Army Waterways Experimental Station,
18 The Negative Phase of the Blast Load

Vicksburg, MS, USA, 1991.
[17] D. Bogosian, J. Ferritto, and Y. Shi. Measuring uncertainty and conservatism in simplified blast models. In
30th Explosives Safety Seminar, pages 1–26. Atlanta, GA, USA, 2002.
[18] A. Tyas, J. Warren, T. Bennett, and S. Fay. Prediction of clearing effects in far-field blast loading of finite
targets. Shock Waves, 21(2):111–119, 2011.
[19] A. Tyas, T. Bennett, J. Warren, S. Fay, and S. E. Rigby. Clearing of blast waves on finite-sized targets, an
overlooked approach. Applied Mechanics and Materials, 82:669–674, 2011.
[20] S. A. Granström. Loading characteristics of air blasts from detonating charges. Technical Report 100,
Transactions of the Royal Institute of Technology, Stockholm, 1956.
[21] W. E. Baker. Explosions in air. University of Texas Press, Austin, TX, USA, 1973.
[22] C. Gantes and N. Pnevmatikos. Elastic-plastic response spectra for exponential blast loading. International
Journal of Impact Engineering, 30(3):323–343, 2004.
[23] G. Randers-Pehrson and K.A. Bannister. Airblast loading model for DYNA2D and DYNA3D.Technical
Report ARL-TR-1310, U.S Army Research Laboratory, Aberdeen Proving Ground, MD,USA, 1997.
[24] Naval Facilities Engineering Command. Blast Resistant Structures. Alexandria, VA, DM 2.08, 1986.
[25] US Army Corps of Engineers. Methodology manual for the Single-Degree-of-Freedom Blast Effects Design
Spreadsheets (SBEDS). ACE Protective Design Center, Omaha, NE, USA, PDC-TR-06-01, 2005.
[26] N. Kambouchev, L. Noels, and R. Radovitzky. Nonlinear compressibility effects in fluid-structure interaction
and their implications on the air-blast loading of structures. Journal of Applied Physics, 100(063519), 2006.
[27] N. Kambouchev, L. Noels, and R. Radovitzky. Numerical simulation of the fluid-structure interaction
between air blast waves and free-standing plates. Computers & Structures, 85(11 - 14):923 – 931, 2007.
[28] H. L. Brode. Numerical solutions of spherical blast waves. Journal of Applied physics, 26(6):766–775, 1955.
[29] J. M. Biggs. Introduction to Structural Dynamics. McGraw-Hill, New York, NY, USA, 1964.
[30] C. M. Morison. Dynamic response of walls and slabs by single-degree-of-freedom analysis – a critical review
and revision. International Journal of Impact Engineering, 32(8):1214 – 1247, 2006.
[31] Q. M. Li and H. Meng. Pulse loading shape effects on pressure-impulse diagram of an elastic-plastic, single-
degree-of-freedom structural model. International Journal of Mechanical Sciences, 44(9):1985 – 1998,
2002.
[32] X. Huang, L. He, and G.W. Ma. Soil-structure interaction and pulse shape effect on structural element
damage to blast load. Journal of Performance of Constructed Facilities, 25:400 – 410, 2011.
[33] J. O. Hallquist. LS-DYNA Theory Manual. Livermore Software Technology Corporation, CA, USA, 2006.
[34] K. V. Subramaniam, W. Nian, and Y. Andreopoulos. Blast response simulation of an elastic structure:
Evaluation of the fluid-structure interaction effect. International Journal of Impact Engineering,
36(7):965 – 974, 2009.
International Journal of Protective Structures – Volume 5 · Number 1 · 2014 19
