the negative impact of positive stereotyping: relationship
TRANSCRIPT
Brigham Young UniversityBYU ScholarsArchive
Undergraduate Honors Theses
2019-07-10
The Negative Impact of Positive Stereotyping:Relationship Between Positive Stereotypes,Perceived Competence and Perceived Potential forLeadershipMegan Chan
Follow this and additional works at: https://scholarsarchive.byu.edu/studentpub_uht
This Honors Thesis is brought to you for free and open access by BYU ScholarsArchive. It has been accepted for inclusion in Undergraduate HonorsTheses by an authorized administrator of BYU ScholarsArchive. For more information, please contact [email protected],[email protected].
BYU ScholarsArchive CitationChan, Megan, "The Negative Impact of Positive Stereotyping: Relationship Between Positive Stereotypes, Perceived Competence andPerceived Potential for Leadership" (2019). Undergraduate Honors Theses. 83.https://scholarsarchive.byu.edu/studentpub_uht/83
Honors Thesis
THE NEGATIVE IMPACT OF POSITIVE STEREOTYPING: RELATIONSHIP BETWEEN POSITIVE STEREOTYPES, PERCEIVED COMPETENCE AND PERCEIVED POTENTIAL FOR LEADERSHIP
By Megan Chan
Submitting to Brigham Young University as partial fulfillment of graduation requirements for University Honors
Human Resources Department Brigham Young University
June 2019
Advisor: Taeya Howell Honors Coordinator: Mark Hansen

ii
i
ABSTRACT
THE NEGATIVE IMPACT OF POSITIVE STEREOTYPING
RELATIONSHIP BETWEEN POSITIVE STEREOTYPES, PERCEIVED COMPETENCE AND PERCEIVED POTENTIAL FOR LEADERSHIP
Megan Chan Human Resources Department
Bachelor of Science For many years, Asian Americans have been positively stereotyped as the most successful racial group in America. Yet, very few Asian Americans occupy top leadership positions. This research investigates how positive stereotyping affects managers’ perception towards Asian Americans’ level of competence and potential for leadership. I conducted a scenario study with a sample of 315 people working and residing in the United States. These participants assumed the role of decisions makers and were presented with information about job applicants where the variable data (i.e. race) was manipulated. Based on the differences in ratings on Asian Americans and non-Asian Americans, I found that Asian Americans continue to be positively stereotyped in workplaces. They were also perceived to be more competent, and contrary to my hypothesis, were considered to have a higher potential for leadership compared to White Americans. This study sheds light on the impact of positive stereotyping and provides implications on managers’ role in promoting organizational health through biases elimination and inclusion efforts.
ii
ACKNOWLEDGEMENTS I owe this paper to my dear Mother, who has done so much for her family, and who has sacrificed everything for the welfare of her kids. This paper would not have been possible without her constant support and unwavering faith in the becoming of her children. Special thanks to my advisor, Dr. Taeya Howell, who has been so supportive of me being an independent researcher and thinker. She encouraged me throughout the project and during our regular weekly meetings. She has helped me immensely in my project and I am grateful that I could conduct my first official research project with her. I would also like to thank Dr. Shad Morris, who has challenged me to rise to new heights through intellectual discussions. A huge thanks to BYU and the Honors Program for supporting students to take a research route. I am grateful for the ways that I have been prepared for the future, and will never forget the good times on this beautiful campus.
iii
TABLE OF CONTENTS Abstract……………………………………………………………………………………………..i Acknowledgements………………………………………………………………………..…… ii Table of Contents…………………………………………………………………………….....iii List of Tables and Figures………………………………………………………………..……iv I. Introduction…………………………………………………………………………….. 1 II. Literature Review………………………..………………………………………………4
Stereotypes………………………………………………………….……………4 Stereotypes and Biases………………………………….…………………….6 Positive Stereotypes and Their Impact……………..……………….……8 Asian Americans…………………..…………………………………………. 11 Asian American Stereotypes………………………………………………11 Talent Management and Leadership Potential………………………..15 Perceptions of Leadership in America……………………………………17 Asian American Leadership Stereotypes…………………………..……18
III. Methodology……………………………………………………………………………21 Sample……………………………………………………………………………21 Procedure………………………………………………………………………22 Dependent Variables…………………………………………………………23 Independent Variables………………………………………………………24 Predictor Variables……………………………………………………………25 Control Variables……………………………………………………………26 Analyses…………………………………………………………………………27
IV. Results……………………………………………………………………………………28 V. Discussion………………………………………………………………………………38
Implications of Research……………………………………………………41 Limitations and Future Research…………………………………………44
VI. Conclusion…………………………………………………………………………45 References…………………………………………………………………………………………47 Appendices………………………………………………………………………………………57
iv
LIST OF TABLES AND FIGURES Table 1: Correlation Table…………………………….………………………………………30
Table 2: Mean, Standard Deviation, Standard Error and T-test Score for Stereotype Sub-categories of Stereotypes………………………………..………………………………33
Table 3: Mean, Standard Deviation, Standard Error and T-test Score for Competence and High Potential Level..……………………………………………………35
Table 4: Ordinary Least Square Regression for Harrison Wu’s Level of Competence and Full High Potential………………………………………….........………………………36
Table 5: Ordinary Least Square Regression for Harrison Wu’s High Potential Sub-categories…….…….……………………………..…………………………….………………..37
Figure 1: Fiske and Cuddy’s (2002) Four-cluster Evaluation on Level of Warmth and Competence for Stereotypes of Different Groups ……………..……….….………14
Figure 2: Silzer and Church’s (2009) Integrated Model for High Potential Evaluation……………………………………………………….……………………………….16
1
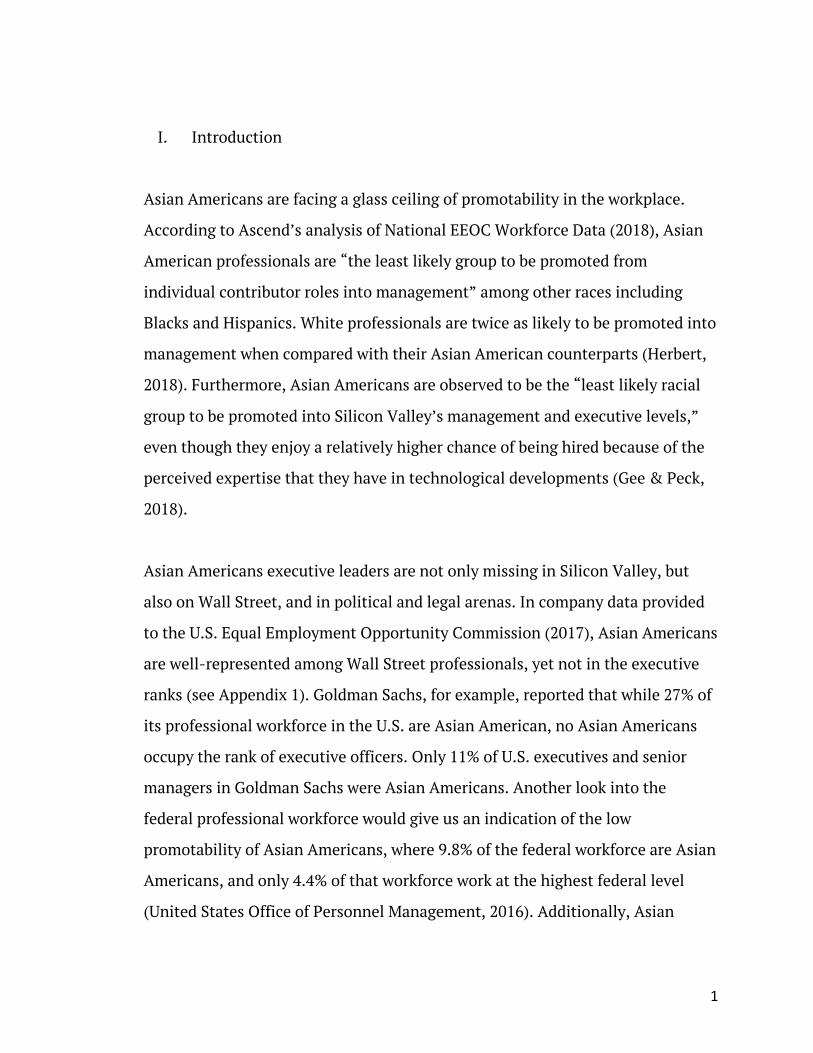
I. Introduction
Asian Americans are facing a glass ceiling of promotability in the workplace.
According to Ascend’s analysis of National EEOC Workforce Data (2018), Asian
American professionals are “the least likely group to be promoted from
individual contributor roles into management” among other races including
Blacks and Hispanics. White professionals are twice as likely to be promoted into
management when compared with their Asian American counterparts (Herbert,
2018). Furthermore, Asian Americans are observed to be the “least likely racial
group to be promoted into Silicon Valley’s management and executive levels,”
even though they enjoy a relatively higher chance of being hired because of the
perceived expertise that they have in technological developments (Gee & Peck,
2018).
Asian Americans executive leaders are not only missing in Silicon Valley, but
also on Wall Street, and in political and legal arenas. In company data provided
to the U.S. Equal Employment Opportunity Commission (2017), Asian Americans
are well-represented among Wall Street professionals, yet not in the executive
ranks (see Appendix 1). Goldman Sachs, for example, reported that while 27% of
its professional workforce in the U.S. are Asian American, no Asian Americans
occupy the rank of executive officers. Only 11% of U.S. executives and senior
managers in Goldman Sachs were Asian Americans. Another look into the
federal professional workforce would give us an indication of the low
promotability of Asian Americans, where 9.8% of the federal workforce are Asian
Americans, and only 4.4% of that workforce work at the highest federal level
(United States Office of Personnel Management, 2016). Additionally, Asian
2
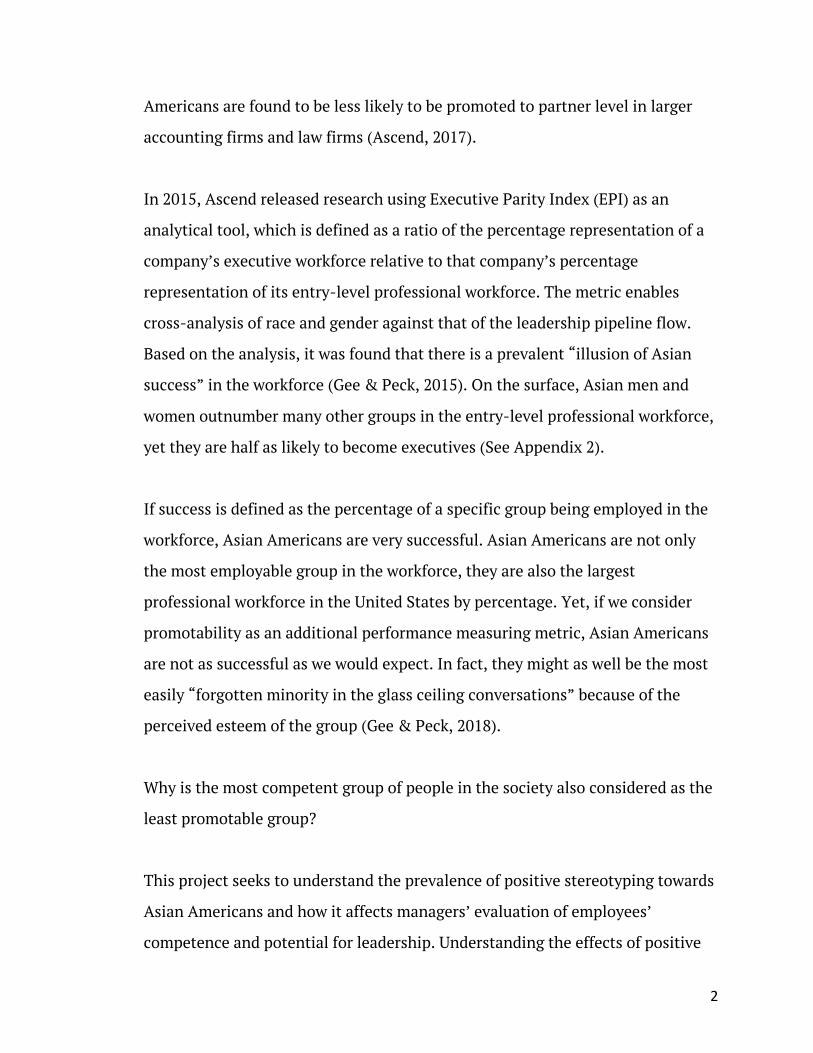
Americans are found to be less likely to be promoted to partner level in larger
accounting firms and law firms (Ascend, 2017).
In 2015, Ascend released research using Executive Parity Index (EPI) as an
analytical tool, which is defined as a ratio of the percentage representation of a
company’s executive workforce relative to that company’s percentage
representation of its entry-level professional workforce. The metric enables
cross-analysis of race and gender against that of the leadership pipeline flow.
Based on the analysis, it was found that there is a prevalent “illusion of Asian
success” in the workforce (Gee & Peck, 2015). On the surface, Asian men and
women outnumber many other groups in the entry-level professional workforce,
yet they are half as likely to become executives (See Appendix 2).
If success is defined as the percentage of a specific group being employed in the
workforce, Asian Americans are very successful. Asian Americans are not only
the most employable group in the workforce, they are also the largest
professional workforce in the United States by percentage. Yet, if we consider
promotability as an additional performance measuring metric, Asian Americans
are not as successful as we would expect. In fact, they might as well be the most
easily “forgotten minority in the glass ceiling conversations” because of the
perceived esteem of the group (Gee & Peck, 2018).
Why is the most competent group of people in the society also considered as the
least promotable group?
This project seeks to understand the prevalence of positive stereotyping towards
Asian Americans and how it affects managers’ evaluation of employees’
competence and potential for leadership. Understanding the effects of positive

3
stereotyping will help leaders devise talent management strategies that will
retain talented employees more effectively. Likewise, this research will also
suggest talent management strategies that will reduce the potential negative
effects of positive stereotyping. If managers are able to recognize and overcome
bias generated from positive stereotyping, Asian Americans may face less bias
and be seen as having greater potential for leadership positions.
4
II. Literature Review
Stereotypes
Stereotypes are the “categorical association, traits (and) behaviors” that the
perceivers make of group members who are of a given group or category (Fiske &
Lee, 2008). It is a particular type of understanding or knowledge towards group
membership (Purkiss & Perrewe, 2006). Stereotypes bias impressions of others
and also encourage self-fulfilling prophecies about oneself (Madon, et al, 2001).
They influence the perceiver’s interpretation of the behaviors of the stereotyped
group, and also his or her own behavior towards the stereotyped group (Madon,
et al, 2001). Stereotypes may result in either favorable or unfavorable judgment
of members of stereotyped groups, and the content of the stereotype may be
either positive or negative (Czopp, Kay, & Cheryan, 2015).
Stereotypes are formed by a process that is commonly referred to as self-
categorization. According to self-categorization theory (Turner & Reynolds,
2008), people tend to identify themselves as individuals or group entities where
specific implications and meaning are embedded in it. Given the different groups
that individuals assign themselves to, an understanding of self-perception in
relation to “I” and “we” is formed. By conceptualizing the self at various levels
of abstraction (Fiske & Lee, 2008), individuals can depersonalize themselves by
letting group identities supersede that of their own. Such depersonalization
creates group phenomenon and differentiates “us” from “them”. Many
stereotypes regarding age, racial, ethnic or gender groups are thus formed where
perceivers evaluate their power or status in relation to the society that they are
situated in. Stereotypes may be activated through the use of cues, without the
5
perceiver being fully aware of it. Examples of such cues may be ethnic accent,
ethnic names, skin colors and so forth.
There are mainly two types of stereotypes—descriptive and prescriptive
stereotypes (Heilman, 2012). Descriptive stereotype describes what certain
group member are like, and reflect beliefs about how racial groups actually differ
(Berdahl, 2012). Prescriptive stereotypes reflect beliefs about how different
groups should be and how they should not be. They both activate the process of
judgement towards members of the stereotyped groups (Biernat, 2013), and may
be detrimental to the accuracy of the decisions made based on the following
three types of inaccuracies that stereotypes are commonly subjected to:
(i) Stereotypic inaccuracy: stereotype-inconsistent qualities may be
underestimated or overestimated;
(ii) Valence inaccuracy: negativity or positivity of the groups stereotypes
may be exaggerated; and
(iii) Dispersion inaccuracy: variability between group members may be
over or under generalized.
Based on the inaccuracies that can occur during the process of stereotyping, it
can lead to formation of biases and impact the decisions that we make. While
some of these biases will be more openly discussed (i.e. explicit bias), many of
them may be hidden and unspoken (i.e. implicit bias). Implicit bias is referred to
as “attitudes or stereotypes that affect our understanding, actions, and decisions
in an unconscious manner” (Staats, 2016). These stereotypes or judgements are
hard to access given the fact that they are made sometimes without us being
aware of them. Implicit biases may not be necessarily aligned with the beliefs or
intentions that we declare.
6
Stereotypes and Biases
According to Phelps (2003), human beings are prone to process race group’s
information. The ability to recognize same-race versus other races’ faces, and
evaluate race groups both explicitly and implicitly are associated with our neural
systems, and thus a natural part of human beings. In general, psychological
research has suggested that it is more likely that we recognize faces of our own
race more quickly and correctly than faces of other races, which is also referred
to as same-race advantage (DeGutis, 2013). While face recognition is a skill that
is learned over time, same-race advantage may be created because of increased
contact with people who are of the same race group. This is supported by the
contact hypothesis, which suggests that enhanced recognition towards a
particular race is due to the greater experiences that we have with faces of our
own race (Paluck, 2018).
Stereotyping may be especially prevalent when meeting new people where one
may not have enough situational cues related to the person (Fiske & Lee, 2008).
Given the quantity of information that we need to process every second, biases
are prevalent throughout the society and organizations, and can impact all
behaviors and responses. These responses may include the way we categorize,
allocate attention, form inferences and judgment, set expectations, feel,
approach problems and act in general (Moskowitz, 2018). An instance particular
to the case of racial bias was provided by Purkiss and Ferris (2006), where it was
found that applicants with ethnic names spoken with an accent were viewed less
positively by interviewers than ethnic names spoken without an accent and non-
ethnic names spoken with and without an accent.
7
Stereotypes can also lead to confirmation of biases. After being exposed to a
certain type of biases or stereotypes, individuals have a natural tendency to seek
and gather information or knowledge that will support a particular belief that
they identify with (Glick, 2017). This is also known as the confirmation bias,
where it encourages the tendency to ignore instances that are contradictory to
original beliefs, and can be detrimental to generating new knowledge and
understanding.
These kinds of biases, if negative, may also cause the categorized group to feel
that they are perceived by society more negatively. This effect is known as
stereotype threat. Stereotype threat is a “psychological threat that is elicited by
a negative stereotype and the resulting feeling that one can be judged or treated
on the basis of the stereotype” (Freeman, 2017). It could occur consciously or
unconsciously. As soon as a member of the categorized group becomes aware of
the behavior or identity that may be provoked by a recurring negative
stereotype, their performance level could be affected as they are more focused
on not confirming the negative stereotype, rather than focusing on the tasks on
hand. A study conducted by Tomasette and Appoloni (2013) found that women
tend to perform significantly worse at a calculus task when their ability was
being negatively stereotyped against that of men’s. Specific to the case of
interracial interaction, which is the context of which this research is based on
(i.e. understanding how positive stereotype towards Asian Americans affect the
perceived level of their competence and leadership potential), such stereotype
threat may cause racial anxiety, where people of a different color experience
anxiety when they worry that they will be subjected to discrimination (Godsil,
2017).

8
Positive Stereotypes and Their Impact
While much research focuses on the effects of negative stereotypes and how
these negative generalizations about groups lead to negative outcomes,
stereotypes may also be positive in content. Positive stereotypes can be
understood as positive traits that are ascribed to a particular social group (Siy &
Cheryan, 2012). These traits are the associations that perceivers ascribe to
group members based on their membership (Fiske & Lee, 2008).
Current research has suggested that positive stereotyping may bring both
positive and negative impacts to members of a particular social group. In
research done by Clark, Thiem and Kang (2017), it was found that activating
positive stereotyping validation may act as a bolster to a person’s belief
regarding his or her abilities and future task performance. For example, studies
have found that Asians in general performed better in a math test after their
ethnic identity was primed with positive traits associated with their group
(Clark, Thiem & Kang, 2017). Members of the positively stereotyped group may
also feel more confident about their previous performances when primed with
positive traits that they have as perceived by outsiders, Such positive impact
could be brought about by emphasizing the good traits that stereotyped
members have while they are conducting their work, and requires that they be
primed with the right circumstances at the right time.
Depending on how stereotyped members are primed, positive stereotypes may
also bring about negative impacts. While positive stereotypes may seem like
compliments, they can still create undesirable feelings for members of the
categorized group, especially if they are situated in individualistic cultures.
According to Siy and Cheryan (2012), emphasis of positive stereotypes may
9
result in a negative interpersonal experience. For example, people who are
raised in individualistic cultures and would like to be seen as unique individuals
separate from their group may experience depersonalization. Even positive
stereotypes can activate a process called depersonalization, where imposition of
a certain social identity or perceived traits onto the particular group may make
individuals feel depersonalized as they are “lumped together” with others in
their social group (Siy & Cheryan, 2012). The degree of stigmatization towards
positive stereotype is very well-dependent on the cultural context. Specifically,
members of individualistic cultures tend to respond more negatively to positive
stereotypes.
In a study done by Cheryan and Bodenhausen (2000), it was found that positive
stereotypes will threaten intellectual performance especially if members are
imposed with higher expectations that create stress. Their study induced a high
focus on ethnic identity in a way that a higher expectation for better
performance is made more salient. And it was found that such conditions of
“ethnicity salience” actually reduced the ability for individuals to concentrate,
thus impairing their performance. In their study, Asian American women’s
performance in a test that requires high quantitative skills were tested. Even
though Asians have been positively stereotyped on their mathematical skills,
making these stereotypes relevant before the actual performance created
“potential for ‘choking’ under the pressure of high expectations.” (Cheryan &
Bodenhausen, 2000).
Positively stereotyped groups have a high tendency to be pigeonholed into
career and intellectual tracks (Czopp, 2010). While positive stereotypes may
appear to be favorable, such stereotypes may direct stereotyped group members
to attend and take part in domains that they are believed to excel in. For
10
instance, positive stereotypes of African Americans being excellent in
athleticism and rhythmic ability may encourage career counselors to offer a
particular guidance to Black students that may divert them from academic-
related pursuits such that African American student-athletes are found to have
graduation rates that are considerably lower than their White counterparts
(Czopp, 2010). Positive stereotypes create expectations on how members of the
stereotyped group ought to behave, and thereby influence behaviors towards the
stereotyped group.
Positive stereotypes may also create high and unrealistic expectations that result
in stereotyped members experiencing negative consequences because of their
inability to meet “expectations”. In a study conducted by Ho and Driscoll (2006),
participants were asked to grade a poorly performed mathematical assignment
where they were made to believe that it was either the work of an Asian or a
White person. When participants were given grading instructions and spent
more time grading, the points that Asian and White targets received did not
significantly differ. However, Asian Americans received fewer points than their
White counterparts when participants did not receive grading instructions. Even
though Asian Americans students performed at levels similar to white students,
participants assigned them substantially fewer points. These findings shed light
on how being the “model minority” may unrealistically increase the bar of
expectations for the stereotyped group, thus making their performance seem
“poorer” even they may be performing at a similar level as the non-minority
group.
11
Asian Americans
As defined by the U.S. Census Bureau (2011), Asian Americans are Americans
with Asian descent. The term refers to a diverse population that has ancestral
origins in East Asia, South Asia or Southeast Asia. The appearance of such
population group can be traced back to the history of migrants from Asia in the
United States. After the reformation of immigration laws in 1940-60s, the United
States saw a rapid increase in Asian immigration. While many first-generation
immigrants struggled with many forms of adjustments (e.g. language, culture
differences) and were mostly “low-skilled, low-wage laborers crowded into
ethnic enclaves and targets of official discrimination” (Pew Research Center,
2013), their children settled down and were born to the culture of the United
States. These descendants of the first-generation immigrants were then the
Asian Americans; born in the States with an Asian descent. The children of those
descendants become Asian Americans too as they follow their parents’ footstep
and reside in America.
Asian American Stereotypes
Asian Americans are “the highest-income, best-educated and fastest-growing
racial group in the United States” (Pew Research Center, 2013). Between 2000
and 2015, the U.S. Asian population grew by 72%, which is the fastest growth
rate among any major ethnic or racial groups (Pew Research Center, 2017).
While wide variation exists among Asian subgroups (i.e. Burmese, Nepalese,
Bangladeshi, Indonesian, Korean, Pakistani, Chinese, Japanese, Filipino and
Indian Americans), the median annual household income of Asian American
households (i.e. $73,060) is higher than that of the median U.S. household. They
are also found to be less likely to live in poverty (i.e. 12.1%) compared with the
12
general U.S. population (i.e. 15.1%). In terms of educational attainment, 51% of
Asian Americans age 25 or older have bachelor’s degree or more, which is higher
than non-Asian Americans at this age (i.e. 30%). Currently, Asian Americans
have one of the highest high activity levels in workforce participation.
Occupying 12% of the professional workforce while making up only 5.6% of the
U.S. population (Gee & Peck, 2018), it is becoming the largest racial cohort of
professionals among other ethnic minority groups.
With such a high rating in many key measures, it is not surprising that Asian
Americans are now considered the most successful group in the U.S. Not only are
they considered successful by key measures, they are widely defined by their
successful attributes—a group that is “hard-working, educated, and successful
due to their discipline” (Tso, 2018). In a study done by Hsin and Xie (2014), it
was found that Asian Americans enjoy educational advantages over White
Americans not because of cognitive abilities or socio-demographics, but their
ability to exercise greater academic efforts, which is measured by traits such as
work ethic and attentiveness. They outperform many other racial groups
including Whites on most standardized tests (Czopp, Kay & Cheryan, 2015) and
are therefore considered the “model minority”. In other words, there is a cultural
expectation placed on Asian Americans to be smart (i.e. “naturally good at math,
science and technology”), wealthy, hard-working, self-reliant, docile and
submissive, obedient, and spiritually enlightened (The University of Texas at
Austin, 2017). For decades, this belief has “pervaded American pop culture and
media” (Williams, Multhaup, & Korn, 2018). In the now-infamous 1987’s Time
magazine cover (see Appendix 3), six young Asian American students were
featured with the caption “those Asian American Whiz Kids,” signifying the
belief that Asian Americans are good at math and science. In 1998, former
National Football League player Reggie White stated in his speech to the
13
Wisconsin State Assembly, “when you look at the Asian, the Asian is very gifted
in creativity and invention. If you go to Japan or any Asian country, they can
turn a television into a watch. They are very creative.” (Czopp, Kay & Cheryan,
2015). Asian Americans are portrayed as almost “perfect.”
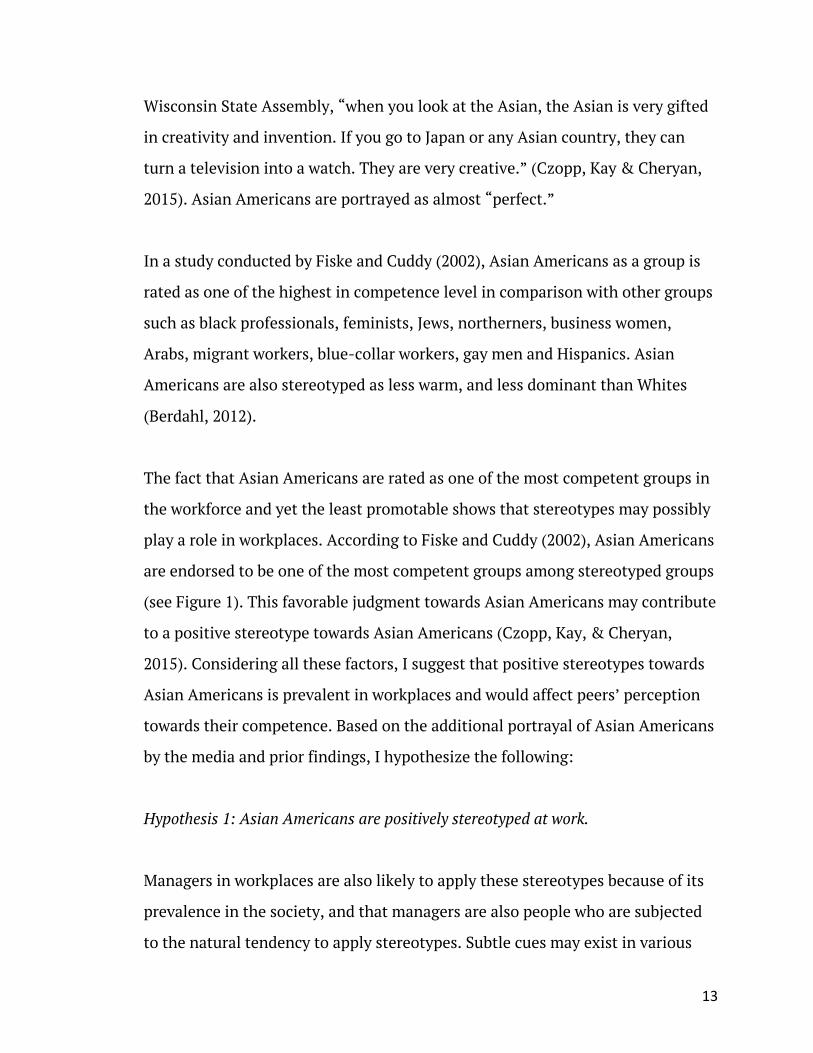
In a study conducted by Fiske and Cuddy (2002), Asian Americans as a group is
rated as one of the highest in competence level in comparison with other groups
such as black professionals, feminists, Jews, northerners, business women,
Arabs, migrant workers, blue-collar workers, gay men and Hispanics. Asian
Americans are also stereotyped as less warm, and less dominant than Whites
(Berdahl, 2012).
The fact that Asian Americans are rated as one of the most competent groups in
the workforce and yet the least promotable shows that stereotypes may possibly
play a role in workplaces. According to Fiske and Cuddy (2002), Asian Americans
are endorsed to be one of the most competent groups among stereotyped groups
(see Figure 1). This favorable judgment towards Asian Americans may contribute
to a positive stereotype towards Asian Americans (Czopp, Kay, & Cheryan,
2015). Considering all these factors, I suggest that positive stereotypes towards
Asian Americans is prevalent in workplaces and would affect peers’ perception
towards their competence. Based on the additional portrayal of Asian Americans
by the media and prior findings, I hypothesize the following:
Hypothesis 1: Asian Americans are positively stereotyped at work.
Managers in workplaces are also likely to apply these stereotypes because of its
prevalence in the society, and that managers are also people who are subjected
to the natural tendency to apply stereotypes. Subtle cues may exist in various
14
situations where unconscious or implicit forms of stereotypes are triggered
during the decision-making process in workplaces (Purkiss & Perrewe, 2006).
Given that managers are often required to make decisions in situations with high
uncertainty, which is when biases are more likely to be applied, I also
hypothesize the following:
Hypothesis 2: Asian Americans are perceived by managers to be more competent
because of the effects of positive stereotyping.
Figure 1: Fiske and Cuddy’s (2002) Four-cluster Evaluation on Level of Warmth
and Competence for Stereotypes of Different Groups
Source: Fiske, S. & Cuddy, A. (2002). A Model of (often mixed) Stereotype Content:
Competence and Warmth Respectively Follow From Perceived Status and
Competition. Journal of Personality and Social Psychology 2002. Vol. 82, 6, 878-
902.
15
Talent Management and Leadership Potential
Talented employees are the “lifeblood of organizations”, a “key source of
competitive advantage” and a “primary reason for organizational success and
failure” (Church, 2010). With the world being in a “war for talent”, which is a
term coined by Steven Hankin of McKinsey & Company in 1997, there is an
increasingly competitive landscape for recruiting and retaining talented
employees. Thus, organizations need to emphasize even more on the importance
of determining existing talents and engaging in succession planning and
leadership development programs. These goals could be achieved through
identifying “high potential individuals” who are seen to have the potential to
climb the organizational ladder and eventually become leaders. Identifying high
potentials requires managers to make predictions of a person’s long-term
performance, which includes the manager’s beliefs about an individual’s
capabilities, motivations, and opportunities specific to the job requirements.
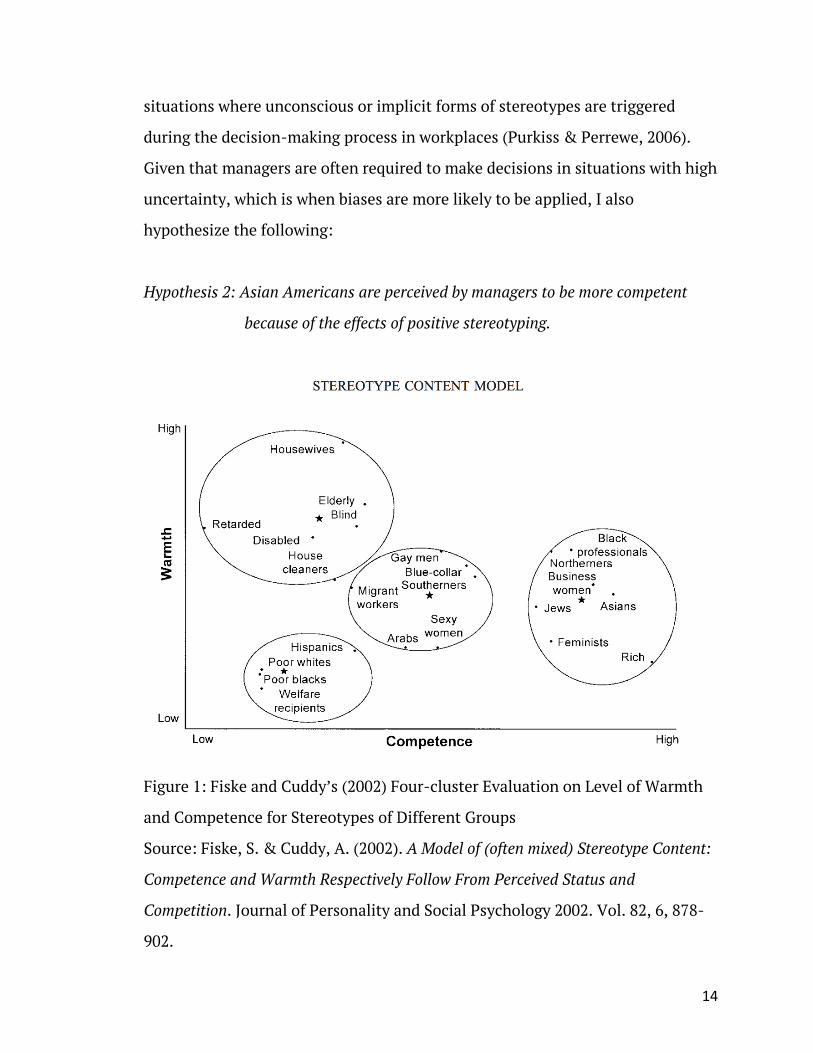
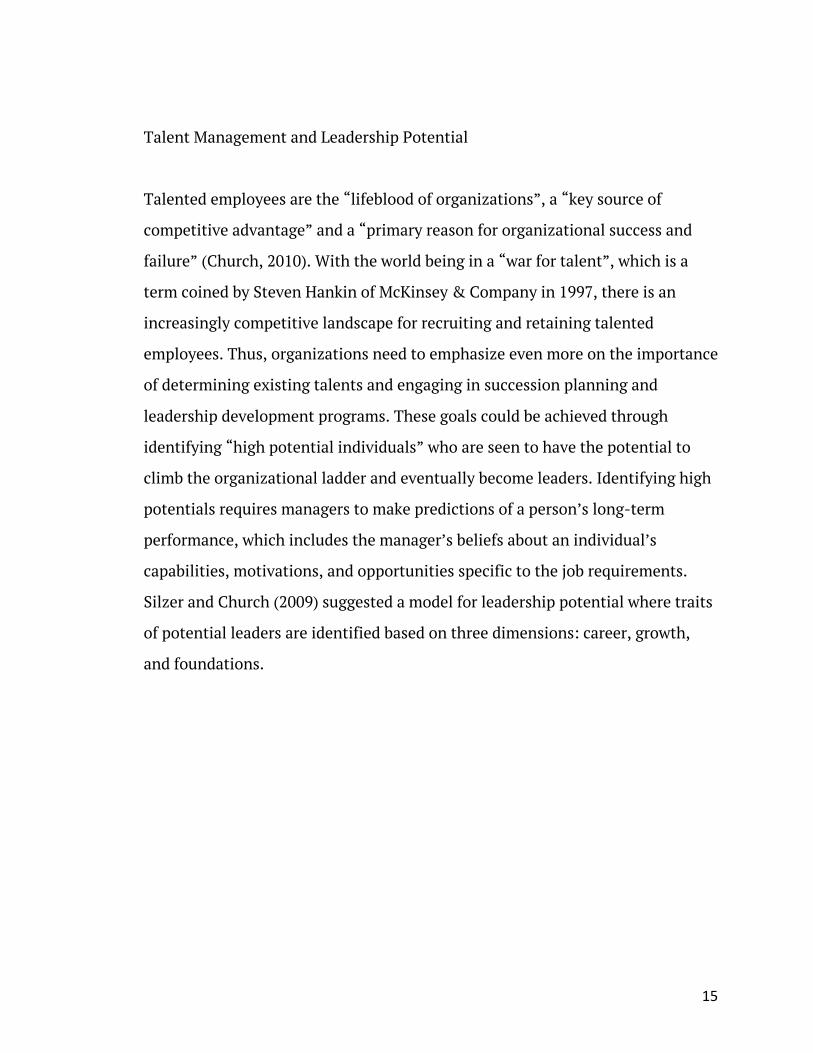
Silzer and Church (2009) suggested a model for leadership potential where traits
of potential leaders are identified based on three dimensions: career, growth,
and foundations.
16
Figure 2: Silzer and Church’s (2009) Integrated Model for High Potential
Evaluation
Source: Silzer R., & Church A. (2009). The Pearls and Perils of Identifying
Potential. Industrial and Organizational Psychology Journal: Perspectives on
Science and Practice, 2, 401.
The challenge for managers in identifying potential leaders is to make successful
predictions with a long-term vision, and to do so without bias. In order to gauge
an employee’s level of potential to be a leader, managers need not only be
skilled at anticipating the type of future leaders that they are looking for, but
also be able to assess current performance of an employee and his or her
potential for future growth and development. This requires strong assessment of
skills free from biases and partial judgments (Church, 2010). Difficulty arises
when managers are untrained and choose to categorize observations based on
his or her own biases and preferences. Whenever an individual is unconsciously
placing another into a category or class, the process of labeling an individual is
17
triggered, which leads to automatic stereotyping. Particularly, perception may
be affected by cultural identities, where leaders have “culturally developed ideals
of what leaders should be or look like” (Finkelstein, Costanza & Goodwin, 2017).
Another source of bias may also originate from the fact that selection bias of
managers is often very common, where people prefer to be surrounded by people
sharing similar social identity and reinforce their status (Bursell & Jansson,
2018). As such, if leading managers are White Americans, they are also more
likely to select White Americans as their counterparts and promote them in the
future.
Perceptions of Leadership in America
In a study conducted by Eagly and Chin (2010), it was found that beliefs about
the attributes of a social group often bias judgment of individuals from the
group. When the stereotypes that perceivers hold of a social group differs from
the attributes that they believe are required for success in leadership, the
stereotyped individual will be perceived less as a potential leader. This type of
less favorable attitude often leads to behaviors that may prevent individuals
from accessing opportunities in workplaces. For instance, stereotyping Blacks as
more aggressive and less intelligent than Whites is shown to lower the chances
of Blacks in landing job interviews (Galinsky, 2013).
American society in general believes in a more assertive and dominant role of
leaders (Brescoll, 2016). They are ambitious, confident, self-sufficient, dominant
and competent (Eagly & Chin, 2010). Competing with peers, imposing wishes on
subordinates and behaving assertively are also considered prototypical of
managerial roles (Eagly & Chin, 2010). Under implicit leadership theories,
18
organizational leaders are supposed to have characteristics such as assertiveness
and extraversion (Gundemir & Carton, 2018). These implicit beliefs about
leaders and perceived leadership skills limit whom individuals see as leaders.
Asian American Leadership Stereotypes
Society views Asian American men and women to be more docile and less
dominant than Whites. Even though considered the model minority, they are
considered to have low dominance where they are too compliant and not
assertive enough. They are perceived to have lower sociability where they are
shy and withdrawn (Gundemir & Carton, 2018). Asian Americans’ style of
leadership is also perceived to be more feminine in the American society in
general (Shek, 2006). In other words, Asian Americans’ way of demonstrating
masculinity is considered more gentle and subtle, and thus different from that of
White Americans.
Such labeling puts Asian Americans under a categorical trait that they are
actually proscribed from displaying qualities of dominance even when it was
natural to do so. In a recent study done by Berdahl and Min (2012), it was found
that dominant Asian American men and women were found to be less likeable
than their dominant White peers and non-dominant peers of both Asian
American and Whites. Similar research shows that people dislike dominant
Asian Americans coworkers compared to non-dominant Asian Americans or a
dominant or a non-dominant White coworker (Berdahl, 2012). In fact, dominant
Asian Americans are found to be more harassed at work than other coworkers
who are either dominant or non-dominant in other racial identities, or non-
dominant Asian Americans (Berdahl, 2012).
19
Considered to be a model minority, Asian Americans demonstrate an “ethic of
hard work” (Park, 2008) and are found to the most competent of most groups
(Shek, 2006). Positive stereotypes towards Asian Americans however, may also
elicit negative feelings from non-stereotyped groups. According to Ho and
Jackson (2006), people who feel threatened and resentful of Asian Americans’
success aew also likely to think of them as nerdy and antisocial.
Currently, there is limited research on how racial beliefs about the traits of Asian
Americans affect beliefs about their ability to assume leadership roles. It is,
however, obvious that Asian Americans are expected to express leadership
qualities that are in harmony with the traits that they “should” have under
general positive stereotypes, which are to be submissive and obedient. Such
traits however, directly contradict the desired qualities of leadership in the
United States, which are to be dominant and assertive. The characteristics that
Asian Americans are stereotyped to have are not consistent with what is believed
to be needed for a traditional organizational leader in the American society.
Decisions makers are thus less inclined to consider Asian Americans as potential
leaders (Gundemir & Carton, 2018). Asian Americans are then caught in this
dilemma where they would be punished for demonstrating normal leadership
traits as a group that is categorized as “submissive”, yet would also be perceived
as inadequate leaders because they are not able to meet the “qualities” that is in
general expected of leaders in American society. While Asian Americans are
mostly positively stereotyped, it is true that stereotype-based expectations can
be psychologically burdensome in the domain of leadership and can result in
underrepresentation in certain groups (Murphy & Hoyt, 2016). Asian Americans
are caught in between when stereotypes of them do not match that of general
leadership traits. As such, traditionally advantaged groups such as Asian
Americans may also experience threats because of biased evaluation of their
20
ability as leaders. Such biased evaluations may be a result of a skewed leadership
standards that are imposed on Asian Americans, where they have to meet
general leadership expectations, but at the same time not violate the stereotypes
that they are placed under (Leonardelli & Phillips, 2008).
Incongruence between characteristics of stereotyped groups and desired
characteristics of “successful” figures may result in discrimination. In a study
conducted by Johnson (2018), when leaders have a specific stereotype on women
and compare it against common stereotype of successful entrepreneurs, they
tend to see a competency gap and discriminate against women when it may not
be necessarily justified. Perception of competence may therefore be skewed
when then discrepancy between perceived stereotypes and desired
characteristics exists. Understanding the psychology of discrimination against
leaders who may not demonstrate “American leaders” traits and the positive
stereotype towards Asian Americans, I hypothesize the following:
Hypothesis 3: Asian Americans are perceived by managers to have lower
leadership potential than Asian Americans in work situations because
of the effects of positive stereotyping of Asian Americans.
21
III. Methodology
Sample
Data was collected by recruiting participants from Amazon's Mechanical Turk
(MTurk) platform. All survey respondents are eligible to participate in the survey
if their profiles match with study requirements, namely that they are employed
outside the home and reside in the United States. Each eligible and participating
respondent was paid $2.00 for their participation.
I collected data from 316 individuals and had useable data from 315 people
(N=315). Males totaled 173 and females totaled 142. The average age was 34.76
with a standard deviation (SD) of 9.62 years. The racial demographics of the
survey included: White/Caucasian (N=224), Black/African American (N=43),
Asian (N=20), American/Alaskan Native (N=1), and Others (N=5).
A total of 308 respondents surveyed were employed and 7 were unemployed.
232 respondents reported themselves as managers in the survey. The average
tenure of the managers was 12.93 years, and the average number of employees
that respondents manage was 2.63. The level of education completed by
respondents included: Professional Degree (N=4), Doctoral Degree (N=1),
Master’s Degree (N=33), 4-year College Degree (N=154), 2-year College
Degree(N=37), Some College (N=55), and High School (N=33).
Looking at the relationship between employee gender and performance
evaluations and perceptions of promotability, a recent meta-analysis found a
relationship of d = .56 for gender differences in organizational rewards,
including promotability (Joshi, Son, & Roh, 2015). I did not expect such a large
22
difference in organizational rewards based on race as was found for gender.
Thus, I expected a moderate size relationship between race and perceived
promotability somewhere in the range between .15 and .30. Based on a power
analysis, I believed that recruiting 300 participants would be sufficient to detect
my hypothesized relationships.
The average time to complete the survey among all participants, as reported by
Qualtrics, was 15.6 minutes.
Procedure
At the beginning of the survey, respondents were required to answer to several
demographic questions, which included employment status, type of industry
involved in, job title, managerial position, number of employees supervising,
number of hours per week working for pay outside the home, and full-time work
experience.
The first section of the survey asked respondents to read two resumes (see
Appendix 4) of two individuals of different ethnicities (i.e. White American and
Asian American). I used a within-subject design where each participant viewed
each resume with the viewing order randomly determined. I did not find a
difference in results based on the viewing order, and so I collapsed across this
difference. The resumes featured two individuals with similar educational and
work experiences yet of different ethnicities (i.e. White American named Jeff
Snyder and Asian American named Harrison Wu). I also made sure that the
pictures of both individuals are similar with similar facial expression and
features.
23
After reading the resumes, respondents were asked to put themselves into the
shoes of a hiring manager for Company LLM, where they have to hire one
candidate to enter the high-potential leadership development program of the
company, and evaluate the level of competence and level of potential for
leadership of Jeff Snyder and Harrison Wu.
Respondents were then asked to answer some questions as a manipulation check
and also an attention filter in the second section of the survey. The
manipulation required the respondents to answer to six questions that pertain to
the information that they have read regarding Harrison Wu and Jeff Snyder’s
resumes. Eleven respondents were not able to pass the attention filter where
they did not enter the correct response as directed on the survey. I included
these data as my results are the same with or without these respondents.
In order to measure stereotypes, I asked the respondents to rate their
perceptions towards Asian Americans and White Americans by responding to
multiple statements in the third section of the survey.
At the end of the survey, respondents were asked to respond to some final
demographics questions.
Dependent Variables
1) Competence
Buckingham and Goodall’s (2015) new performance evaluation rubric for
Deloitte was used to measure the level of competence for Jeff Snyder and
Harrison Wu respectively. Based on the two resumes reviewed, respondents
24
answered on a 7-point scale from “Totally Disagree” (1) to “Totally Agree” (7).
The items for this scale are as follows: (1) “All in all, Jeff Snyder/Harrison Wu
would be very competent in performing the job.” (2) “In my estimation, Jeff
Snyder/Harrison Wu would be very effective in getting the work done.” (3)
“Given what I know of Jeff Snyder's/Harrison Wu’s performance, and if it were
my money, I would award this person the highest possible compensation.” (4)
“Given what I know of Jeff Snyder's/Harrison Wu’s performance, I would always
want him on my team.” (5) “Jeff Snyder/Harrison Wu is at risk for low
performance” (reverse scored). (6) “Jeff Snyder/Harrison Wu is ready to lead
others.” The cronbach’s alpha for this scale was 0.84.
2) Potential for Leadership
Silzer and Church’s (2009) Integrated Model for High Potential Evaluation was
used to measure the level of perceived potential for leadership for Jeff Snyder
and Harrison Wu respectively. The model measures three major dimensions,
which are the foundational dimensions, growth dimensions, and career
dimensions
Each of these dimensions measures various items, and respondents needed to
rate both Jeff Snyder and Harrison on a total of 28 items on a 7-point scale from
“Highly Disagree” (1) to “Highly Agree” (7). The items for each dimension are as
follows:
25
(1) Foundational dimensions:
- Cognitive: conceptual or strategic thinking ability, cognitive ability,
ability to deal with complexity
- Personality: interpersonal skills, sociability, dominance, emotional
stability, resilience
(2) Growth dimensions
- Learning: adaptability, learning orientation, openness to feedback
- Motivation: drive, energy, achievement orientation, career ambition, risk-
taking orientation, results orientation
(3) Career dimensions
- Leadership: leadership capabilities, general people management skills,
skills to develop others, ability to influence, ability to challenge status
quo
- Performance: high performance, adequate career experiences
- Other variables: technical/ functional skills, technical/ functional
knowledge, good cultural fit
The cronbach’s alpha for the full scale was 0.9, and each dimension also showed
good internal reliability (foundational α = 0.86; growth α = 0.88; and career α =
0.89).
Independent Variables
1) Race of Applicants
26
The race of the two applicants, Jeff Snyder and Harrison Wu, was manipulated in
the survey. To show that the race of the two applicants were different, the
pictures used for both applicants featured a White American or Asian American
with different skin colors. It should be noted that the pictures chosen still
features similar facial expressions to prevent skewed respondents’ level of
attention to the respective applicants.
The survey also provided two different descriptions for the place of origin for Jeff
Snyder and Harrison Wu’s parents to highlight their different race. Below are the
two different scenarios created for the applicants:
Jeff Snyder: “Jeff Snyder is a recent MBA graduate. Born and raised in Chicago,
Illinois, his parents are both from Illinois, and they are still currently employed.”
Harrison Wu: “Harrison Wu is a recent MBA graduate. Born and raised in Los
Angeles, California, his parents are both from China and are still currently
employed.”
Predictor Variables
1) Endorsement of Positive Stereotypes
The prompt here referenced Asian Americans and White Americans on a 7-point
scale from “Highly Disagree” (1) to “Highly Agree” (7) for the Competence,
Warmth and Status Scales featured on the Stereotype Content Model. The
Stereotype Content Model by Fiske and Cuddy (2002) was used to test whether
respondents hold stereotypical views towards different ethnic groups. I also
created an additional scale which would be considered as “Others Scale” where it
27
specifically measured the stereotypes that are particular to Asian Americans as
suggested by research (see II. Literature Review). A total of 18 items were
measured, which are included as follows:
- Competence Scale: competent, confident, independent, competitive,
intelligent (α = 0.85)
- Warmth Scale: tolerant, warm, good natured, sincere (α = 0.77)
- Status Scale: have prestigious jobs, economically successful, well-
educated (α = 0.79)
- Others Scale: Obedient, industrious, self-disciplined, self-reliant, self-
sacrificing, high-achieving (α = 0.79); these items are not included in the
original Stereotype Content Model yet are common Asian American
stereotypes as suggested by research. As the study measures the positive
stereotypes towards Asian Americans, only positive traits that describe
the stereotype were used. They were added to the scale so as to more
accurately capture the positive stereotype towards Asian Americans.
Control Variables
1) Demographic information
The demographic information of the survey included the educational level,
race, age and gender of respondents.
Analyses
All analyses were conducted using JMP Pro 14. I used ANOVA techniques and
ordinary least square regression analyses to test my hypotheses.
28
IV. Results
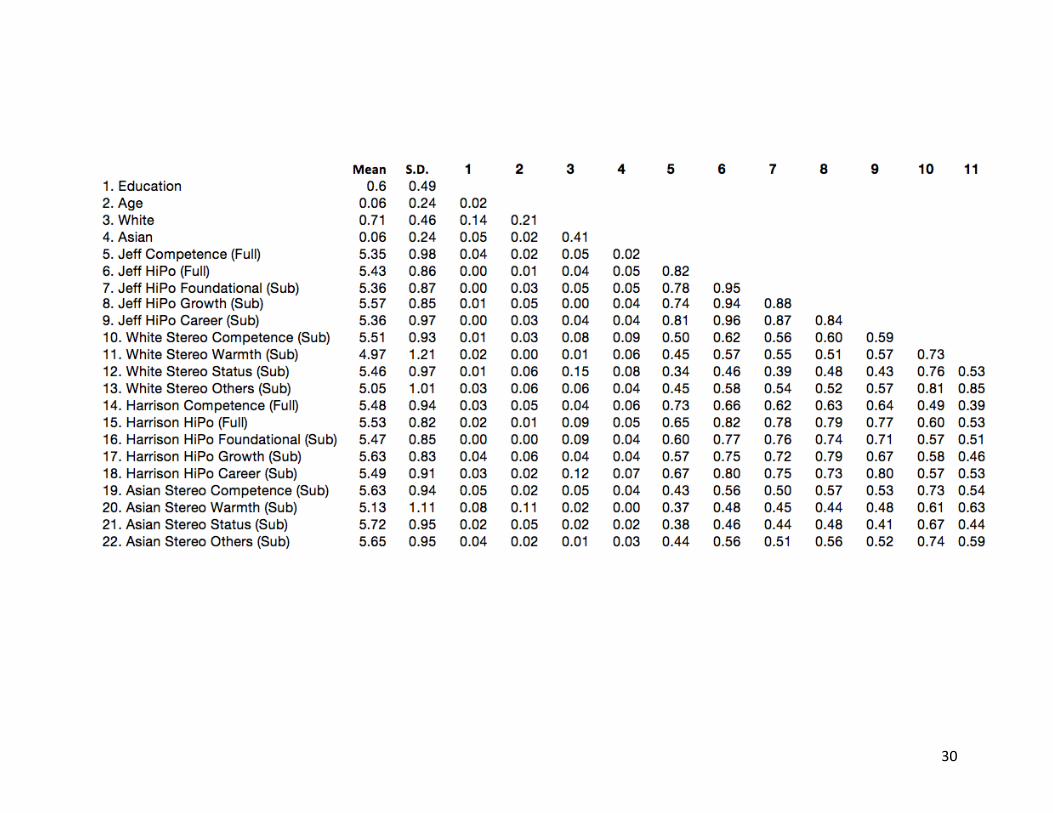
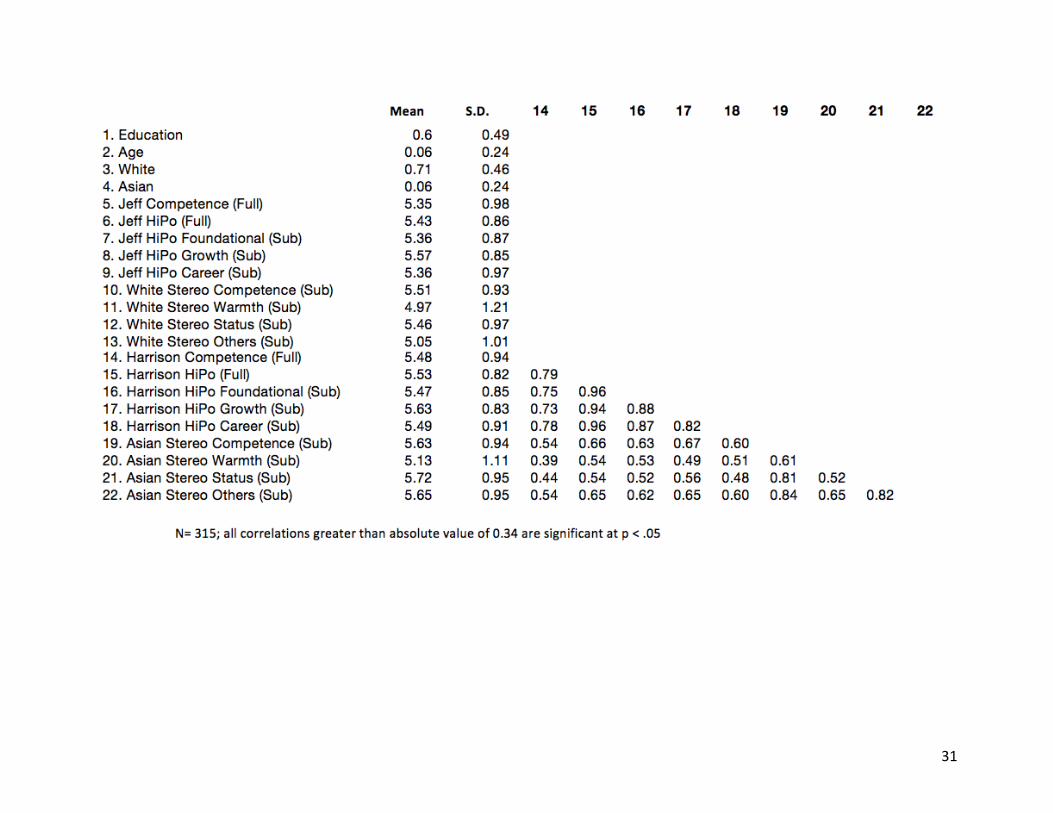
Table 1 below shows the means, standard deviations, and correlations between
all variables in my study.
29
Table 1: Correlation Table
30
31
32
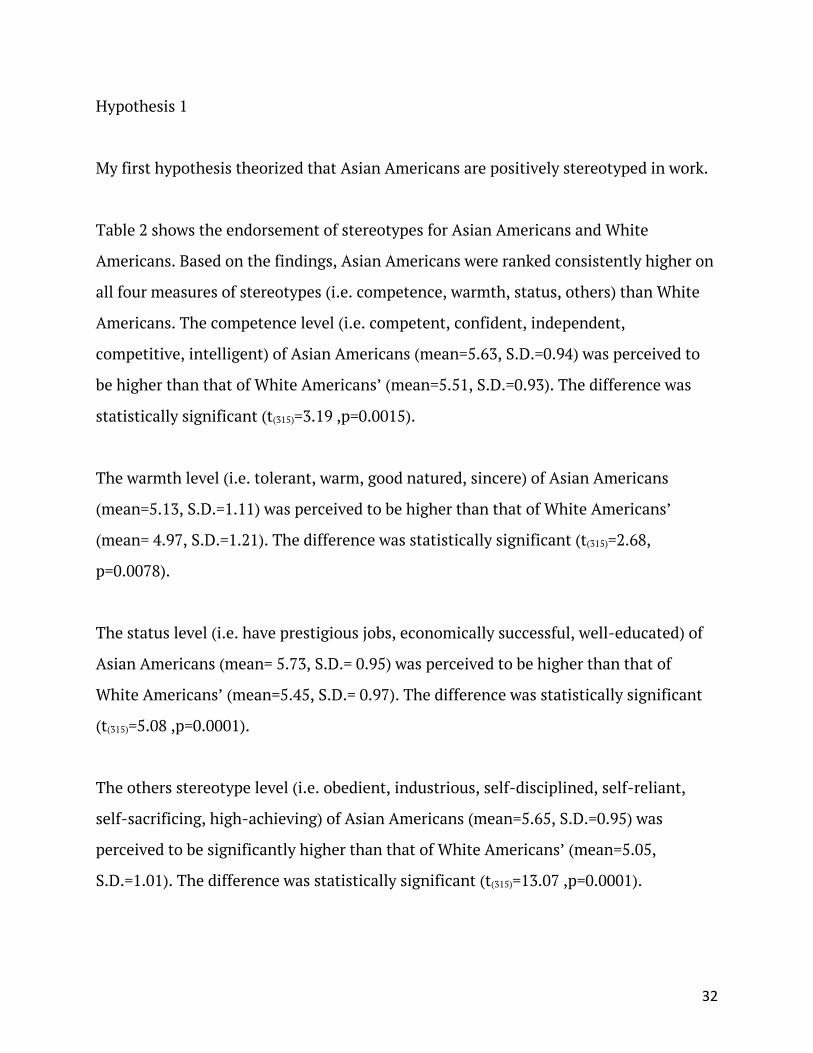
Hypothesis 1
My first hypothesis theorized that Asian Americans are positively stereotyped in work.
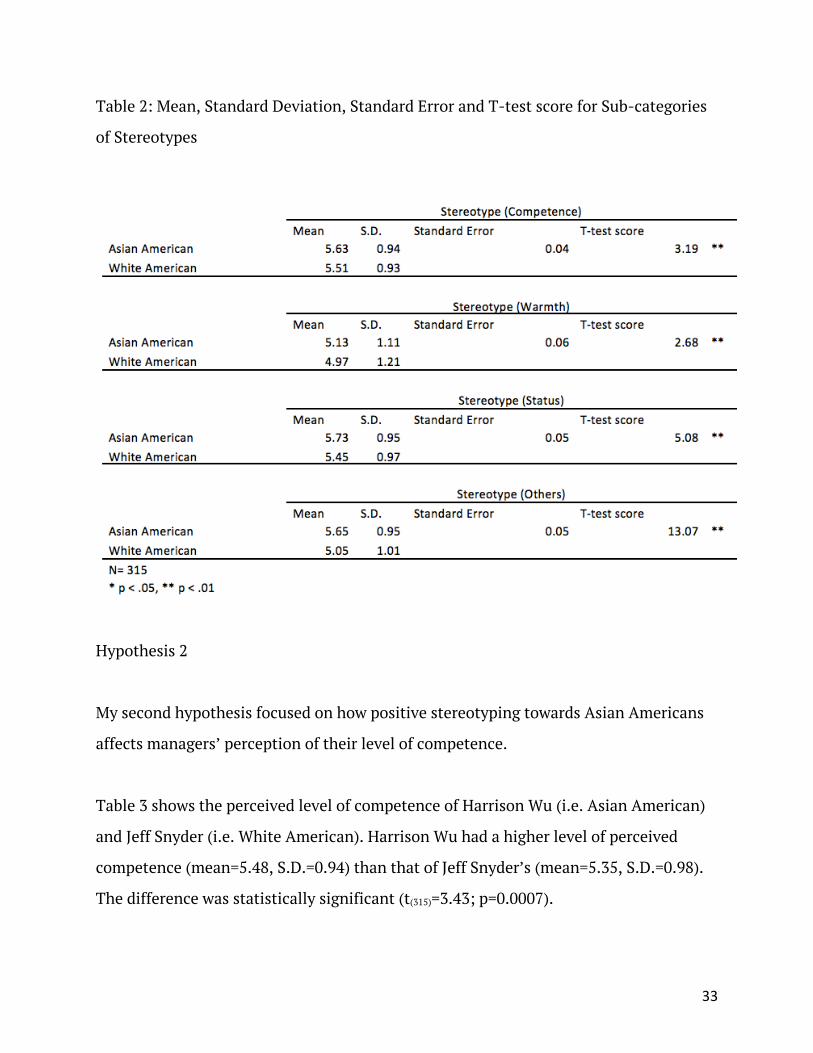
Table 2 shows the endorsement of stereotypes for Asian Americans and White
Americans. Based on the findings, Asian Americans were ranked consistently higher on
all four measures of stereotypes (i.e. competence, warmth, status, others) than White
Americans. The competence level (i.e. competent, confident, independent,
competitive, intelligent) of Asian Americans (mean=5.63, S.D.=0.94) was perceived to
be higher than that of White Americans’ (mean=5.51, S.D.=0.93). The difference was
statistically significant (t(315)=3.19 ,p=0.0015).
The warmth level (i.e. tolerant, warm, good natured, sincere) of Asian Americans
(mean=5.13, S.D.=1.11) was perceived to be higher than that of White Americans’
(mean= 4.97, S.D.=1.21). The difference was statistically significant (t(315)=2.68,
p=0.0078).
The status level (i.e. have prestigious jobs, economically successful, well-educated) of
Asian Americans (mean= 5.73, S.D.= 0.95) was perceived to be higher than that of
White Americans’ (mean=5.45, S.D.= 0.97). The difference was statistically significant
(t(315)=5.08 ,p=0.0001).
The others stereotype level (i.e. obedient, industrious, self-disciplined, self-reliant,
self-sacrificing, high-achieving) of Asian Americans (mean=5.65, S.D.=0.95) was
perceived to be significantly higher than that of White Americans’ (mean=5.05,
S.D.=1.01). The difference was statistically significant (t(315)=13.07 ,p=0.0001).
33
Table 2: Mean, Standard Deviation, Standard Error and T-test score for Sub-categories
of Stereotypes
Hypothesis 2
My second hypothesis focused on how positive stereotyping towards Asian Americans
affects managers’ perception of their level of competence.
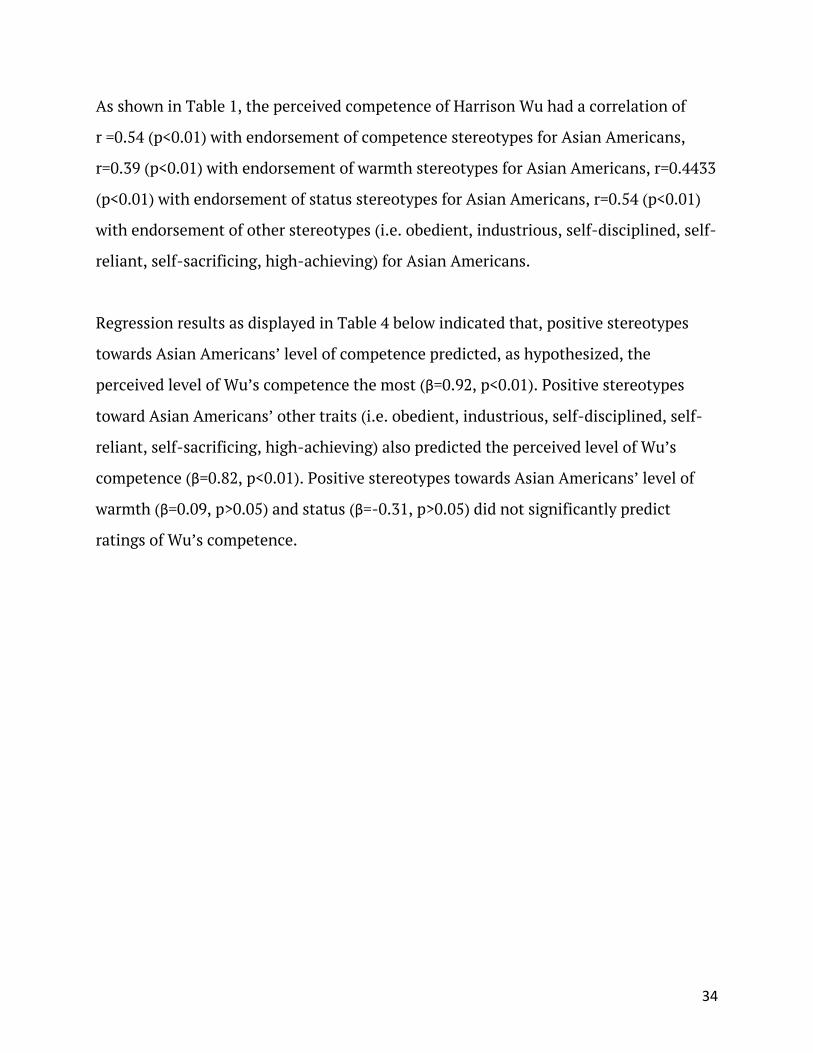
Table 3 shows the perceived level of competence of Harrison Wu (i.e. Asian American)
and Jeff Snyder (i.e. White American). Harrison Wu had a higher level of perceived
competence (mean=5.48, S.D.=0.94) than that of Jeff Snyder’s (mean=5.35, S.D.=0.98).
The difference was statistically significant (t(315)=3.43; p=0.0007).
34
As shown in Table 1, the perceived competence of Harrison Wu had a correlation of
r =0.54 (p<0.01) with endorsement of competence stereotypes for Asian Americans,
r=0.39 (p<0.01) with endorsement of warmth stereotypes for Asian Americans, r=0.4433
(p<0.01) with endorsement of status stereotypes for Asian Americans, r=0.54 (p<0.01)
with endorsement of other stereotypes (i.e. obedient, industrious, self-disciplined, self-
reliant, self-sacrificing, high-achieving) for Asian Americans.
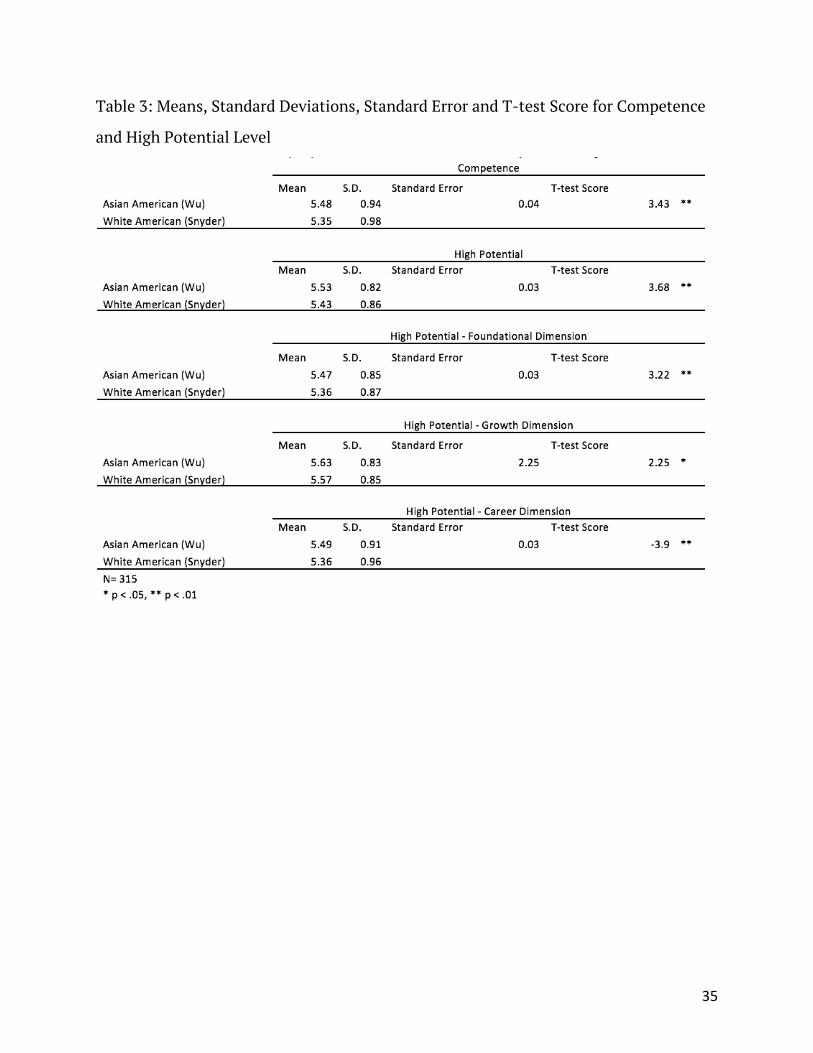
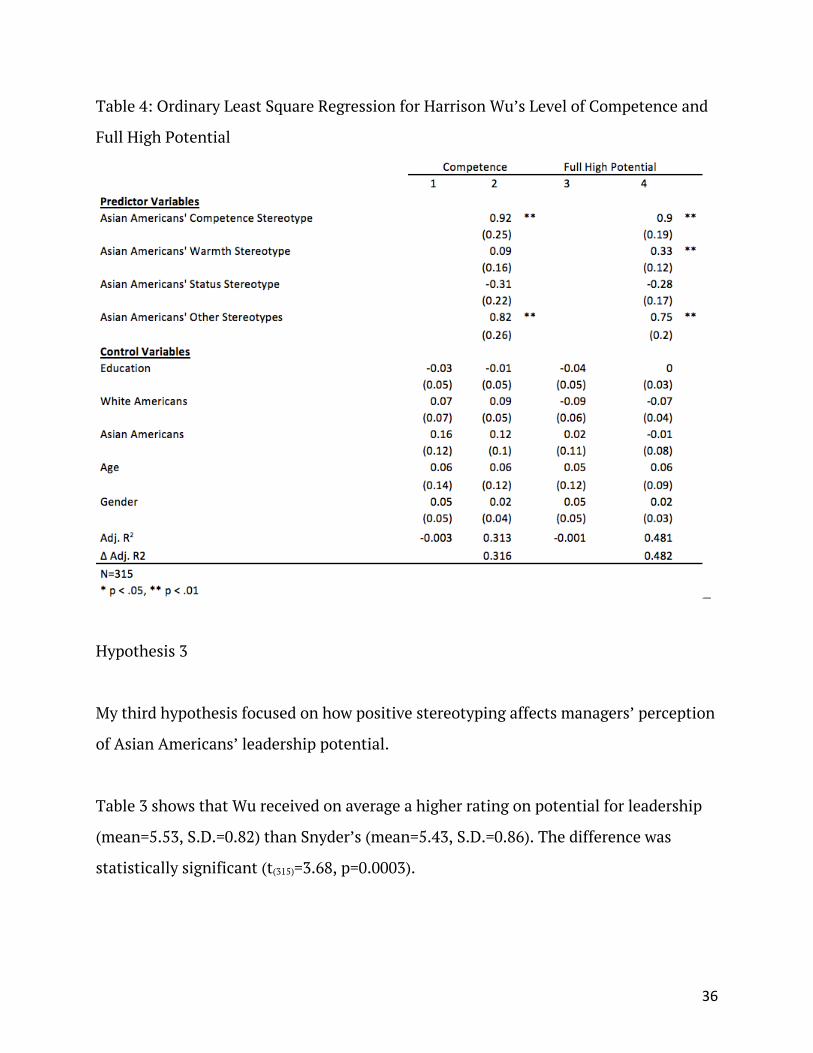
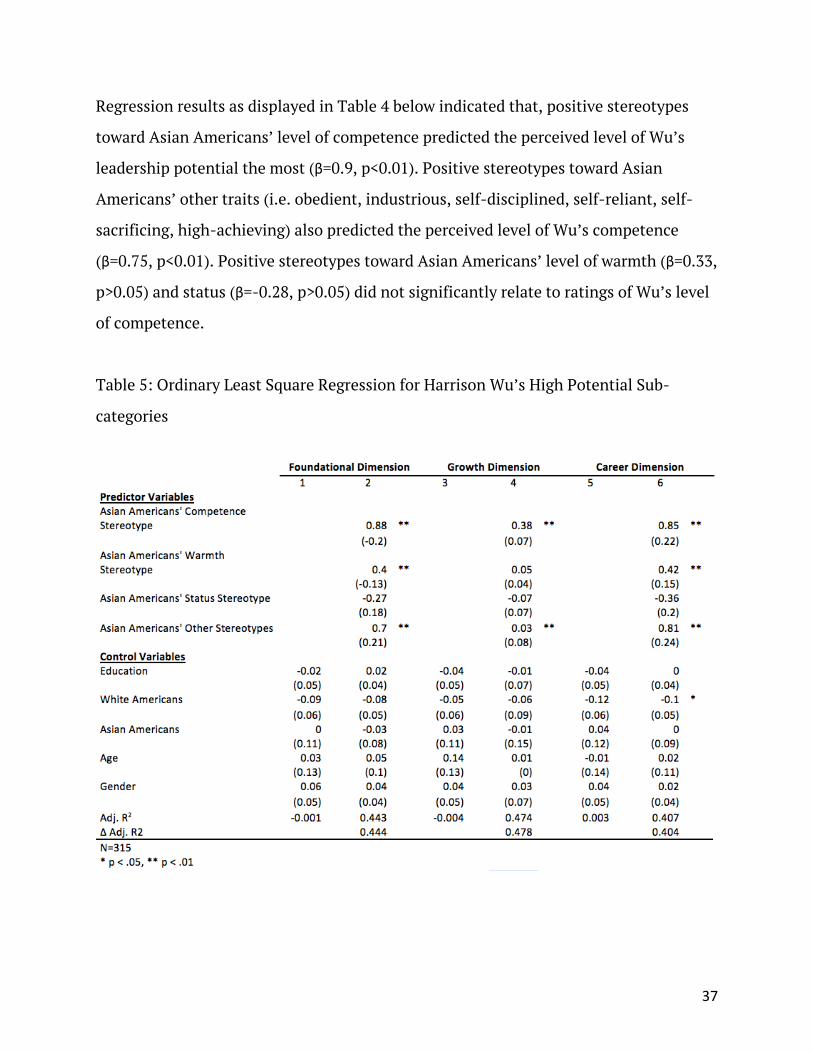
Regression results as displayed in Table 4 below indicated that, positive stereotypes
towards Asian Americans’ level of competence predicted, as hypothesized, the
perceived level of Wu’s competence the most (β=0.92, p<0.01). Positive stereotypes
toward Asian Americans’ other traits (i.e. obedient, industrious, self-disciplined, self-
reliant, self-sacrificing, high-achieving) also predicted the perceived level of Wu’s
competence (β=0.82, p<0.01). Positive stereotypes towards Asian Americans’ level of
warmth (β=0.09, p>0.05) and status (β=-0.31, p>0.05) did not significantly predict
ratings of Wu’s competence.
35
Table 3: Means, Standard Deviations, Standard Error and T-test Score for Competence
and High Potential Level
36
Table 4: Ordinary Least Square Regression for Harrison Wu’s Level of Competence and
Full High Potential
Hypothesis 3
My third hypothesis focused on how positive stereotyping affects managers’ perception
of Asian Americans’ leadership potential.
Table 3 shows that Wu received on average a higher rating on potential for leadership
(mean=5.53, S.D.=0.82) than Snyder’s (mean=5.43, S.D.=0.86). The difference was
statistically significant (t(315)=3.68, p=0.0003).
37
Regression results as displayed in Table 4 below indicated that, positive stereotypes
toward Asian Americans’ level of competence predicted the perceived level of Wu’s
leadership potential the most (β=0.9, p<0.01). Positive stereotypes toward Asian
Americans’ other traits (i.e. obedient, industrious, self-disciplined, self-reliant, self-
sacrificing, high-achieving) also predicted the perceived level of Wu’s competence
(β=0.75, p<0.01). Positive stereotypes toward Asian Americans’ level of warmth (β=0.33,
p>0.05) and status (β=-0.28, p>0.05) did not significantly relate to ratings of Wu’s level
of competence.
Table 5: Ordinary Least Square Regression for Harrison Wu’s High Potential Sub-
categories
38
V. Discussion
My study supports Hypothesis 1 and reinforces previous research that Asian Americans
are positively stereotyped in work contexts. Asian Americans are perceived to be better
than white Americans in aspects of competence, warmth, status and other attributes
(i.e. Asian Americans are thought to be more obedient, industrious, self-disciplined,
self-reliant, self-sacrificing, high-achieving). Interestingly, the most significant
difference between Asian American and White Stereotype lies in the aspect of “other
stereotypes”, which measures whether a group is obedient, industrious, self-
disciplined, self-sacrificing, and high-achieving. It should also be noted that these
traits are particular to the positive stereotypes towards Asian Americans.
My results also support Hypothesis 2 that Asian Americans are considered more
competent because of the effect of positive stereotyping. Looking at the data, the Asian
American candidate was considered to be more competent than the White American
candidate on average. All measurements of stereotypes (i.e. competence, warmth,
status, others) were positively correlated to the Asian Americans’ level of competence.
The more Asian Americans are being positively stereotyped, the more likely that they
are considered to be more competent. Particularly, the endorsement of competence
stereotypes for Asian Americans had the highest correlation with the perceived level of
their overall competence level.
My study however, did not support Hypothesis 3. I suggested that implicit beliefs about
leaders and perceived leadership skills in American society limits whom individuals see
as potential leaders. As positive stereotypes towards Asian Americans (i.e. submissive
and obedient) may bias managers’ belief in their ability to assume leadership roles, I
hypothesized that Asian Americans would be perceived to have lower leadership
potential in order explain for their low promotability in workplaces. I also suggested
39
that the perception of group threat (i.e. White Americans versus Asian Americans) may
exist such that Asian Americans are less likely to be promoted even though they are
perceived to be more competent.
The results however seemed to suggest otherwise. In general, Asian Americans were
perceived to have higher leadership potential than White Americans. Positive
stereotypes towards Asian Americans were found to significantly and positively predict
ratings of their level of leadership potential. The acknowledgement towards Asian
Americans’ potential as leaders seems to suggest that group threat theory does not
apply in this case.
Asian Americans were also not perceived as submissive and obedient as I had predicted.
According to the study, Asian Americans were not rated lower than White Americans
on the item of dominance. They were rated higher in all high potential measurements
than White Americans except for two items, which were risk-taking orientation and
sociability.
These observations bring us back to the question that was raised at the very beginning
of the study – Why are Asian Americans less promotable even when they are perceived
to have higher leadership potential than White Americans?
I offer four explanations for the above phenomenon which would also point us to
further research efforts in the future.
The first argument pertains to the varying degree of emphasis on leadership traits; risk-
taking orientation and sociability are possibly traits that weigh more heavily than other
potential leaders’ qualities. Even though Asian Americans were not rated lower on
dominance when compared with White Americans, the fact that they were stereotyped
40
as less risk-taking and sociable may possibly decrease general perceptions of them as
effective leaders, thus their low promotability in workplaces. More research will have to
be conducted on how American society places differing degrees of emphasis on
different leadership traits, and understand the most fundamental qualities that
individuals need to have in order to be perceived as potential leaders.
The second argument pertains to unrealistic expectations towards Asian Americans. As
suggested by previous research, positive stereotypes may also create high and
unrealistic expectations. As Asian Americans are positively stereotyped to be more
competent than White Americans, expectations towards their performance may
increase. Their performance may thus seem “poorer” even if they are performing at a
similar level as White Americans, thus their lower promotability even though they had
higher leadership potential.
The third argument pertains to the group threat theory. I suggest that White
Americans’ perception of group threat towards other groups in the society still exists,
including Asian Americans. According to the findings, Asian Americans were
positively-stereotyped for their high status in the society when compared with other
stereotype measurements. I suggest that the mere rating of Asian Americans’
leadership potential level does not capture entirely the psychological processes that
managers may be undergoing while making promotion decisions. In fact, as suggested
by previous research, employment decision can be easily subjected to implicit biases
and judgments (Purkiss & Perrewe, 2006). While these biass and judgements may not
be considered as immediate discrimination, the implicit biases that managers have
given the cultural context that they are situated in may subject them to implicit
discrimination in workplaces. This thus possibly results in the discrepancy between the
measurement of Asian Americans’ potential to be leaders, and their actual promotion
rate in the workplace. Based on these considerations, I also suggest that future research
41
be directed towards understanding the effectiveness of workplace assessment in regard
to the actual decision-making process, and how coherence could be achieved in both
assessments results and actual executive decisions made.
The fourth argument pertains to social desirability. Social desirability refers to the
tendency for participants to report an answer out of the motivation to make good
impressions instead of reporting true feelings and thoughts (Stodel, 2015). Especially in
high-stakes situations (e.g. judging the competence level of two people of different
race), respondents are likely to give distorted answers (i.e. rating Harrison Wu with
higher level of competence and leadership potential) that may not reflect reality (i.e.
low promotability of Asian Americans) in order to obtain social acceptance (Perinelli &
Gremigni, 2016) and not appear to be racist against Asian Americans, thus my lack of
findings for Hypothesis 3.
Implications of Research
The above findings suggest that stereotypes towards Asian Americans are still strong in
workplaces. Even though these stereotypes are positive, they still make a distinction
between Asian Americans and White Americans. The way we stereotype other members
in the society may inherently affect managers’ decision-making process. A few talent
management strategies will thus be suggested here to reduce the potential negative
effects of positive stereotyping towards Asian Americans.
Admittedly, implicit bias is highly resistant to change (Gaither, 2018). Due to early
socialization and learning, it might be hard for people to unlearn prejudices or labeling
that are acquired through the cultural environments that we are raised under. Various
strategies have thus been suggested to reduce stereotype threats, where a majority of
them focus on lessening the effects of stereotypes and creating environments that are
42
essential to reducing stereotype effects. For instance, Hall (2014) recommended a
three-step approach where organizations are advised to examine their general
practices, devise intervention policies, identify ways to measure the effectiveness of
those intervention policies, and implement intervention policies that would reduce
biases. A few of the solutions under these approaches include devising programs to
help employees and managers to be more aware of the unconscious biases that affect
their evaluations, increasing minority representation at all organizational levels, and
making good leadership characteristics explicit and avoiding stereotyped descriptions
(Leicht, de Moura & Crisp, 2014).
Acknowledging the fact that we all have biases may also be the first step to take in
order to reduce stereotypes, which can reduce our reliance on any generalizations that
resulted from stereotyping (Dalton, 2018). Beliefs that are a result of stereotypes can
be unlearned (Kirwan Institute for the Study of Race and Ethnicity, 2015). To resolve
implicit bias, Dalton (2018) has suggested three solutions regarding recruiting, hiring
and retention.
On recruiting, companies should include a diversity statement, which would explain
the organization’s value and commitment related to diversity. Such statements would
welcome and help increase diversity in applicants’ background.
On hiring, it is suggested that interviews be standardized and that the interview
committee is diversified. This method was also suggested by Koch, Konigorki and
Sieverding (2014) to mediate stereotype effects. Standardizing interviews may include
standardizing interview questions and employment standards so that the intensity
level of assessments during the hiring process would be the same for all applicants. By
doing so, all interviewers will be evaluating applicants along the same guideline and
will be less subjected to personal biases. A more consistent and accurate evaluation of
43
applicants’ actual ability and performance could be ensured, as such recruiting the
brightest and most suitable talents to the company. By making adjustments to their
hiring process and having a second representative of the employer present during the
interviews, preferably someone who is of a different race but same employment level as
the first interviewer, organizations will also be able to counteract any stereotypes that
may be activated during the interview process.
On retention, Dalton (2018) suggested the importance of promoting an inclusive
workplace through having cultural awareness training, mentorship programs and clear
criteria for promotion to reduce biases in the decision-making process. According to
Barak (2016), an inclusive workplace is defined with its ability to value differences
within its workforce and collaborate with individuals, groups and organizations across
national and cultural boundaries. This entails that the workplace has to be based on
pluralistic value and respects all cultural perspectives without imposing personal biases
or stereotypes during the decision-making processes. In order to prevent and assess the
level of biases in workplaces, organizations can carry out assessments that would
gather confidential information from employees regarding the employment process,
which may include compensation, development, performance management,
promotion, hiring and interview process, etc. These assessments will provide
employers with valuable information on employees’ perception of and experience with
the employment process, and whether any of them have received biased treatment in
the workplace. By doing so, employers will be able to devise more effective strategies
on how to create an inclusive environment in workplaces.
Godsil (2017) also suggested that stereotype threats and biases could be reduced when
people feel more connected. By priming people to envision positive inter-group
interactions and expectations, cross-racial experiences could be elevated, especially if
the everyone feels welcomed. Creating a sense of intergroup cooperation while still

44
acknowledging group differences can cultivate a shared sense of identity, intimacy and
understanding that dispel biases (Godsil, 2017). Stereotype threat effect can be reduced
when “the boundary between stereotyped members and un-stereotyped members of a
group is blurred” (Wen, Wu & Dong, 2016). If managers are able to encourage self-
affirmation and provide role models who are of a different race in the workplace,
stereotype threat could be reduced (Wen, Wu & Dong, 2016).
All recommendations given above can eliminate the effects of positive stereotyping
towards Asian Americans. As Asian Americans are faced with biased evaluations
because of unrealistic expectations from manaters, standardizing interview processes
and also increasing the interviewing committee diversity will help ensure that they will
be protected from certain biases. The effort to promote a more inclusive workplace will
also help reduce stereotype threats. By promoting positive inter-group interactions and
bridging boundaries between stereotyped and non-stereotyped members,
understanding can be built which eventually eliminates biases. The same goal could be
achieved by encouraging the application of diversity statements, cultural awareness
training, and mentorship programs, and any other opportunities that encourage
intergroup cooperation.
Limitations and Future Research
My thesis was limited by several factors. Firstly, the stereotype scale does not measure
the threat of the stereotyped group. The stereotype towards Asian Americans could be
further detailed if negative traits related to stereotypes are also measured (e.g.
antisocial, cold, cunning, deceitful, narrow- minded, nerdy, pushy, selfish, sly).
By using participants from Amazon’s Mechanical Turk, I also had no control over the
race demographics that were collected. An understanding on how different races rate
45
Asian Americans and White Americans would have significant implications on future
research efforts.
Given the current finding and research, I suggest the following studies in the future:
- Understand how Asian Americans can cope with stereotypes
- Understand how stereotyped members can deal with stereotypes in general
- Understand how to reduce stereotypes and biases in workplaces
- Understand whether the American society is placing more emphasis on specific
leadership traits (e.g. risk-taking orientation and sociability)
- Understand how Asian Americans feel about positive stereotypes and how they
deal with it in relation to their racial identity
- Understand the role of social desirability bias in workplaces and how it affects
workplace diversity
- Understand the effectiveness of workplace assessment in regard to the actual
decision-making process in workplace
- Understand how American society places differing degree of emphases on
different leadership traits
46
VI. Conclusion
In this study, I have identified the continuing positive stereotypes towards Asian
Americans in workplaces. Even though Asian Americans have been ranked consistently
higher than White Americans on the level of competence and potential for leadership,
they are still one of the least promotable groups in the workforce. This research
suggests that there is still room for improvement for U.S. companies to promote a more
inclusive mindset in workplaces by eliminating biases that may originate from inherent
stereotyping. Implementing diversity-promoting policies would allow companies to
disregard biases and open up their recruiting pipeline to those who are of different
races and are also suitable for their future successes.
Ultimately, the findings of this research not only address the challenges that Asian
Americans may possibly face in the society, but also individuals and groups that we
perceive to be different from “us”. An elimination of biases and stereotypes is not only
paramount to the development of healthy organizations, but also to the community
and society that we reside in. By suggesting research that could be done in the future, I
look forward to the building of a society that embraces more understanding,
acceptance, and openness.
47
References
Barak, M. (2017). Managing Diversity: Toward a Globally Inclusive Workplace. Los
Angeles: Sage Publication.
Bell, B. & Klein, K. (2001). Effects of Disability, Gender, and Job Level on Ratings of Job
Applicants. Rehabilitation Psychology, 46(3), 229 – 246.
Biernat, M. (2012). Stereotypes and Shifting Standards: Forming, Communicating and
Translating Person Impressions. Advances in Experimental Social Psychology, Vol. 45.
Bowness, A. (2017). Five Ways to Develop Great Leaders. Strategic HR Review, 16(4),
189-191.
Brescoll, L. (2016). Leading with their hearts? How gender stereotypes of emotion lead to
biased evaluations of female leaders. The Leadership Quarterly, 415-428.
Fiske, S. T., & Lee, T. L. (2008). Stereotypes and Prejudice Create Workplace
Discrimination. Diversity at Work (13-52). New York, NY, US: Cambridge University
Press.
Bursell, M. & Jansson, F. (2018). Diversity Preferences Among Employees and Ethno-
Racial Workplace Segregation. Social Science Research, 2018(74), 62-76.
Carnes, A., Houghton, J. & Ellison, C. (2013). What Matters Most in Leader Selection?
The Role of Personality and Implicit Leadership Theories. Leadership & Organization
Development Journal, 36(4).
48
Chan, W. & Mendelsohn, A. (2010). Disentangling Stereotype and Person Effects: Do
Social Stereotype Bias Observer Judgment of Personality? Journal of Research in
Personality, 44(2), 251-257.
Cheng, A. et al. (2017). Model Minority Stereotype: Influence on Perceived Mental Health
Needs of Asian Americans. Journal of Immigrant Minority Health, 2017(19), 572-581.
Church, A. (2010). Identifying and Assessing High-Potential Talent: Current
Organizational Practices. Research Gate (January 2010).
Clark, J., Thiem, K. & Kang, S. (2017). Positive Stereotype Validation: The Bolstering
Effects of Activating Positive Stereotypes After Intellectual Performance. Personality and
Social Psychology Bulletin, 43(12), 1630-1642.
Conger, J., & Kanungo, R. (1994). Charismatic Leadership in Organizations: Perceived
Behavioral Attributes and Their Measurement. Journal of Organizational Behavior, 15(5),
439-452. Retrieved from http://www.jstor.org/stable/2488215.
Czopp, A., Kay, A. & Cheryan, A. (2015). Positive Stereotypes are Pervasive and Powerful.
Perspectives on Psychological Science, 10(4) 451-463.
Czopp, A. (2008). When is a Compliment Not a Compliment? Evaluating Expressions of
Positive Stereotypes. Journal of Experimental Social Psychology, 2008(44),413-420.
Dalton, S. & Villagran, M. (2018). Minimizing and Addressing Implicit Bias in the
Workplace. C&RL News. October 2018.
49
Dhingra, P. (2003). Being American Between Black and White: Second-Generation Asian
American Professionals’ Racial Identities. Journal of Asian American Studies, 6(2), 117-
147.
DiTomaso, N. (2013). The American Non-Dilemma: Racial Inequality without Racism.
Russell Sage Foundation, New York. Retrieved from
https://books.google.com/books?id=OwpRAgAAQBAJ&printsec=frontcover&dq=Negati
ve+impact+of+Positive+Stereotyping+Are+Asian+Americans+promotable?&hl=en&sa=
X&ved=0ahUKEwisiPSpq7LeAhUBvFMKHYKFBOcQ6AEIKjAA#v=onepage&q&f=false.
Downs, L. (2015). Star Talent: Investing in High-potential Employees for Organizational
Success. Industrial and Commercial Training, 47(7), 349-355.
Eagly, A. & Chin, J. (2010). Diversity and Leadership in a Changing World. American
Psychologist Association, 65(5), 216-234.
Freeman, l. (2017). Embodied Harm: A Phenomenological Engagement with Stereotype
Threat. Human Studies, 40(4), 637-662.
Finkelstein, L., Costanza, D. & Goodwin, G. (2017). Do Your High Potentials Have
Potential? The Impact of Individual Differences and Designation on Leader Success. Wiley,
Personnel Psychology.
Fiske, S. & North, M. (n.d.) Measures of Stereotyping and Prejudice: Barometers of Bias.
Princeton University: Department of Psychology.
Fiske, S. & Cuddy, A. (2002). A Model of (often mixed) Stereotype Content: Competence
and Warmth Respectively Follow from Perceived Status and Competition. Journal of
Personality and Social Psychology, 82(6), 878-902.
50
Gaither, S. & Loyd, A. (2018). Racial/ethnic Socialization of White Youth: What we Know
and Future Directions. Journal of Applied Developmental Psychology, Nov-Dec 2018
(59), 54-64.
Galinsky, A., Hall, E. & Cuddy, A. (2013). Gendered Races: Implications for Interracial
Marriage, Leadership Selection, and Athletic Participation. Psychological Science, 24(4)
498-506.
Gee, B., & Denise, P. (2018). Asian Americans are the Least Likely Group in the U.S. to be
promoted to Management. Retrieved from https://hbr.org/2018/05/asian-americans-are-
the-least-likely-group-in-the-u-s-to-be-promoted-to-management.
Gee, B. & Peck, D. (2015). The Illusion of Asian Success; Scant Progress for Minorities in
Cracking the Glass Ceiling from 2007- 2015. Ascend. Retrieved from
http://aapidata.com/wp-content/uploads/2017/10/TheIllusionofAsianSuccess.pdf.
George, S., Duran, N., & Norris, K. (2014). A Systematic Review of Barriers and
Facilitators to Minority Research Participation Among African Americans, Latinos, Asian
Americans, and Pacific Islanders. American Journal of Public Health, 104(2), e16-e31.
Glick, M. (2017). Believing is Seeing – Confirmation Bias. CrossMark. JADA, 148 (3).
Greenwald, A. & Krieger, L. (2006). Implicit Bias: Scientific Foundations. California Law
Review, Inc.
Gundemir, S. & Carton, A. (2018). The Impact of Organizational Performance on the
Emergence of Asian American Leaders. Journal of Applied Psychology, 104 (1), 107-122.
51
Hall, W. & Schmader, T. (2014). Stereotype Threat in School and at Work: Putting Science
into Practice. Policy Insights from the Behavioral and Brian Sciences, Vol. I (I), 30-37.
Heilman, M. (2012). Gender Stereotypes and Workplace Bias. Research on Organizational
Behavior, 2012(32), 113-135.
Ho, C. & Jackson, J. (2006). Attitude Toward Asian Americans: Theory and Measurement.
Journal of Applied Social Psychology, 31(8), 1553-1581.
Hsin, A., & Xie, Y. (2014). Explaining Asian Americans’ Academic Advantage Over
Whites. Proceedings of the National Academy of Sciences, 111(23), 8416-8421.
Humes, K., Jones, N., & Ramirez, R. (2011). Overview of Race and Hispanic Origin: 2010.
United States Census Bureau. U.S. Department of Bureau. Retrieved from
https://upload.wikimedia.org/wikipedia/commons/8/87/C2010br-02.pdf.
Johnson, M. A., Stevenson, R., & Letwin, C. (2018). A Woman’s place is in the… Startup?
Crowd Funder Judgments, Implicit Bias, and the Stereotype Content Model. Journal of
Business Venturing, 2018(33), 813-831.
Kawai, Y. (2004). Stereotyping Asian Americans: The Dialectic of the Model Minority and
the Yellow Peril. The Howard Journal of Communications, 16(2), 109-130.
Kay, A., Day, M., Zanna, M. & Nussbaum, D. (2012). The Insidious (and ironic) Effects of
Positive Stereotypes. Journal of Experimental Social Psychology, 2013(49), 287-291.
Koch S., Konigorki, S. & Sieverding, M. (2014). Sexist Behavior Undermines Women’s
Performance in a Job Application Situation. Sex Roles, 2014(70), 79-87.
52
Kohatsu, E., Dulay, M., & Lam, Cynthia (2001). Using Racial Identity Theory to Explore
Racial Mistrust and Interracial Contact Among Asian Americans. Journal of Counseling
and Development, 78(3), 334.
Lingren, J. & McGowan, M. (2006). Testing the “Model Minority Myth”. Northwestern
University Law Review, 100(1), 331.
Lee, S., et al. (2009). Model Minority at Risk: Expressed Needs of Mental Health by Asian
American Young Adults. Journal of Community Health, 34(2), 144.
Lee, J., & Zhou, M. (2014). The Success Frame and Achievement Paradox: The Costs and
Consequences for Asian Americans. Race and Social Problems, 6(1), 38-55.
Liu, A. & Xie, Y. (2016). Why do Asian Americans Academically Outperform Whites? – The
Cultural Explanation Revisited. Social Science Research, 2016, 210-226.
Lopez, G., Ruiz, N., & Patten, E. (2017, September 8). Key Facts about Asian Americans a
diverse and growing population. Pew Research Center. Retrieved from
http://www.pewresearch.org/fact-tank/2017/09/08/key-facts-about-asian-americans/.
Lopex, L. (2004). Beyond Black and White: General Support for Race-Conscious Policies
Among African Americans, Latinos, Asian Americans and Whites. Political Research
Quarterly, 57(4), 633-642.
Maddux, W., Galinsky, A. & Cuddy, A. (2008). When Being a Model Minority is Good…
and Bad: Realistic Threat Explains Negativity Toward Asian Americans. PSPB, 34(1), 74-
89.

53
Madon,S. et al. (2001). Ethnic and National Stereotypes: The Princeton Trilogy Revisited
and Revised. Personality and Social Psychology Bulletin, 27. 996-1010.
Morris, S. et al. (2009). Global Challenges to Replicating HR: The Role of People, Processes,
and Systems. Wiley Periodicals Inc., Human Resource Management, 48(6), 973-995.
Moskowitz, G. & Carter, D. (2018). Confirmation Bias and the Stereotype of the Black
Athlete. Psychology of Sport & Exercise, 2018(36), 139-146.
Murphy, S. & Hoyt, C. (2016). Managing to Clear the Air: Stereotype Threat, Women, and
Leadership. The Leadership Quarterly, 2016(27), 387-399.
Park, J. (2008). Second-Generation Asian American Pan-Ethnic Identity: Pluralized
meanings of a Racial Label. Sociological Perspectives, 51(3), 541-561.
Perinelli, E., & Gremigni, P. (2016). Use of Social Desirability Scales in Clinical
Psychology: A Systematic Review. Journal of Clinical Psychology, 72(6), 534. Retrieved
from https://search-proquest-
com.erl.lib.byu.edu/docview/1794131897?accountid=4488.
Petersen, T. & Togstad, T. (2006). Getting the Offer: Sex Discrimination. Research in
Social Stratification and Mobility, 2006(24), 239- 257.
Pew Research Center (2013). The Rise of Asian Americans. Retrieved from
http://www.pewsocialtrends.org/2012/06/19/the-rise-of-asian-americans/.
Purkiss, S., Perrewe, P., Gillespie, T., Mayes, B., & Ferris, G. (2006). Implicit Sources of
Bias in Employment Interview Judgments and Decisions. Organizational Behavior and
Human Decision Processes, 101(2), 152-167.

54
Ready, D., Conger, J. & Hill, L.(2010). Should You Tell Her She’s a High Potential?
Harvard Business Review, June 2010.
Schommer-Aikins, M., & Easter, M. (2008). Epistemological beliefs' contributions to study
strategies of Asian Americans and European Americans. Journal of Educational
Psychology, 100(4), 920.
Shek, Y. (2006). Asian American Masculinity: A Review of the Literature. Journal of Men’s
Studies, 14(3), 379.
Shih, M., Pittinsky, T., & Ambady, N. (1999). Stereotype Susceptibility: Identity Salience
and Shifts in Quantitative Performance. American Psychological Society, 10(1)
Silzer, R., Church, A. & Rotolo, C. (2016). I-o Practice in Action: Solving the Leadership
Potential Identification Challenge in Organizations. Industrial and Organizational
Psychology, 9(4), 814-830.
Silzer R., & Church A. (2009). The Pearls and Perils of Identifying Potential. Industrial
and Organizational Psychology Journal: Perspectives on Science and Practice, 2(401).
Siy, J. & Cheryan, S. (2016). Prejudice Masquerading as Praise: The Negative Echo of
Positive Stereotypes. Personality and Social Psychology Bulletin, 42(7), 941-954.
Siy, J. & Cheryan, S. (2012). When Compliments Fail to Flatter: American Individualism
and Responses to Positive Stereotype. Journal of Personality and Social Psychology, 104,
87-102.

55
Stahl, G., et al. (2012). Six Principles of Effective Global Talent Management. MIT Sloan
Management Review, 53(2).
Stodel, M. (2015). But What Will People Think?: Getting Beyond Social Desirability Bias
by Increasing Cognitive Load. International Journal of Market Research, 57(2), 313–322.
Tomasette, C. & Appoloni, S. (2013). A Lesson Not to be Learned? Understanding
Stereotype Threat Does Not Protect Women from Stereotype Threat. Social Psychology of
Education, 16(2), 199-213.
Tso, T. (2018, August 8). The Bamboo Glass Ceiling. Slate. Retrieved from
https://slate.com/human-interest/2018/08/asian-american-women-face-a-glass-
ceiling-and-a-bamboo-ceiling-at-work.html.
United States Office of Personnel Management (2016). Federal Equal Opportunity
Recruitment program (FEORP) Report to Congress. Retrieved from
https://www.opm.gov/policy-data-oversight/diversity-and-inclusion/reports/feorp-
2016.pdf.
Visalvanich, N. (2017). Asian Candidates in America: The Surprising Effects of Positive
Racial Stereotyping. Political Research Quarterly, 70 (I), 68-81.
Wanke, M. & Hansen J, (2009). Think of Capable Others and You Can Make It! Self-
Efficacy Mediates the Effect of Stereotype Activation on Behavior. Social Cognition, 27(1),
76-88.
56
Wen, F., Zuo, B., Wu, Y., Dong, X. & Wang, W. (2016). Reducing the Effect of Stereotype
Threat: The Role of Coaction Contexts and Regulatory Fit. Social Psychology of
Education,19, 607-626.
Yale Law School (2017, July 18). A Portrait of Asian Americans in the Law. Yale Law
School. Retrieved from https://law.yale.edu/yls-today/news/portrait-asian-americans-
law.
Zusho, A., Pintrich, P., & Cortina, K. (2005). Motives, Goals, and Adaptive Patterns of
Performance in Asian American and Anglo-American Students. Learning and Individual
Differences, 2005(15), 141- 158.
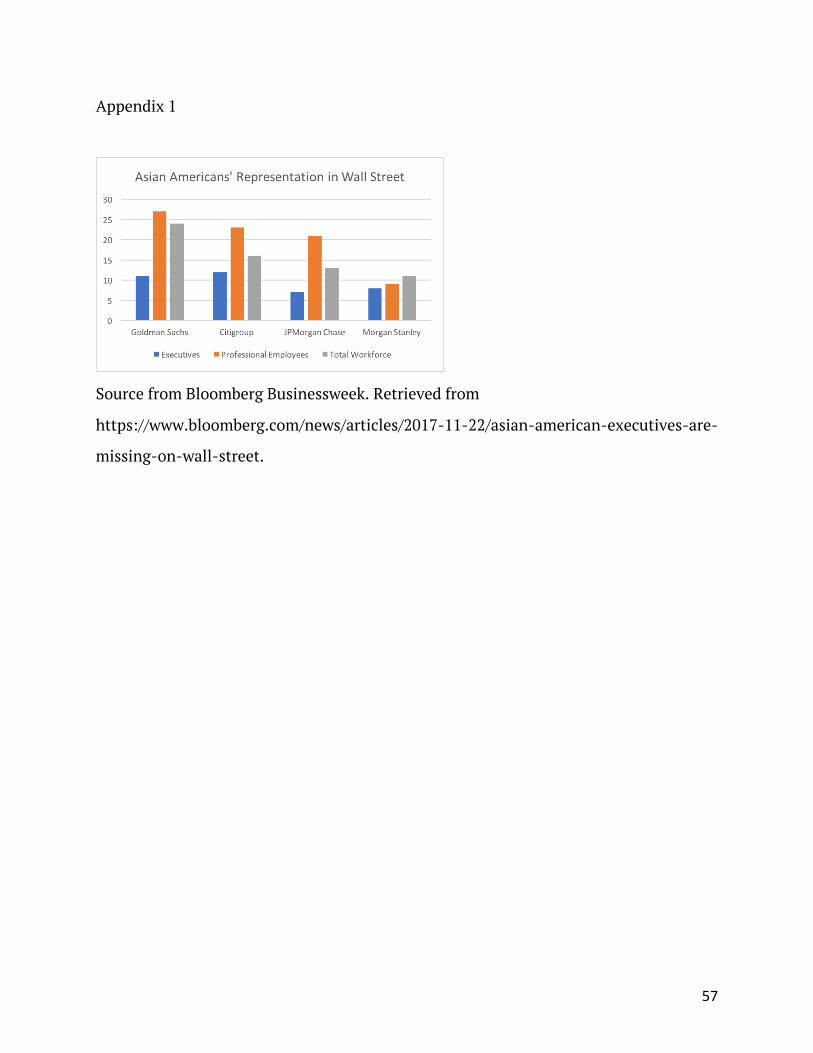
57
Appendix 1
Source from Bloomberg Businessweek. Retrieved from
https://www.bloomberg.com/news/articles/2017-11-22/asian-american-executives-are-
missing-on-wall-street.
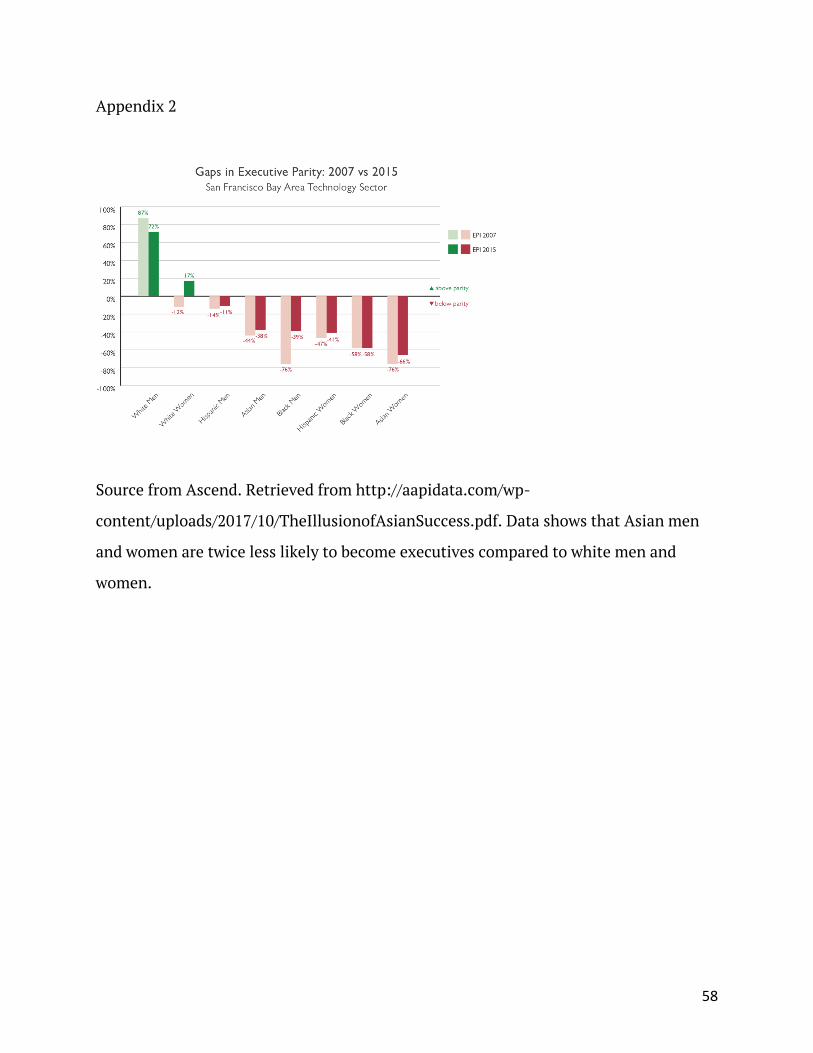
58
Appendix 2
Source from Ascend. Retrieved from http://aapidata.com/wp-
content/uploads/2017/10/TheIllusionofAsianSuccess.pdf. Data shows that Asian men
and women are twice less likely to become executives compared to white men and
women.
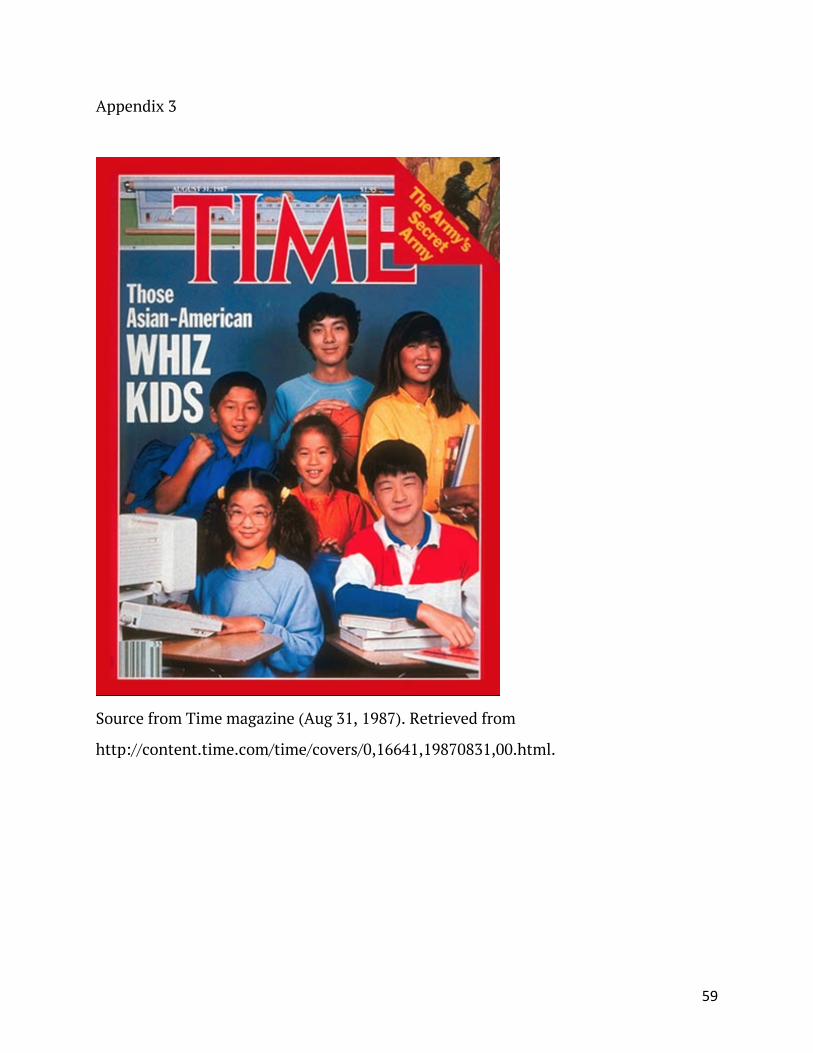
59
Appendix 3
Source from Time magazine (Aug 31, 1987). Retrieved from
http://content.time.com/time/covers/0,16641,19870831,00.html.
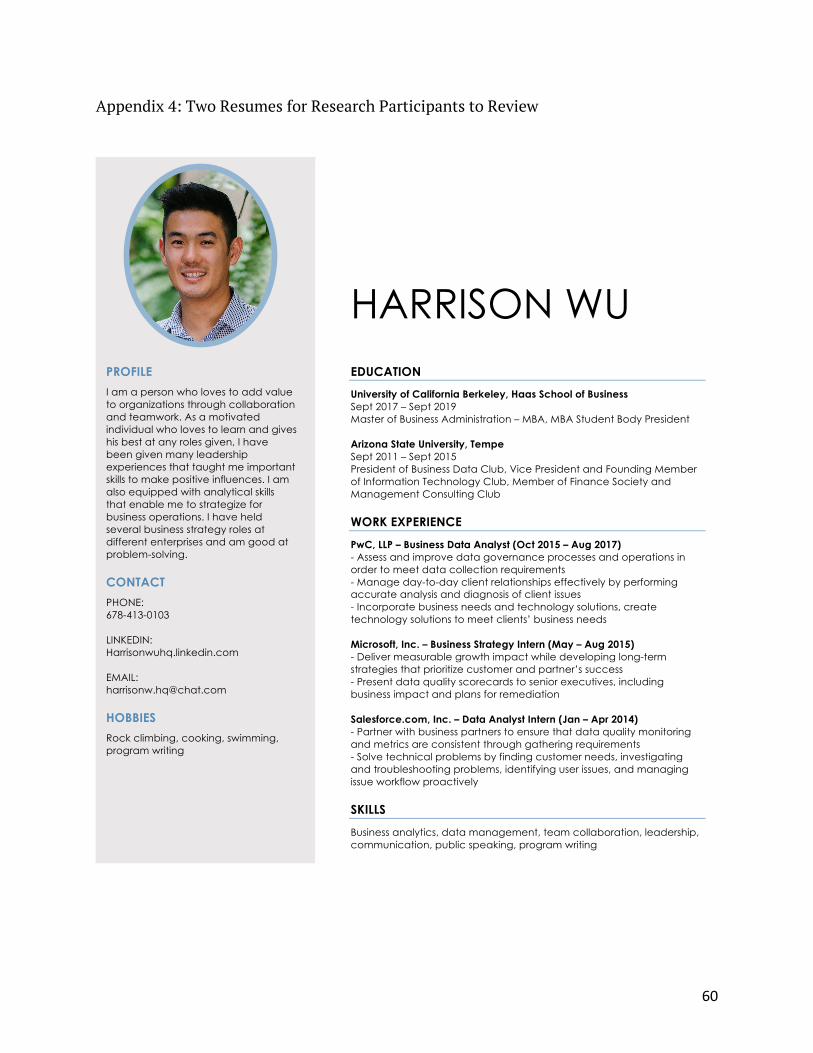
60
Appendix 4: Two Resumes for Research Participants to Review
HARRISON WU
PROFILE I am a person who loves to add value to organizations through collaboration and teamwork. As a motivated individual who loves to learn and gives his best at any roles given, I have been given many leadership experiences that taught me important skills to make positive influences. I am also equipped with analytical skills that enable me to strategize for business operations. I have held several business strategy roles at different enterprises and am good at problem-solving.
CONTACT PHONE: 678-413-0103 LINKEDIN: Harrisonwuhq.linkedin.com EMAIL: [email protected]
HOBBIES Rock climbing, cooking, swimming, program writing
EDUCATION University of California Berkeley, Haas School of Business Sept 2017 – Sept 2019 Master of Business Administration – MBA, MBA Student Body President Arizona State University, Tempe Sept 2011 – Sept 2015 President of Business Data Club, Vice President and Founding Member of Information Technology Club, Member of Finance Society and Management Consulting Club
WORK EXPERIENCE
PwC, LLP – Business Data Analyst (Oct 2015 – Aug 2017) - Assess and improve data governance processes and operations in order to meet data collection requirements - Manage day-to-day client relationships effectively by performing accurate analysis and diagnosis of client issues - Incorporate business needs and technology solutions, create technology solutions to meet clients’ business needs Microsoft, Inc. – Business Strategy Intern (May – Aug 2015) - Deliver measurable growth impact while developing long-term strategies that prioritize customer and partner’s success - Present data quality scorecards to senior executives, including business impact and plans for remediation Salesforce.com, Inc. – Data Analyst Intern (Jan – Apr 2014) - Partner with business partners to ensure that data quality monitoring and metrics are consistent through gathering requirements - Solve technical problems by finding customer needs, investigating and troubleshooting problems, identifying user issues, and managing issue workflow proactively
SKILLS
Business analytics, data management, team collaboration, leadership, communication, public speaking, program writing

61
JEFF SNYDER
PROFILE I am a driven learner who strives to add value to any organizations I work for. I am passionate about teamwork and collaboration, and always do as much as I can in any given roles. I have held several business strategy roles at different companies and am quick in finding solutions to problems. Many leadership experiences have also taught me valuable skills that will help me make a positive impact. I am equipped with analytical skills that enable me to strategize for business operations.
CONTACT PHONE: 678-555-0103 LINKEDIN: Jeffsniderben.linkedin.com EMAIL: [email protected]
HOBBIES Golfing, reading, jogging, program writing
EDUCATION University of Chicago, Booth School of Business Sept 2017 – Sept 2019 Masters of Business Administration – MBA, MBA Student Body President Indiana University, Bloomington Sept 2011 – Sept 2015 President of Data Analytics Club, Vice President and Founding Member of Information System Club, Member of Economics Society and Management Consulting Club
WORK EXPERIENCE
Deloitte, LLP – Business Data Analyst (Oct 2015 – Aug 2017) - Measure and optimize data governance processes and operations in order to meet data protection requirements - Perform accurate analysis and effective diagnosis of client issues and manage day-to-day client relationships - Integrate business needs and technology solutions, create technology solutions to meet clients’ business needs Google, Inc. – Business Strategy Intern (May – Aug 2015) - Develop holistic growth strategies that focus on customer and partner’s success, while delivering measurable growth impact - Summarize and communicate data to cross-functional senior leaders often, including business impact and plans for remediation Hewlett Packard, Inc. – Data Analyst Intern (Jan – Apr 2014) - Work with business stakeholders to gather requirements for consistent data quality monitoring and metrics - Address technical issues by investigating and troubleshooting problems, finding user issues, managing issue workflow and proactively identifying consumer needs
SKILLS
Business management, data analytics, teamwork, leadership, communication, public speaking, program writing

62
Appendix 5: Survey Survey
Start of Block: Screening Survey
In the following section you will be asked a series of demographic questions. This is a screening survey to determine whether you are eligible to complete the actual study. Please answer as honestly as possible.
Are you currently employed?
o Yes (1)
o No (0)
In which industry are you currently employed?
� Forestry, fishing, hunting or agriculture support (1) ... Unclassified establishments (20)
Please type your job title below:
________________________________________________________________
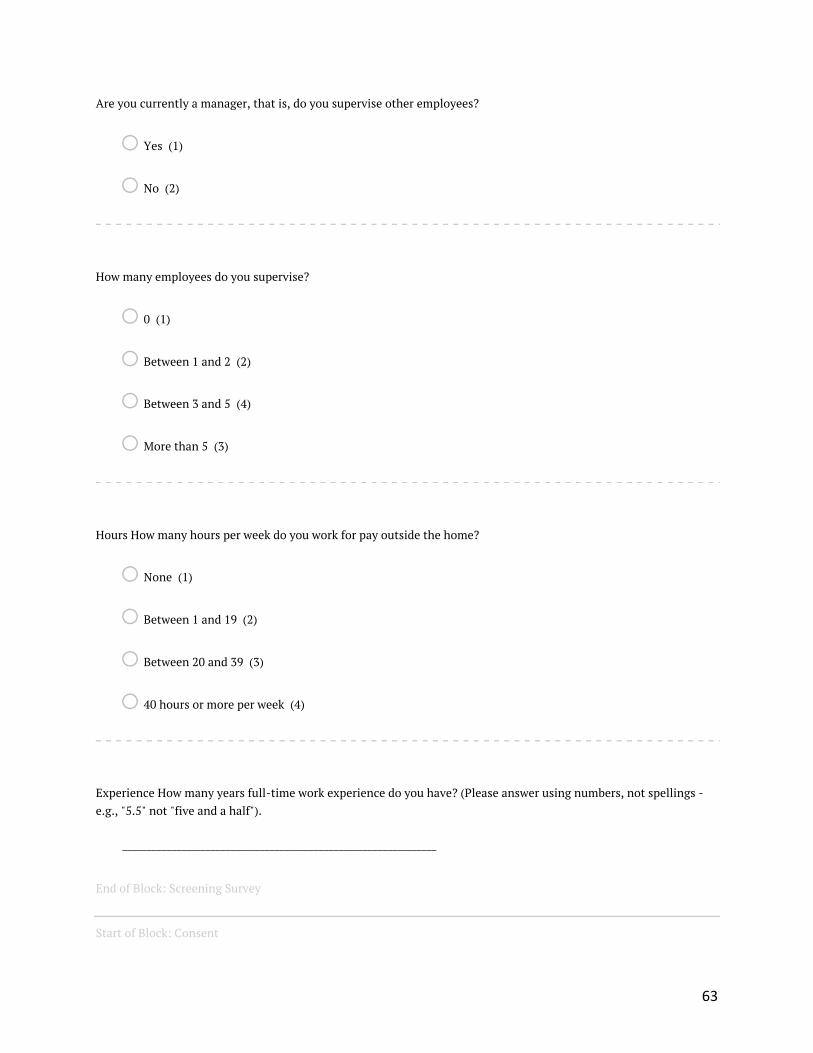
63
Are you currently a manager, that is, do you supervise other employees?
o Yes (1)
o No (2)
How many employees do you supervise?
o 0 (1)
o Between 1 and 2 (2)
o Between 3 and 5 (4)
o More than 5 (3)
Hours How many hours per week do you work for pay outside the home?
o None (1)
o Between 1 and 19 (2)
o Between 20 and 39 (3)
o 40 hours or more per week (4)
Experience How many years full-time work experience do you have? (Please answer using numbers, not spellings - e.g., "5.5" not "five and a half").
________________________________________________________________
End of Block: Screening Survey
Start of Block: Consent
64
Thank you. You have passed the screening qualifications and are eligible to participate in this study.
Page Break
Consent to be Research Participant Introduction This research study is being conducted by Dr. Taeya Howell, an Assistant Professor at Brigham Young University to determine the effects of stereotyping on individuals and workplaces. You were invited to participate because you qualify as a research participant based on the information that you have provided. Procedures If you agree to participate in this research study, the following will occur: · You will be asked to read two resumes of two recent MBA graduates · You will be asked to complete a survey based on your understanding of the two MBA graduates’ background and resumes · the survey will be taken online from a location of your choosing · total time commitment will be 10 - 15 minutes Risks/Discomforts This research should not induce any discomfort to you. Should you feel uncomfortable answering any of the survey questions, please discontinue taking the survey and exit the website. Benefits There will be no direct benefits to you. It is hoped, however, that through your participation researchers may learn about effects of stereotyping and may be able to assist organizations to better manage employee talent. Confidentiality The research data will be kept in the researcher’s Qualtrics account and only the research team will have access to the data. At the conclusion of the study, all identifying information will be removed and the data will be kept in the researcher's locked database. Confidentiality and anonymity of all research participants are ensured in this research. Compensation You will receive $2 for your participation; compensation will not be prorated. Participation Participation in this research study is voluntary. You have the right to withdraw at any time or refuse to participate entirely without jeopardy to your employment status or standing in workplaces. Questions about the Research If you have questions regarding this study, you may contact Taeya Howell at [email protected] or at (801) 422-0430 for further information.
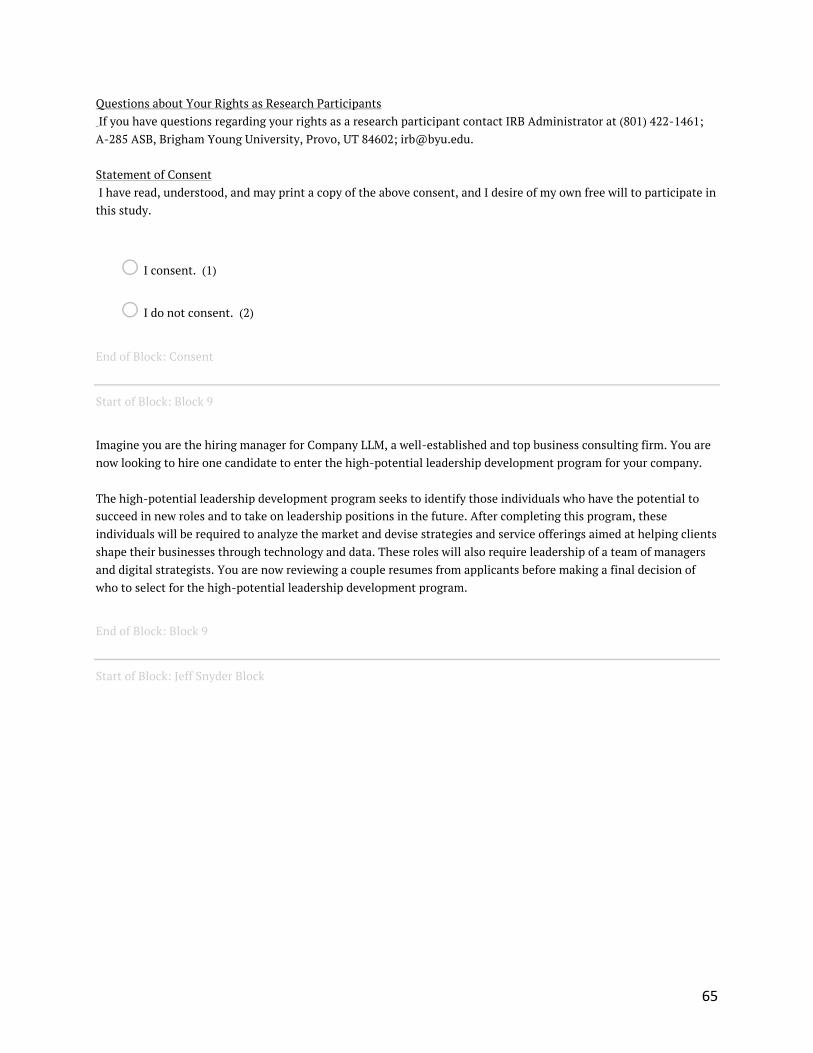
65
Questions about Your Rights as Research Participants If you have questions regarding your rights as a research participant contact IRB Administrator at (801) 422-1461; A-285 ASB, Brigham Young University, Provo, UT 84602; [email protected]. Statement of Consent I have read, understood, and may print a copy of the above consent, and I desire of my own free will to participate in this study.
o I consent. (1)
o I do not consent. (2)
End of Block: Consent
Start of Block: Block 9
Imagine you are the hiring manager for Company LLM, a well-established and top business consulting firm. You are now looking to hire one candidate to enter the high-potential leadership development program for your company. The high-potential leadership development program seeks to identify those individuals who have the potential to succeed in new roles and to take on leadership positions in the future. After completing this program, these individuals will be required to analyze the market and devise strategies and service offerings aimed at helping clients shape their businesses through technology and data. These roles will also require leadership of a team of managers and digital strategists. You are now reviewing a couple resumes from applicants before making a final decision of who to select for the high-potential leadership development program.
End of Block: Block 9
Start of Block: Jeff Snyder Block
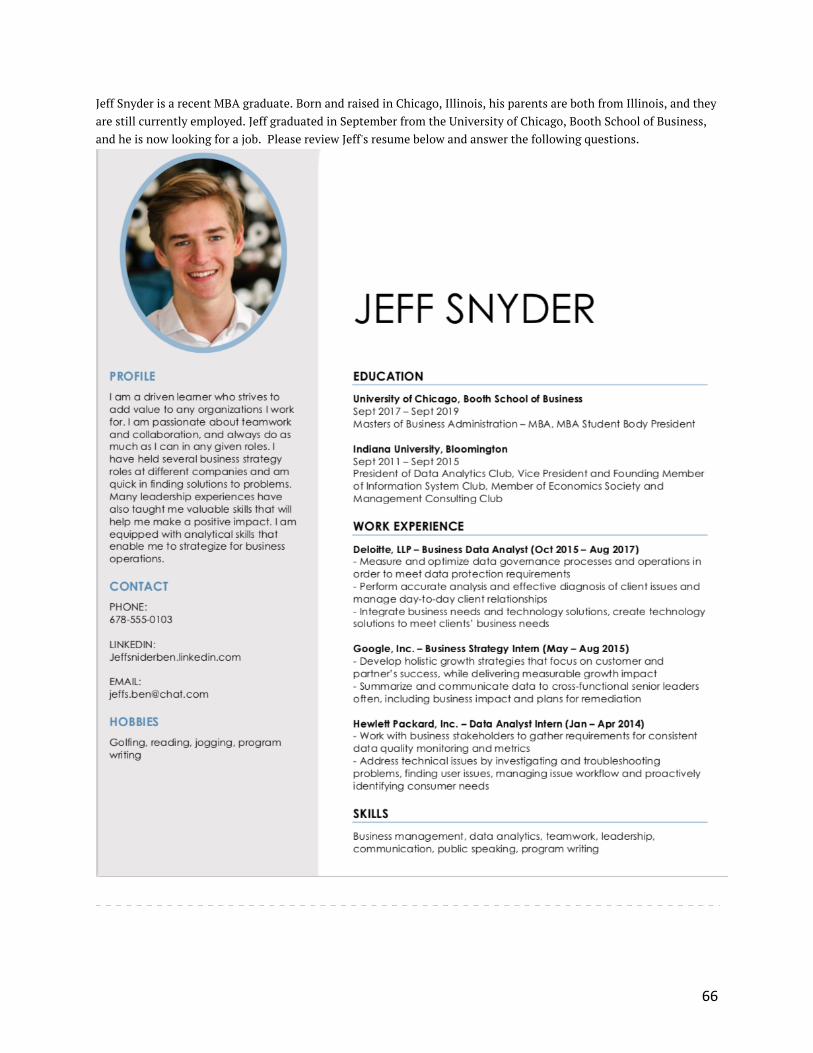
66
Jeff Snyder is a recent MBA graduate. Born and raised in Chicago, Illinois, his parents are both from Illinois, and they are still currently employed. Jeff graduated in September from the University of Chicago, Booth School of Business, and he is now looking for a job. Please review Jeff's resume below and answer the following questions.
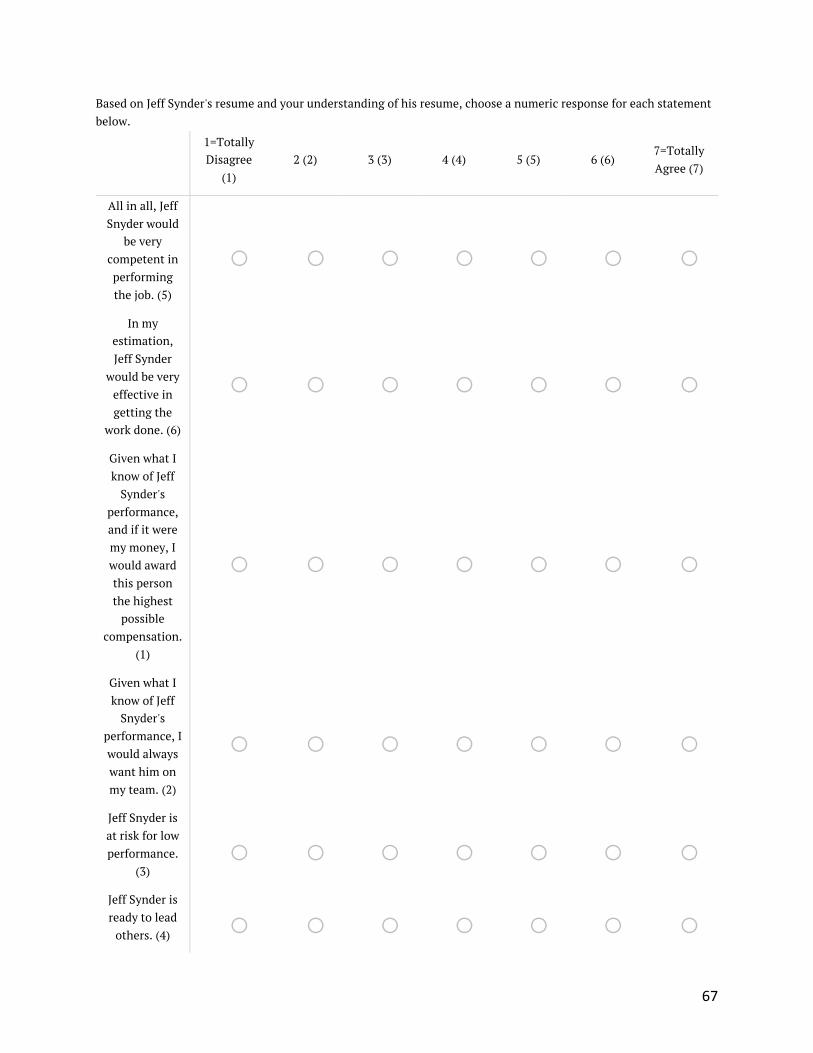
67
Based on Jeff Synder's resume and your understanding of his resume, choose a numeric response for each statement below.
1=Totally Disagree
(1) 2 (2) 3 (3) 4 (4) 5 (5) 6 (6)
7=Totally Agree (7)
All in all, Jeff Snyder would
be very competent in performing the job. (5)
o o o o o o o
In my estimation, Jeff Synder
would be very effective in getting the
work done. (6)
o o o o o o o
Given what I know of Jeff
Synder's performance, and if it were my money, I would award this person the highest
possible compensation.
(1)
o o o o o o o
Given what I know of Jeff
Snyder's performance, I would always want him on my team. (2)
o o o o o o o
Jeff Snyder is at risk for low performance.
(3) o o o o o o o
Jeff Synder is ready to lead
others. (4) o o o o o o o
68
Based on Jeff Synder's resume and my understanding of his resume, I believe that he has:
Highly Disagree Highly Agree
1 2 3 4 5 6 7
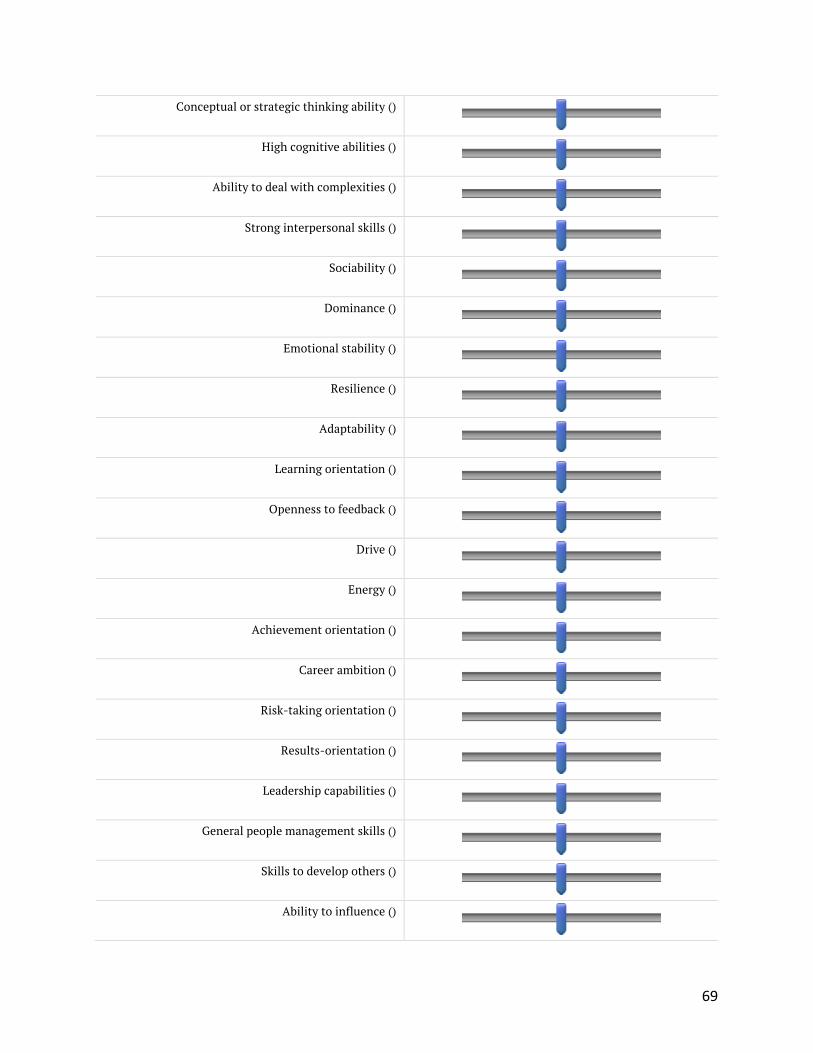
69
Conceptual or strategic thinking ability ()
High cognitive abilities ()
Ability to deal with complexities ()
Strong interpersonal skills ()
Sociability ()
Dominance ()
Emotional stability ()
Resilience ()
Adaptability ()
Learning orientation ()
Openness to feedback ()
Drive ()
Energy ()
Achievement orientation ()
Career ambition ()
Risk-taking orientation ()
Results-orientation ()
Leadership capabilities ()
General people management skills ()
Skills to develop others ()
Ability to influence ()
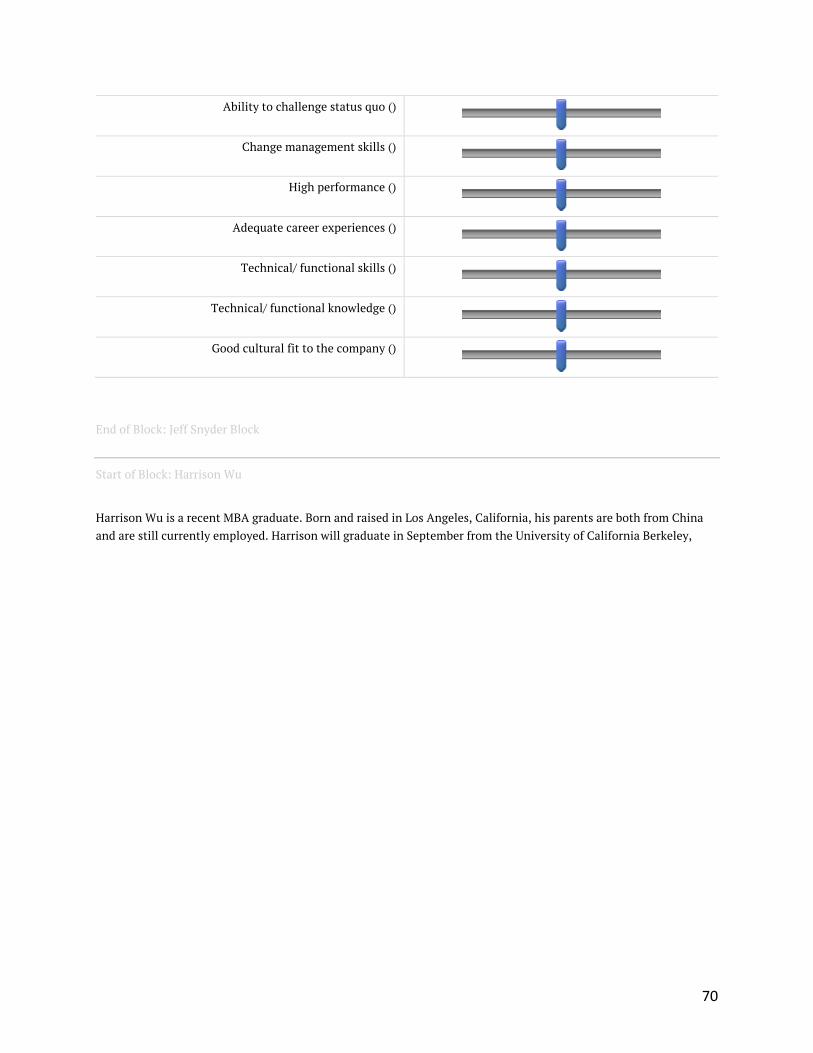
70
Ability to challenge status quo ()
Change management skills ()
High performance ()
Adequate career experiences ()
Technical/ functional skills ()
Technical/ functional knowledge ()
Good cultural fit to the company ()
End of Block: Jeff Snyder Block
Start of Block: Harrison Wu
Harrison Wu is a recent MBA graduate. Born and raised in Los Angeles, California, his parents are both from China and are still currently employed. Harrison will graduate in September from the University of California Berkeley,

71
Haas School of Business, and he is now looking for a job. Please review Harrison's resume below and answer the following questions.
72
Based on Harrison Wu's resume and your understanding of his resume, choose a numeric response for each statement below.
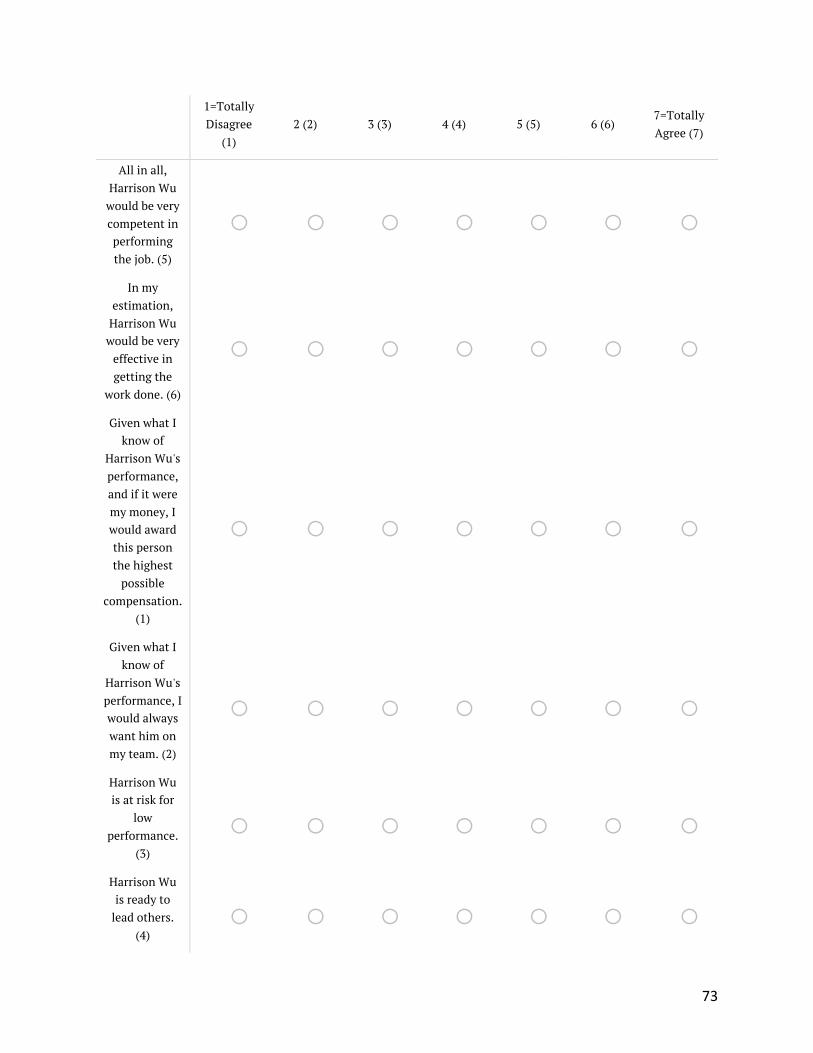
73
1=Totally Disagree
(1) 2 (2) 3 (3) 4 (4) 5 (5) 6 (6)
7=Totally Agree (7)
All in all, Harrison Wu
would be very competent in performing the job. (5)
o o o o o o o
In my estimation,
Harrison Wu would be very
effective in getting the
work done. (6)
o o o o o o o
Given what I know of
Harrison Wu's performance, and if it were my money, I would award this person the highest
possible compensation.
(1)
o o o o o o o
Given what I know of
Harrison Wu's performance, I would always want him on my team. (2)
o o o o o o o
Harrison Wu is at risk for
low performance.
(3)
o o o o o o o Harrison Wu
is ready to lead others.
(4) o o o o o o o
74
Harr_HiPo Based on Harrison Wu's resume and my understanding of his resume, I believe that he has:
Highly Disagree Highly Agree
1 2 3 4 5 6 7
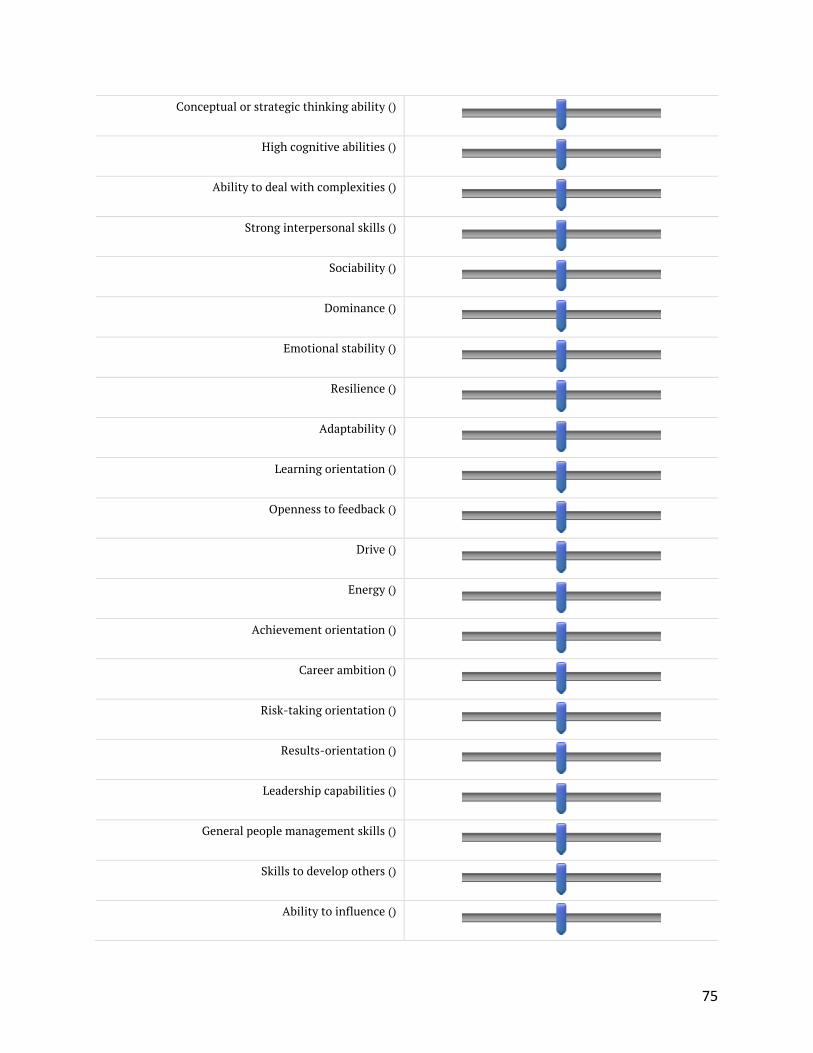
75
Conceptual or strategic thinking ability ()
High cognitive abilities ()
Ability to deal with complexities ()
Strong interpersonal skills ()
Sociability ()
Dominance ()
Emotional stability ()
Resilience ()
Adaptability ()
Learning orientation ()
Openness to feedback ()
Drive ()
Energy ()
Achievement orientation ()
Career ambition ()
Risk-taking orientation ()
Results-orientation ()
Leadership capabilities ()
General people management skills ()
Skills to develop others ()
Ability to influence ()
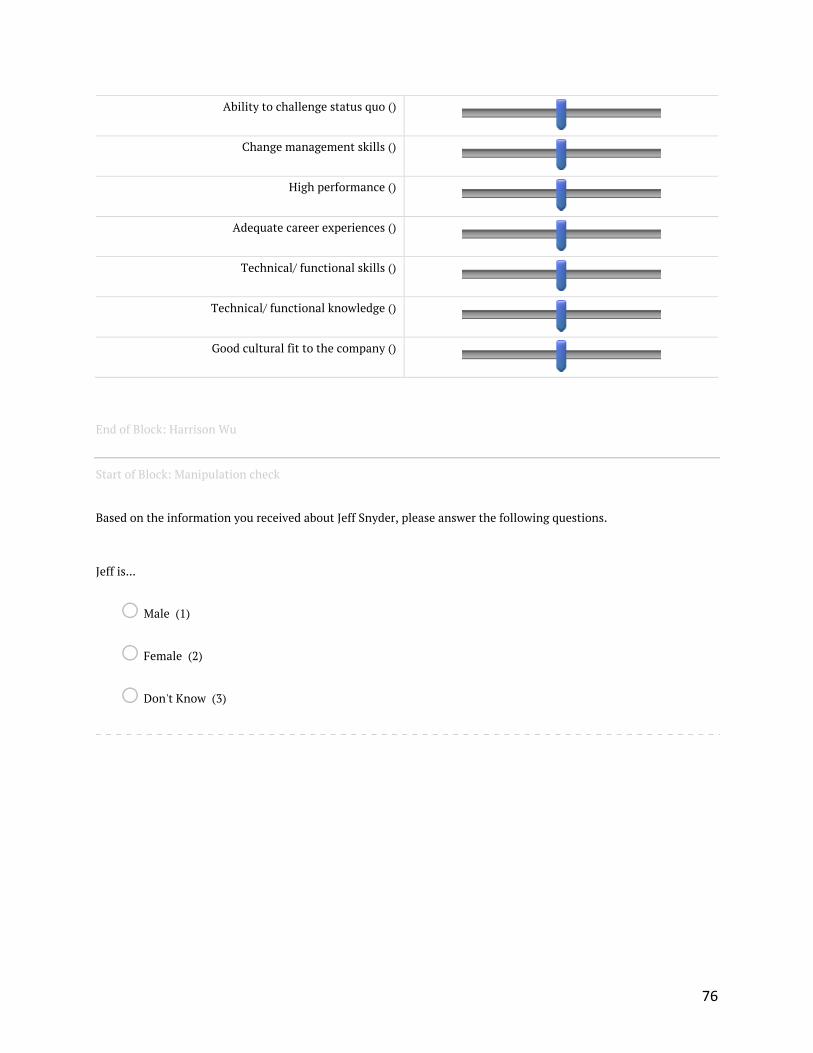
76
Ability to challenge status quo ()
Change management skills ()
High performance ()
Adequate career experiences ()
Technical/ functional skills ()
Technical/ functional knowledge ()
Good cultural fit to the company ()
End of Block: Harrison Wu
Start of Block: Manipulation check
Based on the information you received about Jeff Snyder, please answer the following questions. Jeff is...
o Male (1)
o Female (2)
o Don't Know (3)
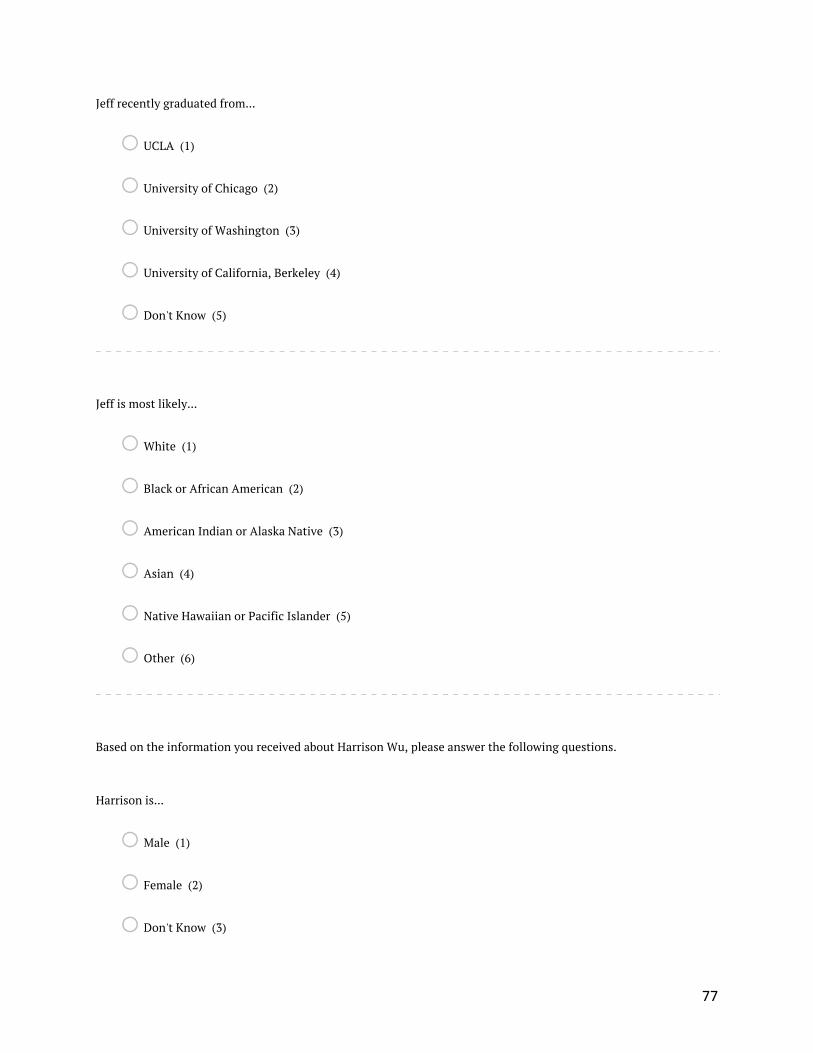
77
Jeff recently graduated from...
o UCLA (1)
o University of Chicago (2)
o University of Washington (3)
o University of California, Berkeley (4)
o Don't Know (5)
Jeff is most likely...
o White (1)
o Black or African American (2)
o American Indian or Alaska Native (3)
o Asian (4)
o Native Hawaiian or Pacific Islander (5)
o Other (6)
Based on the information you received about Harrison Wu, please answer the following questions. Harrison is...
o Male (1)
o Female (2)
o Don't Know (3)
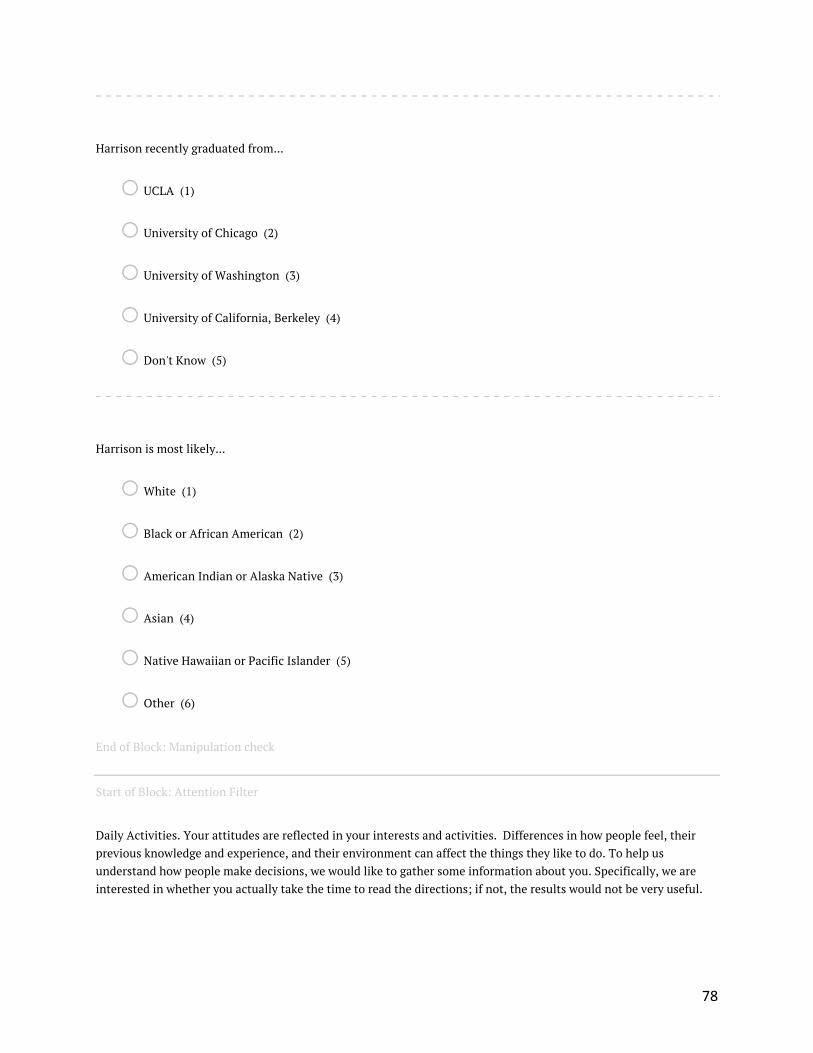
78
Harrison recently graduated from...
o UCLA (1)
o University of Chicago (2)
o University of Washington (3)
o University of California, Berkeley (4)
o Don't Know (5)
Harrison is most likely...
o White (1)
o Black or African American (2)
o American Indian or Alaska Native (3)
o Asian (4)
o Native Hawaiian or Pacific Islander (5)
o Other (6)
End of Block: Manipulation check
Start of Block: Attention Filter
Daily Activities. Your attitudes are reflected in your interests and activities. Differences in how people feel, their previous knowledge and experience, and their environment can affect the things they like to do. To help us understand how people make decisions, we would like to gather some information about you. Specifically, we are interested in whether you actually take the time to read the directions; if not, the results would not be very useful.
79
To show that you have read the instructions, please ignore the items below about activities and instead type "I read carefully" in the "other" space. Thank you.
� Watching sports (20)
� Participating in sports (21)
� Reading (22)
� Watching movies (23)
� Cooking (24)
� Electronic games (25)
� Board or card games (26)
� Attending cultural events (27)
� Religious activities (28)
� Travel (29)
� Needlework (30)
� Gardening (31)
� Hiking (32)
� Other: _____________ (33) ________________________________________________
End of Block: Attention Filter
Start of Block: Asian Stereotpye
Below is a series of statements. Please indicate the extent to which you agree with the following statements using the scale provided.
80
Asian Americans are defined as citizens of the United States who are of Asian (in particular East Asian) descent. As viewed by society, I believe members of this group are:
Highly Disagree Highly Agree
1 2 3 4 5 6 7

81
Competent ()
Confident ()
Independent ()
Competitive ()
Intelligent ()
Tolerant ()
Warm ()
Good-natured ()
Sincere ()
Have prestigious jobs ()
Economically successful ()
Well-educated ()
Obedient ()
Industrious ()
Self-disciplined ()
Self-reliant ()
Self-sacrificing ()
High-achieving ()
End of Block: Asian Stereotpye
Start of Block: White Stereotypes
82
Caucasian Americans are defined as citizens of the United States who are of European (Particularly Western European) descent. As viewed by society, how would you rate members of this group?
Highly Disagree Highly Agree
1 2 3 4 5 6 7
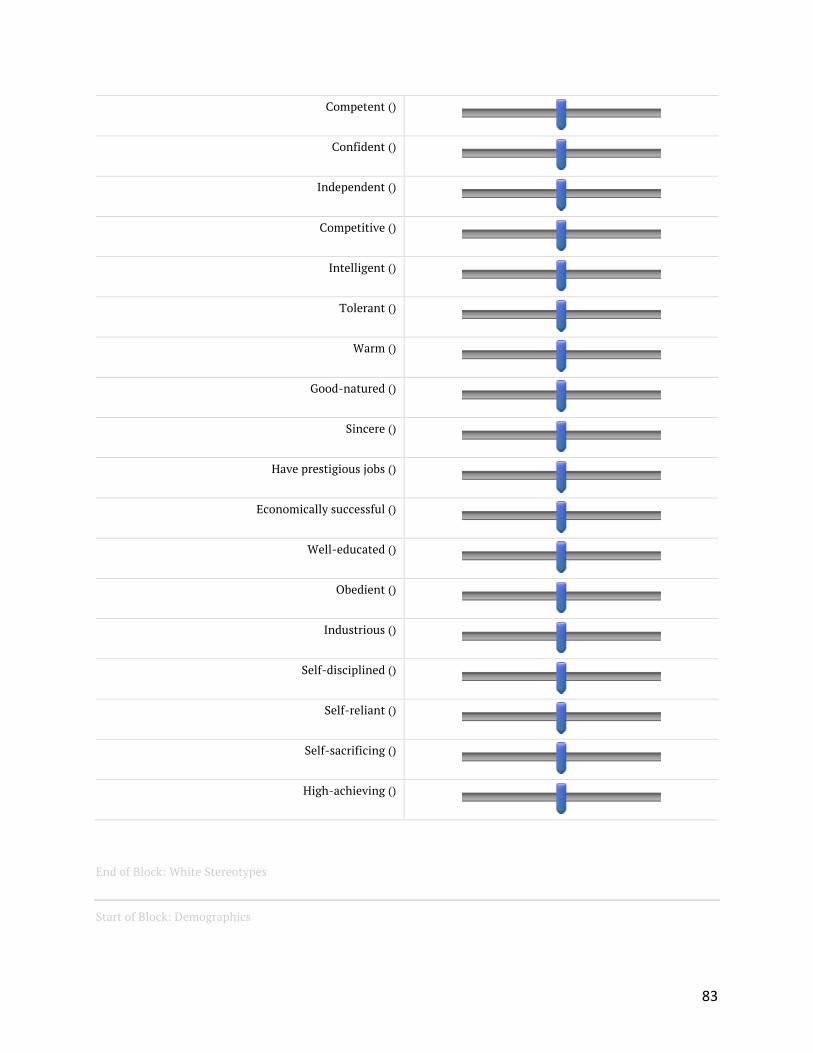
83
Competent ()
Confident ()
Independent ()
Competitive ()
Intelligent ()
Tolerant ()
Warm ()
Good-natured ()
Sincere ()
Have prestigious jobs ()
Economically successful ()
Well-educated ()
Obedient ()
Industrious ()
Self-disciplined ()
Self-reliant ()
Self-sacrificing ()
High-achieving ()
End of Block: White Stereotypes
Start of Block: Demographics
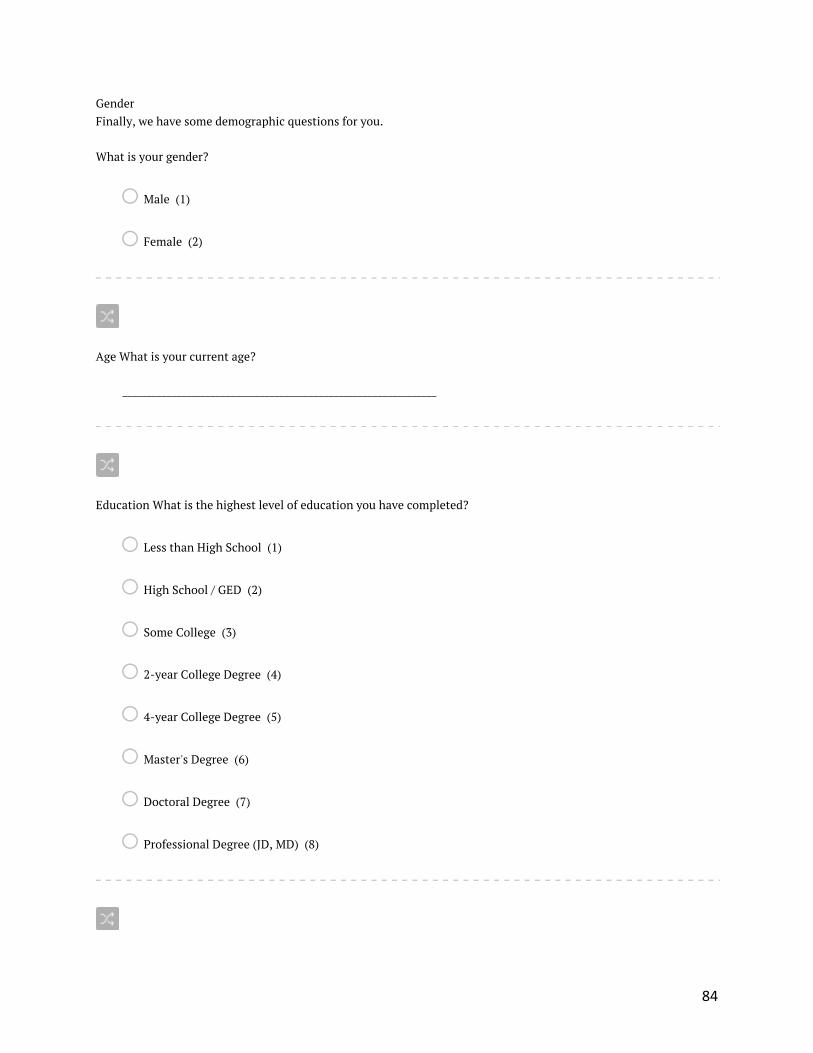
84
Gender Finally, we have some demographic questions for you. What is your gender?
o Male (1)
o Female (2)
Age What is your current age?
________________________________________________________________
Education What is the highest level of education you have completed?
o Less than High School (1)
o High School / GED (2)
o Some College (3)
o 2-year College Degree (4)
o 4-year College Degree (5)
o Master's Degree (6)
o Doctoral Degree (7)
o Professional Degree (JD, MD) (8)
85
What is your race?
o White/Caucasian (1)
o African American (2)
o Hispanic (3)
o Asian (4)
o Native American (5)
o Pacific Islander (6)
o Other (7)
End of Block: Demographics