the need to reduce impervious cover to prevent flooding ... · the need to reduce impervious cover...
TRANSCRIPT

The Need to Reduce Impervious Cover to Prevent Flooding and Protect Water Quality
May, 2010

The Need to Reduce Impervious Cover to Prevent Flooding and Protect Water Quality�
Researched and Written byPeter Flinker, AICPDodson Associates, Ltd. Landscape Architects & Planners 463 Main Street, Ashfield, MA 01330 www.dodsonassociates.com (413) 628-4496
Edited by Scott Millar, ChiefSustainable Watersheds OfficeRhode Island Department of Environmental Management 235 Promenade Street, Suite 330 Providence, RI 02908 (401)222-3434
Revised May, 2010, based on materials developed as part of the Scituate Reservoir Watershed Greenspace Protection Strategy, Rhode Island Department of Envi-ronmental Management, 2008
Original Project Funding:Providence Water Supply Board and the National Park Service
The Need to Reduce Impervious Cover to Prevent Flooding and Protect Water Quality
Contents:
Page 3. Introduction
Page 4. The Connection Between Impervious Cover, Flooding, and Water Quality
Page 7. The Impervious Cover Model
Page 9. Predicting the Future Amount of Impervious Cover
Page 10. Impervious Cover in Rhode Island
Page 11. Applying Impervious Cover to Land Use and Water Quality Regulations
Page 11. Reducing Imperviousness Through Land Use Planning
Page 14. Establishing Impervious Cover Limits Through Zoning Ordinances
Page 15. Incorporating Impervious Cover Management into a Comprehensive Program to Protect Watershed Health
Page 16. Conclusions
Page 18. References

The Need to Reduce Impervious Cover to Prevent Flooding and Protect Water Quality 3
The impact of impervious cover is obvious near a typi-cal commercial area: both the quantity and quality of runoff are impacted, and infiltration is greatly reduced.
Introduction
Impervious cover, also referred to as impervi-ous surface, refers to anything that water cannot penetrate. Ranging from residential rooftops, patios and driveways to town roads, public build-ings, commercial structures and parking lots, impervious cover prevents rain and snow from soaking into the ground, turning it into storm-water runoff. Stormwater runoff carries organic matter, fertilizers, pesticides, oil and grease and other contaminants into our ponds and streams. In addition to changing the quality of the water running into our waterbodies , impervious cover changes the quantity of runoff, eroding and changing the physical structure of existing streams. Because water runs more quickly off of an impervious area, flooding becomes both more common and more intense downstream. Meanwhile, because less water is soaking into the ground, water tables can drop and streams and wells fed by groundwater begin to dry up.
All of these effects can be observed in develop-ing areas of Rhode Island towns, even if there is enough open land remaining to absorb the extra runoff and dilute the pollutant load so that impacts are minimized. But at some point, the balanced is tipped and permanent damage to water quality and habitat can occur. The direct cause of the damage depends on the nature of the runoff and the particular topography, soils and vegetation on a site. When the native trout vanish from a stream, for example, it is often very difficult to pin down the cause. Is fertilizer in the runoff creating algal blooms that deplete
the oxygen in the water? Are flash floods spoil-ing gravel spawning beds? Are water tempera-tures rising? Or is it some combination of fac-tors? As scientists worked to understand these processes, it became clear that in most cases there is a direct correlation between the degree of water impairment and the overall amount of impervious cover in the watershed. While it is difficult to predict which factor will come into play in any particular situation, as impervious cover rises above 10% there is almost always a measurable loss in water quality. Between 10% and 25% these impacts increase, and pollution
and flooding are both evident. Above 25% impervious cover, water quality impacts can be so severe that it may not be possible to restore water quality to pre-existing conditions.
For towns interested in protecting water quality, natural ecosystems, and the prevention of flood-ing, it is very hard to measure, let alone manage, the dozens of separate factors that can impact small watersheds. However, because of the well documented correlation between impervious cover and stream health, there is an opportunity to use impervious cover as a surrogate for both measuring and managing water quality and watershed health. By keeping overall impervi-ous cover below 10%, towns can ensure that the land will be able to absorb and filter runoff from developed areas and prevent excessive flooding, ecosystem impairment and contamination of water supplies.
Approximately 75% of the stream miles that feed our waterbodies with clean water are small headwater streams that are often small enough to be straddled by a child. These streams are extremely sensitive to land use changes and are therefore very susceptible to contamination. If the level of impervious cover rises too high in these areas, irreversible damage can occur to drinking water quality, to groundwater supply-ing private wells, and to aquatic wildlife habitat. As towns grow, there will be increasing pressure to replace natural areas with more impervious cover. Even when best management practices are widely used when attempting to mitigate the impacts of impervious cover, a threshold of
The Need to Reduce Impervious Cover to Prevent Flooding and Protect Water Quality4
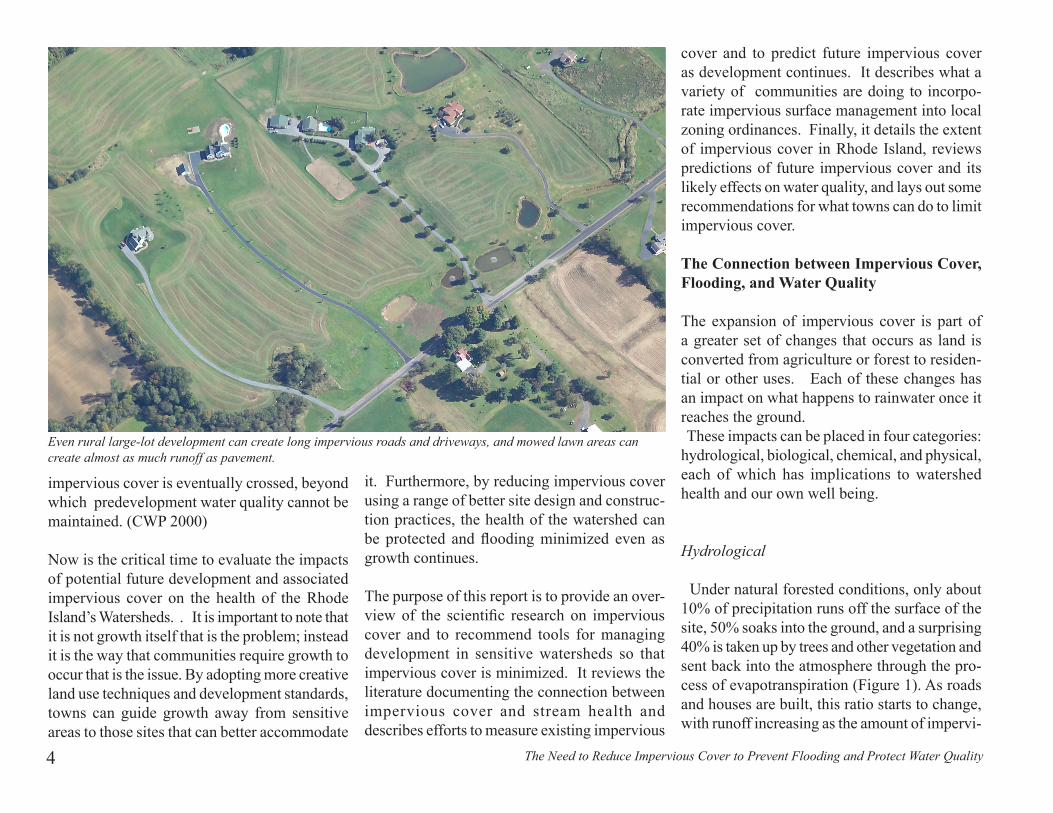
Even rural large-lot development can create long impervious roads and driveways, and mowed lawn areas can create almost as much runoff as pavement.
impervious cover is eventually crossed, beyond which predevelopment water quality cannot be maintained. (CWP 2000)
Now is the critical time to evaluate the impacts of potential future development and associated impervious cover on the health of the Rhode Island’s Watersheds. . It is important to note that it is not growth itself that is the problem; instead it is the way that communities require growth to occur that is the issue. By adopting more creative land use techniques and development standards, towns can guide growth away from sensitive areas to those sites that can better accommodate
it. Furthermore, by reducing impervious cover using a range of better site design and construc-tion practices, the health of the watershed can be protected and flooding minimized even as growth continues.
The purpose of this report is to provide an over-view of the scientific research on impervious cover and to recommend tools for managing development in sensitive watersheds so that impervious cover is minimized. It reviews the literature documenting the connection between impervious cover and stream health and describes efforts to measure existing impervious
cover and to predict future impervious cover as development continues. It describes what a variety of communities are doing to incorpo-rate impervious surface management into local zoning ordinances. Finally, it details the extent of impervious cover in Rhode Island, reviews predictions of future impervious cover and its likely effects on water quality, and lays out some recommendations for what towns can do to limit impervious cover.
The Connection between Impervious Cover, Flooding, and Water Quality
The expansion of impervious cover is part of a greater set of changes that occurs as land is converted from agriculture or forest to residen-tial or other uses. Each of these changes has an impact on what happens to rainwater once it reaches the ground. These impacts can be placed in four categories: hydrological, biological, chemical, and physical, each of which has implications to watershed health and our own well being.
Hydrological
Under natural forested conditions, only about 10% of precipitation runs off the surface of the site, 50% soaks into the ground, and a surprising 40% is taken up by trees and other vegetation and sent back into the atmosphere through the pro-cess of evapotranspiration (Figure 1). As roads and houses are built, this ratio starts to change, with runoff increasing as the amount of impervi-

The Need to Reduce Impervious Cover to Prevent Flooding and Protect Water Quality �
Figure 1: Changes in site hydrology with increasing impervious cover (US EPA)
ous cover increases. For example, the total runoff volume for a one-acre parking lot is about 16 times that produced by an undeveloped one-acre meadow (CWP 2000). Therefore it’s understand-able why suburban and urban communities have more severe flooding than undeveloped areas. Because the water is spending less time on site, infiltration declines dramatically. This is a particular concern in many urban and suburban regions, where groundwater has been reduced because there is not enough rainfall soaking into the ground. The increase in runoff that occurs during this process, combined with the loss of recharge to groundwater, has dramatic impacts on streams.
Biological
The decline of biological indicators is the first sign of stream degradation, and has been the most commonly studied result of increased impervious cover. As a result of a high percent-age of impervious cover, naturally occurring aquatic insects, wetland plants, and amphibians decline and are gradually replaced by spe-cies that are adapted to pollution and flooding (Schueler 2000). The most common standard measure of biological degradation is the Index of Biotic Integrity (IBI) (Karr, 1987, quoted in Brabec, 2002). The IBI measures species richness and composition, local indicator spe-cies, trophic composition, fish abundance and fish diversity. Brabec’s team looked at several dozen studies and found that there was a broad range of impervious cover thresholds associated
with stream degradation, ranging from 4% to 50%, but that biotic integrity seems to be the most sensitive: “aquatic communities change at a level of impervious surface much lower than that which affects water quality measures” (Brabec, et al, 2002). Looking at a range of studies, they found that impacts on overall biotic measurements were seen within a range of 3.6% to 15% impervious cover; the threshold for fish population health ranged from 3.6% to 12%, and macroinvertebrate health declined between a range of 8% to 15%.
Chemical
Impervious surfaces such as roads, driveways and parking lots collect a variety of chemical pollutants and hydrocarbons and discharge them to aquatic systems with every heavy rain. Fertilizer, herbicides and pesticides run off of lawns, and household cleaning products and even pharmaceuticals find their way into ground-water from septic systems. The most common disturbance in the chemical make-up of streams is the elevated levels of nitrogen and phosphorus. Other common contaminants include calcium,
The Need to Reduce Impervious Cover to Prevent Flooding and Protect Water Quality6
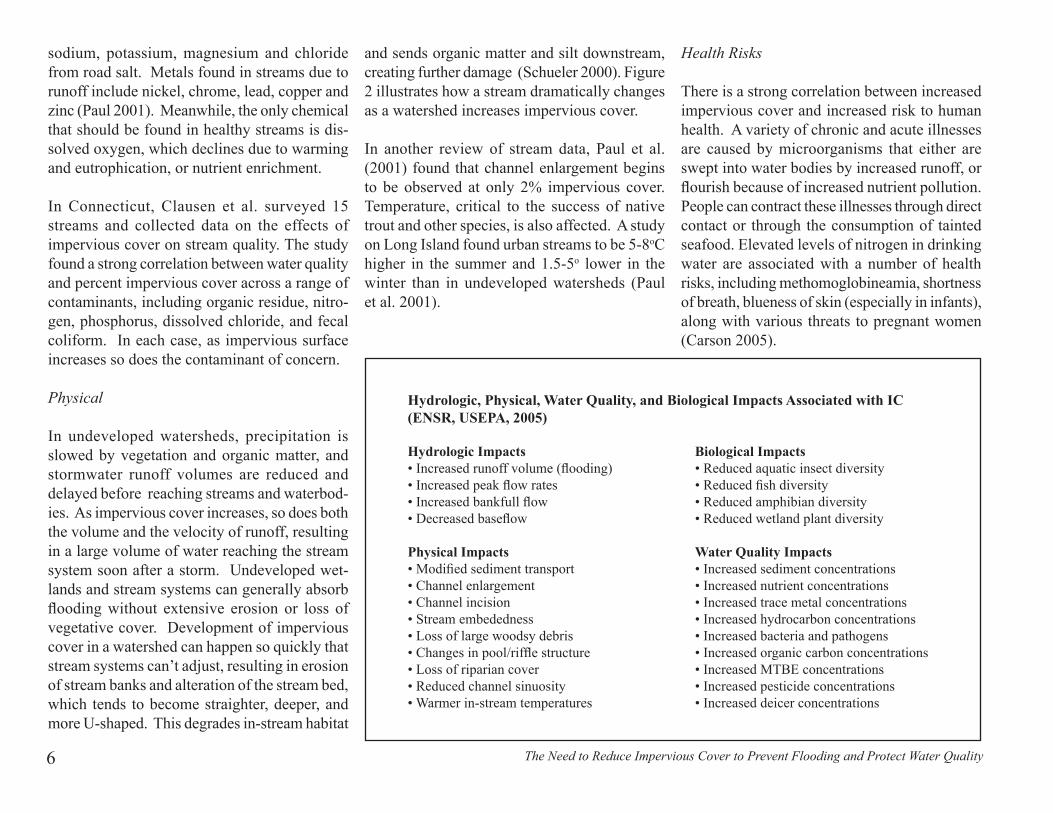
Hydrologic, Physical, Water Quality, and Biological Impacts Associated with IC(ENSR, USEPA, 2005)
Hydrologic Impacts Biological Impacts• Increased runoff volume (flooding) • Reduced aquatic insect diversity• Increased peak flow rates • Reduced fish diversity• Increased bankfull flow • Reduced amphibian diversity• Decreased baseflow • Reduced wetland plant diversity
Physical Impacts Water Quality Impacts• Modified sediment transport • Increased sediment concentrations• Channel enlargement • Increased nutrient concentrations• Channel incision • Increased trace metal concentrations• Stream embededness • Increased hydrocarbon concentrations• Loss of large woodsy debris • Increased bacteria and pathogens• Changes in pool/riffle structure • Increased organic carbon concentrations• Loss of riparian cover • Increased MTBE concentrations• Reduced channel sinuosity • Increased pesticide concentrations• Warmer in-stream temperatures • Increased deicer concentrations
sodium, potassium, magnesium and chloride from road salt. Metals found in streams due to runoff include nickel, chrome, lead, copper and zinc (Paul 2001). Meanwhile, the only chemical that should be found in healthy streams is dis-solved oxygen, which declines due to warming and eutrophication, or nutrient enrichment.
In Connecticut, Clausen et al. surveyed 15 streams and collected data on the effects of impervious cover on stream quality. The study found a strong correlation between water quality and percent impervious cover across a range of contaminants, including organic residue, nitro-gen, phosphorus, dissolved chloride, and fecal coliform. In each case, as impervious surface increases so does the contaminant of concern.
Physical
In undeveloped watersheds, precipitation is slowed by vegetation and organic matter, and stormwater runoff volumes are reduced and delayed before reaching streams and waterbod-ies. As impervious cover increases, so does both the volume and the velocity of runoff, resulting in a large volume of water reaching the stream system soon after a storm. Undeveloped wet-lands and stream systems can generally absorb flooding without extensive erosion or loss of vegetative cover. Development of impervious cover in a watershed can happen so quickly that stream systems can’t adjust, resulting in erosion of stream banks and alteration of the stream bed, which tends to become straighter, deeper, and more U-shaped. This degrades in-stream habitat
and sends organic matter and silt downstream, creating further damage (Schueler 2000). Figure � illustrates how a stream dramatically changes as a watershed increases impervious cover.
In another review of stream data, Paul et al. (2001) found that channel enlargement begins to be observed at only 2% impervious cover. Temperature, critical to the success of native trout and other species, is also affected. A study on Long Island found urban streams to be 5-8oC higher in the summer and 1.5-5o lower in the winter than in undeveloped watersheds (Paul et al. 2001).
Health Risks
There is a strong correlation between increased impervious cover and increased risk to human health. A variety of chronic and acute illnesses are caused by microorganisms that either are swept into water bodies by increased runoff, or flourish because of increased nutrient pollution. People can contract these illnesses through direct contact or through the consumption of tainted seafood. Elevated levels of nitrogen in drinking water are associated with a number of health risks, including methomoglobineamia, shortness of breath, blueness of skin (especially in infants), along with various threats to pregnant women (Carson 2005).

The Need to Reduce Impervious Cover to Prevent Flooding and Protect Water Quality 7Figure 2: Relationship between percent imperviousness and stream morphology (All images Copyright 1999, Center for Watershed Protection).
At 10% impervious cover, this stream has doubled its original size and the pool and riffle structure is lost.
In watersheds with less than 5% impervious cover, streams are typically stable and pristine, maintaining a good pool and riffle structure.
This stream has a 30% impervious cover. The size of the stream channel has increased by five to ten times.
This stream is approximately 20% impervious cover and shows erosion due to an absence of vegetation to stabilize the bank.

The Need to Reduce Impervious Cover to Prevent Flooding and Protect Water Quality8
Figure 3: Relationship between percent imperviousness and environmental quality (Arnold & Gibbons, 1996, Schueler, 1992).
Percent Watershed Impervious Coverage
50
40
30
20
10
0
Protected Impacted Degraded
The most common health risk is fecal coliform bacteria, which are a normal occurrence within the intestinal tracts of animals. While acceptable at very low levels in recreational waters, coli-form bacteria is very dangerous when introduced into drinking water. Coliform bacteria find their way into our water by way of substandard septic systems, agricultural runoff, and animal waste. The rapid runoff from impervious sur-faces increases the likelihood that every heavy rain will wash bacteria-laden waste directly into streams. Similarly, waterborne parasites such as Giardia and cryptosporidium become much more mobile as flooding increases in developing watersheds.
The Impervious Cover Model
Based on a review of hundreds of studies, Tom Schueler and others at the Center for Watershed Protection (CWP) in Maryland developed what they called the “Impervious Cover Model” (Model). The Model is based on the average percentages of impervious cover at which stream quality declines, and classifies the impacts to streams into three categories. Sensitive streams are those within watersheds which are still below 10% impervious cover, where impacts are gener-ally minor. These streams are relatively pristine and can be preserved through a variety of con-servation measures. Impacted streams are found within watersheds with between 10% and 25% impervious cover, and can still be restored. Non-supporting streams are found within watersheds with over 25% impervious cover, and are not
considered suitable for restoration. Obviously these ranges are part of a single continuum, and there is much variation between regions and even individual streams. But the Model allows streams and watersheds to be generally catego-rized, making management decisions clearer. In their “Rapid Watershed Planning Handbook” and other publications, CWP provides a detailed methodology for using the Model to more effectively plan for the restoration of damaged streams and in protecting those that are still below the key thresholds.
Measuring Impervious Cover
Using the Impervious Cover Model (Model), towns can evaluate the present health of their rivers and streams, as well as predict future impacts as growth and development continue. In both cases, sound decision-making requires accurate measurements of impervious cover. An enormous amount of research effort over the last ten years has contributed to the develop-ment of efficient ways to measure impervious cover. The most accurate is a ground survey of existing roads, buildings, driveways, sidewalks,
The Need to Reduce Impervious Cover to Prevent Flooding and Protect Water Quality 9
Assumptions of the Impervious Cover Model
The Impervious Cover Model has proven to be reliable when applied correctly – but it includes a number of assumptions (Center for Watershed Protection, 2002):
• It should be applied only to smaller 1st, �nd and 3rd (low) order streams, since these are the types of streams involved in most of the research that supports the model Most of the streams in the Scituate Reservoir Water-shed are low order streams.
• It requires accurate estimates of percent impervious area.
• It predicts potential rather than actual steam quality, so field monitoring is recom-mended to confirm any predictions made.
• It does not predict the precise level of any individual stream indicator, but rather the average of a group of indicators.
• 10% and 25% thresholds are not sharp breakpoints, but reflect a range where tran-sitions in stream quality become apparent.
• It should only be applied within the areas where it has been tested, which includes the Northeast.
• It has not been validated for non-stream conditions like reservoirs and groundwater aquifers.
• The relationship between impervious cover and stream quality is weakest in watersheds with less than 10% impervious cover. Under 10%, other factors such as the amount of forest cover, continuity of vegetated stream buffers, soils and land use activity can play a significant role.
etc. However, this may be very expensive at the watershed scale. Alternately, impervious surfaces can easily be traced using aerial photog-raphy, but this can be incredibly time-consuming when applied to a large area. Since most states have compiled detailed land-use maps that delineate various land use types in a fair amount of detail, planners can calculate the acreage of land in various categories, such as commercial, industrial, and low-, medium-, and high-density residential, and multiply it by typical averages for impervious cover. The averages, in turn, are developed based on detailed surveys of real-world examples of each cover type.
The most common reference for relating the percentage of impervious cover to land use type is Technical Release 55: Urban Hydrology for Small Watersheds (TR-55; USDA 1986), which was developed to help engineers calculate the amount of stormwater runoff from develop-ment sites. As part of TR-55, the percentage
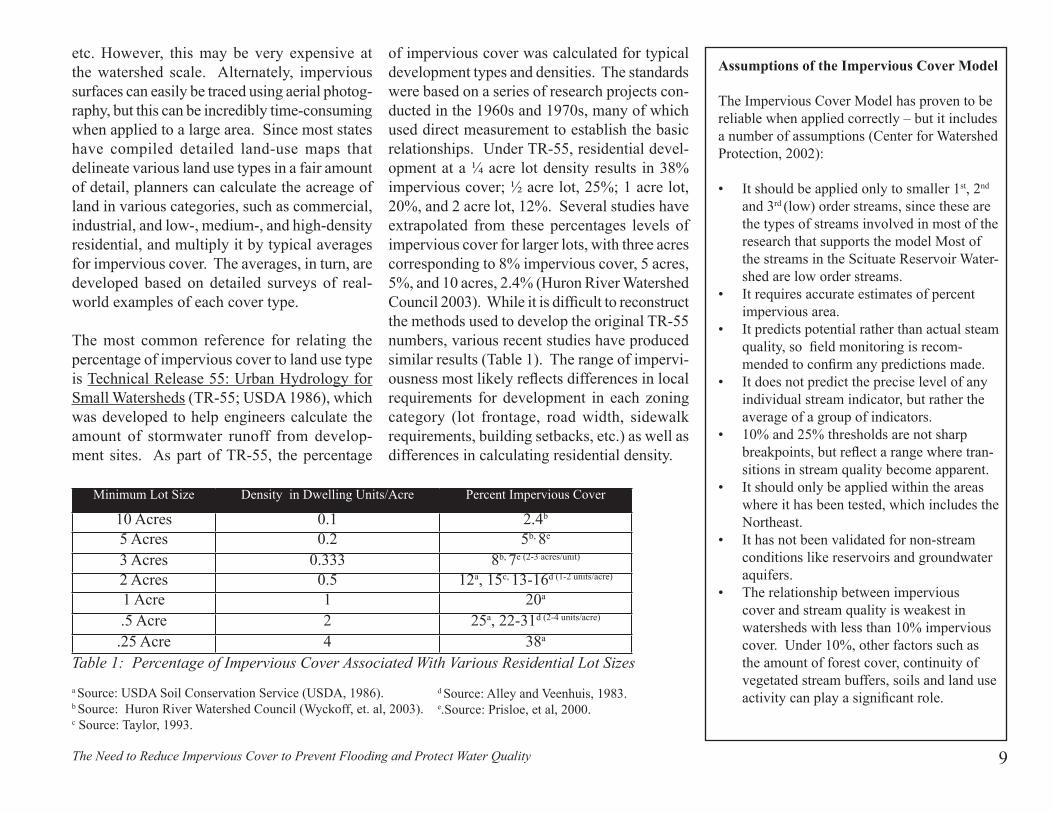
of impervious cover was calculated for typical development types and densities. The standards were based on a series of research projects con-ducted in the 1960s and 1970s, many of which used direct measurement to establish the basic relationships. Under TR-55, residential devel-opment at a ¼ acre lot density results in 38% impervious cover; ½ acre lot, 25%; 1 acre lot, 20%, and 2 acre lot, 12%. Several studies have extrapolated from these percentages levels of impervious cover for larger lots, with three acres corresponding to 8% impervious cover, 5 acres, 5%, and 10 acres, 2.4% (Huron River Watershed Council 2003). While it is difficult to reconstruct the methods used to develop the original TR-55 numbers, various recent studies have produced similar results (Table 1). The range of impervi-ousness most likely reflects differences in local requirements for development in each zoning category (lot frontage, road width, sidewalk requirements, building setbacks, etc.) as well as differences in calculating residential density.
a Source: USDA Soil Conservation Service (USDA, 1986).b Source: Huron River Watershed Council (Wyckoff, et. al, 2003).c Source: Taylor, 1993.
Minimum Lot Size Density in Dwelling Units/Acre Percent Impervious Cover
10 Acres 0.1 �.4b
� Acres 0.2 �b, 8e
3 Acres 0.333 8b, 7e (2-3 acres/unit)
� Acres 0.5 12a, 15c, 13-16d (1-2 units/acre)
1 Acre 1 20a
.� Acre � ��a, 22-31d (2-4 units/acre)
.�� Acre 4 38a
Table 1: Percentage of Impervious Cover Associated With Various Residential Lot Sizes
d Source: Alley and Veenhuis, 1983.e.Source: Prisloe, et al, 2000.

The Need to Reduce Impervious Cover to Prevent Flooding and Protect Water Quality10
LIDAR survey showing impervious roads, houses and other structures in a corner of Scituate.
Fortunately, help is available for Rhode Island towns needing more accurate measurements of impervious cover. Rhode Island contracted with the Sanborn Map Company to develop a state-wide impervious cover dataset that is available through RIGIS. Sanborn used color photogra-phy acquired as part of a statewide orthophoto mapping initiative. A semi-automated process was used where the computer is programmed to recognize impervious surfaces.. The great advantage of this process is its speed, cost, and high resolution (two feet), which allows roads, buildings and parking lots to be shown in great detail.
The Providence Water Supply Board is using an even more accurate survey process with a resolu-tion as high as six inches. Called LIDAR, for “light detection and ranging”, it uses the same principal as radar. Housed in an airplane, the LIDAR instrument sends pulses of laser light, at up to 100,000 pulses per second, down to the ground surface. The light, which can penetrate clouds and foliage, reflects back to a collector which registers the differences in each pulse. The result is an accurate survey of surface fea-tures, from which it is fairly easy to separate out impervious cover.
Predicting the future amount of impervious cover
The measurement of existing impervious cover is relatively straightforward if you have the right information and enough time to use it. Knowing the amount of impervious cover allows you to
predict, based on hundreds of scientific studies, whether a particular stream or subwatershed is likely to decline in health in the near future. However, in order to manage that watershed, you also need to know what is likely to happen as development continues in the watershed. Many towns have prepared “build-out” analyses, for example, which predict the number of future homes and businesses that are theoretically possible if all of the buildable land is developed to the maximum allowed by the town’s zoning
ordinance and development regulations. Build-out analyses help towns plan for additional schools and town services and used to model the amount of impervious cover that is likely to be created.
However, most build-out analyses do not have the level of detail where new roads, houses and driveways are shown. Therefore, researchers have attempted to define how much impervi-ous cover is likely to result from development under the common range of lot sizes and zoning densities, using averages from TR-55 and other sources as multipliers. Logically, the results are most accurate where future development is similar to the studies from which the original numbers were developed. Towns can look at development within their own borders and calcu-late their own percentages. For example, TR-55 predicts that a development with two acre lots will result in 12% impervious cover. We can test this with a simple example: if zoning requires a two acre lot and 200 feet of frontage, and we assume that the dwelling is built 100 feet from the front lot line, we could predict the following amount of impervious cover:
House and garage: 3000 square feet. Patios, pool, outbuildings, etc: 2000 s.f. Driveway (100’ x 12’): 1200 s.f. Sidewalk (200’x 5’): 1000 s.f. Roadway (30’x 200/2): 3000 s.f. Total: 10,200 s.f. 10,200 s.f./ 2 acres (87,120 s.f.) = 11.7% impervious cover

The Need to Reduce Impervious Cover to Prevent Flooding and Protect Water Quality 11
Figure 4: Percent Impervious Cover in the State of Rhode Island with Urban Service Boundary
This demonstrates that there are multiple factors beyond simple lot size/density that affect the amount of impervious cover. Because the size of houses and any additions tend to be driven by the marketplace rather than regulations, towns will have little control over the amount of imper-vious cover they create. Moreover, lawn area is considered to be semi-impervious and does not function as well as undisturbed natural areas in infiltrating precipitation into the ground (Schuler 2000). What towns can control are elements codified in zoning and subdivision regulations, such as lot width, setbacks, roadway width and sidewalk standards. To define the percentage of impervious cover associated with each zoning district, towns can use a similar calculation to predict the impact of required road width and lot frontage on the amount of impervious cover associated with each building lot. For towns with GIS capability, this can be compared with the actual amount of impervious cover measured in areas that are already fully developed.
Impervious Cover in Rhode Island
Rhode Island is one of the most densely popu-lated states in the Country resulting in a state-wide average impervious cover of 12% (Figure 4). However, Figure 4 also shows large areas outside of the urban services boundary that are 4% impervious cover, which is below the 10% threshold. The urban services boundary (USB) was established by the Statewide Planning Pro-gram as part of the State Land Use Plan to recom-mend where future growth should be directed to
achieve more efficient (“smarter”) future growth. The area within the USB has an impervious cover of 25%. Therefore from a water quality and smart growth perspective it makes sense to encourage future growth within the USB.Research clearly indicates that the protec-tion of small headwater streams is essential to
achieve water quality objectives in the larger rivers and coastal waters they feed. These headwater streams are extremely vulnerable to direct and indirect impacts of land use. Most headwater streams are located in areas outside of the USB in subwatersheds that have a small amount of impervious cover and are considered to be healthy. However, headwater streams are less likely to be adequately protected from new growth by Federal, State and local regula-tions than larger stream and river systems (CWP, 2007). Moreover, Federal and State regulations provide no authority for state agencies to regulate impervious cover at a watershed scale, nor to effectively control many of the diffuse non-point pollution sources directly related to land use.
Extensive research has enabled scientists and engineers to empiri-cally relate how watersheds with high percentages of impervious
cover exhibit negative impacts to hydrology and water quality, reducing or destroying aquatic habitat quality and biodiversity (CWP 2000, Coles 2004, Morse 2003). It has been docu-mented that, for a given amount of new devel-opment, higher density can significantly reduce impervious cover on a watershed basis compared

The Need to Reduce Impervious Cover to Prevent Flooding and Protect Water Quality12
to the same amount of new homes and businesses laid out in a low-density development pattern (EPA 2006). Therefore the current Rhode Island trend of large-lot, low-density development with segregated uses is creating significantly more impervious cover than necessary to meet our growth needs. More creative land use tech-niques such as conservation development and compact mixed use (village-style growth) can significantly reduce impervious cover.
Applying Impervious Cover to Land Use and Water Quality Regulations
Given the clear usefulness of impervious cover as a predictor of water quality and ecosystem health, why is it not used more often in land use regulations? The answer is that in order to comply with constitutional protections of private property rights, zoning and other regulations must justify the use of the “police power” of the state, which is “the power of government to intervene in the lives of private citizens for the protection of public health, safety and welfare” (The Practice of Local Government Planning, 2000). The State Zoning Enabling Act specifies exactly how towns may exercise their police power. Section 45-24-30 of the Rhode Island Zoning Enabling Act allows communities to provide for orderly growth and development by recognizing in part “the natural characteris-tics of the land, including its suitability for use based on soils characteristics, topography, and susceptibility to surface or groundwater pol-lution”. It also allows communities to control surface and groundwater pollution, soil erosion
and sedimentation. Therefore, communities do have the authority, if they choose to exercise it, to establish reasonable standards via zoning regulations to protect water quality.
In order to use zoning and other regulations to directly control the amount of impervious cover, towns will have to demonstrate that defensible, objective standards have been established to guide the administration of such regulations. Therefore, any standard for impervious cover must be backed up with the objective data cited in this report. Zoning also needs to be supported by the town’s comprehensive plan, which com-bines data analysis and mapping with a process of public deliberation and collective decision-making.
Until very recently, the science behind impervi-ous cover analysis was extensive, but the con-nection between the amount of impervious cover
and specific zoning densities was difficult to pin down. The many variables of soil, topography and land use introduce many uncertainties in establishing regulations that are fair to all land-owners in a town. However, as we have seen, advances in data collection and mapping are making it easier to arrive at more defensible con-clusions about what level of impervious cover is acceptable while water quality as well as public health, safety and welfare is still protected.
Reducing Impervious Cover through Land Use Planning
Community zoning and subdivision regula-tions and the patterns of land use they forge are directly responsible for the amount of impervi-ous cover in a watershed. Generally speaking, as density increases, the amount of impervious cover also increases. However, the overall pat-tern of development is also important. Although a few rural communities have residential zoning densities that would, at build-out, keep impervi-ous cover below a 10% threshold, the large-lot zoning currently used to accommodate growth requires houses to be far apart, creating unnec-essary impervious cover and encouraging more off-site impervious infrastructure, such as roads and parking lots (US EPA 2006). Moreover, many of the surfaces remaining after large-lot development that are believed to be pervi-ous actually behave like impervious surfaces. Research indicates that the volume of runoff from highly compacted lawns is almost as high as from paved surfaces (Shueler 1995, 2000; USDA 2001). Lawns clearly do not function as
A recent study in Chesapeake Bay determined that new development was increasing nutrient and sediment loads at rates faster than restoration efforts were reducing them. Developed lands within the Chesapeake Bay Watershed contribute less than one third of the Bay loading of pol-lutants, but would require approximately two thirds of the overall restoration costs. This study concluded that the most cost-effective approach to reverse the trend of increasing pollutant loads from new development was by forming strong partnerships with communities to encourage them to adopt and implement more environ-mentally sensitive development techniques and reduce impervious cover. -EPA 2007
The Need to Reduce Impervious Cover to Prevent Flooding and Protect Water Quality 13
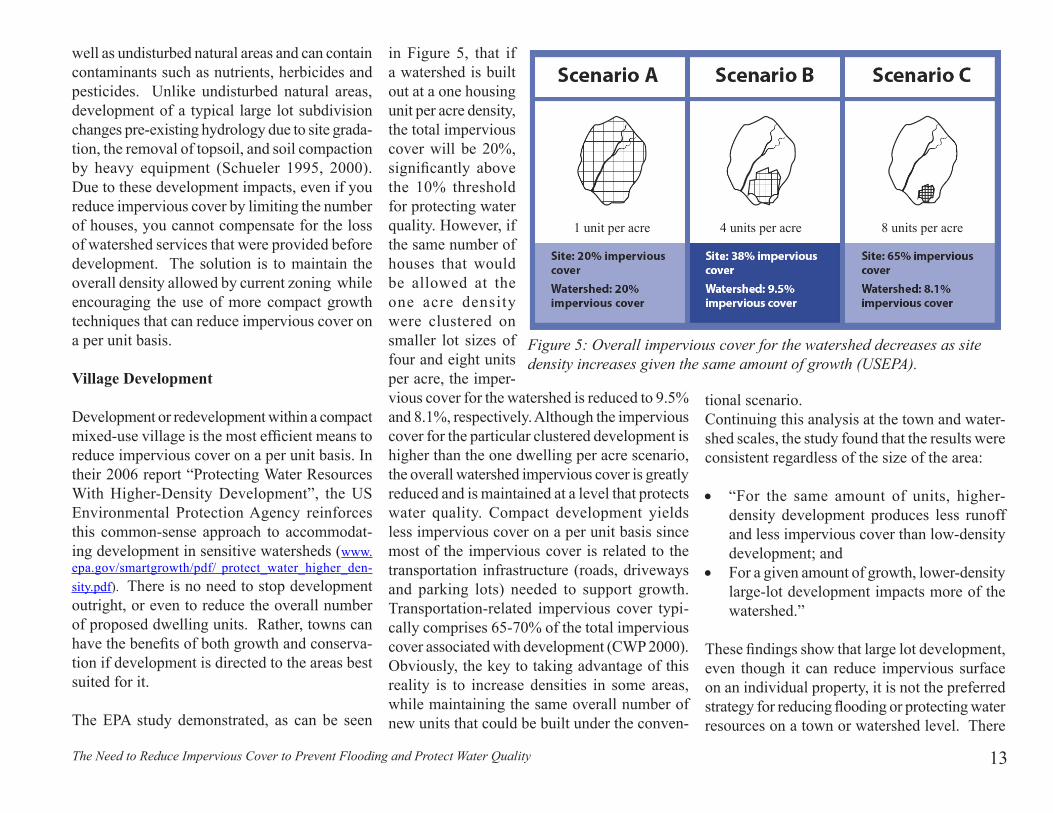
Figure 5: Overall impervious cover for the watershed decreases as site density increases given the same amount of growth (USEPA).
1 unit per acre 4 units per acre 8 units per acre
well as undisturbed natural areas and can contain contaminants such as nutrients, herbicides and pesticides. Unlike undisturbed natural areas, development of a typical large lot subdivision changes pre-existing hydrology due to site grada-tion, the removal of topsoil, and soil compaction by heavy equipment (Schueler 1995, 2000). Due to these development impacts, even if you reduce impervious cover by limiting the number of houses, you cannot compensate for the loss of watershed services that were provided before development. The solution is to maintain the overall density allowed by current zoning while encouraging the use of more compact growth techniques that can reduce impervious cover on a per unit basis.
Village Development
Development or redevelopment within a compact mixed-use village is the most efficient means to reduce impervious cover on a per unit basis. In their 2006 report “Protecting Water Resources With Higher-Density Development”, the US Environmental Protection Agency reinforces this common-sense approach to accommodat-ing development in sensitive watersheds (www.epa.gov/smartgrowth/pdf/ protect_water_higher_den-sity.pdf). There is no need to stop development outright, or even to reduce the overall number of proposed dwelling units. Rather, towns can have the benefits of both growth and conserva-tion if development is directed to the areas best suited for it.
The EPA study demonstrated, as can be seen
in Figure �, that if a watershed is built out at a one housing unit per acre density, the total impervious cover will be 20%, significantly above the 10% threshold for protecting water quality. However, if the same number of houses that would be allowed at the one acre density were clustered on smaller lot sizes of four and eight units per acre, the imper-vious cover for the watershed is reduced to 9.5% and 8.1%, respectively. Although the impervious cover for the particular clustered development is higher than the one dwelling per acre scenario, the overall watershed impervious cover is greatly reduced and is maintained at a level that protects water quality. Compact development yields less impervious cover on a per unit basis since most of the impervious cover is related to the transportation infrastructure (roads, driveways and parking lots) needed to support growth. Transportation-related impervious cover typi-cally comprises 65-70% of the total impervious cover associated with development (CWP 2000). Obviously, the key to taking advantage of this reality is to increase densities in some areas, while maintaining the same overall number of new units that could be built under the conven-
tional scenario. Continuing this analysis at the town and water-shed scales, the study found that the results were consistent regardless of the size of the area:
• “For the same amount of units, higher-density development produces less runoff and less impervious cover than low-density development; and
• For a given amount of growth, lower-density large-lot development impacts more of the watershed.”
These findings show that large lot development, even though it can reduce impervious surface on an individual property, it is not the preferred strategy for reducing flooding or protecting water resources on a town or watershed level. There

The Need to Reduce Impervious Cover to Prevent Flooding and Protect Water Quality14
Conservation Development allows for growth to continue, even while important features of a site are protected. In reducing the amount of pavement per unit, it also allows for significant reductions in impervious cover.
will be far less negative impact on the watershed if the same number of units are concentrated together in compact neighborhoods and village centers. Moreover, by greatly reducing roads, utilities and other infrastructure costs, this approach can be profitable for developers while reducing house prices for consumers.
This approach can be the foundation of a “smart growth” strategy for our communities, in which a mix of residential, commercial and community uses are combined in traditional towns and vil-lages instead of sprawling over the landscape. The result is a walkable, liveable community surrounded by open space, with low energy costs and assured water supplies. As the market for large houses in the countryside decreases, developers and consumers are both returning to traditional neighborhoods, which can offer a range of house styles and prices, along with various shared amenities. Furthermore, travel to work, school, stores, and recreational areas is reduced, saving gas and further helping the environment. These are the communities that will be able to weather the impacts of climate change and energy costs, and adapt to changing economic circumstances.
Conservation Development
Zoning that limits the overall percentage of impervious cover is useful, but should be com-bined with Conservation Development ordi-nances that provide design flexibility and other incentives to encourage village-style develop-ment. Conservation Development is a creative
The Conservation Development design process is an ideal way to continue development while protecting the headwater streams that are most vulnerable to the impacts of runoff from imper-vious surfaces. Just as important, by reducing the overall footprint of development, these proj-ects can significantly lower the total amount of impervious cover across the watershed. As part of the Scituate Reservoir Source Water Assess-ment, University of Rhode Island Cooperative Extension compared predicted impervious cover under conventional development to that created by more compact conservation development projects. Their projections showed an increase in impervious cover across the watershed from 3% (existing) to 7% (future), enough to cause
land use technique that allows a community to guide growth to the most appropriate areas within a parcel of land to avoid impacts to the environment and character-defining features of the property. Typically, the same number of units as permitted under conventional development are built on a portion of the property, leaving at least 50% of the site as permanent, protected open space. Conservation Development is a step-by-step design process that begins with analysis of the site and its context. The most environmentally sensitive areas as well as those areas most valuable for public recreation, etc. are identified first, then streets and building sites are laid out in a way that avoids these important resource areas.

The Need to Reduce Impervious Cover to Prevent Flooding and Protect Water Quality 15
impairment of aquatic life in many streams and other waterbodies. If 50% of future development follows the Conservation Development process, overall impervious cover can be reduced to 5%, a significant benefit, particularly if Conservation Development is applied in the most sensitive areas. This does not include the additional ben-efit of reducing lawn area, which would be an anticipated result of smaller house lots.
Establishing Impervious Cover Limits through Zoning Ordinances
Historically, community zoning regulated the amount of development that could be located in a given area, but ignored the transportation com-ponent needed to support development. Since impervious cover associated with transportation (roads, driveways and parking) can be 60-70% of the total impervious cover, towns and county governments around the country have started to incorporate limits on impervious cover into their regulations. Most commonly, these have been adopted in specific overlay districts, typically to protect public water supplies or groundwater recharge areas. Increasingly, towns are adopt-ing zoning regulations to limit impervious cover across entire communities.
The Town of Washington, Connecticut has established maximum lot coverage requirements within its zoning regulations to limit impervious cover. The ordinance states:
“In residential districts, the maximum land coverage for all buildings and structures
(principal and accessory uses) including paved, impervious, or traveled surfaces shall not exceed: a. 15 percent of the total land area for lots
less than � acres, b. 0.3 acres for lots between 2 acres and 3
acres [about 12%], and c. 10 percent for lots 3 acres and larger.”
This recognizes that while smaller lots have a higher percentage of impervious cover, they have a lower average percentage of impervious cover per dwelling unit.
The ordinance limits impervious cover in business districts to a maximum of 25%. In allcases, lot coverage is defined as:
“the percentage of the lot, which is covered by structures including (but not limited to) buildings, swimming pools, swimming pool equipment, decks, porches, patios, sports courts, chimneys, air conditioning equipment, generators, utility meters, transformers, above ground propane tanks, and most man made impervious surfaces. Driveways, parking areas, and parking lots are included in the lot coverage calculation whether or not they are paved. Pedestrian walkways are included unless they are made of pervious materials such as gravel, pea stone, or randomly spaced stones set in grass.” (http://www.washingtonct.org/zoning.pdf)
On a larger scale, New Castle County and the City of Newark in Delaware have adopted Water
Resource Protection Area ordinances that include overall limits on impervious cover (Kaufman & Brant 2000). Functioning as zoning overlay districts, these ordinances limit the amount of impervious cover to a maximum of 10% to 20% in (sensitive aquifers, wellhead, recharge and reservoir water resource protection areas- ). In the reservoir district, new single-family devel-opment is limited to a maximum impervious cover of 10%, which is calculated to equate to a gross density of two to three dwellings per acre. Based on this model, Kaufman & Brant proposed watershed zoning for the entire Christina River Basin, covering parts of Maryland, Pennsylva-nia and Delaware (the latter containing the only drinking water supply streams in Delaware, its only six trout streams, and a growing popula-tion of 400,000 people). The zoning ordinance would characterize each portion of the watershed as urban, suburban or open space district, and limit impervious cover to corresponding ranges of 40-55%, 20-35%, and 10-15%.
In an example from North Carolina, Moore County has established impervious cover limits for zoning overlay districts associated with water supply watersheds. (http://www.co.chatham.nc.us/dept/planning/planning_dept/watershed_review_board/supporting_documents/10-70_Rule/Planning_Board_10-70/moore_cnty_watershed.pdf)
The county has four different densities within these overlay zones:
• One dwelling unit per 80,000 s.f., or 6% maximum built-upon area
• One dwelling unit per 40,000 s.f., or 12%
The Need to Reduce Impervious Cover to Prevent Flooding and Protect Water Quality16
maximum built-upon area• One dwelling unit per 20,000 s.f., or 24%
maximum built-upon area• One dwelling unit per 14,000 s.f., or 36%
maximum built-upon area
The “built-upon area” includes “that portion of a development project that is covered by imper-vious or partially impervious cover including building, pavement, gravel areas (e.g. roads, parking, lots, paths), recreation facilities (e.g. tennis courts), etc.” The interesting thing about this ordinance is that it ties watershed protec-tion to traditional lot size/zoning density with a cap on impervious cover. Within the 40,000 and 80,000 s.f. zones particularly, developers will have to substantially decrease road widths and other impervious surfaces to remain under the 12% and 6% impervious caps. These per-lot impervious cover ratios must be used with caution since they would preclude a mixed-use compact growth development that would sig-nificantly decrease the percentage of impervi-ous cover on a per unit basis and help to reduce overall impervious cover within a watershed.
Since the early 1980’s, the City of Austin, Texas has been adopting watershed ordinances that are customized for 4� watersheds within the city planning area (www.ci.austin.tx.us/news/sg_history.htm). Impervious cover limits range from 15% in sensitive resource areas to up to 30-40% for more urban watersheds. A provi-sion for transfer of impervious cover rights (TICR) allows for increased impervious cover in appropriate areas through transfers from more
sensitive locations. The system has withstood numerous legal challenges, and seems to have strong support in an area where natural springs and watercourses can disappear quickly when their recharge areas are paved over.
Incorporating Impervious Cover Manage-ment into a Comprehensive Program to Pro-tect Watershed Health It is important to keep in mind that like any regu-latory strategy, zoning limits on impervious cover must be supported by larger planning, education and outreach efforts, as well as specific design practices that can mitigate the impacts of devel-opment. The Center for Watershed Protection (CWP) has compiled a useful list of Watershed Protection Strategies ranging from watershed planning to site design (CWP 1998):
1. Watershed Planning: Establishing the location and amount of existing and poten-tial future development, and the impervious surface that results, is the foundation of any watershed protection effort. The planning process involves data collection and analysis, testing and selection of management alterna-tives, and creation of policies and strategies to guide implementation.
2. Land Conservation: Conservation efforts include identifying critical habitats and aquatic corridors and the water sources and recharge areas that sustain them, as well as cultural and historic landscapes that are important to a sense of place. Protection
strategies often involve partnerships with landowners, towns, non-profit conservation groups and state agencies.
3. Aquatic Buffers: Stewardship of the area where land and water meet is critically important, especially in rural watersheds.
4. Better Site Design: Innovative approaches to the design of subdivisions, parking lots, streets and buildings can greatly reduce stormwater impacts.
5. Erosion and Sedimentation Control: Con-trol of erosion and unnecessary site distur-bance during the relatively short period when a project is under construction can prevent permanent impacts to water quality.
6. Stormwater Best Management Practices: A range of BMPs, from simple grass swales to complex filtering systems, are increas-ingly applied to reduce the impacts of new construction and to mitigate existing prob-lems.
7. Non-Stormwater Discharges: Discharge from private septic systems, municipal wastewater plants and other sources is regu-lated by state and federal agencies, but often without reference to an overall plan for the watershed.

The Need to Reduce Impervious Cover to Prevent Flooding and Protect Water Quality 17
Conclusions
While the immediate cause of stream degrada-tion varies from place to place, including physi-cal changes and flooding, loss of habitat and biodiversity, and chemical contamination, there is a consistent correlation between rising levels of impervious cover and stream degradation. While you may not be able to predict exactly what will happen to a stream when impervious cover exceeds 10%, you can be fairly certain that negative impacts will result.
Close attention to impervious cover when for-mulating planning and management strategies has great potential for helping Rhode Island towns prevent flooding, protect low-order or small streams and ultimately the health of its watersheds. Lacking data about physical or biotic health of small streams, communities have a hard time knowing which are the most sensi-tive or most important to protect. Towns can use impervious cover to assess threats to sensitive streams and to prioritize conservation activities. Managing the impact of incremental growth on those resources may be harder, but by predicting future levels of impervious cover at build-out, towns can predict whether future growth will likely impact ecosystems or water supplies.
The inclusion of impervious cover in the regula-tory process at the municipal level must be used carefully. Towns need to establish a clear link between specific impervious cover thresholds and the protection of public health, safety and welfare. Indeed, communities should look at
the specific characteristics of their streams and watersheds and adopt thresholds appropriate for their community, ranging from 4% in sensitive areas to 10% where there are more favorable soil conditions. However, on the watershed scale, the 10% threshold can be a valuable benchmark.
As a practical matter, using impervious cover as a surrogate for all of the various water qual-ity impacts allows towns to avoid the cost of tracking dozens of indicators independently. By keeping impervious cover below the thresh-old where flooding occurs or water quality is impacted, towns can avoid having to pursue costly mitigation when it may be too late to provide much benefit.
Keeping the level of impervious cover in a watershed below 10% will establish an over-all safeguard for the watershed, but it won’t prevent some degradation of the most sensitive resources, especially if development occurs in unsuitable areas. Therefore, towns should combine overall limits on impervious cover with policies and regulations that promote Conserva-tion Development, which allows developers the flexibility to cluster new homes and businesses on the portion of the site that is best suited for development, while providing conservation buffers around sensitive areas. Another benefit of Conservation Development is that it reduces road, sidewalk and driveway lengths, further limiting the amount of impervious cover on a per unit basis.
Finally, towns should require the use of design and construction practices that reduce runoff at the source. Known as “Low Impact Develop-ment” (LID), these include a suite of techniques that catch stormwater as it flows off roofs and driveways and divert it to areas where it can soak back into the ground. Combined with low over-all density and the use of Conservation Develop-ment to provide flexibility in locating new roads and homes on a site, LID has the potential to keep runoff from most storms entirely within the boundaries of a site, mimicking the site’s pre-development hydrology.
Recommendations for Rhode Island Towns:
• Encourage growth to be located within the Urban Services Boundary wherever pos-sible.
• Promote compact mixed-use development to accommodate larger numbers of dwellings in a traditional village context, which reduces the amount of impervious cover per unit of development.
• Adopt 10% as the upper limit of impervious cover as a policy to be incorporated into the Comprehensive Plan, where applicable.
• Make a strong policy connection in the Comprehensive Plan between the need to limit impervious cover and the designated zoning density for various areas.
• Adopt Conservation Development ordi-nances that reference the town’s impervi-ous cover policy and make it clear that calculations for conservation developments should be based on the average percentage

The Need to Reduce Impervious Cover to Prevent Flooding and Protect Water Quality18
of impervious cover across the entire site. Require the amount of impervious cover per dwelling unit be available when comparing conventional and conservation subdivision plans.
• Adopt the better site design practices from the Rhode Island Community LID Guidance Manual (DEM 2010) to more effectively reduce impervious cover from all develop-ment.

The Need to Reduce Impervious Cover to Prevent Flooding and Protect Water Quality 19
References
Estimating Impervious Cover
Canters, et al, 2005 Effects of Different Methods for Estimating Impervious Surface Cover.
Capiella, Karen and Kenneth Brown, 2001. Imper-vious Cover and Land Use in the Chesapeake Bay Watershed. Center for Watershed Protection, Elli-cott City, MD.
Civco, Daniel, Anna Chabaeva, and James Hurd, 2004. A Comparison of Approaches to Impervi-ous Surface Characterization. Dept. of Natural Resources Management & Engineering, College of Agriculture and Natural Resources, The Univer-sity of Connecticut, Storrs, CT.
Exum, Linda, 2002? Estimating and Projecting Impervious Cover in the Southeastern United States. U.S.EPA, Office of Research and Develop-ment, National Exposure Research Laboratory.
Giannotti, Laurie and Sandy Prisloe, 1998. Do it Yourself! Impervious Surface Buildout Analysis: Nonpoint Education for Municipal Officials, Tech-nical Paper Number 4. Connecticut Cooperative Extension, Haddam, CT.
Prisloe, Michael, Laurie Giannotti and William Sleavin, 2000. Determining Impervious Surfaces for Watershed Modeling Applications. Presented at the 8th National Nonpoint Source Monitoring Conference, Hartford, CT.
Impacts of Impervious Cover on Watershed Quality
Brabec, Elizabeth, Stacey Schulte and Paul L. Richards, 2002. Impervious Surfaces and Water Quality: A Review of Current Literature and Its Implications for Watershed Planning. Journal of Planning Literature, Vol 16, No. 4.
Carson, Hartwell., Eaker, Bill., Gibson, Phillip., Randall, Mike. (2005) Human Health Impacts from Stormwater Runoff. River Link, Land-of-Sky Regional Council, Division of Water Quality. www.seris.info/RiverLink/techinfo.shtml
Center for Watershed Protection, 2002. Is Imper-vious Cover Still Important? From “Runoff Rundown,” www.cwp.org/runoff_rundown.htm, Center for Watershed Protection, Ellicott City, MD
Clausen, John C., Glenn Warner, Dan Civco, and Mark Hood, 2003. Final Report: NEMO Impervi-ous Surface Research. Dept. of Natural Resources Management & Engineering, College of Agricul-ture and Natural Resources, The University of Connecticut, Storrs, CT
Hurd, James D. and Daniel L. Civco, 2004. Surface Water Quality and Impervious Surface Quantity: a Preliminary Study. Center for Land Use Education and Research, Dept. of Natural Resources Management & Engineering, College of Agriculture and Natural Resources, The Univer-sity of Connecticut, Storrs, CT
Paul, Michael., Meyer, Judy.(2001) Streams in the Urban landscape. Institute of Ecology, University
of Georgia, Athens, Georgia.. http://arjournals.annualreviews.org/doi/abs/10.1146/annurev.ecol-sys.32.081501.114040
Schueler, Thomas. The Importance of Impervious-ness (2000). The Practice of Watershed Protection. Center for Watershed Protection. Ellicott City, MD.
Wright, Tiffany, Jennifer Tomlinson, Tom Schueler, Karen Cappiella Anne Kitchell, and Dave Hirschman, 2006. Direct and Indirect Impacts of Urbanization on Wetland Quality: Wet-lands & Watersheds Article #1. Center for Water-shed Protection, Ellicott City, MD. www.cwp.org; www.stormwatercenter.net.
Impervious Cover and Total Maximum Daily Load
Connecticut Department of Environmental Protec-tion, 2007. A Total Maximum Daily Load Analy-sis for Eagleville Brook, Mansfield, CT. Connecti-cut DEP, Hartford, CT
ENSR International, 2005. Pilot TMDL Applica-tions Using the Impervious Cover Method. US Environmental Protection Agency, Region 1, Boston, MA.
Watershed Planning Using Impervious Cover
Bellet, Lenny, Lorraine Joubert and Patricia Hickey, 2003. The Scituate Reservoir Source Water Assessment. University of Rhode Island Cooperative Extension, Department of Natural Resources Science. Kingston, RI.

The Need to Reduce Impervious Cover to Prevent Flooding and Protect Water Quality20
Booth, Derek B., David Hartley and Rhett Jackson, 2002. Forest Cover, Impervious Surface Area, and the Mitigation of Stormwater Impacts. Journal of the American Water Resources Association, Vol. 38, No. 3.
Eightmile River Wild and Scenic Watershed, 2006. Eightmile River Watershed Management Plan, Appendix 9. Haddam, CT.
Capiella, Karen and Kenneth brown, 2001 Imper-vious Cover and Land Use in the Chesapeake Bay Watershed. Center for Watershed Protection, Elli-cott City, MD
Cappiella, Karen, Anne Kitchell, and Tom Schueler, 2006. Using Local Watershed Plans to Protect Wetlands: Wetlands & Watersheds Article #�Center for Watershed Protection, Ellicott City, MD Cappiella, Karen and Lisa Fraley-McNeal, 2007. The Importance of Protecting Vulnerable Streams and Wetlands at the Local Level: Wetlands & Watersheds Article #6. Center for Watershed Pro-tection, Ellicott City, MD.
Center for Watershed Protection, 1998. Rapid Watershed Planning Handbook. Center for Water-shed Protection, Ellicot City, MD.
Center for Watershed Protection, 2005. Tool 13: Comparative Subwatershed Analysis (CSA), from A User’s Guide to Watershed Planning in Mary-land. Maryland Department of Natural Resources, Annapolis, MD.
Huron River Watershed Council, 2004. Water-shed Planning: Determining Impervious Surface Capacity to Better Manage Growth at the Rural/Urban Fringe. Huron River Watershed Council, Ann Arbor, MI.
Wyckoff, Mark, Michele Manning, Kris Olsson and Elizabeth Riggs, 2003. How Much Develop-ment is Too Much? A Guidebook on Using Imper-vious Surface and Gravel Road Capacity Analysis to Manage Growth in Rural and Suburban Com-munities. Huron River Watershed Council, Ann Arbor, MI.
Zoning and Regulatory Tools
Gibbons, Jim, 1998. Addressing Imperviousness in Plans, Site Design and Land Use Regulations. Nonpoint Education for Municipal Officials Tech-nical Paper Number 1, University of Connecticut Cooperative Extension, Haddam, Ct. www.nemo.uconn.edu.
Hoch, Charles, Linda Dalton, and Frank So, 2000, editors. The Practice of Local Government Plan-ning. ICMA Press.
Kauffman, Gerald J. and Tammy Brant, 2000. The Role of Impervious Cover as a Watershed-based Zoning Tool to Protect water Quality in the Chris-tina River Basin of Delaware, Pennsylvania, and Maryland. University of Delaware, Institute for Public Administration, Water Resources Agency, Newark, DE.
Kauffman, Gerald J, Martha B. Corrozi, and Kevin J. Vonck, 2002. Imperviousness: A Performance
Measure of a Delaware Water Resource Protection Area Ordinance. University of Delaware, Newark, DE.
Richards, Lynn, Geoffrey Anderson and Mary Kay Santore, 2003. Protecting Water Resources with Higher Density Developments. Proceedings of the 13th Biennial Coastal Zone Conference, Baltimore, MD.
Russell, Joel, 2004. Overlay Zoning to Protect Surface Waters. Planning Commissioners Journal, Number �4.
Stone, Brian, Jr., 2004. Paving Over Paradise: How Land Use Regulations Promote Residential Imperviousness. Landscape and Urban Planning 69 (2004) 101-113.