the need for technical justification and performance
TRANSCRIPT

The Need For Technical Justification and Performance Demonstrations
Presented by: Grant Meredith
Date: 8 February 2018

02 November 20172
Introduction and overview
Historical Process
How this started ENSIP Engine Structural Integrity Program
Industry based Process
Probability of detection
29/29 method
Round Robin Tests EPRI NDT in Aerospace
PANI 2 results
Performance demonstrations n the USA (PISC III)
Program for the assessment of NDT in Industry (PANI 1)
ASME V Article 14
BS 7910
European Network for Inspection and Qualification
240-87660096 Eskom Standard Qualification document
Conclusions and recommendations
References
CONTENTS
02 November 2017 3
When we learn about NDT at the training institutions, we are introduced to the history of each NDT method:
Oil and whiting
UT on WW II Aircraft to keep them flying
Little was explained about processes to facilitate qualification of NDT systems
NDT follows the medical industry as the funding is available for development of diagnostic tools.
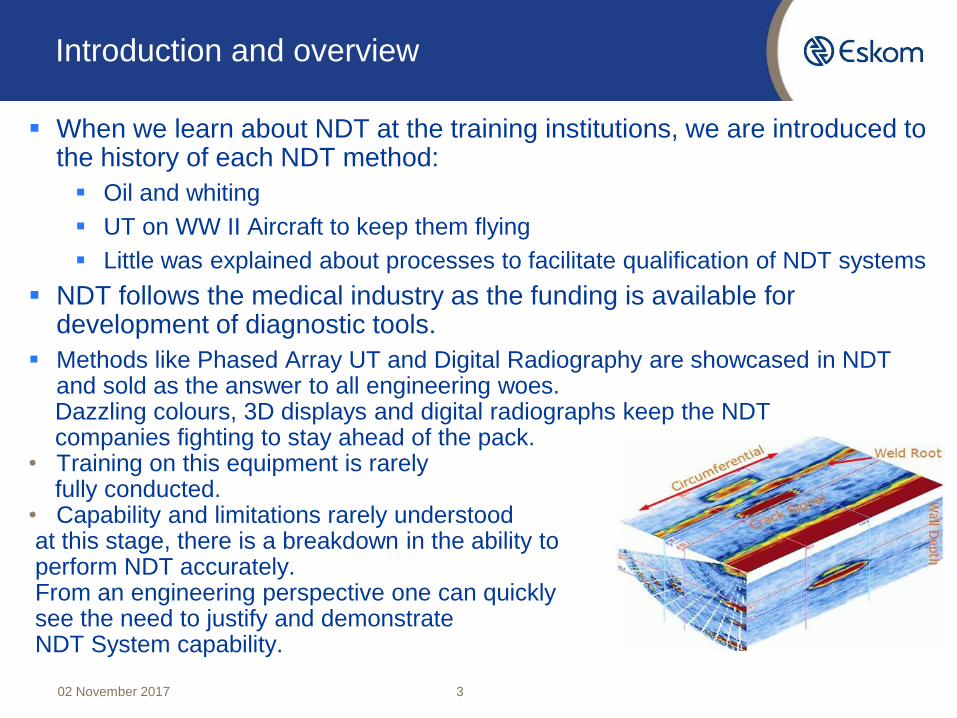
Methods like Phased Array UT and Digital Radiography are showcased in NDT and sold as the answer to all engineering woes. Dazzling colours, 3D displays and digital radiographs keep the NDT companies fighting to stay ahead of the pack.
• Training on this equipment is rarely fully conducted.
• Capability and limitations rarely understoodat this stage, there is a breakdown in the ability toperform NDT accurately. From an engineering perspective one can quickly see the need to justify and demonstrate NDT System capability.
Introduction and overview

02 November 2017 4
NDT Systems comprise of:
Inspection Procedure
Equipment
Operator
To ensure systems are capable of consistently detecting conditions that render a component unfit for service and able to detect the minimum detectable defect size, qualification is necessary.
This information is used to calculate
serviceable life of a component.
• Day to day inspections rely on calibration test
pieces with “defective” or “perfect” conditions
to standardize equipment for sensitivity and
repeatability.
• We do not always know if the equipment setup
is capable of finding what it is intending to.
Introduction and overview
02 November 2017 5
• ASME I says “When qualification of the written examination procedure is required by the referencing Code Section, it shall be qualified by performing a demonstration examination which shall be performed…
• ASME V Article 14 gives guidelines of the process
• ENIQ written practices give detailed guidelines on the entire process
Introduction and overview

02 November 2017 6
• Inspection methoddologies are routinely applied in the power generation industry. Currently there is a lack of confidence in the NDT results based on the following reasons:
• Fraudulent misrepresentation of the inspection Process
• Operator negligence, falsification of reports
• Misrepresentation of the Equipment capabilities
• Using incorrect hardware to perform an inspection
• Misrepresentation of the personnel
• Un-certified or certified inexperienced personnel
• Misrepresentation of the procedure
• Inability of the procedure to detect what was intended
Historical Process
02 November 2017 7
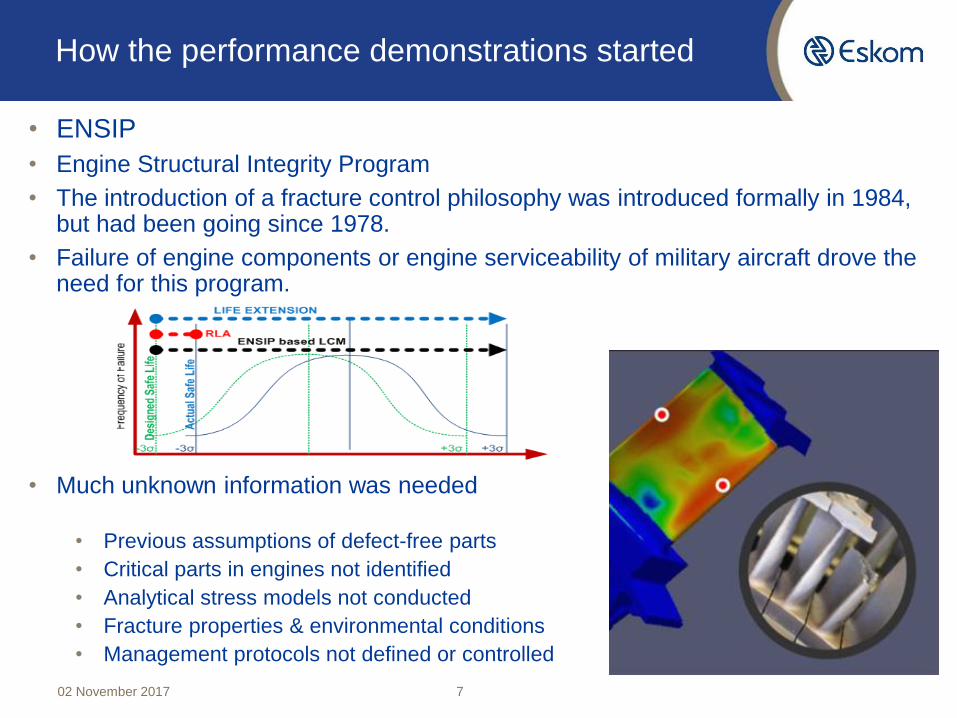
• ENSIP
• Engine Structural Integrity Program
• The introduction of a fracture control philosophy was introduced formally in 1984, but had been going since 1978.
• Failure of engine components or engine serviceability of military aircraft drove the need for this program.
• Much unknown information was needed
• Previous assumptions of defect-free parts
• Critical parts in engines not identified
• Analytical stress models not conducted
• Fracture properties & environmental conditions
• Management protocols not defined or controlled
How the performance demonstrations started
02 November 2017 8
• ENSIP
• Criteria were established to set up application methodology, these included:
• Fracture critical components
• These became know as flight safety components
• Initial flaw size• Probability of detection needed to be set as high as possible with the maximum
confidence level.• Additional critical calculations were carried out to ensure by demonstration reliable
and consistent detection of critical flaw sizes per method, mentioned below with a 90% POD and 95%CL.
• 0.75mm surface length by the FPI method• 0.25mm surface length by ET and UT inspection processes• 1.3mm2 area for embedded planar defects using UT methodology• 5mm surface length on welded components by FMT or FPI• 0.2 x thickness of weld for embedded rounded indications by the RT method
How the performance demonstrations started
02 November 2017 9
• ENSIP• Residual strength
• Use of the minimum safety factor on aircraft structures.
• Environmental and operating conditions determine loading of critical components.
• Inspection Intervals
• Critical components are lifed (after x flight hours the part is replaced regardless).
• Other parts are periodically inspected based on the technical justification for the inspection process.
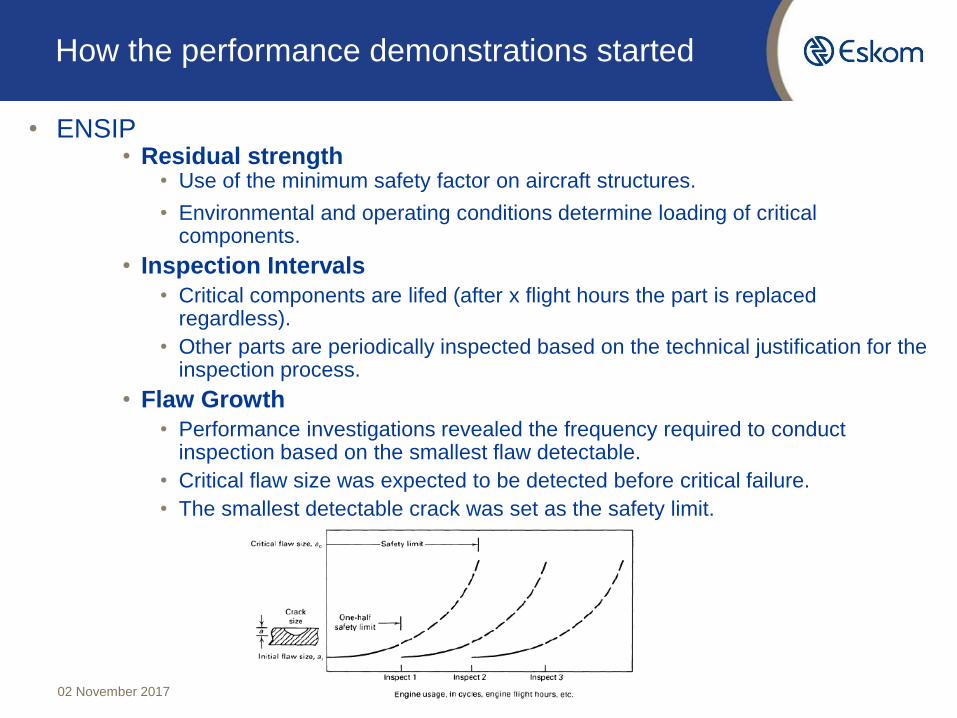
• Flaw Growth
• Performance investigations revealed the frequency required to conduct inspection based on the smallest flaw detectable.
• Critical flaw size was expected to be detected before critical failure.
• The smallest detectable crack was set as the safety limit.
How the performance demonstrations started

02 November 2017 10
• ENSIP
• Operating information• Pre-flawed areas as seen in the areas on the engine showing arrows were
created on an engine and it was cycled with changes in the following conditions:
• Spin frequency• Increasing resistance• Increasing temperature
Operating conditions of engines determined• inspection frequency intervals.• Minimum detectable defect size had been • calculated to establish best inspection POD
w with the highest Confidence level. • Very precise inspection systems were
created.
How the performance demonstrations started

02 November 2017 11
• NDT Engineering process
• Manufacturing NDT uses the POD methodology to establish inspection criteria and detection capability.
• NDT reliability is established from a systematic approach.• A reliable NDT procedure is developed d to consistently detect a predetermined
defect size.• The procedure demonstrates this consistent detection of artificial (EDM or
similar) or natural defects.• The most out of normal event is created with the flaws to establish the
limitations of detection. (flaw morphology: tilts, skews)• Data is collected, under various conditions to simulate in-service stresses
• The variables that were given maximum weighting to establish the Technical Justification process:
• Conditional probability of NDT Discrimination or probability of detection.• To assess POD parameters, guidelines were set for development.• The following events were postulated for the detection of “cracks”.
• True positive: detection of a real event (real crack detected)• False Positive: detection of a crack that does not exist (false calls)• False Negative: non detection of the actual flaw • True negative: the non existence of a crack, and it is not detected
• Combinations of these variables were used with multiples of inspections to establish the probability of detection with the confidence level.
How the performance demonstrations started
02 November 2017 12
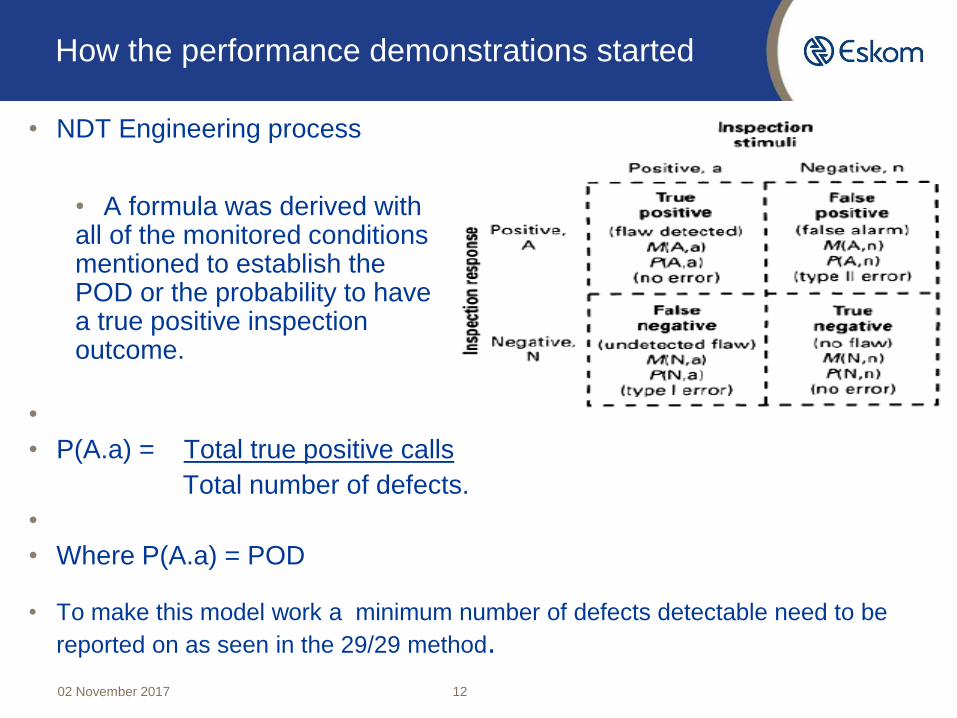
• NDT Engineering process
• A formula was derived withall of the monitored conditionsmentioned to establish the POD or the probability to havea true positive inspection outcome.
•
• P(A.a) = Total true positive calls
Total number of defects.
•
• Where P(A.a) = POD
• To make this model work a minimum number of defects detectable need to be
reported on as seen in the 29/29 method.
How the performance demonstrations started

02 November 2017 13
• NDT Engineering process
• Signal to noise relationship
• Defect detection relies on detecting and interpreting signals (plus noise) and noise signals -remember not being allowed to touch the reject button on the UT set.
• Repeatedly applying the approved procedure to an inspection intervention, the consistent detection of the discontinuity, along with the associated inspection noise, allows you to discriminate the noise out and thereby improving inspection confidence.
• With threshold acceptance criterion placed too high (a above), some flaws are missed (reduce POD).
• With acceptance criterion placed at the proper level (b above), clear discrimination will result (high POD).
• With acceptance criterion placed too low (c above), flaws will be rejected; but some false alarms will result, and good parts rejected (high Probability of False Alarm).
How the performance demonstrations started

02 November 2017 14
• NDT Engineering process
• Reference standards
• Problems exist when selecting a reference standard as more that a quantification of the inspection.
• Sizing and characterization can rarely be assumed from these standards.
• Reasons for this include:• Slight variations in the orientation of the slot • Surface finish of the slot for the ultrasonic response. • NDT methods vary in their response to geometric parameters• Width of the flaw used in a reference standard.• Surface conditions affect the results. • MT methods sensitive to defect width and magnetic permeability. • Radiographic methods are sensitive to
the thickness and flaw shape.
Actual flaw compared with EDM type notch differs massively because of a variety of variable.Response differences from these two occurrences can be seen.
How the performance demonstrations started

02 November 2017 15
• NDT Engineering process
• Personnel• Inspection results vary largely from inspector to inspector, as well as results changing for
one inspector subjected to changing environmental and physiological conditions.• Training and experience play a large role in ensuring some consistency in an approach.
• Note: an industry recognized certification does not guarantee satisfactory inspection results from a particular inspection.
• In order to best control this function of the system, the following factors are taken into account.
• Control of the work environment of the inspector. • Distractions such as noise, extremes in temperature, and other irritants should be
eliminated including the use of electronic devices (let me check my Facebook quickly). • Break periods should be frequent enough to reduce fatigue. • Ill otherwise physically impaired personnel should be temporarily assigned other tasks
to the extent possible. • Efforts that improve good mental attitude are excellent ways to ensure sustained
inspection reliability.
Where the criticality of the inspection is high, and the above measures cannot be taken, two operators should inspect the parts independently.Two inspectors generally will not make identical mistakes.
How the performance demonstrations started
02 November 2017 16
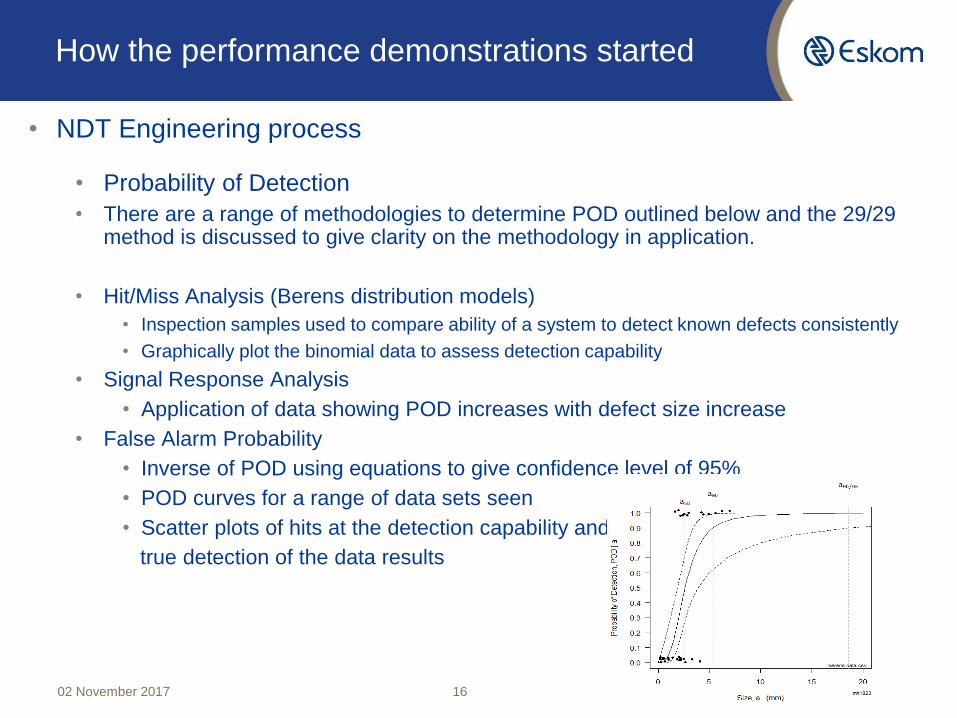
• NDT Engineering process
• Probability of Detection
• There are a range of methodologies to determine POD outlined below and the 29/29 method is discussed to give clarity on the methodology in application.
• Hit/Miss Analysis (Berens distribution models)
• Inspection samples used to compare ability of a system to detect known defects consistently
• Graphically plot the binomial data to assess detection capability
• Signal Response Analysis
• Application of data showing POD increases with defect size increase
• False Alarm Probability
• Inverse of POD using equations to give confidence level of 95%
• POD curves for a range of data sets seen
• Scatter plots of hits at the detection capability and
true detection of the data results
How the performance demonstrations started
02 November 2017 17
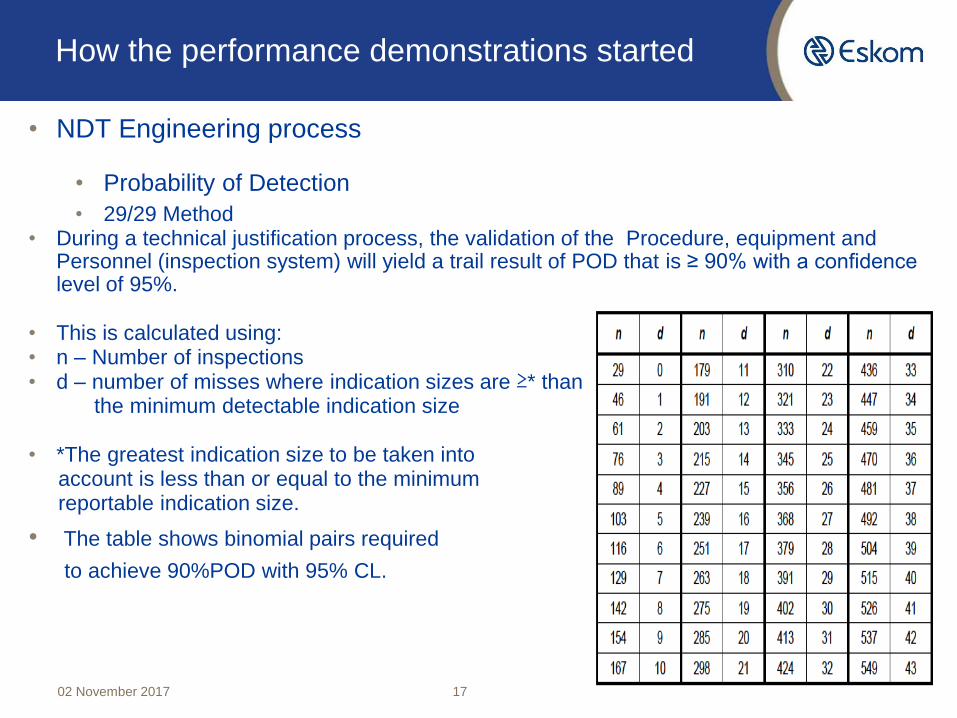
• NDT Engineering process
• Probability of Detection
• 29/29 Method• During a technical justification process, the validation of the Procedure, equipment and
Personnel (inspection system) will yield a trail result of POD that is ≥ 90% with a confidence level of 95%.
• This is calculated using: • n – Number of inspections• d – number of misses where indication sizes are ≥* than
the minimum detectable indication size
• *The greatest indication size to be taken into account is less than or equal to the minimumreportable indication size.
• The table shows binomial pairs required
to achieve 90%POD with 95% CL.
How the performance demonstrations started
02 November 2017 18
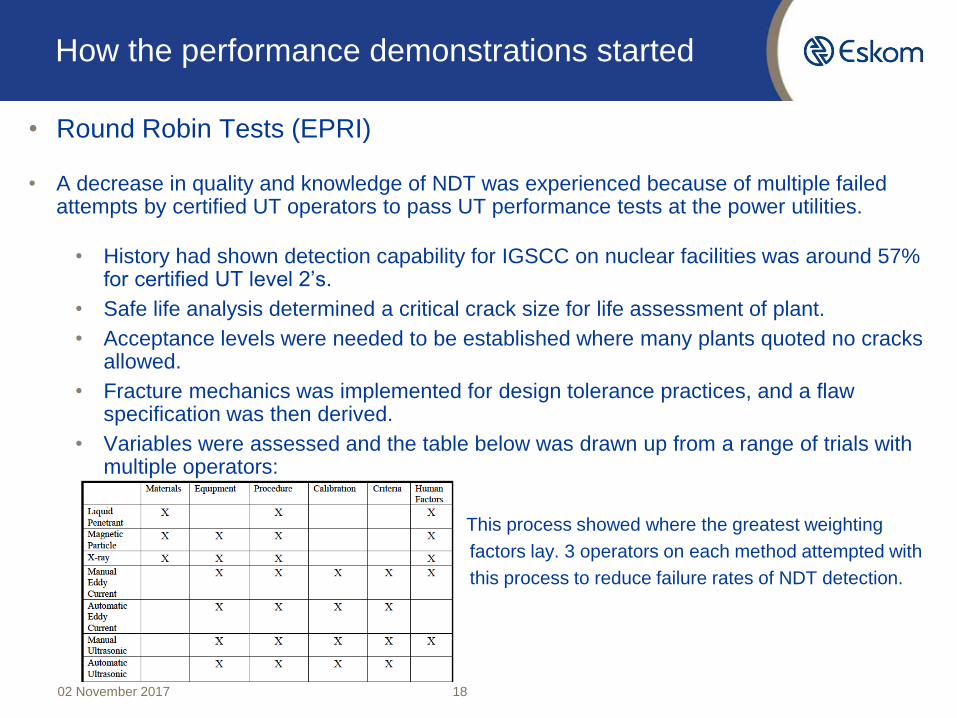
• Round Robin Tests (EPRI)
• A decrease in quality and knowledge of NDT was experienced because of multiple failed attempts by certified UT operators to pass UT performance tests at the power utilities.
• History had shown detection capability for IGSCC on nuclear facilities was around 57% for certified UT level 2’s.
• Safe life analysis determined a critical crack size for life assessment of plant.
• Acceptance levels were needed to be established where many plants quoted no cracks allowed.
• Fracture mechanics was implemented for design tolerance practices, and a flaw specification was then derived.
• Variables were assessed and the table below was drawn up from a range of trials with multiple operators:
• This process showed where the greatest weighting
• factors lay. 3 operators on each method attempted with
• this process to reduce failure rates of NDT detection.
How the performance demonstrations started
02 November 2017 19
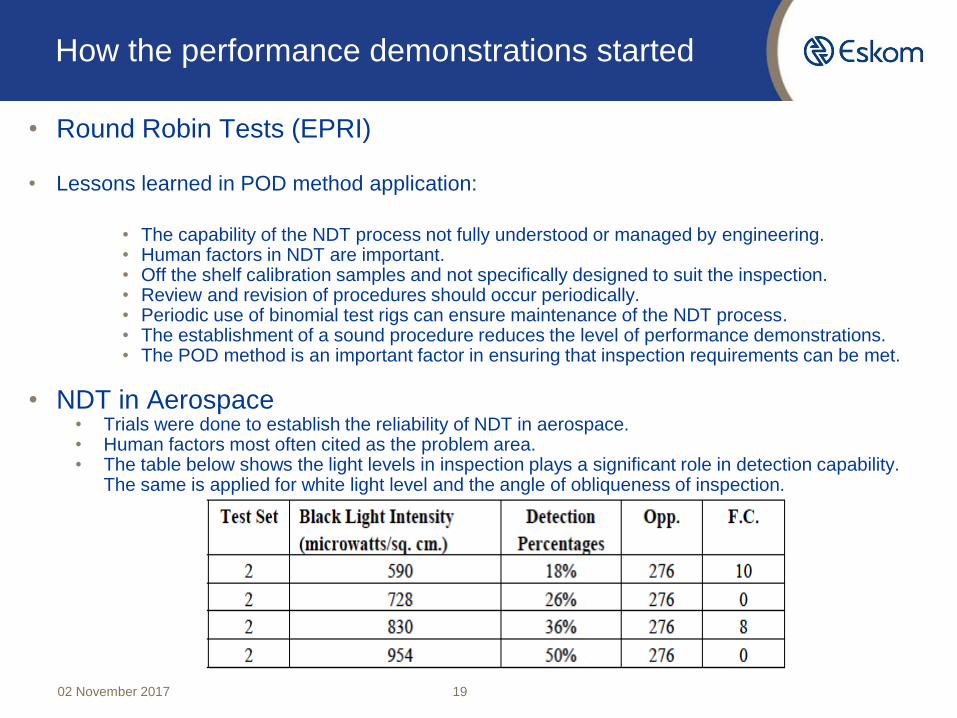
• Round Robin Tests (EPRI)
• Lessons learned in POD method application:
• The capability of the NDT process not fully understood or managed by engineering.• Human factors in NDT are important.• Off the shelf calibration samples and not specifically designed to suit the inspection.• Review and revision of procedures should occur periodically. • Periodic use of binomial test rigs can ensure maintenance of the NDT process.• The establishment of a sound procedure reduces the level of performance demonstrations.• The POD method is an important factor in ensuring that inspection requirements can be met.
• NDT in Aerospace• Trials were done to establish the reliability of NDT in aerospace.• Human factors most often cited as the problem area.• The table below shows the light levels in inspection plays a significant role in detection capability.
The same is applied for white light level and the angle of obliqueness of inspection.
How the performance demonstrations started

02 November 2017 20
• Round Robin Tests (EPRI)
• PANI II Session results
• 30 operators tested to determine• Inspection results from a standard procedure available to all• Inspection results from an improved procedure.• After completion, training of operators and re-inspection results
• There were 3 groups of 10 operators to test 6 specimens, namely• 2 X nozzle welds• pipe with 4 butt welds• T fillet weld• J prep weld• Actual flawed specimen with a root crack
• Results showed 50% detection rates with operator results ranging from 30-40%detrection rate
• Conclusions• Supervised practice IMPORTANT NOTE:-• Refresher training LEVEL 3 ANNUAL SURVEILLANCE OF EACH• Repeat testing CERTIFIED OPERATOR
How the performance demonstrations started
02 November 2017 21
• Round Robin Tests (EPRI)
• Performance Demonstrations in the USA (PISC III)
• In 1989 ASME XI set out rules to qualify NDT systems• 23 samples of Reactor Pressure Vessels were created with a multiple “defects” • Geometric flaws also included. Detection criteria was set at 25mm through wall
height and the results were below the 50% detection rate.• As a result of this most of the Nuclear units joined the programs, the repeated
need to detect ICSCC was a significant necessity.
• Program for the assessment of NDT in industry (PANI I)
• Key industry test pieces used from a range of participating countries and companies.
• UT procedures used were mostly based on 14dB below DAC using a 3mm SDH.
• Results below show the outcome using both analogue and digital equipment.
How the performance demonstrations started

02 November 2017 22
• Round Robin Tests (EPRI)
• Results from most of these trials revealed startling results, and these even with qualified operators.
• Where geometry complexity increased, false calls from geometry significantly increased.
• Detection of individual defects was between 6% and 100%.• Detection rates were not linked to sizes of defects.• Generally, far surface-breaking defects were least easily detected.• Two of the defects were below the reporting threshold
How the performance demonstrations started
02 November 2017 23
• The time had come to change industry’s way of accepting NDT.
• ASME V article 14• This document makes provisions for qualifying NDT systems.• The document is laid out in the following fashion to assist in the establishment of a
system qualification process for NDT.
• Qualification process• It evaluates presented evidence for qualifying inspection systems.• Technical Justification.
• This document is created detailing in report fashion theoretical and practical examination methods of a particular component. It usually includes:-
• Modeling• Field experience• Test sequencing• Expected flaw mechanisms• Defect NDT signal response to defect morphology and geometry
• Performance Demonstration• Achieving the level of Performance parameters include the followng requirements:
• Test specimens replicate the item being qualified on.• Limited demonstration scope may be suggested with actual hardware test pieces.• Personnel qualifications based on the blind trials, qualification is based on passing.• Level of rigor applied to the performance demonstration may vary.
The Way Forward

02 November 2017 24
• Levels of Rigor• Low rigor (technical justification only)
• Satisfactory technical justification report.• No performance demonstrations necessary to qualify the examination system.
• Intermediate rigor• The requirements for this level of rigor are a satisfactory technical justification report, and
the successful performance demonstration test (blind or non-blind) on a limited number of test specimens.
• High rigor • A satisfactory technical justification report, and the successful performance of blind
demonstration tests. A sufficient number of test specimens shall be evaluated to effectively estimate sizing error distributions, and determine an accurate POD for specific degradation mechanisms or flaw types and sizes.
• Planning a Qualification demonstration• A range of activities are required namely:-• Assemble all necessary input information:- defect types, damage mechanism of interest, and
objectives for the examination and qualification of the examination system.• Review the written procedure to verify its suitability.• Develop the technical justification for the examination method to be used.• Determine the required level of rigor for the performance demonstration.• Develop performance demonstration criteria using the applicable references.• Conduct the performance demonstration.• Conduct the personnel qualifications.• Compile, document, and evaluate the results.• Determine qualification status, based upon a final investigation.
The Way Forward
02 November 2017 25
• Equipment overview.
• Detailed overview of each of the components making up the equipment, probes, standardization blocks, calibration and test set up blocks, etc.
• Application requirements• The following sequencing shall be documented and demonstrated:
• Component description and flaws to be examined. This includes the type, size location, critical flaw size (flaw specification calculated from fracture mechanics analysis) and growth rate expected.
• Object geometry, environmental conditions, test limitations and metallurgical condition.• Acceptance criteria• Previous similar work performed• Reports and findings from previous similar inspections • Extent of previous round robin tests (if applicable)• Observed flaw detection rate (the POD/ FCR)• Sizing accuracy demonstrated
• Description of influential parameters• Procedure requirements • Personnel certification requirements • The level of rigor. The higher the level of rigor, the higher the additional training
requirements may be above the level 2 or level 3 certification.
The Way Forward

02 November 2017 26
Description of examination technique
• Justification for method and technique selection. • Detection of the required flaws and critical sizes. • Sensitivity settings • Orientation (tilts and skews) of defects • Critical flaw size and degradation mechanism • Geometrical influences• Characterization and sizing of defects.• There are optional topics mentioned as well for the technical justification report namely• Flaw responses from modeling• Scan plans showing coverage• Procedure experience write up
Performance Demonstration
• Performance demonstrations on higher levels of rigor.• The system is qualified after demonstrating performance demonstration matches procedural
intention of the technical justification procedure. • The use of open trials qualifies the equipment and the procedure, blind trials successfully
conducted qualifies the entire system.• An administrator selected to monitor the process with full traceability of the process and
records.
Protocol documentPrepared with the intention consistent and repeatable application for performance demo’s. This shall include a pass/fail criteria.
The Way Forward
02 November 2017 27
• Individual Qualification• A two stage process involving a performance demonstration to qualify personnel
against a previously approved system.
• Calibration• In order to qualify the equipment section, all required calibrations shall have been
performed.
Examination• Carried out under the supervision of a qualification nominated individual and other
required parties. • The protocol document applied to ensure consistency.
A few other processes are applied to the evaluation of the documentation to ensure that the process becomes qualified.The system is qualified once all of the required processes are followed.Changing any of the qualified parameters requires requalification of the system.
The Way Forward
02 November 2017 28
• Guide for assessing the acceptability of flaws in metallic structures.• The guide BS 7910 has been used as a method for determining flaw specification
for components being tested.• Acceptance levels based on fitness for service.• Engineering critical assessments (ECA) are made using Finite Element Analysis.• This information is critical in the determination of both:-
• Assessing the critical flaw size of a component to devise inspection protocols, and• Assessing the fit for purpose condition of a component that has a flaw reported.
• In order to make these critical determinations, the following information is required:
• Types of flaw• Planar• Cracks, LOF• Non planar inclusions corrosion • Shape imperfections (misalignment)
• Modes of failure• Fracture and plastic collapse torsional and bending moments• Creep and creep fatigue (operating at high temperatures material specific)• Corrosion erosion • Environmentally assisted cracking (hydrogen induced cracking)• Instability
The Way Forward
02 November 2017 29
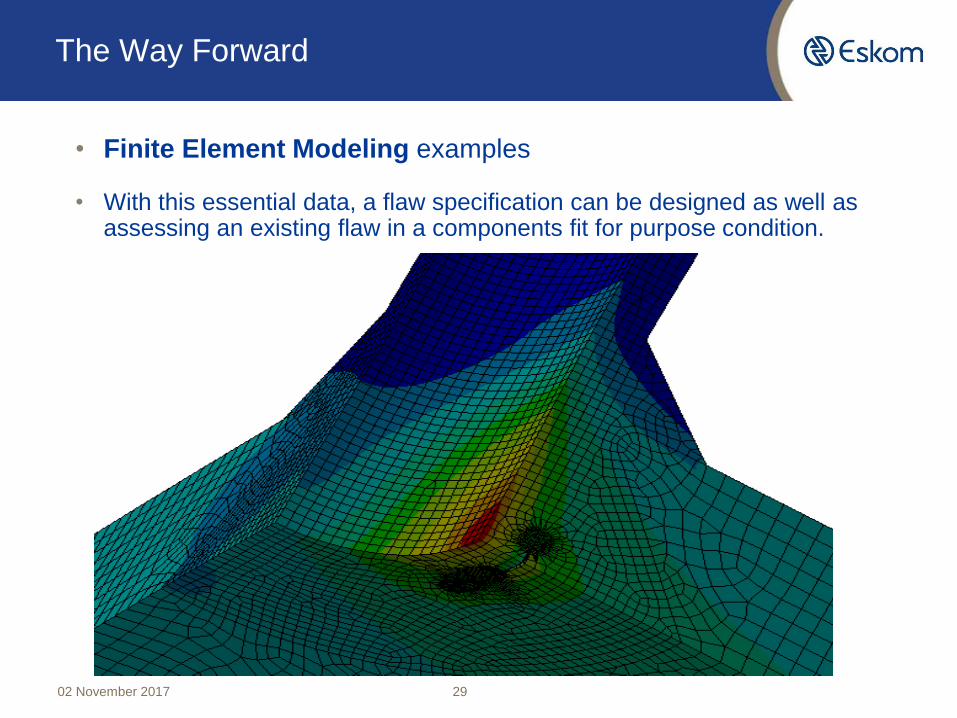
• Finite Element Modeling examples
• With this essential data, a flaw specification can be designed as well as assessing an existing flaw in a components fit for purpose condition.
The Way Forward

02 November 2017 30
• For this given condition, the FEA showed that there would be no problem with the fitness for purpose of this component to operate as is. The graph shows very little stress differences on the component. To have repaired at this point would have cost time and potentially introducing additional problems into this exotic material Pressure vessel.
The Way Forward
0
0.5
1
1.5
2
2.5
3
3.5
4
4.5
5
0 500 1000 1500 2000 2500 3000 3500 4000
pla
stic
str
ain
(%
)
pressure (kPa)
as-designed
with defect

02 November 2017 31
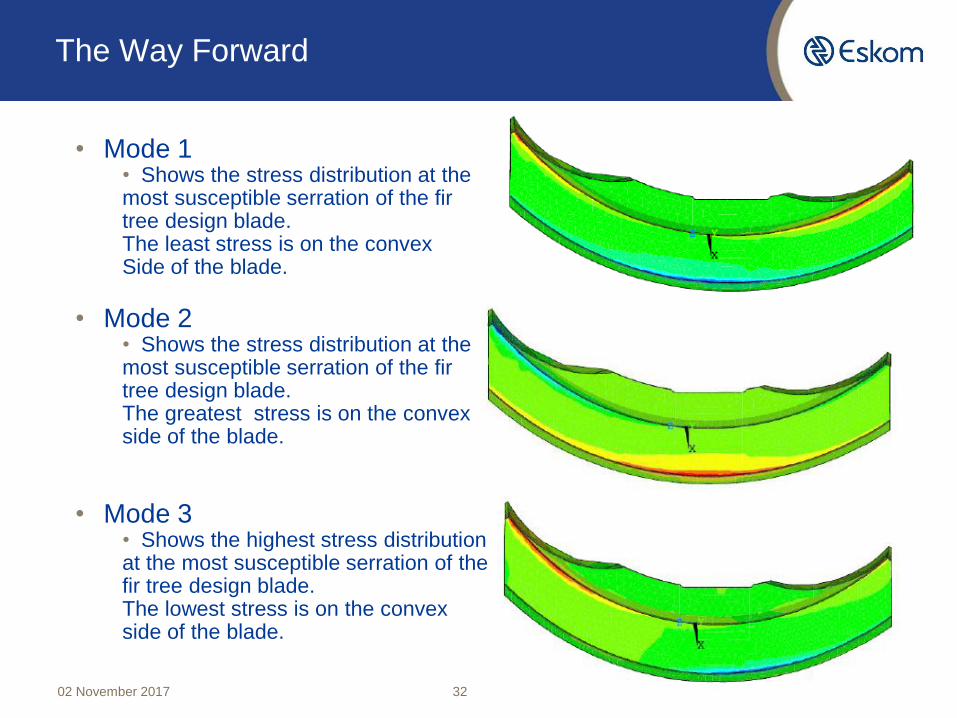
• Finite Element Modeling examples• Below shows the various loading mechanisms on a turbine blade to assess high cycle fatigue
and the added existence of SCC in the relevant problematic area.• This blade type is susceptible to Stress Corrosion cracking (SCC), this model was created to
show the various modes of stress. It was used to calculate minimum defect size s to be detected. SCC initiation points and susceptibility was modeled from simulated operating conditions.
The Way Forward
02 November 2017 32
• Mode 1 • Shows the stress distribution at themost susceptible serration of the fir tree design blade.The least stress is on the convex Side of the blade.
• Mode 2• Shows the stress distribution at themost susceptible serration of the fir tree design blade. The greatest stress is on the convexside of the blade.
• Mode 3• Shows the highest stress distributionat the most susceptible serration of thefir tree design blade. The lowest stress is on the convex side of the blade.
The Way Forward
02 November 2017 33
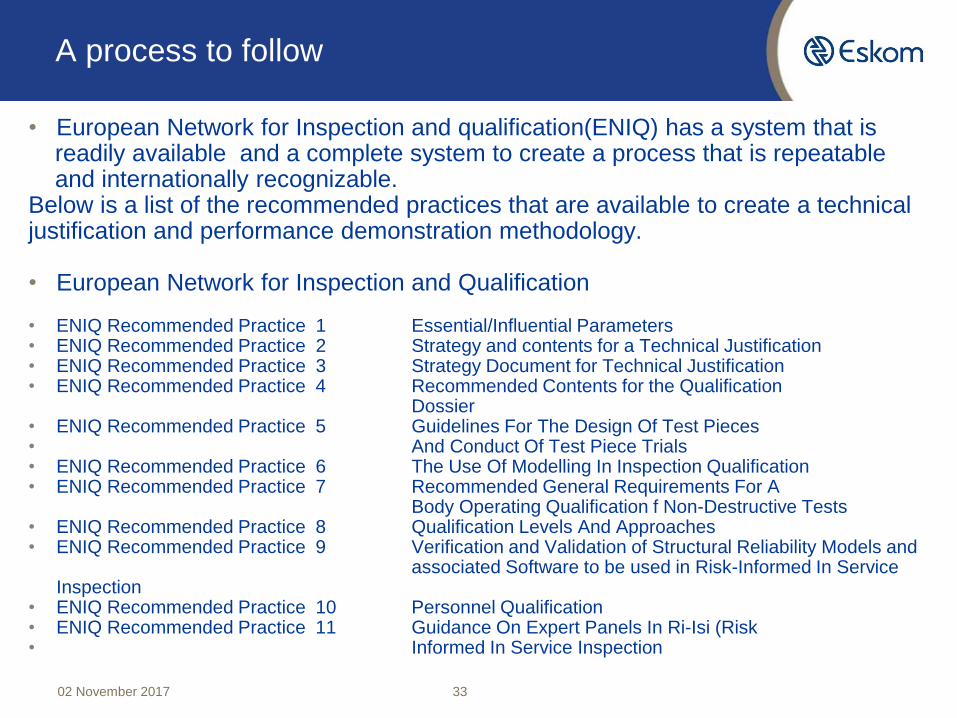
• European Network for Inspection and qualification(ENIQ) has a system that is readily available and a complete system to create a process that is repeatable and internationally recognizable.
Below is a list of the recommended practices that are available to create a technical justification and performance demonstration methodology.
• European Network for Inspection and Qualification
• ENIQ Recommended Practice 1 Essential/Influential Parameters• ENIQ Recommended Practice 2 Strategy and contents for a Technical Justification • ENIQ Recommended Practice 3 Strategy Document for Technical Justification• ENIQ Recommended Practice 4 Recommended Contents for the Qualification
Dossier• ENIQ Recommended Practice 5 Guidelines For The Design Of Test Pieces• And Conduct Of Test Piece Trials• ENIQ Recommended Practice 6 The Use Of Modelling In Inspection Qualification• ENIQ Recommended Practice 7 Recommended General Requirements For A
Body Operating Qualification f Non-Destructive Tests• ENIQ Recommended Practice 8 Qualification Levels And Approaches• ENIQ Recommended Practice 9 Verification and Validation of Structural Reliability Models and
associated Software to be used in Risk-Informed In Service Inspection
• ENIQ Recommended Practice 10 Personnel Qualification• ENIQ Recommended Practice 11 Guidance On Expert Panels In Ri-Isi (Risk • Informed In Service Inspection
A process to follow
02 November 2017 34
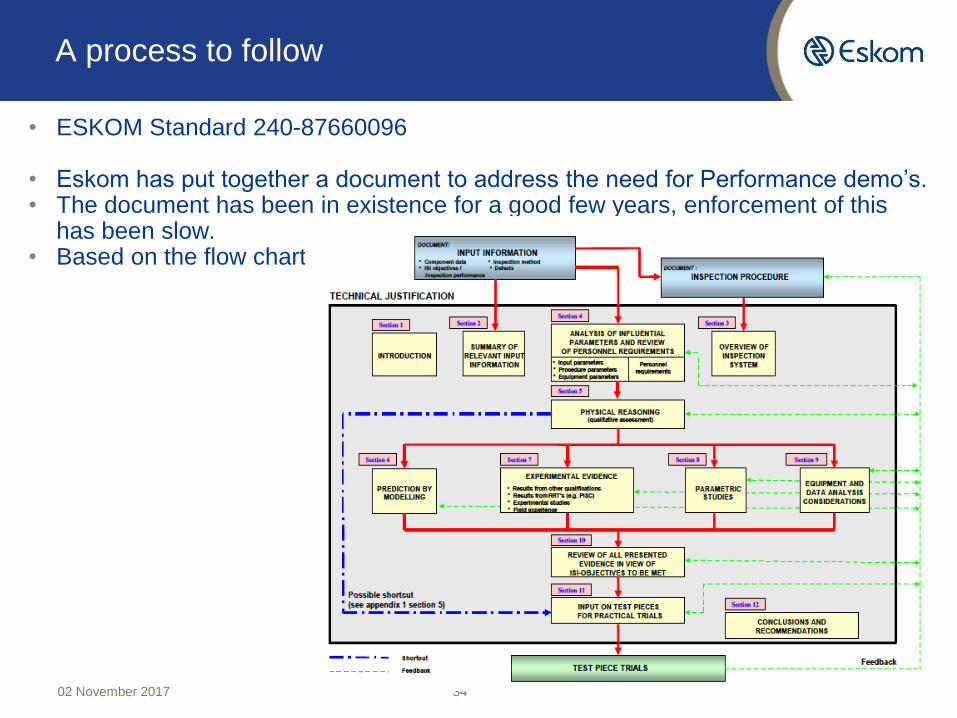
• ESKOM Standard 240-87660096
• Eskom has put together a document to address the need for Performance demo’s. • The document has been in existence for a good few years, enforcement of this
has been slow. • Based on the flow chart
A process to follow

02 November 2017 35
• ESKOM Standard 240-87660096• The basis for the application of the document follows these steps:-
Type 1 Qualification: Inspection Qualification 1. Type 1 Qualification is recommended for all Specified and Postulated Flaw Events
and when appropriate factors require the highest confidence in the performance of an NDT System.
2. Type 1 Qualification shall comprise of:• A Component Detail • A detailed Flaw Specification flaw mechanism, critical sizes, tilts skews etc.• An documented Inspection Objective.• A Technical Justification • Open trials to demonstrate equipment and procedure capability• Blind Trials to independently confirm the suitability of an NDT System.
Note: In some circumstances the need for a Blind Trial may be waived at the discretion of the IQB.
A process to follow

02 November 2017 36
• ESKOM Standard 240-87660096
Type 1 Qualification: Inspection Qualification
A process to follow

02 November 2017 37
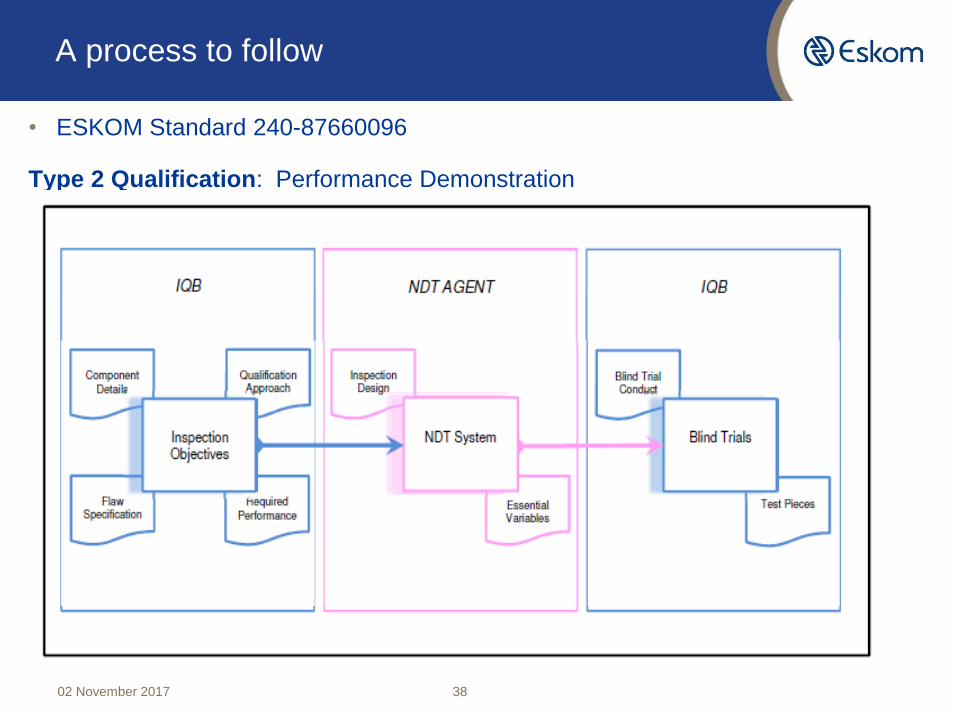
• ESKOM Standard 240-87660096
Type 2 Qualification: Performance Demonstration
1. Type 2 Qualification is recommended for Specified, Postulated and Unspecified Flaw Events and when sufficient confidence in the performance of an NDT System can be gained from practical trials alone.
Note: In Type 2 Qualification, analysis of the individual elements of an NDT System, i.e. equipment, procedure or personnel is not required.
2. Type 1 Qualification shall comprise of:• A Component Detail • A detailed Flaw Specification flaw mechanism, critical sizes, tilts skews etc.• An documented Inspection Objective.• A Technical Justification • Open trials to demonstrate equipment and procedure capability• Blind Trials to independently confirm the suitability of an NDT System.
A process to follow
02 November 2017 38
• ESKOM Standard 240-87660096
Type 2 Qualification: Performance Demonstration
A process to follow

02 November 2017 39
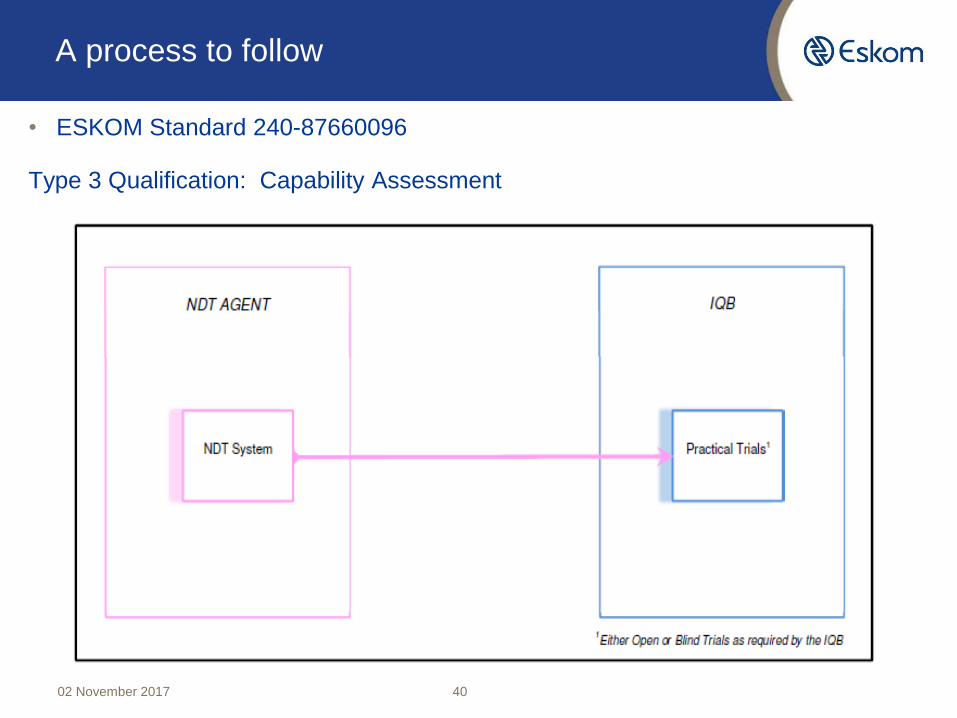
• ESKOM Standard 240-87660096
Type 3 Qualification: Capability Assessment
1. Type 3 Qualification is only appropriate in cases where an inspection has already been performed and the NDT System used for the inspection requires a retrospective assessment.
2. Type 3 Qualification shall comprise of:• The assembly of the exact NDT System of interest.• Practical trials• The IQB shall decide whether the practical trials are either Open or Blind Trials or both.
3. Type 3 Qualification does not make use of a predefined performance criterion.
Qualification Rigour Practical Trials1. Within any one qualification approach the degree of rigour shall be established by
the IQB.2. The degree of rigour shall be established on a case-by-case basis.
A process to follow
02 November 2017 40
• ESKOM Standard 240-87660096
Type 3 Qualification: Capability Assessment
A process to follow
02 November 2017 41
• ESKOM Standard 240-87660096
• Qualification Rigour R1
• Practical trials conducted on test-pieces of actual plant damaged.• Test-pieces represent the real situation with regard to material, form, with permissible
geometries.• ‘Worst-case’ flaws for detection and sizing identified from the Inspection Objective and
represented in test-pieces.• The number of flaws and the number of flawed to unflawed test-pieces sufficient to
assess system performance limits.• Flaws in test-pieces shall be natural flaws in materials extracted from operating plant,
or shall be realistic flaws which simulate the characteristics of the sought flaws, e.g. implanted cracks etc.
• The results from a Blind Trial encompass the identified variables to show that an NDT System capabilities in all extremes.
• Note: Using the concept of ‘worst-case’ may allow for the relaxing of that practical trials. This because subjecting an NDT System to the most severe inspection conditions with acceptable results shows the system would not alter under other more favorable conditions.
A process to follow

02 November 2017 42
• ESKOM Standard 240-87660096
• Qualification Rigour R2
• Test-pieces, either extracted from site or fabricated, shall fully represent the real situation.
• The number of flaws and the number of flawed to unflawed test-pieces shall be in numbers great enough to demonstrate statistical significance. The IQB shall determine the level of statistical significance needed; for example, a 90% probability of detection with a 95% confidence level.
• Flaws in test-pieces shall be natural flaws in materials extracted from operating plant, or shall be realistic flaws which simulate the characteristics of the sought flaws, e.g. implanted cracks etc.
A process to follow
02 November 2017 43
• ESKOM Standard 240-87660096
• Qualification Rigour R3
• Test-pieces, either extracted from site or fabricated, shall represent the real situation.
• The number of flaws shall be in numbers great enough to assess the general capabilities of an NDT System.
• Flaws in test-pieces may be natural flaws, realistic flaws or artificial flaws which simulate, to the degree necessary, the characteristics of the sought flaws.
Qualification Type, Flaw Event and Qualification Rigour• The IQB shall set the Qualification Type and Qualification Rigour after
considering all relevant factors and the nature of the flaw event.
A process to follow

02 November 2017 44
• Conclusions
• It is imperative that systems for NDT become qualified. Levels of qualification applied are different.
• As an NDT technician, I recall times performing inspections that I would only feel comfortable when I found a “crack”. Did I have little confidence in:-
• The operator (me)• The equipment • The procedure applied
• And what if I never found anything? (No defects at time of test?)
A final Word

02 November 2017 45
• Conclusions
• Documented quality records stand as proof of the daily qualification in the form of quality control checks. The tables below show for MT, the operations required for these qualification steps on a daily basis.
• There are however systems that are critical to operation as well as pose safety risks to personnel that do require additional input into the capability of the system to achieve the desired results from the inspection and certainly from this power utilities perspective, the requirements to perform more in-depth qualification processes is staring to take effect.
A final Word

02 November 2017 46
• References
[1]ASME V 2015 Boiler pressure vessel code Article 1 General RequirementsArticle 14 Examination System Qualification.
[2]ASTM E1444 Standard Practice For Magnetic Particle Testing[3]ASTM E1417 Standard Practice For Liquid Penetrant Testing[4]ASTM E1742 Standard Practice For Radiographic Testing[5] Ulf SCHNARS, Andreas KÜCK, Airbus, Bremen, Germany :- Application of POD
analysis at Airbus [6] Quantitative Non Destructive Evaluation ASM Metals handbook Vol. 17[7] C Millar et al; EPRI institute Palo Alto CA:- Nondestructive Evaluation: A Review
of NDE Performance Demonstrations—NDE Round Robin Report[8] Directorate General:- Joint research Centre ENIQ Written Practices[9] G Wilson; et al Eskom Standard 240-87660096 Non-Destructive Testing Inspection Qualification Standard
A final Word
Thank you for your attention!
Questions?