the nature of social reproductionnielsen/soci850/odocs/usc_10_1.pdf · quick intellectual...
TRANSCRIPT
The Nature of Social ReproductionGenes and Environments in Socioeconomic Success1
François Nielsen
Department of SociologyUniversity of North Carolina
Chapel Hill
12010 Mayhew Lecture, Department of Sociology, University of SouthCarolina, 13 April 2010
1 /45

Quick Intellectual Autobiography
É As an undergraduate at University of BrusselsI wrote a thesis on Vilfredo Pareto
É I was intrigued by Pareto’s discovery that thedistribution of income obeyed a power law(“Pareto distribution”)
É Distributions of income of different societieslook like crystals formed from the samechemical substance:É there are large ones and small ones, but
they all have the same shape
É Regularity of shape suggests deep, unseenmechanisms generating the distribution ofincome (and more generally the socialstructure) in all societies, even thoughquantitative parameters may vary
2 /45
Quick Intellectual Autobiography
É I also became enthralled by Desmond Morris’ (1967) TheNaked Ape (proto-sociobiology) and the potential ofevolutionary thinking to explain social behavior
É In graduate school at Stanford I was RA for Michael T.Hannan (“organizational ecology”) who was working with thelate John Freeman on applying population ecology models toorganizations
É Against this background Edward O. Wilson’s (1975)Sociobiology was a revelation
É Much later I acquired some training in behavior genetics
3 /45

Quick Intellectual Autobiography
É In the wake of my dissertation on the Flemish movement inBelgium I did work in the area of social movements and theresurgence of ethnicity in contemporary societies
É I later came back to the area of social stratification andmobility, with a specific focus on income inequality, doingempirical research on variation in income inequality acrossnations (e.g., Alderson and Nielsen 2002) and across UScounties (e.g., Moller, Alderson, and Nielsen 2009), andinequality in general across cultures (e.g., Nielsen 2004)within an ecological-evolutionary framework inspired by myemeritus colleague Gerhard Lenski
É More recently I have begun looking at the roles of genes andenvironments in educational and socioeconomic success usingdata from the AddHealth project at UNC, of which I will saymore today
4 /45
Paths to Success
In studying social stratification and social mobility it is easy to slipinto an impoverished view of what constitutes success in life.
To illustrate the variety of individual careers it is useful to look atsome examples of how “real people” have achieved socio-economicsuccess. I am using a broad definition of “socioeconomic success”,as consisting of some mixture of occupational and financialsuccess.
5 /45
Paths to Success
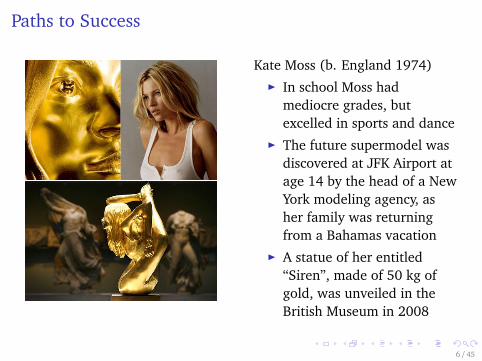
Kate Moss (b. England 1974)É In school Moss had
mediocre grades, butexcelled in sports and dance
É The future supermodel wasdiscovered at JFK Airport atage 14 by the head of a NewYork modeling agency, asher family was returningfrom a Bahamas vacation
É A statue of her entitled“Siren”, made of 50 kg ofgold, was unveiled in theBritish Museum in 2008
6 /45
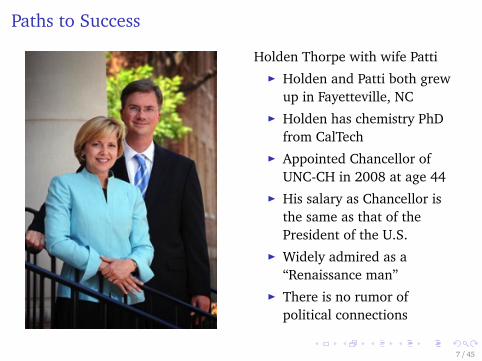
Paths to Success
Holden Thorpe with wife PattiÉ Holden and Patti both grew
up in Fayetteville, NCÉ Holden has chemistry PhD
from CalTechÉ Appointed Chancellor of
UNC-CH in 2008 at age 44É His salary as Chancellor is
the same as that of thePresident of the U.S.
É Widely admired as a“Renaissance man”
É There is no rumor ofpolitical connections
7 /45

Paths to Success
Tony Hillerman 1925–2008É Decorated WWII veteranÉ Degree in Journalism
through GI BillÉ Writes novels involving Joe
Leaphorn and Jim Chee ofthe Navajo tribal police
É Influenced by Australianwriter Arthur W. Upfield(1890–1964) whoseprincipal character was ahalf-Aboriginal detective
8 /45

Paths to Success
Francis R. with wife Paulette (Belgium)É Francis is an economist, retired
civil servant, lay Baptist ministerÉ F. and P. have a side business in
stamps and rare documentsÉ Francis is Co-Chair of Protestant
Synod, an official organizationÉ F. and P. are invited to the King’s
New Year’s partyÉ Francis is in the line of succession
as head of the Belgian government(admittedly way down)
É F. had to trade in his old car for a(used) black Peugeot 406; he has agovernment license plate
9 /45
Paths to Success
Can we attribute any part of individual success to genes versusenvironment?É Kate Moss’s beauty and grace?É Holden Thorpe’s intellectual and artistic gifts?É Tony Hillerman’s valor, imagination and talent?É Francis R.’s spirituality and wisdom?
The role of formal education in the success of each varies.
Thorpe has the most standardized / predictable career. The careersof others are somewhat less typical.
10 /45

Paths to Success
Socio-economic success can be measured in a variety of ways.É Scores on IQ and other cognitive tests (e.g., SAT, GRE)É School success (grades, class rank)É Educational attainment (highest degree earned or years of
education)É College quality or prestige (e.g., entering cohort SAT)É Employment status (employed vs. unemployed)É “Goodness” of occupation (SEI or prestige)É Financial success (earnings, income, poverty status, assets)É Political influence (“clout”)É Miscellaneous measures: number of publications, citations
count, nominations to learned societies, being pursued bypaparazzi, having a 50 kg gold statue of oneself in the BritishMuseum . . .
11 /45
Paths to SuccessMeasures and precursors of success differ in several ways.É Normal vs. right-skewed distribution:
É Measures of ability or cognitive achievement are typicallynormally distributed, only partly so by design.
É Income, wealth, number of publications by scholars, tend tohave a skewed distribution, with a long tail toward highvalues, because of autocatalytic processes (“rich gets richer”).
É The degree to which a dimension of success can be directlymanipulated by third parties, such as parents, varies:É IQ test, not much.É Quality of college or election to public office, much more.
É Diversity of pathways to success varies according to thenature of the underlying qualitites:É Success through education is highly standardized (e.g., Holden
Thorpe).É Pathways to financial success are potentially more diverse and
idiosyncratic (e.g., Tony Hillerman vs. Kate Moss)
12 /45
Paradigm I: Status Achievement
Blau and Duncan’s (1967) status achievement model is a highlyinfluential attempt to formalize a standardized type of path tosuccess through education.
In the status achievement model measured characteristics of thefamily (father’s occupational prestige and education) andintermediate measures of success (such as IQ and education) arearranged in a chronological causal chain so that earlierachievements predict later achievements (such as prestige of firstjob and current job).
The nature of the causal impact of family on respondent is seen asenvironmental at least in part (through role modeling and familyresources and networks), although a possible role of genes isrecognized (Duncan, Featherman and Duncan 1972).
13 /45

Paradigm I: Status AchievementExample of Status Achievement Model
Table: Correlations for Path Model of Next Slide
F’s Occ F’s Ed R’s Sex R’s IQ R’s Ed R’s Occ
F’s Occ 1.000F’s Ed 0.476 1.000R’s Sex −0.038 −0.040 1.000R’s IQ 0.177 0.293 0.014 1.000R’s Ed 0.273 0.474 −0.108 0.522 1.000R’s Occ 0.192 0.292 −0.043 0.379 0.556 1.000
SOURCE: GSS 1989. Variables (GSS variable name): F’s Occ (PAPRES16),
Father’s occupation (prestige score) ; F’s Ed (PAEDUC), Father’s education in
years; R’s Sex (SEX), Respondent’s sex [1 = male, 2 = female]; R’s IQ
(WORDSUM), Respondent’s score on a 10 item vocabulary test; R’s Ed (EDUC),
Respondent’s education in years; R’s Occ (PRESTIGE), Respondent’s occupation
(prestige score).14 /45

Paradigm I: Status AchievementExample of Status Achievement Model
Figure: Path Model of Socioeconomic Success. See previous slide fordetails.
15 /45
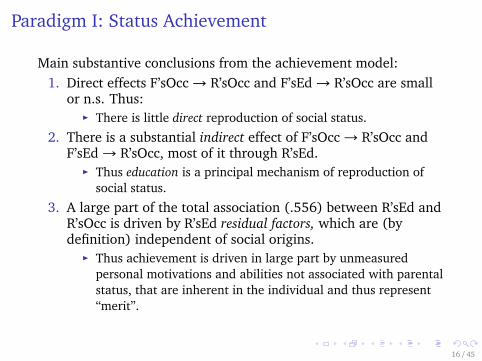
Paradigm I: Status Achievement
Main substantive conclusions from the achievement model:1. Direct effects F’sOcc→ R’sOcc and F’sEd→ R’sOcc are small
or n.s. Thus:É There is little direct reproduction of social status.
2. There is a substantial indirect effect of F’sOcc→ R’sOcc andF’sEd→ R’sOcc, most of it through R’sEd.É Thus education is a principal mechanism of reproduction of
social status.
3. A large part of the total association (.556) between R’sEd andR’sOcc is driven by R’sEd residual factors, which are (bydefinition) independent of social origins.É Thus achievement is driven in large part by unmeasured
personal motivations and abilities not associated with parentalstatus, that are inherent in the individual and thus represent“merit”.
16 /45

Paradigm I: Status Achievement
The status achievement model was inspiring, developing intomodernization theory:
1. With modernization (economic development) the effect ofeducation on success should increase
2. With modernization the association of success with familybackground (measured as parental SES) should decrease
3. Thus in comparing societies at different levels of developmentone should find that in the more developed society:É Effect of education on success is strongerÉ Effect of family background is weaker
BUT: . . . an extensive review of the literature fails to verify thesepredictions (Breen and Jonsson 2005). The actual empiricalpatterns are erratic. Hout and DiPrete (2006) go so far as sayingmodernization theory is wrong!
17 /45

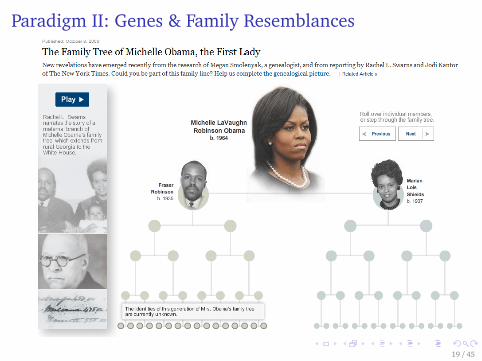
Paradigm II: Genes & Family Resemblances
We routinely assume that genes play a role in family physicalresemblance and the intergenerational transmission of physicalappearance, including how beautiful / attractive a person is.
If genes play a role in Kate Moss’s appearance, and if herappearance affected her success, what role do genes play, if any, inthe development of other traits that may affect success?
I will argue that unaccounted effects of genes on socioeconomicsuccess may explain the anomalies of achievement research.
Let’s look at some examples of “family resemblance”.
18 /45
Paradigm II: Genes & Family Resemblances
19 /45

Paradigm II: Genes & Family Resemblances
20 /45

Paradigm II: Genes & Family Resemblances
Paul Samuelson
Robert Summers (née Arrow)Kenneth Arrow
Lawrence Summers and relatives:É Paul Samuelson (uncle)É Robert Summers (father)É Anita A. Summers (mother)É Kenneth Arrow (uncle)
21 /45
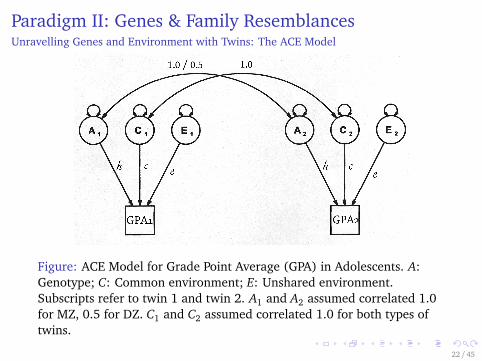
Paradigm II: Genes & Family ResemblancesUnravelling Genes and Environment with Twins: The ACE Model
Figure: ACE Model for Grade Point Average (GPA) in Adolescents. A:Genotype; C: Common environment; E: Unshared environment.Subscripts refer to twin 1 and twin 2. A1 and A2 assumed correlated 1.0for MZ, 0.5 for DZ. C1 and C2 assumed correlated 1.0 for both types oftwins.
22 /45
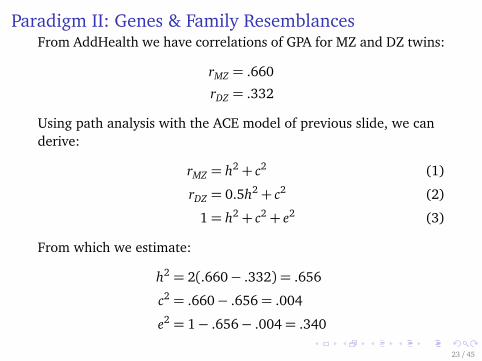
Paradigm II: Genes & Family ResemblancesFrom AddHealth we have correlations of GPA for MZ and DZ twins:
rMZ = .660
rDZ = .332
Using path analysis with the ACE model of previous slide, we canderive:
rMZ = h2+ c2 (1)
rDZ = 0.5h2+ c2 (2)
1= h2+ c2+ e2 (3)
From which we estimate:
h2 = 2(.660− .332) = .656
c2 = .660− .656= .004
e2 = 1− .656− .004= .340
23 /45

Paradigm II: Genes & Family ResemblancesÉ Heritability h2 is the proportion of the variance of a trait that
is contributed by the genotypeÉ thus for GPA h2 = .656 means that 66% of variation in GPA is
due to genesÉ The shared environment c2 represents the effects of all
characteristics of the family environment that tend to makethe GPA of siblings similar; it includes effects of social classand all other environmental factors that vary betweenfamilies, such as ethnicityÉ but here c2 = .004 means the shared environment is essentially
zeroÉ The unshared environment e2 represents the effects of all
environmental factors that tend to make siblings differentfrom each other, such as a disease or an inspiring teacherexperienced by one sibling but not the other, includingmeasurement errorÉ here e2 = .340 so 34% of the variance in GPA is due to the
unshared environment
24 /45
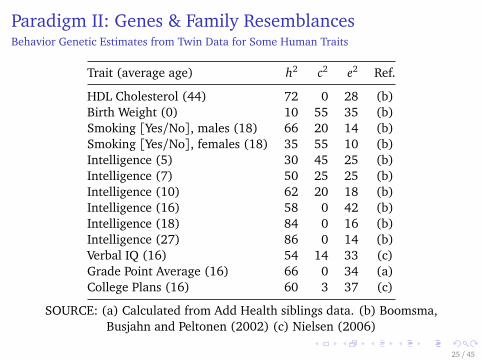
Paradigm II: Genes & Family ResemblancesBehavior Genetic Estimates from Twin Data for Some Human Traits
Trait (average age) h2 c2 e2 Ref.
HDL Cholesterol (44) 72 0 28 (b)Birth Weight (0) 10 55 35 (b)Smoking [Yes/No], males (18) 66 20 14 (b)Smoking [Yes/No], females (18) 35 55 10 (b)Intelligence (5) 30 45 25 (b)Intelligence (7) 50 25 25 (b)Intelligence (10) 62 20 18 (b)Intelligence (16) 58 0 42 (b)Intelligence (18) 84 0 16 (b)Intelligence (27) 86 0 14 (b)Verbal IQ (16) 54 14 33 (c)Grade Point Average (16) 66 0 34 (a)College Plans (16) 60 3 37 (c)
SOURCE: (a) Calculated from Add Health siblings data. (b) Boomsma,Busjahn and Peltonen (2002) (c) Nielsen (2006)
25 /45
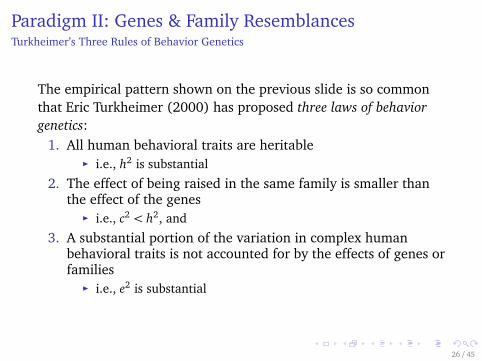
Paradigm II: Genes & Family ResemblancesTurkheimer’s Three Rules of Behavior Genetics
The empirical pattern shown on the previous slide is so commonthat Eric Turkheimer (2000) has proposed three laws of behaviorgenetics:
1. All human behavioral traits are heritableÉ i.e., h2 is substantial
2. The effect of being raised in the same family is smaller thanthe effect of the genesÉ i.e., c2 < h2, and
3. A substantial portion of the variation in complex humanbehavioral traits is not accounted for by the effects of genes orfamiliesÉ i.e., e2 is substantial
26 /45

Combining the Paradigms
Paradigms I and II may seem like different approaches but they arenot, as the two models involve common parameters. Specificallyconsider a simplified model of achievement involving only theeffect of father’s education on child’s education. Then thestructural equations are:
rFC = 0.5h2+ c′2 (4)
1= h2+ c′2+ e′2 (5)
where rFC denotes father-child correlation, h2 denotes heritabilityas before, and c′2 denotes the effect on child’s education of theenvironment shared by the father and the child.
Note that the same degree of intergenerational association(measured by rFC) may correspond to different shares of genetic andenvironmental influences.
27 /45
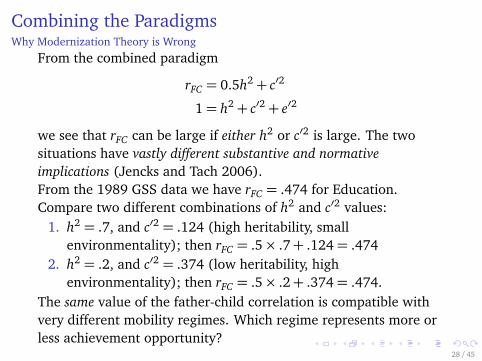
Combining the ParadigmsWhy Modernization Theory is Wrong
From the combined paradigm
rFC = 0.5h2+ c′2
1= h2+ c′2+ e′2
we see that rFC can be large if either h2 or c′2 is large. The twosituations have vastly different substantive and normativeimplications (Jencks and Tach 2006).From the 1989 GSS data we have rFC = .474 for Education.Compare two different combinations of h2 and c′2 values:
1. h2 = .7, and c′2 = .124 (high heritability, smallenvironmentality); then rFC = .5× .7+ .124= .474
2. h2 = .2, and c′2 = .374 (low heritability, highenvironmentality); then rFC = .5× .2+ .374= .474.
The same value of the father-child correlation is compatible withvery different mobility regimes. Which regime represents more orless achievement opportunity?
28 /45
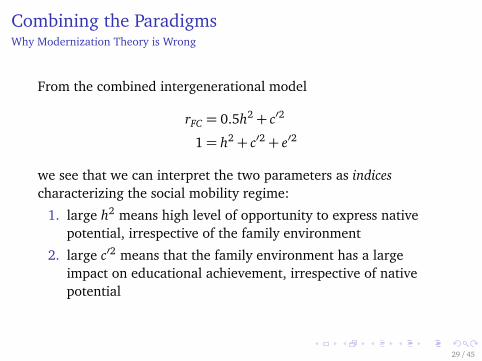
Combining the ParadigmsWhy Modernization Theory is Wrong
From the combined intergenerational model
rFC = 0.5h2+ c′2
1= h2+ c′2+ e′2
we see that we can interpret the two parameters as indicescharacterizing the social mobility regime:
1. large h2 means high level of opportunity to express nativepotential, irrespective of the family environment
2. large c′2 means that the family environment has a largeimpact on educational achievement, irrespective of nativepotential
29 /45

Combining the ParadigmsWhy Modernization Theory is Wrong
Consider again the combined intergenerational model
rFC = 0.5h2+ c′2
1= h2+ c′2+ e′2
What happens in the course of economic development(modernization)?
1. Stratification system becomes more meritocratic→ h2
increases
2. Class privileges are reduced→ c′2 decreasee
If both trends take place at about the same rate, rFC stays the same.Modernization theorists (and institutional theorists) are puzzled,as they see no pattern of change in rFC (Breen and Jonsson 2005).
But: We can test the predictions of modernization theory byestimating h2 and c2 directly.
30 /45
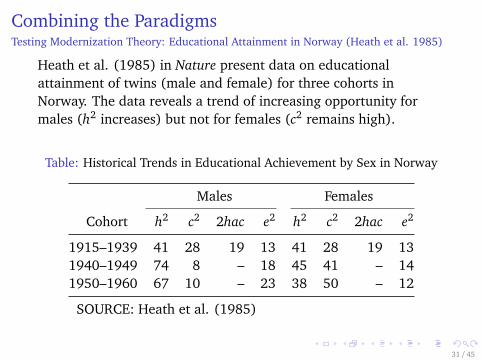
Combining the ParadigmsTesting Modernization Theory: Educational Attainment in Norway (Heath et al. 1985)
Heath et al. (1985) in Nature present data on educationalattainment of twins (male and female) for three cohorts inNorway. The data reveals a trend of increasing opportunity formales (h2 increases) but not for females (c2 remains high).
Table: Historical Trends in Educational Achievement by Sex in Norway
Males Females
Cohort h2 c2 2hac e2 h2 c2 2hac e2
1915–1939 41 28 19 13 41 28 19 131940–1949 74 8 – 18 45 41 – 141950–1960 67 10 – 23 38 50 – 12
SOURCE: Heath et al. (1985)
31 /45
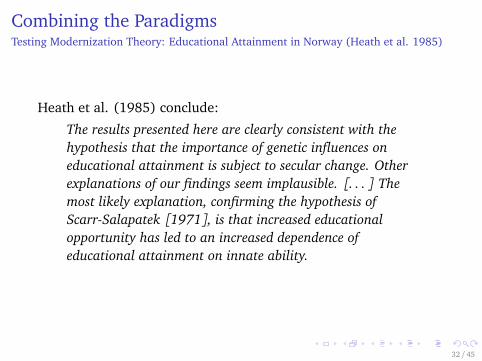
Combining the ParadigmsTesting Modernization Theory: Educational Attainment in Norway (Heath et al. 1985)
Heath et al. (1985) conclude:
The results presented here are clearly consistent with thehypothesis that the importance of genetic influences oneducational attainment is subject to secular change. Otherexplanations of our findings seem implausible. [. . . ] Themost likely explanation, confirming the hypothesis ofScarr-Salapatek [1971], is that increased educationalopportunity has led to an increased dependence ofeducational attainment on innate ability.
32 /45

Combining the ParadigmsG × E Interactions
The general class of patterns such as the ones found by Heath et al.(1985) is called genes by environment interactions (G × E).É G × E is the moderation of the effect of genes (measured as
h2) as a function of environmental factors, such as:É Environmental resources (low-SES vs. high-SES)É Educational opportunityÉ Exposure to discrimination
G × E interactions are potentially of great interest for sociologists,as we are often interested in effects of the social environment.
We can assemble various classical threads of sociological thoughtinto varied hypotheses concerning G × E, which can then be testedwith genetically informative data, such as data on twins.
33 /45
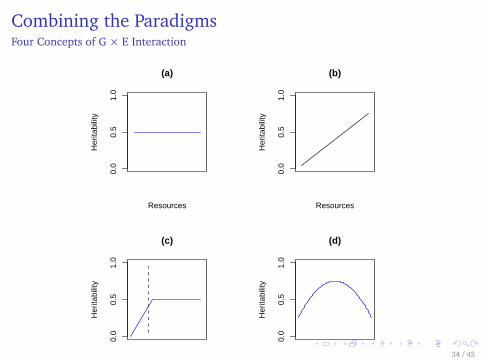
Combining the ParadigmsFour Concepts of G × E Interaction
(a)
Resources
Her
itabi
lity
0.0
0.5
1.0
(b)
Resources
Her
itabi
lity
0.0
0.5
1.0
(c)
Resources
Her
itabi
lity
0.0
0.5
1.0
(d)
Resources
Her
itabi
lity
0.0
0.5
1.0
Figure: Four concepts of the interaction of genes with environmentalresources in socio-economic success. The figures show heritability (h2) ofsocioeconomic success as a function of environmental resources. (a) NoG × E interaction. (b) Environmental resources have a linear effect ongene expression (h2) (Scarr-Salapatek 1971; Heath et al. 1985); (c)Tapering effect of environmental resources on h2 within the “humanerange” above the threshold of severe deprivation (dashed line); (d)Curvilinear effect of environmental resources on h2 with maximum effectin middle range (Pareto 1909).
34 /45
Combining the ParadigmsFour Concepts of G × E Interaction
The previous slide illustrated four concepts of the way heritability(h2) of socioeconomic success varies as a function ofenvironmental resources:
1. No G × E interaction (default ACE model in the absence ofenvironmental measure).
2. Environmental resources have a linear effect on geneexpression (h2) (Scarr-Salapatek 1971; Heath et al. 1985).
3. Tapering effect of environmental resources on h2 within the“humane range” above the threshold of severe deprivation(dashed line)
4. Curvilinear effect of environmental resources on h2 withmaximum effect in middle range (Pareto 1909 and next slide).
35 /45
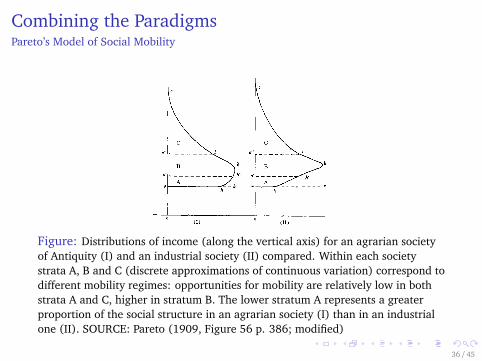
Combining the ParadigmsPareto’s Model of Social Mobility
Figure: Distributions of income (along the vertical axis) for an agrarian societyof Antiquity (I) and an industrial society (II) compared. Within each societystrata A, B and C (discrete approximations of continuous variation) correspond todifferent mobility regimes: opportunities for mobility are relatively low in bothstrata A and C, higher in stratum B. The lower stratum A represents a greaterproportion of the social structure in an agrarian society (I) than in an industrialone (II). SOURCE: Pareto (1909, Figure 56 p. 386; modified)
36 /45
Combining the ParadigmsPareto’s Model of Social Mobility
Pareto reasons that the degree to which native talents affects socialmobility of individuals depends on their initial position in thesocial structure:
1. In the lowest stratum A even a talented individual will beunable to rise because of the impoverished environment.
2. In the middle stratum B resources are sufficient to allowtalented individuals to rise, but not sufficient to prevent lesstalented individuals to move downwards; individuals borninto the middle stratum will thus experience maximalmobility, up and down.
3. In the highest stratum C resources are sufficiently abundant toprotect less talented individuals from downward mobility.
Pareto’s model implies an inverted U-shaped relationship betweenenvironmental resources and h2.
37 /45
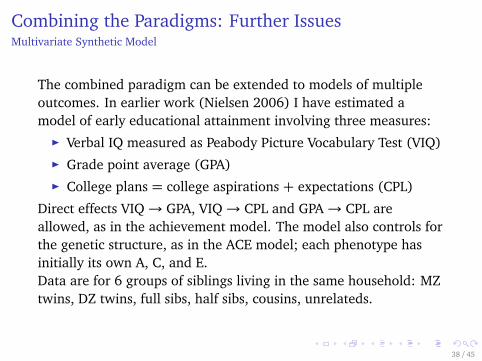
Combining the Paradigms: Further IssuesMultivariate Synthetic Model
The combined paradigm can be extended to models of multipleoutcomes. In earlier work (Nielsen 2006) I have estimated amodel of early educational attainment involving three measures:É Verbal IQ measured as Peabody Picture Vocabulary Test (VIQ)É Grade point average (GPA)É College plans = college aspirations + expectations (CPL)
Direct effects VIQ→ GPA, VIQ→ CPL and GPA→ CPL areallowed, as in the achievement model. The model also controls forthe genetic structure, as in the ACE model; each phenotype hasinitially its own A, C, and E.Data are for 6 groups of siblings living in the same household: MZtwins, DZ twins, full sibs, half sibs, cousins, unrelateds.
38 /45

Combining the Paradigms: Further IssuesGenetic Architecture of Early Educational Achievement: VIQ (Verbal Ability), GPA (GradePoint Average) and CPL (College Plans). k= 1 for MZ twins, k= .5 for DZ twins and fullsiblings, k= .25 for half siblings, k= .125 for cousins, and k= 0 for unrelated siblings
.57
.57
.61
.73
.82
.37
--.04
.17
.77
.26
.43.55
39 /45

Combining the Paradigms: Further IssuesMultivariate Synthetic Model
The initial model is “pruned” by imposing constraints (such as:VIQ, GPA, and CPL share the same set of shared familyenvironmental influences) and testing them using chi-squaredtests. The resulting preferred model reveals the “geneticarchitecture” of early educational achievement:É All three measure are substantially heritableÉ Direct effects of the measures on each other vanish when the
ACE structure is includedÉ Shared environmental influences can be reduced to a single C
factor affecting all three measuresÉ The unshared environmental factors of the three measures are
independent of each other (behaving like measurement errorrather than systematic advantage, e.g. due to parentalpreference)
É Genetic factors of the three measures are only moderatelycorrelated (i.e., overlapping)
40 /45
Conclusion
I have proposed that a synthetic model combining the statusachievement model in the tradition of Blau and Duncan (1967)with the behavior genetic model originally proposed by Fisher(1918) can potentially elucidate anomalies in social stratificationand comparative social mobility research.É Theoretical predictions about secular trends or cross-societal
differences in mobility regimes can be properly tested bymeasuring h2 and c2 and specifying the predictions aspatterns of G × E interactions.É Modernization theory might be true after all . . .
É The synthetic model generates a perspective in whichindividuals endowed with a specific set of genes and raised ina specific family environment encounter a succession of lifeexperiences in which their resulting makeup is “tested” (goingthough school, taking tests, going to college, etc.) (Rowe1994)
41 /45
References I
Alderson, Arthur S. and François Nielsen. 2002. “Globalization and theGreat U-Turn: Income Inequality Trends in 16 OECD Countries.” AmericanJournal of Sociology 107:1244–1299.
Blau, Peter M. and Otis Dudley Duncan. 1967. The American OccupationalStructure. New York: Wiley.
Boomsma, Dorret, Andreas Busjahn and Leena Peltonen. 2002. “ClassicalTwin Studies and Beyond.” Nature Reviews Genetics 3: 11 (November):872–882.
Breen, Richard and Jan Jonsson. 2005. “Inequality of Opportunity inComparative Perspective: Recent Research on Educational Attainment andSocial Mobility.” Annual Review of Sociology 31: 223–243.
Duncan, Otis Dudley, David L. Featherman, and Beverly Duncan. 1972.Socioeconomic Background and Achievement. New York: Seminar Press.
Fisher, Ronald A. 1918. “The Correlation Between Relatives on theSupposition of Mendelian Inheritance.” Transactions of the Royal SocietyEdimburgh 52, Part 2: 399–433.
42 /45
References II
Freese, Jeremy. 2008. “Genetics and the Social Science Explanation ofIndividual Outcomes.” American Journal of Sociology 114 Suplement:S1–S35.
Heath, A. C., K. Berg, L. J. Eaves, M. H. Solaas, L. A. Corey, J. Sundet, P.Magnus, and W. E. Nance. 1985. “Education Policy and the Heritability ofEducational Attainment.” Nature 314 (25 April): 734–736.
Hout, Michael and Thomas A. DiPrete. 2006. “What We Have Learned:RC28’s Contributions to Knowledge about Social Stratification.” Research inSocial Stratification and Mobility 24: 1–20.
Jencks, Christopher and Laura Tach. 2006. “Would Equal Opportunity MeanMore Mobility?” Pp. 23–58 in Mobility and Inequality: Frontiers of Researchfrom Sociology and Economics, edited by Stephen Morgan, David Grusky andGary Fields. Stanford, CA: Stanford University Press.
Moller, Stephanie, Arthur S. Alderson, and François Nielsen. 2009.“Changing Patterns of Income Inequality in U.S. Counties, 1970–2000.”American Journal of Sociology 114: 4 (January): 1037–1101.
43 /45
References III
Nielsen, François. 2004a. “The Ecological-Evolutionary Typology of HumanSocieties and the Evolution of Social Inequality.” In Essays in Honor ofGerhard Lenski [special issue], edited by Bernice McNair Barnett.Sociological Theory 22:292–314.
Nielsen, François. 2006. “Achievement and Ascription in EducationalAttainment: Genetic and Environmental Influences on AdolescentSchooling.” In The Linking of Sociology and Biology [special section], editedby Guang Guo. Social Forces 85: 1 (September): 193–216.
Nielsen, François. 2008. “The Nature of Social Reproduction: TwoParadigms of Social Mobility.” Symposium / Social Sciences and NaturalSciences – What Connection?, edited by Mario Lucchini and Maurizio Pisati.Sociologica Nr 3 / 2008 (November): Pp. 1–35. [Online athttp://www.sociologica.mulino.it/.]
Pareto, Vilfredo. 1909. Manuel d’économie politique. [Manual of PoliticalEconomy.] Paris: Giard et Brière.
Rowe, David C. 1994. The Limits of Family Influence: Genes, Experience, andBehavior. New York: Guilford.
44 /45

References IV
Scarr-Salapatek, Sandra. 1971. “Unknowns in the IQ Equation.” Science 174:1223–1228.
Solon, Gary. 2008. “Intergenerational Income Mobility.” Pp. 481–485 inClass, Race, and Gender in Sociological Perspective(3e), edited by David B.Grusky. Westview Press.
Turkheimer, Eric. 2000. “Three Laws of Behavior Genetics and What TheyMean.” Current Directions in Psychological Science 5: 160–164.
45 /45