the nature of costs chapter two copyright © 2014 by the mcgraw-hill companies, inc. all rights...
TRANSCRIPT

The Nature of Costs
Chapter Two
Copyright © 2014 by The McGraw-Hill Companies, Inc. All rights reserved.McGraw-Hill/Irwin

Opportunity Costs - Defined
Opportunity set: Set of alternative actions available to decision maker
Opportunity cost: Benefits forgone by choosing one alternative from the opportunity set rather than the best non-selected alternative
ExampleOpportunity Set = {A, B, C}Alternative Benefits Opportunity Cost A $108,000 $107,000 = Alternative B B $107,000 $108,000 = Alternative A C $106,500 $108,000 = Alternative A
2-2-22

Opportunity Costs - CharacteristicsOpportunity costs: include tangible and intangible benefits measured in cash equivalents rely on estimates of future benefits useful for decision making
Accounting expenses: costs consumed to generate revenues rely on historical costs of resources actually
expended designed to match expenses to revenues useful for control
See opportunity cost examples
2-2-33

Sunk Costs and Opportunity Costs
Sunk Costs: Costs which were incurred in the past and cannot be changed no matter what future action is taken.
Sunk costs are totally irrelevant for decision making and are excluded from opportunity costs.
Sunk costs might be useful for control purposes.
2-2-44

Relevant Costs and Opportunity Costs Often the term “relevant cost” described as
“expected future costs that will differ under alternatives.”
Opportunity costs is a well-defined, fundamental concept in economics that encompasses “relevant cost.”
Thus only “opportunity cost” will be used in the text.
2-2-55

The Costs of SOX – the Sarbanes-Oxley Act of 2002 The Public Company Accounting Reform and
Investor Protection Act Direct costs of compliance expected to grow
to $8 billion in 2005 Other costs include
Increases as large as 50% in director’s fees and premiums for directors and officer insurance policies
Innovative projects are being abandoned due to risk and/or delayed due to time spent on compliance
2-2-66

Cost Variation – DefinitionsFixed Costs: Costs incurred when there is no production. A fixed cost is not an opportunity cost of the decision to change the level of output. (On a cost graph, the fixed costs are the total costs when production is zero.)
Marginal cost: Opportunity cost of producing one more unit, or the opportunity cost of producing the last unit. (On a cost curve graph, the marginal cost is the slope of the tangent at one particular production level.)
Average cost: Total opportunity costs divided by number of units produced. (On a cost curve graph, the average cost is the slope of the line drawn from the origin to total cost for a particular production level.)
2-2-77

Cost Variation - Linear ApproximationTC = FC + (VC Q) for Q in relevant range
Approximation: Total opportunity costs (TC) are a linear function of quantity (Q) produced over a relevant range.
Variable Cost (VC): Cost to produce one more unit. Variable cost is a linear approximation of marginal opportunity costs.
Fixed Cost (FC): Predicted total costs with no production (Q=0).
Relevant Range: Range of production quantity (Q) where a constant variable cost is a reasonable approximation of opportunity cost.
2-2-88

Cost Variation - Cost Drivers
Cost driver: Measure of physical activity most
highly associated with total costs in an activity center.
Examples of cost drivers: Quantity produced Direct labor hours Number of set-ups Number of different orders processed
Use different activity drivers for different decisions.
Costs could be fixed, variable, or semivariable indifferent situations. 2-2-99

C-V-P Analysis - Definitions
Cost-Volume-Profit (C-V-P) analysis can be useful for production and marketing decisions.
Contribution margin equals price per unit minus variable cost per unit: CM = (P – VC).
Total contribution margin equals total revenue minus total variable costs: (CM Q) = (P - VC) Q.
See Self-Study Problem 1.
2-2-1010

C-V-P Analysis - Breakeven PointBreakeven point QBE is the number of units
that must be sold at price P such that total revenues (TR) equal total costs (TC).
TR = TC (P QBE) = [FC + (VC QBE)]
[(P - VC) QBE] = FC
QBE = [FC(P - VC)]
QBE = (FCCM)
At breakeven, the total contribution margin equalsfixed costs.
(CM QBE) = FC
2-2-1111

C-V-P: Target Profit Without TaxesDefine ProfitT = Target Profit. Assume tax rate t =
0. Solve for QT
Total Revenue - Total Costs = ProfitT
{(P QT) - [(VC QT) – FC]} = ProfitT
{[(P - VC) QT] - FC} = ProfitT
[(CM QT) - FC] = ProfitT
(CM QT) = (ProfitT + FC)
QT = [(ProfitT + FC) CM]
At breakeven, ProfitT = 0; and QBE = [(0 + FC)CM]
See Self Study Problem 2.2-2-1212
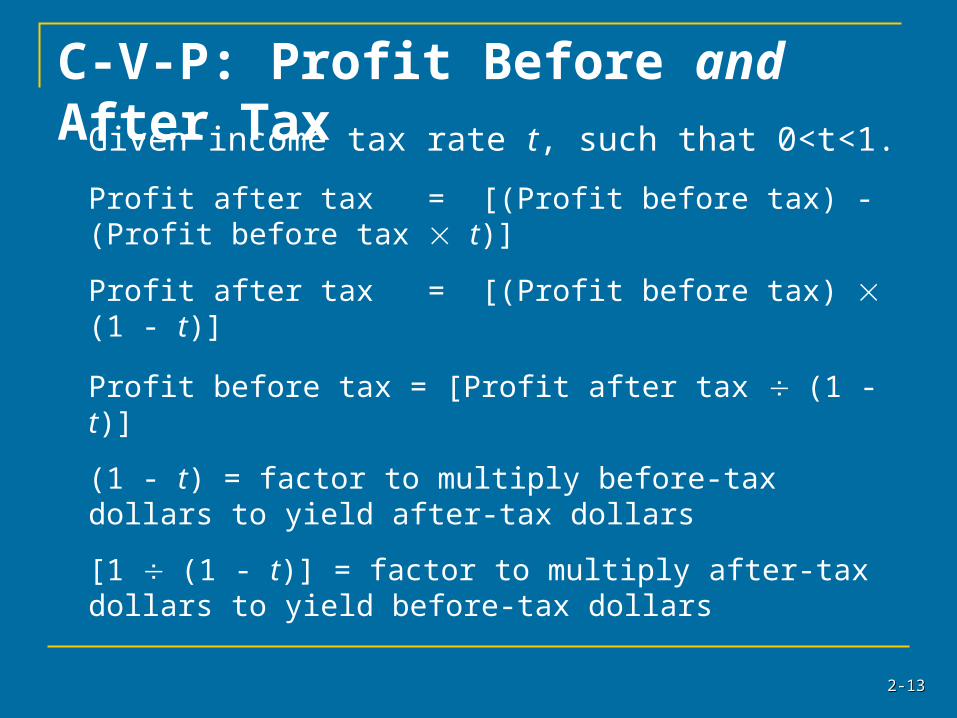
C-V-P: Profit Before and After TaxGiven income tax rate t, such that 0<t<1.
Profit after tax = [(Profit before tax) - (Profit before tax t)]
Profit after tax = [(Profit before tax) (1 - t)]
Profit before tax = [Profit after tax (1 - t)]
(1 - t) = factor to multiply before-tax dollars to yield after-tax dollars
[1 (1 - t)] = factor to multiply after-tax dollars to yield before-tax dollars
2-2-1313

C-V-P: Target Profit with TaxesDefine ProfitT = Target Profit after taxes. Assume tax
rate t such that 0<t<1
Solve for QT
[(Profit before taxes) (1 - t)] = ProfitT
{[((P - VC) QT) - FC] (1 - t)} = ProfitT
[((P - VC) QT) - FC] = [ProfitT (1 - t)] [(P - VC) QT] = {[ProfitT (1 - t)] + FC} (CM QT) = {[ProfitT (1 - t)] + FC} QT = [{[ProfitT (1 - t)] + FC} CM]
When the target quantity is achieved the total contribution margin (CM QT) equals the sum of before-tax profits and fixed costs.
2-2-1414

C-V-P: Assumptions
Assumptions of simple linear C-V-P analysis: Price does not vary with quantity Variable cost per unit does not vary with quantity Fixed costs are known The analysis is limited to a single product All output is sold Tax rates are constant for profits or losses Does not consider risk or time value of money
More advanced estimation techniques are used if the limitations of simple C-V-P are violated.
2-2-1515

Multiple Products
When there are multiple products for a single company you must assume a known and constant sales mix.
Then a break-even number of bundles can be calculated.
By knowing the sales mix, the volume of individual product sales can be determined.
2-2-1616

C-V-P: Operating Leverage
Operating leverage: ratio of fixed costs to total costs
Firms with high operating leverage have: rapid increases in profits when sales expand rapid increases in losses when sales fall greater variability in cash flow greater risk
Knowledge of a competitor’s cost structure is valuable strategic information in designing marketing campaigns.
2-2-1717

Opportunity Costs Versus Accounting Costs
RecordingAccounting cost: Record after decision implementedOpportunity cost: Estimate before decision made
Time perspectiveAccounting: Backward-looking (historical)Opportunity: Forward-looking (future projections)
Link to financial statementsAccounting: direct link - Assets are unexpired costs.Opportunity: no direct link
2-2-1818

Accounting Costs: Product vs. Period CostsProduct Costs Accounting costs related to the purchase or
manufacture of goods Accumulated in inventory accounts (asset) Expensed when sold (cost of goods sold) Include fixed and variable cost of goods
Period Costs All accounting costs not included in product costs Expensed in period incurred Include fixed and variable selling and
administrative expenses
2-2-1919

Accounting Costs: Direct vs. Overhead CostsDirect Costs Costs easily traced to product or service produced or sold. Include direct materials (materials used in making product) Include direct labor (cost of laborers making product) Direct costs are usually variable.
Overhead Costs Costs that cannot be directly traced to product or service
produced or sold. Include general manufacturing (supervisors, maintenance,
depreciation, etc.). Include other administrative, marketing, interest, and
taxes. Overhead costs are primarily fixed with respect to number
of units produced or sold, but may include some variable costs related to number of units produced or sold.
2-2-2020

Cost Estimation Methods
Account Classification Each account in financial accounting system
is classified as fixed or variable. Method is simple, but not precise.
Motion and Time Studies Estimate to perform each work activity
efficiently under standard conditions. Expensive to conduct study. Should be redone as conditions and
processes change.
2-2-2121

Appendix A: Costs and the Pricing Decision Consider two different conditions:
Firm is a “price taker.” Firm has “market power.”
“Price takers” use cost data to determine whether to produce and if so how much. They have no real influence on price.
“Market power” firms consider the price sensitivity of customers in choosing markups in “cost-plus pricing.”
2-2-2222