the nature conservancy: a pilot season for cooperative grassland monitoring meredith cornett...
TRANSCRIPT

The Nature Conservancy: A Pilot Season for
Cooperative Grassland Monitoring
Meredith CornettDirector of Conservation ScienceThe Nature ConservancyMinnesota, North Dakota, South DakotaNovember 14, 2007
©Eric Stubbs NASA
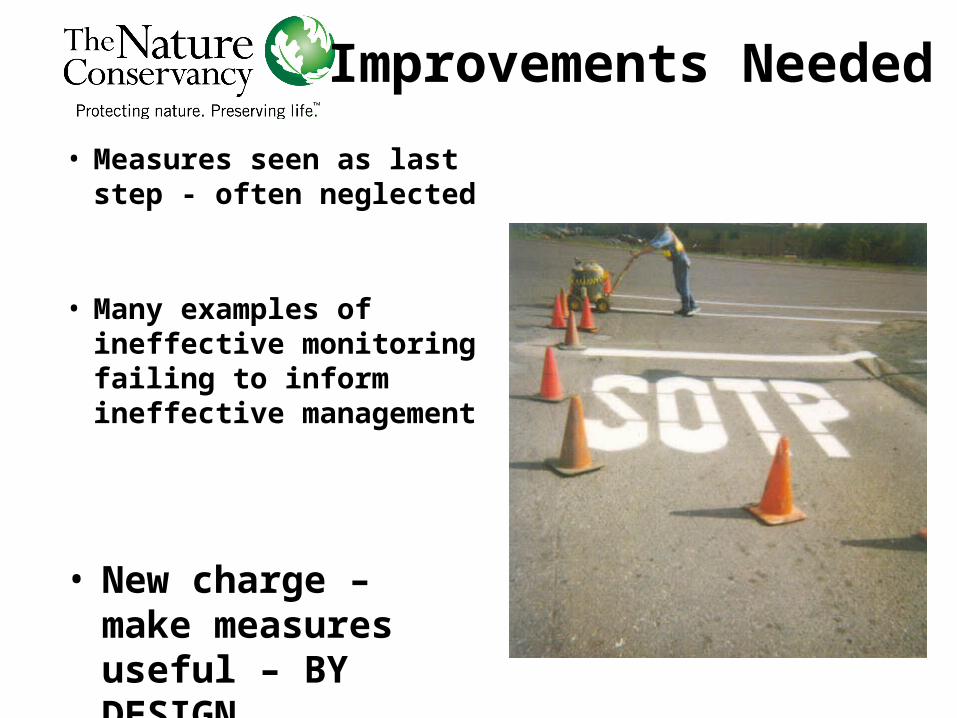
• New charge – make measures useful – BY DESIGN
• Measures seen as last step - often neglected
• Many examples of ineffective monitoring failing to inform ineffective management
Improvements Needed

Defining Your Project
Developing Strategies &
Measures
Implementing Strategies &
Measures
Using Results to Adapt & Improve

Defining Your Project
Developing Strategies &
Measures
Implementing Strategies &
Measures
Using Results to Adapt & Improve
Developing Strategies & Measures
· Target viability· Critical threats· Situation analysis· Objectives & actions· Measures

Status(2) How is the biodiversity we care about
doing?
This project has potential to address both needs for some variables.
Effectiveness(1) Are our conservation actions
having their intended impact?
Effectiveness vs. status measures

Landscapes of Interest
Scale: Each site is a datapoint.
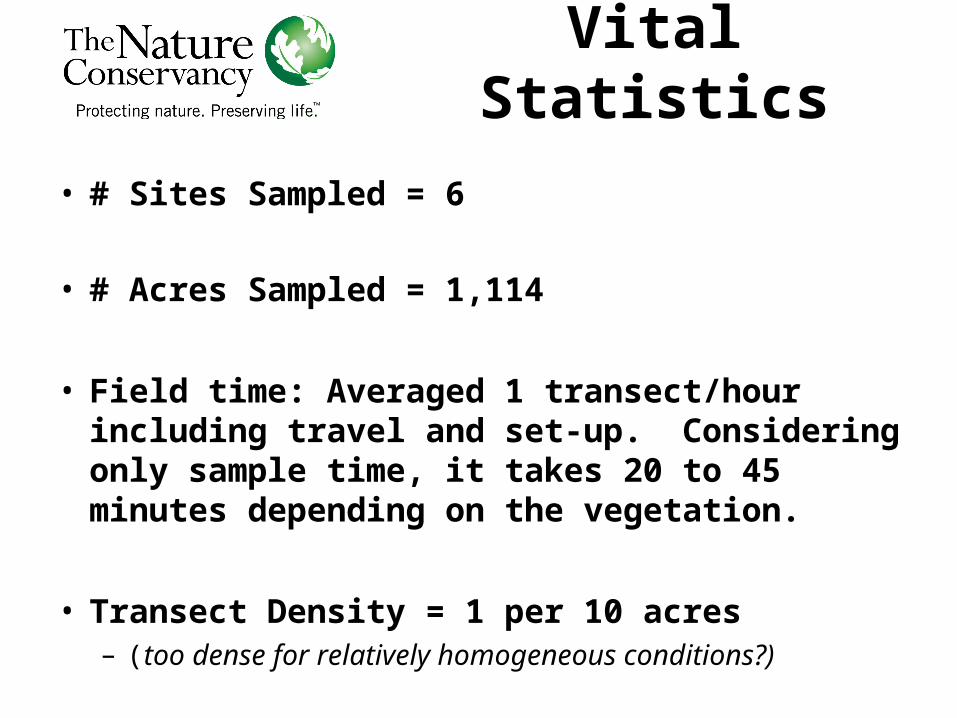
Vital Statistics
• # Sites Sampled = 6
• # Acres Sampled = 1,114
• Field time: Averaged 1 transect/hour including travel and set-up. Considering only sample time, it takes 20 to 45 minutes depending on the vegetation.
• Transect Density = 1 per 10 acres – (too dense for relatively homogeneous conditions?)

Natives/Exotics
0%
20%
40%
60%
80%
100%
1HiM1 2FuchsE 2Fuchs 2Johnson 3Leif 3Sheep
ExoticDom
Intermixed
NativeDom
n=45 n=10 n=9 n=7 n=24 n=19
Management Objective: Maintain or increase % cover of native prairie vegetation relative to invasive/exotic vegetation.

0
10
20
30
40
50
60
70
80
90
100
ABRFU ABRFUE ABRJOH PRCHIM OGLLEI OGLSHE
POAPRA
BROINE
AGRspp
ELYREP
MELspp
Top Exotics: Occurring at All
Sites
n=9 n=10 n=7 n=45 n=24 n=19
Management Objective: Minimize % cover of invasive/exotic vegetation, with particular attention to a short list of species.

Quality Indicators
Management Objective: Maintain current frequency of quality indicators (e.g., grazing sensitive species) across the landscape.
• Is rotational grazing compatible with
maintaining desired structure and composition?
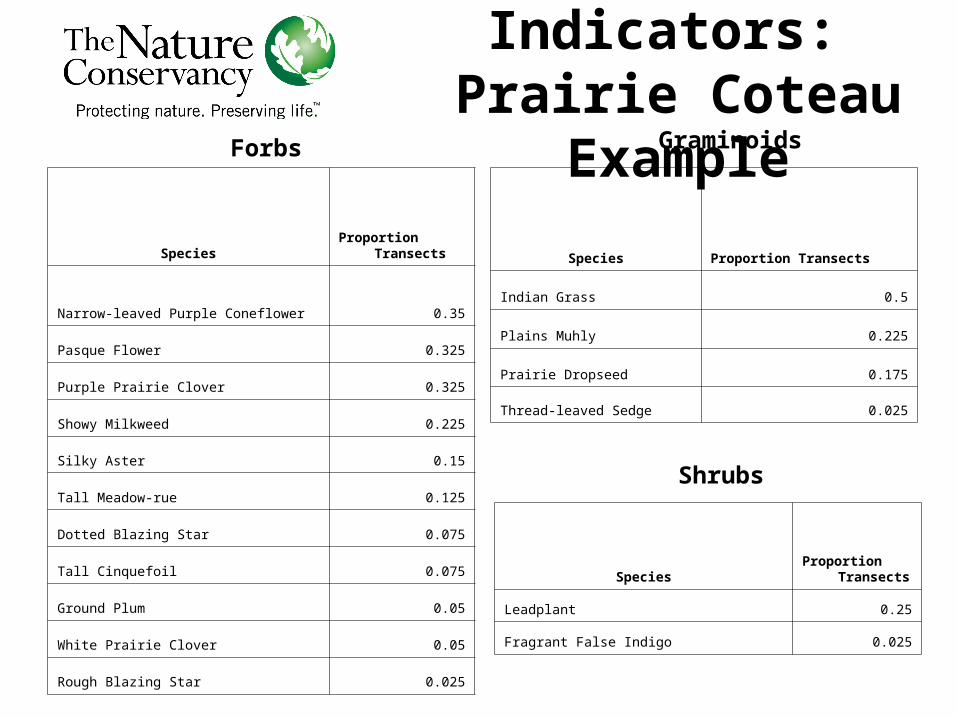
Quality Indicators:
Prairie Coteau Example
SpeciesProportion
Transects
Narrow-leaved Purple Coneflower 0.35
Pasque Flower 0.325
Purple Prairie Clover 0.325
Showy Milkweed 0.225
Silky Aster 0.15
Tall Meadow-rue 0.125
Dotted Blazing Star 0.075
Tall Cinquefoil 0.075
Ground Plum 0.05
White Prairie Clover 0.05
Rough Blazing Star 0.025
Species Proportion Transects
Indian Grass 0.5
Plains Muhly 0.225
Prairie Dropseed 0.175
Thread-leaved Sedge 0.025
SpeciesProportion
Transects
Leadplant 0.25
Fragrant False Indigo 0.025
Forbs Graminoids
Shrubs

Structure: Vegetation
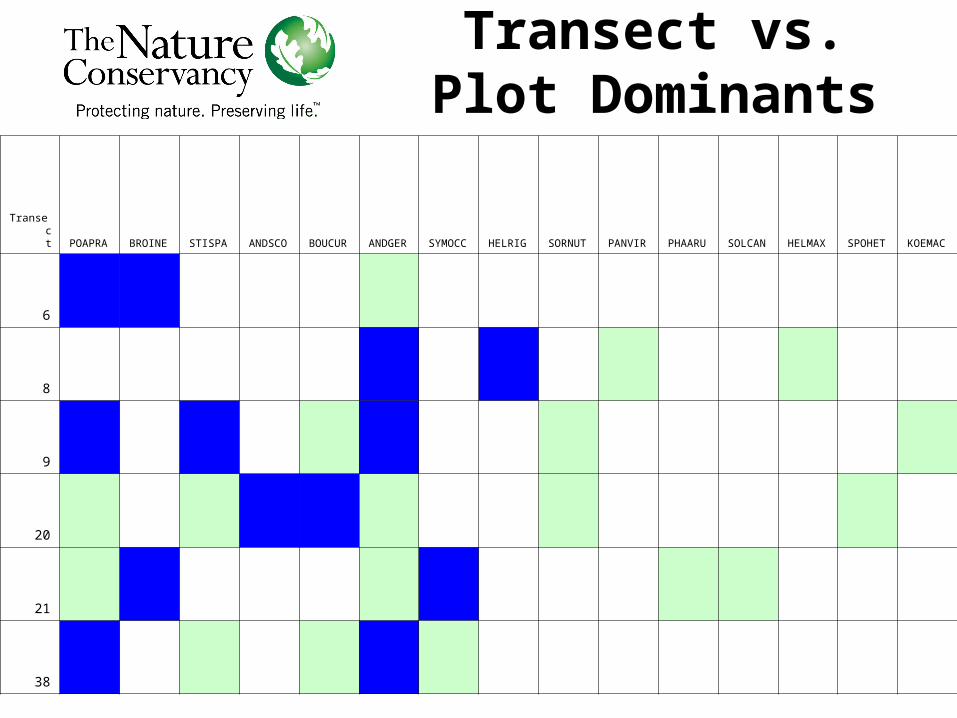
Transect vs. Plot Dominants
Transect
POAPRA
BROINE STISPA
ANDSCO
BOUCUR
ANDGER
SYMOCC HELRIG
SORNUT PANVIR
PHAARU
SOLCAN
HELMAX
SPOHET
KOEMAC
6
8
9
20
21
38

Structure: Litter
Litter
00.5
11.5
22.5
33.5
44.5
ABRfuch
s
ABRfuch
se
ABRjohns
on
OGLlief
OGLsheep
PChitm
P1
PChitm
P2
Site
Lit
ter
(cm
)

Robel: G Transects –
Prairie Coteau Habitat
PartnershipMeanRobel
0
1
2
3
4
5
6
7
8
A B C D E F G H I J K L M N O P Q R S T U V
Owner
Mea
n R
ob
el

Robel: PCHPProportions
Matter
0
0.05
0.1
0.15
0.2
0.25
0.3
0.35
0.4
0.45
1 2 3 4 5
Height Category (dm)
Pro
po
rtio
n
Management Objective: Restore the full range of structural variability across the landscape, with all height classes represented.
Your Help Needed
• Peer review of methods, etc.– Robel vs. height measurements every
5m (redundant? Other redundancies?)– Transect density
• Design issues – if to set up an adaptive management experiment
• Support for data management
Possibilities for Next Field
Season• Quality control: Possibly
resample each others’ transects to determine repeatability of our methods?
• Drop dominant species for each plot, just do checklist for transect (TNC)?
• Compare with “G-Transect” method (or does it matter?)
• Even higher level of coordination?

Issues
• Robel: Transects on steep slopes• Vegetation height: Estimated average
height of the majority of vegetation in immediate area of meter stick (to max of 0.5 m radius)
• Plant groups: Bulk of time spent making decisions about vegetation within each 0.5 m quadrat
• Assessing dominant species within each quadrat added 5-10 m per transect

Issues, Continued
• Plant groups: wet meadow – misclassification could lead to inappropriate data collection
• Vegetation cover: used relative rather than absolute cover
• Vegetation cover: added category “other” for bare ground