the natural gas chain in colombia - upme · 6 subject, that it provide structured, organized and...
TRANSCRIPT


2

3
THE NATURAL GAS CHAIN IN COLOMBIA Table of CONTENTS 1 INTERNATIONAL ENVIRONMENT ................................................................ 8
1.1 Energy in the world ................................................................................... 9 1.2 Natural gas in the world .......................................................................... 15 1.3 Natural Gas in Latin America .................................................................. 19
2 NATIONAL ENVIRONMENT......................................................................... 29 2.1 Economy and energy.............................................................................. 29 2.2 Energy matrix.......................................................................................... 35 2.3 Situation of natural gas in the “Upstream”............................................... 37
3 DOWNSTREAM SITUATION FOR NATURAL GAS ..................................... 50 3.1 General Aspects ..................................................................................... 50 3.2 Transportation......................................................................................... 50 3.3 Distribution of Natural Gas...................................................................... 52 3.4 Exclusive Service Areas for distribution .................................................. 55 3.5 Natural gas consumption in Colombia .................................................... 57 3.6 Natural Gas for Vehicles ......................................................................... 59 3.7 Projections of the demand for natural gas .............................................. 61 3.8 Supply demand balance ......................................................................... 64
4 PRICES......................................................................................................... 68 4.1 Regulation of wellhead prices ................................................................. 68 4.2 Regulation of transportation prices ......................................................... 71 4.3 Regulation of distribution and marketing................................................. 73 4.4 Natural gas prices................................................................................... 74
5 REGULATORY AND NORMATIVE ASPECTS ............................................. 78 5.1 Integration of the businesses .................................................................. 78 5.2 Wellhead prices of natural gas................................................................ 79 5.3 Competition among producers and joint marketing................................. 81 5.4 Take or pay and take and pay contracts ................................................. 82 5.5 Regulation of the transportation activity .................................................. 82 5.6 Regulation of the Distribution Activity...................................................... 84 5.7 Shareholder property and competition .................................................... 85 5.8 Norms ..................................................................................................... 87
6 NATURAL GAS AND THE ELECTRIC SECTOR ......................................... 89 6.1 Colombian Electric Sector....................................................................... 89 6.2 Coordination between the Natural Gas and Electricity sectors ............... 92 6.3 Definition of generation alternatives in strategies ................................... 94
7 NATURAL GAS SUBSTITUTES ................................................................... 96 7.1 Comparative analysis of natural gas substitutes by price 2003-2006 ..... 96 7.2 Projections-Substitution Scenarios ...................................................... 101
4
8 ACTIONS FOR THE CONSOLIDATION OF THE NATURAL GAS SECTOR105 8.1 National Energy Plan (PEN) ................................................................. 105 8.2 Strategies to dynamize and consolidate the gas sector in Colombia .... 106 8.3 Special Progress Fund.......................................................................... 108 8.4 Discussion spaces to consolidate the Natural Gas sector .................... 109 8.5 Actions for Strengthening...................................................................... 110
BIBLIOGRAPHY AND SOURCES OF INFORMATION ................................. 112

5
PRESENTATION Since the beginning of the 90s, one of the objectives of the energy policy was to achieve mass consumption of gas in inland Colombia. In 1991 the CONPES1 approved the Program for Mass Consumption of Gas, aimed at promoting gas in inland Colombia as a substitute for high cost sources of energy, taking into account the existence of important reserves and the environmental characteristics of this source of energy. In 1993 a new document2 approved the strategies of what was then called The Gas Plan and actions were established in order to guarantee the offer (supply?) of this fuel by means of the continuity of exploration activities and exportation of new reservoirs, the construction of a main gas pipeline network, the enlargement of the transportation system, and the shaping of a market in the industrial, residential and thermoelectric sectors. In the development of the above-mentioned governmental instructions, ECOPETROL hired and financed the construction of gas pipelines which constitute the backbone of inland gas transportation in Colombia. The Law of Domiciliary Public Services (Utilities?), Law 142 of 1994, aimed at the separation of gas marketing and transportation activities at ECOPETROL and thus it was developed by the regulations for the gas sector. Later, Law 401 of 1997 separated gas transportation and the property of the corresponding assets from ECOPETROL and created ECOGAS as an independent company. As a result of the above, the service is currently provided to close to three million seven hundred thousand users throughout the country, in eighty four municipalities. 3,6003 kilometers of gas pipelines were constructed and twenty six gas distribution companies were established in a decade. A decade after a enunciating the Gas Plan, the UPME has considered that it is in the interest of the different agents of the energy sector, and of private citizens who are interested in the
1 Document No. 2571. 2 CONPES Document No. 2646, 3 Decimal numbers are separated with a point and thousands are separated with commas.

6
subject, that it provide structured, organized and timely information, and present this new version of the document “The Natural Gas Chain in Colombia” 2003–2005 version. Initially, in Chapter I, reference is made to reserves, production and consumption of natural gas in the world, emphasizing the conditions in Latin America. In Chapter 2, there is a review of the national environment which includes a description of the main economic indicators of the country and the conditions of exploration, production and supply which comprise the “upstream” and the aspects of the “downstream” which are related to the demand of natural gas, its transportation and the elements of consumption such as distribution, exclusive areas and CNG for vehicles. In Chapter 3 reference is made to the “downstream” situation of natural gas, which is understood as the activities that are related to the way that natural gas is distributed, from the time it is injected into a gas pipeline under quality specifications, until it is taken to the point of its final use. Chapter 4 is dedicated to reviewing the situation of prices, and in Chapter 5 regulatory and normative aspects regarding natural gas are analyzed. In Chapter 6 important elements of the relation between the electric sector and the natural gas sector are presented, mainly regarding generation and demand. In Chapter 7 the behavior of the substitutes of natural gas is analyzed, and finally in Chapter 8 there is a revision of the current situation of the subsector such as the National Energy Plan, the strategies of the CONPES to dynamize and consolidate the Natural Gas Sector in Colombia, to develop the Special Progress Fund, the Meeting of the Ad Hoc Group on Gas Issues of the Andean Community and the activities of the National Operation Council. In this, as in all our publications, we reiterate our interest in that these documents will constitute a valuable source of reference for sectorial agents as well as for interested third parties.
CARLOS ARTURO FLÓREZ PIEDRAHITA General Director

7

8
CHAPTER 1 INTERNATIONAL ENVIRONMENT
1 INTERNATIONAL ENVIRONMENT On an international level, 2005 was the year with important ups and downs in energy markets, due to the considerable increase in the demand of Asian countries and the decrease in the countries of the Organization for Economic Co-operation and Development (OECD), particularly in the United States, a direct consequence of the interruption in the supply of fossil fuels produced by climatic phenomena Rita and Katrina. The greatest rise in oil and gas prices was also reported this year after the oil crisis in the 70s. However, the increase in prices is not directly related to the shortage of resources, since this year, global oil and natural gas reserves continued with a tendency towards greater growth than production4. In the last two years, there have been outstanding growth rates in global energy consumption. This has been driven by the economic growth of the emerging countries in Asia, which has become the main energy consuming region and has displaced Europe and North America in recent years. The strong economic growth of China in recent years has manifested in a considerable expansion of its oil consumption, to the point of becoming the second global consumer, with growth rates five times greater than the corresponding rates of the world as a whole, thus significantly altering the international geopolitics of energy, especially in Asia Pacific. Analysts point out that the current growth rate of the global energy demand, and particularly in emerging economies, represents risks into aspects: «the safety of the supplied and the increase in carbon dioxide emissions», given that hydrocarbons will continue to be the most important source of energy in the next 25 years, with a contribution of close to 60 % of the demand for energy in 2030. According to the International Energy Agency- IEA, the source of energy with the greatest increase in demand in absolute terms will be natural gas. Natural gas consumption will grow by 2.1% annually. This evolution represents an increase of 75% in the next quarter of a century, up to 4.8 trillion cubic meters of gas. The demand for coal will increase by 1.4% annually, up to 7.3 billion tons in 2030. Production of nuclear energy will also grow, but not as much as other sources, whereas renewable energy will increase more than the rest, with an average of 6.2% per year. However, its market share will continue to be small and will be relegated to 2% of total consumption in 2030.
4 BP – Press. http://www.bp.com/genericarticle.do?categoryId=954&contentId=2019295.

9
Likewise, the IEA considers that during the 2006-2030 period a 17 trillion dollar investment will be necessary to face the requirements of refining and extraction capacity enlargements. The organization predicts that in 2030 the price per barrel of oil will be 20% higher, in case these investments do not take place, which will have repercussions in the increase of production costs of all sources of energy. They also consider that the lack of investments may cause a reduction of the Gross Domestic Product (GDP) of the global economy by close to 0.23 points per year until 2030. If this lack of investments continues, the global demand for oil will increase by 1.1% annually in the next 25 years, and the demand for natural gas by 1.9% annually, North America and Europe being responsible for the decline in the demand.
1.1 Energy in the world Although there are enough global energy resources to meet the foreseen demand, turning primary energy into supply depends on moving resources. That allowed the energy sector to have sufficient capital for its development. This implies developing strategies, where there is an agreement between the needs of the economies and energy requirements. 1.1.1 Reserves and world energy production World energy production during 2005 was 433.9 quadrillion BTU5 and consumption was 435.7 quadrillion BTU in 2005, the energy balance between production and consumption being -1.8 quadrillion BTU, which indicates some use of the stock inventory of the primary sources.
Graph 1 WORLD ENERGY PRODUCTION
Source: Energy Information Agency.
The greatest producers of energy in the world were: United States, Russia, China, Saudi Arabia and Canada, which supplied 77.7% of the total world energy. Next come, Iran, the United Kingdom, Norway, Australia, Mexico and others, which supplied an additional 22%.
5 BTU British Thermal Unit.

10
The United States supplied 26.6%, with a considerable difference compared to Russia which contributed 18.5% and China, whose supply is 16.6% and on an individual basis exceeds the total production of the African continent. Regionally, the American continent is the greatest producer of primary energy followed by Asia and Oceania, information which is presented in graph 1. 1.1.2 Global trend of energy consumption Graph 2 presents the global trend of energy consumption between 1994 and 2005, where it can be seen that for the 2000-2005 period, there was an increase in consumption at an average annual rate 2%, going from 399 quadrillion6 BTU in 2000 to 436 quadrillion BTU in 2005. The greatest consumption of energy corresponds to the region of North, Central and South America with 33% of the world total, which equals two 140 quadrillion BTU, followed by Asia and Oceania, a region that has been increasing the demand for energy since 90s due to the high internal growth rates of their countries, particularly in 1999. Currently their consumption of energy amounts to 139 quadrillion BTU which represents 31.8%, where the high consumptions of China are highlighted with 13.6%, whose average growth in the last 5 years was 12%, Japan with 5.3%, India with 3.33% and South Korea with 2% of the total consumption on a global level. Regionally, the smallest consumptions were recorded in Africa with 3%, and the Middle East with 4.6%.
Graph 2 EVOLUTION OF GLOBAL CONSUMPTION OF ENERGY
Source: EIA, Energy Information Agency. While consumption of energy on a global level has increased at an average rate of 1.85%, the increase in the Asia and Oceania region are in the order of 5%, , which indicates that demographic factors have a strong incidence in energy consumption, particularly in emerging economies where the energetic intensity is still high. Again, China, India and Malaysia are the countries with the highest growth rates in consumption. Countries belonging to the OECD consume 17%, the former Soviet Union 10% and the remaining 19% corresponds to emerging economies and Third World countries. 6 Quadrillion: Unit followed by 15 zeros.

11
Europe and Eurasia have reduced their share by 6.5%, going from 32.75% in 1995 to 29% in 2005. The same takes place in North America which reduced its share by 2% in the same period. This does not mean that the economic growth of these regions has been negative; the reduction is originated in energy efficiency and energy saving programs and the Kyoto Protocol. Regarding the type of energy source, although in general terms the relative share of petroleum has been declining, it is still the most important primary source of energy in the world, reaching 167 quadrillion BTU during 2005, which represents 38.5% of the total consumption of energy in the world. Between 2000 and 2005 oil consumption increased at an average annual rate of 1.43% due to the behavior of Asian economies. The evolution of consumption by source is presented in graph 3.
Graph 3 EVOLUTION OF GLOBAL CONSUMPTION OF ENERGY BY SOURCE
Source: BP Statistical Review of World Energy 2005. The global demand for oil is concentrated in North America, Asia and Europe, while more than 60% of the reserves are located in the countries of the Persian Gulf. Global oil production has continued to increase in order to cover the growing demand and now exceeds 84 MBD7; it is estimated that global production of crude oil will reach close to 120 MBD for 2025, representing an increase of almost 45% with respect to the current level. In the 2000-2005 period, the incorporation of reserves was concentrated in the Middle East and the former USSR. A major part of the growth in the supply of crude oil will come from the Persian Gulf, where the production capacity is expected to double reaching close to 40 MMBD in 2025, according to the report of the United States Department of Energy. Coal is the second source of consumption, we stayed 24% share of global energy production. Between 2000 and 2005 coal consumption grew at an average annual rate of 2.4%, going from 94.5 quadrillion BTU in 2000 to 104.8 quadrillion BTU in 2005, again an increase driven by the intensification of the demand in China, which has increased by more than 15% in the last 5 years, although other regions also had a strong demand, and in North America, its use increased until it reached record levels.
7 MBD Million Barrels per Day.

12
Recoverable coal reserves in the world are estimated at more than 900 billion tons, the United States, Russia and China being the countries with the greatest reserves. Analyses carried out by the Energy Information Agency (EIA) estimate that the global demand for coal will increase by about 2% per year, reaching about 155 quadrillion BTU for 2025. Consumption of electric energy (Hydraulic 27.9 quadrillion BTU, Nuclear 27.5 quadrillion BTU and Renewables 4.1) reached a total of 59.7 quadrillion BTU in 2005, which represents a 13.7% share of the total energy. It is estimated that electric power consumption will reach 88 quadrillion BTU in 2025, driven by growths in the order of 4% in developing countries, but the world average will be in the order of 1.85% per year. Natural gas will significantly increase its share in the generation of electricity, but coal will continue to be the main fuel in the generation of electric power. Natural gas is the primary energy source with the fastest growth in recent years; it was the third source of energy in 2005 with almost one fourth of the total energy consumed in the world, which was close to 23%. Between 2000 and 2005 consumption of natural gas grew at an average annual rate of 2.8%, going from 91 quadrillion BTU in 2000 to 103.6 quadrillion BTU in 2005, exceeding the average growth of total energy consumption of the last 10 years. The greatest share of consumption (84%) is concentrated in the countries belonging to the Organisation for Economic Co-operation and Development, OECD and in the market formed by the former USSR and the «Transition Economies in Eastern Europe», which represent respectively 48% and 36% of the global demand for natural gas. Among the so-called «developing regions», the Middle East and Latin America represent, each one, close to 5% of the global demand. Eastern Asia and Southern Asia follow with 2.1% and 1.4%, respectively, whereas Africa represents 1.45%, and the People's Republic of China 0.75% of global consumption. The greater dynamism of natural gas consumption is explained, among other factors, by the plentiful reserves, which indicates that there is a supply capacity that could be maintained for many years, besides the fact that these reserves are not very concentrated geographically, in contrast to petroleum, of which two thirds of the available global reserves are concentrated in Middle Eastern countries. Technological advances are another of the factors that have allowed the increase in the global consumption of natural gas. The greater importance that the preservation of the environment has acquired in the last decades has favored the consumption of natural gas as there is less carbon dioxide is produced than with petroleum. The energy safety policy of the OECD countries aims at the reduction of the dependence on imported petroleum, especially from the Middle East has also contributed to increasing the consumption of gas for different uses. 1.1.3 Projection of global energy consumption This projection which was presented by the International Energy Outlook 2005 shows a great increase in the global demand for energy. In the next 20 years, consumption is expected to increase to 645 quadrillion BTU, which equals 47.5%. This is due to technological development and the fast growth of emerging economies, mainly of large consumers of energy such as China, India and Brazil.

13
Graph 4 OUTLOOK FOR GLOBAL CONSUMPTION BY REGION
Source: EIA. Global economic development is perhaps the main factor of the growth in the demand for energy and the projections of the regional energy demand are based on it. The International Energy Outlook of 2005 estimates that the growth of the economy will be around 3.9% per year, until 2025. In mature economies such as the United States, Canada, Western Europe, Japan and Australia, the growth of energy consumption is determined by the subjacent demographic trends and productivity, where there is political stability and well established markets. Emerging nations, among which are China, India and Korea, which go through the processes of the construction of physical infrastructure, the establishment of regulating mechanisms for the administration of the markets and the assurance of political stability will be, according to experts, the economies with the greatest growth in the world, whose average interannual rate is estimated at close to 5.5%, which will allow a reduction of poverty on the medium and long-term, which will in turn bring about a high rates of increase in the demand for energy. In the particular case of China, it is expected that its economic development will be the highest in the world, with an average annual growth index of approximately 6.2% until 2025, and it will become the largest economy in the world. As a member of the World Trade Organization, China must carry out structural reforms that will transform the economy to orient itself towards the market, which is expected to bring about greater efficiencies. India’s perspectives are equally positive and it is expected that its economic development will reach average annual rates of 5.5%, which will imply high rates of energy consumption. With a slower rate of economic growth, the Middle East is among the emerging economies, where oil prices are the most important factor of economic growth and therefore of energy requirements in order to continue on the path to improving the region. Although Central and South American nations have favorable paths of economic development, they sustain growth rates below their potential, due to difficulties of political order and dependence on the volume of flow of foreign capital for the development of the region. While energy consumption in Asia is expected to grow to 120% of the current consumption, consumption in the Middle East is expected to grow 76.5%, Africa will grow 83.6% and it is

14
expected that Central and South America will have the lowest growth rates with values close to 65%. Transition economies such as Russia, the former Soviet Union and Eastern Europe are facing the problem of moving from centralized planning systems, towards decentralized private markets. Therefore, in contrast to mature market economies, there is greater uncertainty regarding energy requirements. Energy consumption is expected to grow 15% until 2025 with respect to the current situation. Consumption projections per type of energy show growing rates of the demand for primary energy in all its sources during the next two decades. It is noted that petroleum will continue to be the fuel with the greatest demand reaching 243 quadrillion BTU in 2025, although in relative terms its share will decrease by 1%, which means that it will reach a 38% share in global consumption per source, particularly due to its high prices. It is estimated that the global production of crude oil will reach close to 120 million barrels in 2025, representing an increase of almost 50% with respect to the current level. An average increase of the supply of 1.8%/year is forecast until 2025 in order to face the anticipated rise in the demand. The Middle East will continue to increase its production and will maintain a predominant position as the main exporter; Saudi Arabia, Iran, Iraq, UAE and Kuwait will increase their production by 2.3% in 2020 to cover the global demand. The production of the countries not belonging to the Organization of Petroleum Exporting Countries (OPEC) will continue to grow, and within the 2006-2008 period more than 50% of this increase will come from Russia and Kazakhstan. Europe and Eurasia’s supply will exceed the supply of North America if new reserves are not found in this region. Most of the growth in the supply of crude oil will come from the Persian Gulf, where it is expected that production capacity will double to reach close to 40 MMBD in 2025. According to what was determined in the reference case of the DOE8
-EIA, there will be an increase in the use of coal of two percentage points in the energy package increasing its share to a total of 25% in 2025. The greatest rates of increase in the use of coal are projected for China and India, where the largest reserves of this source of energy are also located.
Graph 5 PROJECTION OF GLOBAL CONSUMPTION OF ENERGY BY SOURCE
Source: International Energy Outlook.
8 DOE Department of Energy of the United States.

15
It is expected that mature economies will reduce their consumption of coal, especially Eastern Europe, whereas transition and emerging economies will increase its use by 1% and 13% respectively. This source of energy will continue to be the second source of primary supply for a long time. In the case of nuclear energy, its growth was very important in the 70s and 80s, but this growth has halted due to security concerns. Consumption of nuclear energy went from 2% of the total consumption of energy in the world in 1980, to 6% in 2005. For the time being, new nuclear plants will not be constructed in the United States in the foreseeable future, although all of the existing plants will continue to operate until 2025 with some capacity expansions. In Europe, there is a controversy about the possibility of new investments in nuclear energy. Altogether, it is expected that there will be an increase of 13.2% in the consumption of nuclear energy worldwide. It is estimated that the consumption of energy coming from hydroelectric sources and other renewable sources will grow an interannual average of 1.85% until 2025. Although the share of hydroelectric power in the total generation of energy will decline, the other renewable sources will triple their share reaching 6%. The greatest growth will take place with wind energy and biomass, and it will be concentrated in the member states of the European Union, where there is strong governmental support. Regarding Natural Gas, it is expected that it will be the source of energy with the highest growth rate, with annual average values of 2.3%, reaching 156 TCF9 for 2025. The use of advanced technologies will allow exploitation projects of large reserves of natural gas, which in the past were considered economically unattractive. Different technologies have been developed for the production of Liquefied Natural Gas (LNG) on a global scale from floating barges, which will facilitate the exploitation of remote offshore gas reserves. Natural gas is projected as an important source for the new generation of electric energy given its efficiency and low content of contaminant emissions, especially making it a more attractive option for countries that are interested in reducing the emission of greenhouse gases.
1.2 Natural gas in the world
1.2.1 Reserves and global production of natural gas Since the mid-70s, the global reserves of natural gas have increased regularly every year. According to the most recent estimates of the Oil & Gas Journal, global reserves of natural gas to January 1 of 2005 amount to 179.85 billion cubic meters (MMm3)10. The former Soviet Union has the largest reserves, which represent 26.7% of the global availability, which equals 48 billion cubic meters. In order of importance, the countries of the Middle East follow with a contribution of 40.5%, highlighting the share of countries like Iran with 15.3% of the world total, Qatar which represents 14.3%, Saudi Arabia with 3.7% and 3.2% of
9 TCF Tera Cubic Feet. 10 Unit followed by twelve zeros.

16
the United Arab Emirates. The remaining 28% is distributed among North America (United States and Canada), Latin America, OECD -Europe and Asia and Australia. Together the Middle East and the former Soviet Union account for 67.3% of the total, whereas Europe, Eurasia and the American continent account for 16.9%. As to Latin America, the reserves in Latin American countries including Trinidad and Tobago amount to 7.11 billion cubic meters, which corresponds to a little more than 3.9% of global reserves. The largest part of regional natural gas reserves is in Venezuela (4.35 MMm3), followed by Bolivia (0.5 MMm3), and Argentina (0.34 MMm3), while countries like Trinidad and Tobago, Colombia and Peru have reserves of 0.5 MMm3, 0.11 MMm3 and 0.25 MMm3, respectively .
Graph 6 GLOBAL RESERVES OF NATURAL GAS 2005
Source: International Energy Outlook y BP Statistical Review of World Energy, 2005. The region with the largest rate of incorporation of reserves (revisions to natural gas reserve estimates) in the last five years corresponds to the Middle East with an annual average increase of 7.2%, followed by Africa with 4.2% and Asia Pacific, which reached 3.3%. Individually Qatar is the country with the largest increase in its reserves during the 2000-2005 period (21.6%), as well as Bolivia (12%), China (11.6%), Syria (10.4%), and Kazakhstan (10%). Global production of natural gas is concentrated in the region of Eurasia with 40% of the world total, followed by North America with a 28.3% share, Asia Pacific with a 12% share, the Middle East which represents 10% and with low levels Africa and Central and South America with 5%. The United States and Russia are the countries with the largest production of gas, and on the global scene there are few countries that traditionally produce this source of energy. The distribution of production does not follow a similar pattern as the distribution of reserves, given that the behavior differs since reserves are concentrated in the Middle East and Russia, whereas the United States, Europe and Japan have the largest demand.
Graphs 7 GLOBAL PRODUCTION OF NATURAL GAS 2005

17
Source: International Energy Outlook and BP Statistical Review of World Energy, 2005. It is expected that emerging economies will maintain high production growth rates, with average values in the order of 4.1% as of 2005 until 2025. On the other hand, the production of natural gas in the countries of the so-called transition economies is expected to increase by an average annual index of 2.3%, and that mature market economies will increase by an average of 0.6% during the same period. The disparity between the projected increase and the consumption of mature economies will make them become increasingly dependent in order to meet the needs of those countries that comprise not only transition market economies, but also emerging economies. 1.2.2 Global consumption Global consumption of natural gas has been increasing at a faster rate than the consumption of energy in reference to primary sources. Its use has been intensified in all the regions of the world, due to the diversity of uses, not only end use, but also intermediate, and with the lower emission of pollution than other fossil fuels. The 90s corresponded to an important period of growth in the natural gas industry, which was favored by the reorientation of energy policies of some countries, as well as the presence of the electricity generation industry, which is based on gas turbines.
Graph 8 EVOLUTION OF THE CONSUMPTION OF NATURAL GAS
Source: International Energy Outlook y BP Statistical Review of World Energy, 2005.
18
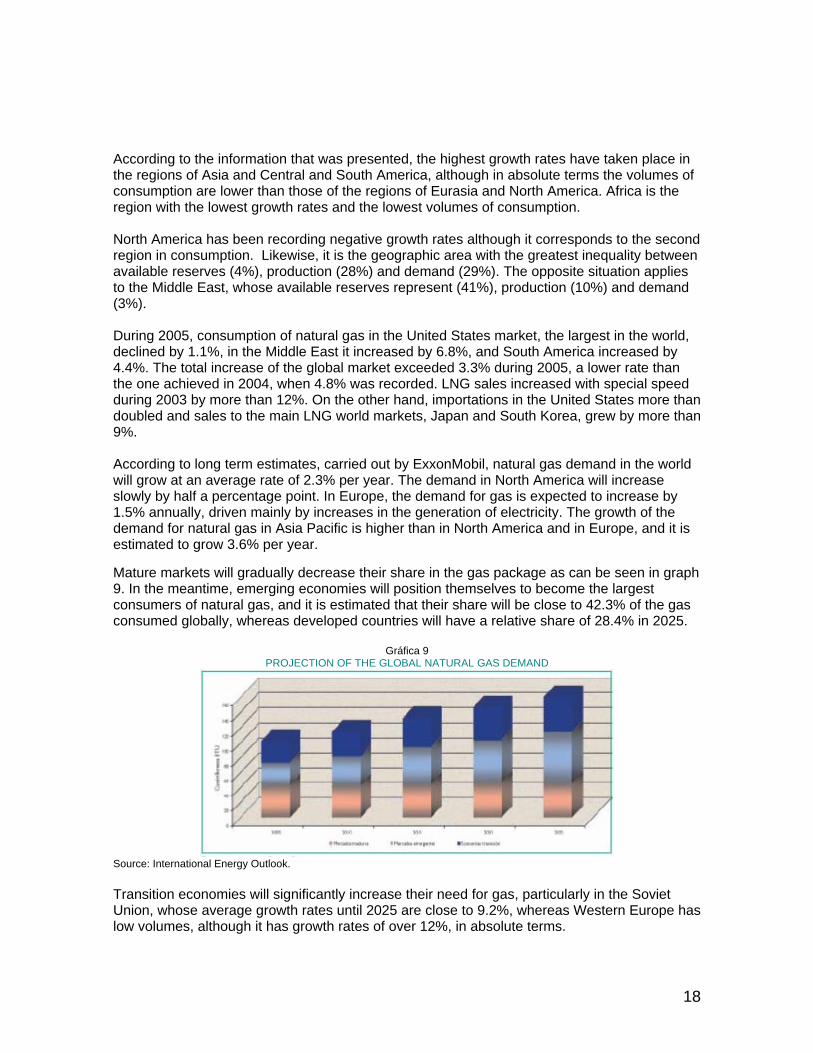
According to the information that was presented, the highest growth rates have taken place in the regions of Asia and Central and South America, although in absolute terms the volumes of consumption are lower than those of the regions of Eurasia and North America. Africa is the region with the lowest growth rates and the lowest volumes of consumption. North America has been recording negative growth rates although it corresponds to the second region in consumption. Likewise, it is the geographic area with the greatest inequality between available reserves (4%), production (28%) and demand (29%). The opposite situation applies to the Middle East, whose available reserves represent (41%), production (10%) and demand (3%). During 2005, consumption of natural gas in the United States market, the largest in the world, declined by 1.1%, in the Middle East it increased by 6.8%, and South America increased by 4.4%. The total increase of the global market exceeded 3.3% during 2005, a lower rate than the one achieved in 2004, when 4.8% was recorded. LNG sales increased with special speed during 2003 by more than 12%. On the other hand, importations in the United States more than doubled and sales to the main LNG world markets, Japan and South Korea, grew by more than 9%. According to long term estimates, carried out by ExxonMobil, natural gas demand in the world will grow at an average rate of 2.3% per year. The demand in North America will increase slowly by half a percentage point. In Europe, the demand for gas is expected to increase by 1.5% annually, driven mainly by increases in the generation of electricity. The growth of the demand for natural gas in Asia Pacific is higher than in North America and in Europe, and it is estimated to grow 3.6% per year. Mature markets will gradually decrease their share in the gas package as can be seen in graph 9. In the meantime, emerging economies will position themselves to become the largest consumers of natural gas, and it is estimated that their share will be close to 42.3% of the gas consumed globally, whereas developed countries will have a relative share of 28.4% in 2025.
Gráfica 9 PROJECTION OF THE GLOBAL NATURAL GAS DEMAND
Source: International Energy Outlook. Transition economies will significantly increase their need for gas, particularly in the Soviet Union, whose average growth rates until 2025 are close to 9.2%, whereas Western Europe has low volumes, although it has growth rates of over 12%, in absolute terms.
19
It is worth noting that the highest growth rates in the demand for natural gas will be in 2010, and they will take place in countries such as China, India, South Korea, and the Soviet Union, and on a smaller scale in some countries of the Middle East and Western Europe. The above will mainly be due to the high prices of oil in the world which force the use of natural gas at the expense of petroleum products in the industrial sector. In residential, commercial and transportation sectors, the penetration of gas is projected at low rates, and these three sectors, together account for 10% of natural gas consumption. As the demand grows, importations of natural gas will be increasingly important for North America, Europe and Asia Pacific. Interurban importations of LNG in North America will be in the order of 25% of the demand. The production of Europe will also decline during the period and importations will increase to approximately 85% of their needs. Likewise, Asia Pacific will reach levels of 50% of importations and LNG will be the best way to provide this energy. 1.2.3. New technologies Thanks to the level of crude oil prices in the last three years, gas reserves that were previously not economically viable, such as associated gas reserves and reserves that are far away from markets, may be explored. Two different schemes for the monetization of large gas reserves will be widely used in coming years. Natural Gas Liquefaction Technology (LNG?) for its initials in English, has allowed reducing cost of capital to US$25-US$30 per barrel of capacity; furthermore, since LNG technologies are compatible with existing technologies, they become the best alternative to reduce emissions. The projects to produce liquefied natural gas and other fuels starting from liquefaction technologies indicate that close to 165 million tons of LNG plant capacity will start operations in the next five years. These plants will be located in the Asian continent and in northern Africa due to the favorable environment in times of foreign investment policies and the greater needs for gas, as well as reserves. The new technologies will have sophisticated safety systems, which is a guarantee for the manipulation of the fuel both on land and offshore, given that long distances must be covered between production and consumption centers. Another development that has sparked interest on the global scene is gas to liquid technology GTL or the production of liquid fuels such as diesel fuel from natural gas although it has been available for more than 70 years. This issue has been broadly debated in recent years due to its potential to displace imported petroleum and the production of fuels, especially diesel fuel, whose global demand has grown rapidly. One of the greatest advantages of these fuels are their low sulfur content and physico-chemical properties and therefore the reduction of emissions when they are used compared to traditional fuels. Currently there are few plants in operation and more than twelve feasibility studies in the five continents.
1.3 Natural Gas in Latin America
Latin America and some Caribbean countries have emerged in recent years as one of the most dynamic and fast-growing natural gas markets in the world. The local demand for natural gas

20
is rising at a rate that reaches to digit numbers in many countries as they keep promoting the use of natural gas and moved away from oil and hydraulic power to generate electricity. 1.3.1 Natural Gas Reserves in Latin America Environmental consequences and the signs of shortage of resources such as petroleum have been encouraging the exploration of energy substitutes which have attracted large investments in gas exploration and production, gas pipelines, processing, liquefied natural gas facilities (LNG) and generation of electricity with gas. Among the Southern Cone countries an integrated gas market is emerging with plentiful transborder pipelines, which are connected to users of the electrical and industrial sectors. Proposals are frequently being put forward to set up LNG importation and exportation facilities. In a relatively short time, Trinidad and Tobago will have become the “small giant” of the Western Hemisphere, which now supplies a large part of the United States LNG market. Therefore, in recent years there has been a significant global increase in proved reserves of natural gas. Venezuela, Bolivia and Argentina account for more than 79.6% of the total reserves, with Venezuela standing out with 58.7% of the total of the region. Countries like Brazil, Trinidad and Tobago, Colombia and Peru have increased their availability but they still have low levels, and altogether, they account for 18%. The other countries represent 2%, noting that many lack gas reserves that would allow them to include this source of energy among their primary resources.
Graph 10 EVOLUTION OF NATURAL GAS RESERVES IN LATIN AMERICA
Source: BP Statistical Review of World Energy, 2005 y OLADE. On a global level, there has been an average annual increase in reserves of close to 1% in the last five years. With outstanding growth rates, Bolivia and Brazil recorded increases of 12% and 7.9% respectively in the same period, regionally balancing the reduction of reserves, while the other countries, except Venezuela, reduced the availability of this resource. 1.3.2 Production and consumption in Latin America

21
In reference to production, there are few countries in the region which have a producer tradition, and in most cases it is related to oil production. Although the natural gas industry in Latin America is still developing, expansion of exploration and infrastructure in several countries has yielded promising results. In 2005, the natural gas markets in the region, amounted to 4.4% of the consumption of this source of energy in the world. Currently production of natural gas in Latin America is enough to cover the demand; the surplus that is produced by countries like Venezuela and Trinidad and Tobago is exported mainly to the United States. The distribution of natural gas production does not follow a pattern that is similar to the one recorded by available reserves given that Argentina, which has 8.4% of the reserves, contributes with 34.5% of the production of the region. Venezuela and Trinidad and Tobago follow in this order and they participate in the same proportion with 21%, followed by Brazil and Colombia with 8.8% and 5.2% respectively.
Graph 11 EVOLUTION OF NATURAL GAS PRODUCTION IN LATIN AMERICA
Source: BP Statistical Review of World Energy, 2005 and OLADE. Production behaved more dynamically than reserves. As it was stated previously, there has been an average annual increase of 1% in the last five years, whereas production grew 7.5%, highlighting Bolivia and Trinidad and Tobago which grew 34% and 20%, bearing in mind that they are exporters of this source of energy, the first through a gas pipeline and the one coming from Trinidad as LNG. The total production of the region went from 8,700 MMCF/D 11 in 2000 to 12,500 MMCF/D in 2005, and it is estimated to continue growing not only due to the internal demand of the countries, but also due to the development of international transactions among them. Natural gas consumption in the region has increased progressively; however, consumption per capita in the region is low (10 MMCF12 per capita/year) compared to the United States (83 MMCF per capita/year) and Europe (51 MMCF per capita/year).
11 MMCF/D Million Cubic Feet per Day. 12 MMCF Million Cubic Feet.

22
Natural gas has significantly increased its share in the energy matrix of South America in the last decade, going from 14% in 1994 to 19% in 2005. However, this growth has been uneven. Brazil and Chile are the countries with the greatest growth in the demand in the last 10 years. The greater growth on all the levels of the gas chain is attributed to the high prices of oil on an international level. This has made other fuels that previously would not have been competitive economically viable.
Gráfica 12 BEHAVIOR OF NATURAL GAS CONSUMPTION IN LATIN AMERICA
Source: BP Statistical Review of World Energy, 2005, OLADE y DOE EIA. The largest consumptions correspond to Argentina, which accounts for 33%, and Venezuela with 24% followed by Brazil. In the case of Argentina, most of the consumption is destined for the industrial and power generation sectors, which together represent 63% of the total natural gas used in that country. Unlike other Latin American countries, natural gas has penetrated beyond industrial, commercial, and residential uses. A significant example is that 11% of the transportation system is powered by compressed natural gas, constituting 8.5% of the use of natural gas in Argentina. The significant increase in the transportation sector is mainly due to a price liberation of petroleum products in an international context with such high prices. Consumption of natural gas in Venezuela is concentrated in the petroleum industry which consumes close to 70% of the gas that is produced. Of this volume 47% is destined for the recovery of crude oil, 24% is used in the production of fuel, leaving 9% for the transformation of Natural Gas Liquids (NGL) and the remainder is distributed among the other petroleum industry activities which use gas as a raw material. With respect to the market in the other sectors, distribution is also highly condensed in the electrical, petrochemical and iron and steel sectors, with a 33%, 23% and 20% share. The lack of an adequate transportation and distribution system does not allow Venezuela to exploit the potential of its gas resources and modify its pattern of consumption. Brazil is also an important gas consumer that imports from Bolivia and Argentina. The growth of consumption has been considerable and currently it represents 6% of the energy package.
23
The energy and industrial sectors have the greatest demand for natural gas and represent close to 79% of the total. Another of the sectors with important growth in the last five years is transportation, reaching approximately 12% of the demand for gas, whereas the residential sector still has an incipient share of only 1.6%. Chile and Colombia, besides the countries that were mentioned above, have a gas industry that has gone through important internal developments due to the manifest increase in the consumption matrix of primary sources of energy. In spite of the crisis that took place in Chile during 2004 because of the interruption of exportations from Argentina, natural gas participates in the energy package with values close to 8% of the total and is evolving favorably. The industrial and residential sectors represent 92% and the remaining 8% corresponds to consumption in transportation and the commercial sector. With energy integration projects, a steady supply of this source of energy is expected. This way it would be able to substitute other more costly sources of energy. Likewise as a result of the crisis of the supply from Argentina, Chile has explored the possibility of creating a LNG terminal which could be supplied by Indonesia, Australia or Peru. In Latin America, as a result of the reduced trade with natural gas in relation to the gas that is produced, there is no real regional market, but rather national markets that have different levels of organization, maturity and market structures. Nevertheless, it is increasingly important in the energy package of the region and it is estimated that in a few years natural gas will become a tradable good which will generate a real global market you on. Estimates carried out by the Department of Energy of the United States consider that natural gas will be the primary source of energy with the highest growth rates in Latin America, with values that exceed 3.3% per year, as of 2005 until 2025. The perspectives for the immediate future of gas markets in Latin America and the Caribbean continue to be the generation of electricity, the expansion of industrial consumption and the development of LNG exportations. The quick rise in oil prices only underscores the urgency for countries that are dependent on the importation of oil, such as Chile, to consider the substitution for gas in their industrial sector. On the other hand, petroleum exporting countries such as Ecuador and Colombia –and needless to say Venezuela – are trying to use gas in their industrial sectors in order to export more oil. All the countries of the region are considering the use of gas for ecological reasons, given that it produces less atmospheric pollution than petroleum, and because it does not cause large displacements of ecosystems like with hydraulic systems. In short, Latin America and the Caribbean will continue to offer a significant potential for growth of the gas sector. Graph 13 presents a summary of the requirements of this source of energy until the year 2025. Achieving it will depend to a great extent on whether the new governments are able to attract private capital for the gas projects. It is well known that neither the governments nor the state owned companies of the region are able to finance their own plans. They need to look for partnerships with the private sector in order to realize the gas projects of tomorrow. It depends on them that transparent and coherent norms and regulations are instituted for the gas sector – especially regarding their application in industrial and electric projects– that they continue to attract private investors. It will also be essential that they develop pricing, royalty and taxing mechanisms that will allow good returns on the investment.

24
According to these estimates, consumption in the region will increase by 110% going from 9.7 TCF/D13
in 2005 to 20.6 TCF/D in 2025, and the industrial and electric power generation sectors will grow significantly with Argentina, Brazil, Colombia and Peru as the countries with the highest growth rates in consumption. Meanwhile, Venezuela and Bolivia are the countries in the region with the largest natural gas reserves.
Graph 13 DEMAND OF NATURAL GAS IN LATIN AMERICA
Source: BP Statistical Review of World Energy, 2005, OLADE and DOE EIA. 1.3.2.1 Natural gas energy integration In Latin America, there is a high potential for the integration of natural gas markets. “The experiences that other regions in the world have gone through show that regional energy integration is a difficult process, with opposing interests, where it's necessary to achieve a balance between protection and defense of national economic sovereignties and the advantages that market integration implies,” according to what CIER14 manifested. For this reason, it is necessary to define the approach that is being adopted for the problem that arises from the integration process, whether it is about the complementarity of resources or energy interconnections. In both of these approaches, a joint plan will always be necessary in order to progressively build an institutional and normative framework that will orient energy interconnections. There are different regional energy integration initiatives that aim towards a vision of energy consolidation. It is expected that these developments will allow the creation of a gas culture in all of the countries in the region. As part of the different integration initiatives in South America, a series of potential projects that aim towards a greater integration of the gas markets have been presented or are being studied.
13 TCF/D Tera Cubic Feet per Day. 14 Comisión de Integración Energética Regional (Regional Energy Integration Commission).

25
Currently there are studies underway for 12 interconnection projects in the South American continent. Among the integration initiatives regarding natural gas there is: the energy ring of the Southern Cone, which was proposed by Peru, Chile, Argentina, Uruguay, Paraguay and Brazil, whose governments agreed in June of 2005 to start a process for the integration of the natural gas market in South America and for the development of the Southern gas pipeline network. A task force was formed for that purpose with the participation of the above-mentioned countries and representatives from Bolivia attend as observers.
Graph 14 ENERGY INTEGRATION PROJECTS
Source: Energy Supply Study UPME-ANH. The ring is intended to reduce some country's dependence, mainly Brazil’s dependence, on Bolivian natural gas production, which has become unreliable in recent years due to the current controversy between petroleum companies and the government of Bolivia because of the implementation of the new hydrocarbon law in that country. As part of this initiative, a study has recently been initiated to evaluate the priority projects of the new gas pipelines that will allow a greater energy integration in this region. There is another initiative for a mega project that will start from Puerto Ordaz in Venezuela, and which along 8.000 kilometers, with a 5,000 MMCF/D capacity, will distribute gas throughout the Brazilian territory until it reaches Argentina, with an estimated cost of 20.000 million dollars. Currently Venezuelan, Brazilian and Argentine authorities studied the strategies for its construction. In case Bolivia joins the project, it is foreseen that the gas pipeline will extend from Resistencia to Campo Durán in Salta, passing through Formosa, which would complete a regional gas ring. The South American Gas Pipeline, as it has been called, will bring further energy integration to the region, but it will be difficult to prove its feasibility because of the competition of alternative sources of energy like the gas from Bolivia, or imported LNG, besides the environmental risks of crossing the Amazon and the Mato Grosso Swamp, obtaining pass through rights (State permissions in Brazil) and offshore gas developments in Brazil. Currently, there is significant transportation infrastructure for the international exchange of gas in the region, which will be concentrated in the Southern Cone, such as it is presented in table 1.

26
Table 1
MAIN INTERNATIONAL GAS PIPELINES
INTERCONNECTION GAS PIPELINE HPCD CAPACITY
Argentina - Chile Gas Atacama (zona Norte) 300
Argentina - Chile Norandino (zona Norte) 251
Argentina - Chile Gas Andes (zona Central) 318
Argentina - Chile Gas Pacífico (zona Central) 343
Bolivia - Argentina Pocitos – Campo Durán 265
Bolivia - Brasil Río Grande - Mutún 1.074 Source: BID, Análisis Arthur D. Little. There has been an increase in international flows of gas, but still they represent less than 20% of the regional demand, with the whole system reaching average exchanges of 1,520 MMCF/D, of which a high underutilization of the systems is evident. 1.3.2.2 Reserve monetization options In order to ensure the entry of the countries of the region into regional and global gas markets, the different options that technology offers must be studied. These are: liquefied natural gas (LNG), compressed natural gas (CNG), Gas to Liquid (GTL) and gas pipelines. LNG allows storing gas in liquid form in order to transport it across long distances between the production centers and markets. This technology has had incipient development in our continent. From the technical point of view there have been important and significant advances in the reduction of investment costs, in processing and transportation, thus helping to promote the competitiveness of this technology. There are several projects for the exportation of LNG in Latin America. Venezuela is thinking of exporting natural gas as LNG15. PDVSA, Dutch/Shell Real and Mitsubishi entered into a preliminary agreement to carry out a viability study for a LNG plant that would process natural gas from the Paria Peninsula. Trinidad and Tobago and Venezuela signed a memorandum of understanding with respect to the utilization of natural resources in their shared border; the agreement is the first of its kind in the Western Hemisphere. Taking into account that Venezuelan reserves are larger than those in Trinidad, and that Trinidad has sufficient infrastructure, it will provide the means to transport Venezuelan natural gas reserves. Bolivia is thinking about exporting LNG transported through gas pipelines to the coast through Peru or Chile. Although the construction of the pipeline through Chile makes sense from the economical point of view, the difficulties of a political nature, which date back to the last century, have not allowed the project to take shape. There is also on another project in Peru which would export gas from the Camisea field to the large markets of the United States and the coasts of the Mexican west. An exportation
15 LNG Liquefied Natural Gas.

27
agreement has been reached and the Peruvian liquefaction terminal is under construction. However, environmental difficulties have hindered further advances. In the case of CNG by means of maritime transportation is an alternative that is emerging as a competitive option for the development of isolated gas reserves. It is a simple process and it is special for moderate sized and distributed markets. Technological advances in this field have allowed the existence of designs with broad commercial operation possibilities. The economic and commercial competitiveness of CNG and LNG is in direct function of the distance from the reserves to the target market. Therefore, CNG is a profitable solution for local and regional markets. This technology is being analyzed and it seems like the best option to transport gas from the Guajira to Colón in Panamá. GTL technology monetizes natural gas reserves on global energy and chemical product markets by means of the production of liquid fuels and other gas products. It has many benefits in view of the high prices of oil and its products. Moreover, products with a very high quality and more value added are obtained. It's viability depends on construction costs and economies of scale. Studies carried out by the Society of Petroleum (SPE), point out that this technology is competitive in terms of investment and costs compared to the production of LNG. Regarding the development of GTL projects in Latin America, there are two studies underway, one in Cusiana and the other in Tarija in Bolivia. The last option is the construction of gas pipelines. The assumption is relatively simple to carry out and operate once the obstacles of the terrain are overcome. This requires stable markets and long term contracts and it is a good option when it is difficult to install regasification terminals. This is the option that has been evaluated the most on a Latin American level. The following table shows the difference regarding its operational guidelines and investment needs.
Tabla 2 OPTIONS FOR THE MONETIZATION OF NATURAL GAS RESERVES
VARIABLES GAS PIPELINE LNG CNG LTG
Adequate reserve size
5-8 TCP 5-8 TCP 1-5 TCP > STCP
Consumption and loss or (zero % feed)
> 6% 14-30% 5-8% 30-40%
Distance export market
< 2.000 km < 4.000 km < 4.000 km N/A
Capacity 1 BPCD Trains 770-1,000
MPCDS 500-1,000 MPCDS
In operation 34 KPD
Investment 1.06 -1.25 MUS$/km
Total >2.500 MUS$
Total >2.500 MUS$
25-30 MUS$/BPC
Source: Options for the Monetization of Gas Reserves ANH.

28

29
CHAPTER 2 NATIONAL ENVIRONMENT
2 NATIONAL ENVIRONMENT Chapter shows the historical behavior of Colombian economy by means of the main indicators (GDP, inflation, unemployment, exportations and importations, devaluation and international reserves) and the role of natural gas within the energy matrix of the country. Aspects related to the ”upstream” (exploration, production and supply) are considered, such as the modifications to the legislation, the state of reserves, and how the production and supply of natural gas has developed. Of the “downstream” (transportation and demand) the demand for gas in the country is analyzed as well as the transportation infrastructure, the coverage of the distribution with a special revision of the Exclusive Areas and the evolution of household installations and the use of natural gas as motor vehicle fuel.
2.1 Economy and energy At the end of 2005, Colombia’s macroeconomic balance was excellent, returning to its historical path of economic growth. The growth rate was over 5%, compared to 4.1% in 2004. This expansion was led by consumption, exportations and investment, in conditions of ample liquidity and low interest rates. Moreover, the inflation goal was met, tax revenue exceeded the government's goals and the exchange rate stayed at around $2,250, indicating a significant revaluation of the peso relative to the American dollar, according to the indication of the Departamento Nacional de Planeación (DNP) (National Planning Department). The GDP has had a stable behavior with a tendency to increase, without abrupt changes and the 2003-2005 period. Growth in 2004 was higher than the initial goal of 3.6% and similar to the one achieved in 2003 (4%) this positive result shows that the growth dynamics of the economy is sustainable on the long-term. Exportations sped up their expansion rhythm during 2005 and thanks to high international prices of the group of traditional exportations, growth exceeded 42%. In 2005 the deficit in the current account reached close to 1.0% of the GDP, which is similar to what was recorded in 2004, while the capital and financial account closed the year with a surplus in the order of 1.5 billion dollars (1.2% of the GDP). It is estimated that these figures will be useful to finance the 1.2 billion dollar deficit in the current account, and for a 421 million dollar increase in international reserves. These indicators describe a progressively favorable economic panorama that is consistent with the recovery of industrial and commercial trust and an improvement of the conditions for

30
investment although according to the businessmen that were surveyed, they are still cautious, with new projects such as the expansion of production plants or the exploration of new businesses.
Gráfica 15 QUARTERLY EVOLUTION OF THE GDP
Source: DANE. In 2005 the lowest level of spreads16 was recorded since 1995, which indicates a lower level of risk and greater trust by foreign investors. It is worth noting that Colombia already reached the level of Peru, and is third in Latin America. Altogether, better expectations of businessmen, low levels of spreads, more liquidity and low interest rates, joined to the sustained descent of inflation, have allowed generating a level of private investment of 14.9% of the GDP, the highest level since 1997, according to what was manifested by the DNP. The sustainability of public finance and the reduction of the debt have contributed to this excellent result of the economy. In 2005, the Consolidated Public Sector recorded a fiscal balance in equilibrium, a level that had not been reached since 1994. The National Central Government's adjustment of 1.2 points was important for this, as well as the 58% increase of tax revenue, going from $27 trillion to $42.7 trillion. On the other hand, the net debt of the Non-Financial Public Sector has decreased 11.2 percentage points since 2002. The advances in the fiscal cleanup of local governments must be highlighted as part of the consolidation of a decentralized State. All of the above indicates that 2005 will be recorded in history as a notable year in terms of the macroeconomical policy due to the upturn of the GDP and the drop in the inflation rate. The nonrestrictive internal monetary policy, which simultaneously meets the objective of maintaining the buying power of Colombian people and maintaining low interest rates was another determining factor to encourage the good performance. Likewise, the dynamics that the construction and financial sectors have been showing will be a key pillar when it comes to consolidating a greater growth rate. On an international level, there are several factors that positively affect our economy. Among these, it is worth mentioning the recovery that the United States and Venezuela economies
16 SPREAD: financial term related to the additional margin of interest that is collected on benchmark bonds.

31
have gone through and the high international prices of primary products such as coffee, coal and petroleum as a response to the increase in global demand. In addition, with the country's commercial policy, not only the CAN-MERCOSUR agreement, but also the negotiations of the FTA with the United States and the FTAA, an increase in national and foreign investment is expected, even before these agreements are signed. The main reason is the stability in the rules of the game that is generated with the agreements. This increases the country's credibility and improves foreign investors perception. On the other in, it is expected that the domestic productive sectors that are trying to improve their international competitiveness, will invest in technology and capital goods, in order to project themselves on the international market. The recovery of the growth in the main industrialized economies in the world will have a favorable impact on the better performance of Colombian economy, as well as on Latin American economies in general. 2.1.1 Main economic indicators In general terms, the performance of the economy during 2005 continued with the same trend of 2003. The decreasing tendency of inflation continued as well as the unemployment rate although unemployment is still high.
Tabla 3 INDICADORES ECONÓMICOS 2000–2005
2000 2001 2002 2003 2004 2005
GNP Growth (%)
2.92 1.47 1.93 4.11 4.01 5.19
Domestic inflation (%)
8.75 7.65 6.99 6.49 5.50 4.85
Perfomance rate (%)
14.94 15.32 13.91 13.43 11.8
Export Growth (%)
13.27 6.30 -2.87 9.63 27.43 4.15
Import Growth (%)
10.08 9.08 -0.83 9.46 20.00 3.12
TRM average ($/dollar)
2,088 2,300 2,506 2,876 2,628 2,321
Average devaluation (%)
22.71 18.14 2.49 23.78 -2.24 -16.65
Gross 9,006 10,245 10,844 10,921 13,540 13,819
32
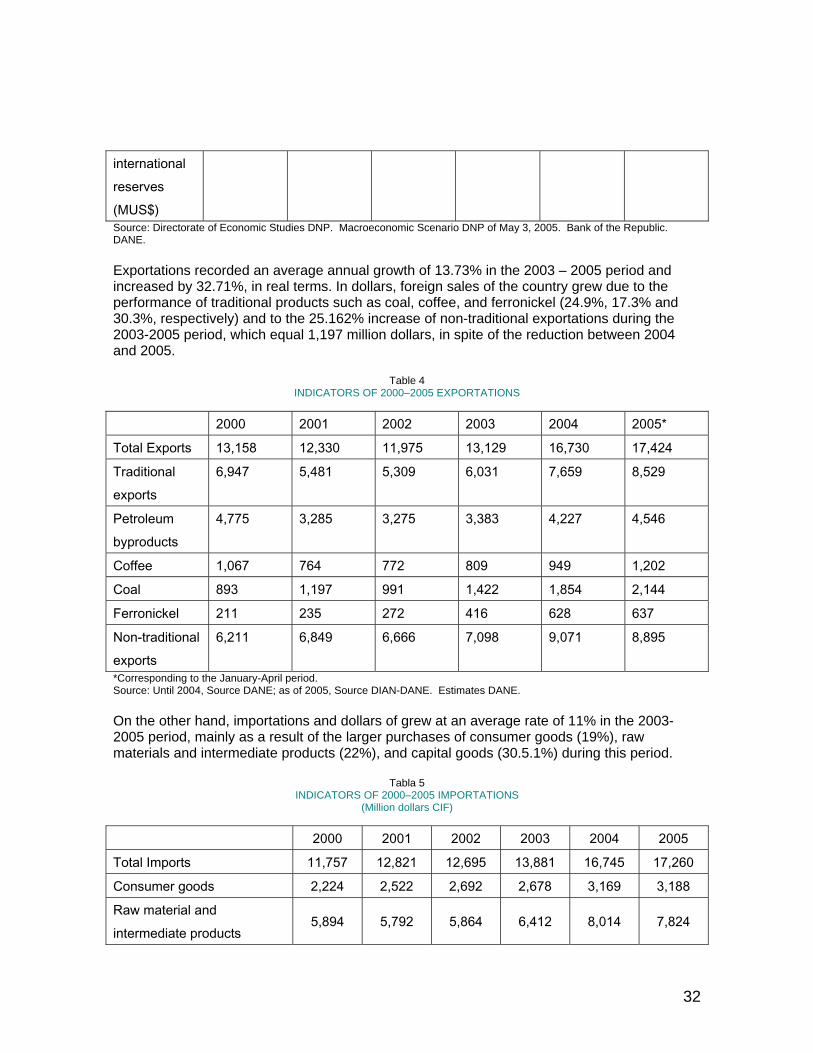
international reserves (MUS$) Source: Directorate of Economic Studies DNP. Macroeconomic Scenario DNP of May 3, 2005. Bank of the Republic. DANE. Exportations recorded an average annual growth of 13.73% in the 2003 – 2005 period and increased by 32.71%, in real terms. In dollars, foreign sales of the country grew due to the performance of traditional products such as coal, coffee, and ferronickel (24.9%, 17.3% and 30.3%, respectively) and to the 25.162% increase of non-traditional exportations during the 2003-2005 period, which equal 1,197 million dollars, in spite of the reduction between 2004 and 2005.
Table 4 INDICATORS OF 2000–2005 EXPORTATIONS
2000 2001 2002 2003 2004 2005*
Total Exports 13,158 12,330 11,975 13,129 16,730 17,424
Traditional exports
6,947 5,481 5,309 6,031 7,659 8,529
Petroleum byproducts
4,775 3,285 3,275 3,383 4,227 4,546
Coffee 1,067 764 772 809 949 1,202
Coal 893 1,197 991 1,422 1,854 2,144
Ferronickel 211 235 272 416 628 637
Non-traditional exports
6,211 6,849 6,666 7,098 9,071 8,895
*Corresponding to the January-April period. Source: Until 2004, Source DANE; as of 2005, Source DIAN-DANE. Estimates DANE. On the other hand, importations and dollars of grew at an average rate of 11% in the 2003-2005 period, mainly as a result of the larger purchases of consumer goods (19%), raw materials and intermediate products (22%), and capital goods (30.5.1%) during this period.
Tabla 5 INDICATORS OF 2000–2005 IMPORTATIONS
(Million dollars CIF)
2000 2001 2002 2003 2004 2005
Total Imports 11,757 12,821 12,695 13,881 16,745 17,260
Consumer goods 2,224 2,522 2,692 2,678 3,169 3,188
Raw material and intermediate products
5,894 5,792 5,864 6,412 8,014 7,824
33
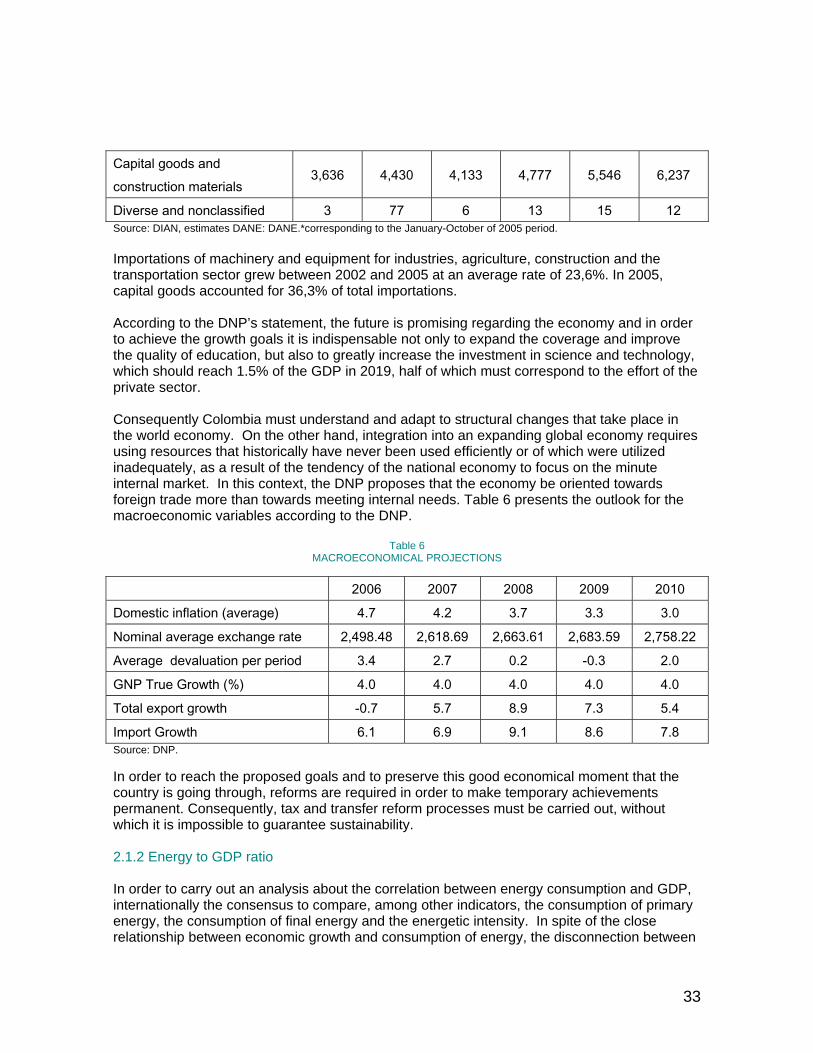
Capital goods and construction materials
3,636 4,430 4,133 4,777 5,546 6,237
Diverse and nonclassified 3 77 6 13 15 12 Source: DIAN, estimates DANE: DANE.*corresponding to the January-October of 2005 period. Importations of machinery and equipment for industries, agriculture, construction and the transportation sector grew between 2002 and 2005 at an average rate of 23,6%. In 2005, capital goods accounted for 36,3% of total importations. According to the DNP’s statement, the future is promising regarding the economy and in order to achieve the growth goals it is indispensable not only to expand the coverage and improve the quality of education, but also to greatly increase the investment in science and technology, which should reach 1.5% of the GDP in 2019, half of which must correspond to the effort of the private sector. Consequently Colombia must understand and adapt to structural changes that take place in the world economy. On the other hand, integration into an expanding global economy requires using resources that historically have never been used efficiently or of which were utilized inadequately, as a result of the tendency of the national economy to focus on the minute internal market. In this context, the DNP proposes that the economy be oriented towards foreign trade more than towards meeting internal needs. Table 6 presents the outlook for the macroeconomic variables according to the DNP.
Table 6 MACROECONOMICAL PROJECTIONS
2006 2007 2008 2009 2010
Domestic inflation (average) 4.7 4.2 3.7 3.3 3.0
Nominal average exchange rate 2,498.48 2,618.69 2,663.61 2,683.59 2,758.22
Average devaluation per period 3.4 2.7 0.2 -0.3 2.0
GNP True Growth (%) 4.0 4.0 4.0 4.0 4.0
Total export growth -0.7 5.7 8.9 7.3 5.4
Import Growth 6.1 6.9 9.1 8.6 7.8 Source: DNP. In order to reach the proposed goals and to preserve this good economical moment that the country is going through, reforms are required in order to make temporary achievements permanent. Consequently, tax and transfer reform processes must be carried out, without which it is impossible to guarantee sustainability. 2.1.2 Energy to GDP ratio In order to carry out an analysis about the correlation between energy consumption and GDP, internationally the consensus to compare, among other indicators, the consumption of primary energy, the consumption of final energy and the energetic intensity. In spite of the close relationship between economic growth and consumption of energy, the disconnection between

34
these two variables has been proven in some industrial countries, mainly due to the use of more efficient industrial processes and technologies which are being transferred to countries like Colombia. According to graph 16, (next page) as of 1996 a disconnection is seen between the GDP and energy consumption, coinciding only when the reforms of the energy sector started to become operational. Such important milestones as the coming into force of the wholesale market or the coming into operation of the main gas pipeline network in inland Colombia took place that year. Bearing in mind that the behavior of the consumption of some goods is seasonal because it depends on factors other than use itself , it is recommendable to carry out individual comparisons of the behavior of consumption by source of energy and the evolution of the GDP. (See graph 17).
Graph 16 CONSUMPTION OF ENERGY AND GDP
Graph 17 CORRELATION OF THE GDP AND ENERGY CONSUMPTION BY SOURCE

35
It can clearly be seen that the natural gas curve is showing the importance of the Mass Consumption Plan, but its fast growth in recent years makes it impossible to establish any correlation with the GDP. In the meantime, the behavior of electric, diesel fuel and GDP indexes show a high correlation, which means that the economic growth of the country, implicitly leads to a greater demand for electricity, as well as the mobility particularly of the load; this does not happen with the behavior of gasoline consumption, which shows a significant reduction. When growth rates are examined, it is clear that although electricity and diesel fuel show a correlation with the GDP, the trend of electric energy follows the GDP much better than diesel fuel. Around 2002, diesel fuel consumption had an extreme growth rate, which can be explained by the closure of the Venezuelan border during more or less one quarter. This can be reflected in the abrupt descent during the same year. Regardless of this phenomenon, the increase in consumption rates which is associated with the transportation sector, is due to the increase in the number of motor vehicles and even more on traffic in general, in spite of smaller specific consumptions which reflect technological advances of vehicles.
2.2 The Energy Matrix Total internal consumption of energy in 2005 was 1,107 tera BTU, which represents a 0.9% increase with respect to 2004 when it was 1,095 tera BTU.
Graph 18 INTERNAL CONSUMPTION OF ENERGY

36
In the 2000–2005 period the average annual consumption rate of primary energy rose by 0.7%, whereas total consumption of energy rose by 0.30%, and the final energy rate increased to 0.28%. This means that consumption of energy in the last decade has risen at low rates, and in real terms it has been going through an energy source substitution phenomena. The energy matrix still shows petroleum as the primary source of energy with the greatest consumption with 49.1% of the nation's total, 20.6% which corresponds to natural gas, hydro energy with a 12.8% share, firewood, and bagasse 9.2% and coal with a 7.2% share. Throughout the last decade, petroleum's share remained relatively stable within the internal supply of energy; the other sources of energy such as coal, natural gas, hydroelectricity and firewood modified their share within this country's supply, mainly due to the substitution that is taking place from less efficient sources of energy to others which are more efficient, basically in residential sectors (firewood for natural gas), transportation (gasoline for diesel fuel) and in thermal generation of electricity (coal for natural gas). The following is the evolution of final consumption of energy by source of energy in the country and to share that each source of energy has in the package in the time horizon analyzed.
Graph 19 EVOLUTION OF THE FINAL CONSUMPTION OF ENERGY

37
It is clear that firewood effectively reduced its share as an energy component, having a strong decline equal to 53.6% between 1985 and 2005. Gasoline had the same luck with the steepest decline in 2000. Natural gas significantly increased its share, going from 5% in 1985 to 13% in 2005, mainly because of the plan for the massive consumption of gas. However, petroleum and petroleum products reduced their share in the energy package by 8.1% between 1985 and 2005. Even though they are the major sources in the energy package. Coal consumption oscillated between 8% and 11% in the analysis horizon, with some fluctuations in the last decade, which have depended basically on the internal price. Electricity increased its share of 10.3% in 1985 to 15.4% in 2005. On a national level, the increase in the consumption of electricity is linked to economic growth and the development of cities and the countryside. This allows zones that are far away from the large consumption centers to have access to this service. In the Non-Interconnected Zones (ZNI) the consumption percentage tends to increase due to the funds that support electricity and development projects for a zones that are not connected to the National Interconnected System. The growth of other fuels, which include no energéticos and charcoal, are a reflection of the diversification of consumption.
2.3 Upstream Situation for Natural Gas The so-called “upstream” stage comprises the exploration, production and transportation activities or links of natural gas as far as the source of the main gas pipeline. The physical behavior of these activities will be described using this scheme. 2.3.1 General aspects

38
In Colombia, the hydrocarbon potential is located in 18 sedimentary basins which cover most of the national territory, about 1,036,450 kms2. Based on the levels of exploration and production activities, Colombian sedimentary basins may be classified into two large groups: Basins with production and Basins without production. In the first group we have the: Valle Superior basin, the Middle and Lower Magdalena, Llanos Orientales, Putumayo, Catatumbo and La Guajira basins, with very good geological, geophysical and technical knowledge of these basins. Among the basins without production we have: Caguán – Vaupés, Amazonas, Cesar – Ranchería, Cordillera Oriental, Cauca-Patía, Urabá, Chocó, Pacífico, Tumaco, Sinú–San Jacinto and Cayos which correspond to areas with a lesser degree of available geological and geophysical information, where hydrocarbons have not been discovered on a commercial level. The main fields for exploitation are located in the Llanos Orientales region and in La Guajira. Other production fields are also located in the basins of the Valle Medio and Valle Superior, as well as in Catatumbo. Of the 96 TCF of natural gas that correspond to the potential reserves, 56% (that is approximately 54 TCF) are located between the basins of the Llanos Orientales, Valles Superior, Medio and Inferior of the Magdalena, the Putumayo and La Guajira. The remaining 42 TCF of natural gas are distributed among the basins that are not currently in production. 2.3.2 Exploration As a fundamental part of the change that was made in the petroleum policy, the National Government through the National Hydrocarbon Agency defined the new contracting framework to encourage investments in the hydrocarbon sector, whose main element is the reduction of the state's share from 70% to 50%, which will improve companies’ profitability. With this new scheme and high oil prices, exploration activities have reacted positively and acquired the same dynamism that was seen in the early 90s. It is worth noting that in hydrocarbon exploration activities there is no difference between the search for gas and petroleum; therefore, the operations are the same and only drilling wells confirms what type of hydrocarbon is found. In this sense, as well as petroleum may be found, natural gas may also be found in the contracts that are signed are in general terms to search for hydrocarbons. In graph 20 we present the evolution of signing contracts under the new contractual framework.
Graph 20 EVOLUTION OF SIGNED CONTRACTS

39
Source: ANH. However, geological studies allow estimating with reduced probability the type of hydrocarbon that may be found. Under this premise, the Tayrona (on the Caribbean coast), Esperanza (lower valley of the Magdalena River) and La Creciente (lower valley of the Magdalena River) contracts were signed in 2004 for the search and maximization of natural gas reserves. During 2005 31 exploration contracts were signed with an area of 2,826,000 hectares, which are distributed mainly in the basins of los Llanos (including Caguán), Valle Superior (VSM) and Medio (VMM) of the Magdalena River, Catatumbo and Putumayo. Likewise, 28 technical evaluation contracts were signed, most of them located in the basin of los Llanos. Until August of 2006, 25 exploration and production contracts had been signed as a less 12 technical evaluation contracts, exceeding the goal set forth by the National Government for 2006. With the results that were achieved concerning contracting, it is expected that in the medium-term new hydrocarbon reserves will be added to those that are currently available, as well as finding additional reserves of gas that is associated to the petroleum exploration program. 2.3.3 Reserves In Colombia, there are two regions where 85% of the Natural Gas reserves are located; the first is in the north of the Caribbean Coast in the fields of Ballena and Chuchupa, and the second region is located in the region of the Llanos Orientales (eastern lowlands) and Piedemonte llanero in the fields of Apiay, Cusiana and Cupiagua. According to the information provided by ECOPETROL S.A. to December 31, 2005 the country had 7,311 GCF17
with total reserves of natural gas: 3,994.9 GCF of proved reserves, (of which 1,810.1 GCF art developed reserves and 2,376.8 GCF are not developed) and 1,709.6 GCF not proved reserves. There are also 937.2 GCF that are projected for consumption in the operation of the fields (generation of electricity for the operation, operation of compressors, thermal treatment, operation pumps, among other uses), which may be available for the market in the future, and 600 GCF from Gibraltar. In graph 21 the evolution of gas reserves can be seen.
17 Giga Cubic Feet.

40
Graph 21
EVOLUTION OF NATURAL GAS RESERVES
Source: ECOPETROL S.A. Commercial gas reserves, and soon to be commercialized (marketed?) reserves increased by 43.8 GCF with respect to 2004. This figure corresponds to the change in the economic limit of the Fields of the Chuchupa-Ballena, Guepaje, Opón and Las Monas areas (20 GCF), greater gas sales in the fields of the Chuchupa-Ballena and Piedemonte areas (28.5 GCF), for drilling and better behavior of production in the fields of the De Mares areas and the Las Monas contract (40,2 GCF), decrease due to reevaluation of the sales forecast in the fields of the Del Río area (6.2 GCF), decrease due to the effect of the change in the economic limit in the Chuchupa –Ballena area (36.8 GCF) which generated a reclassification of developed proved and not proved reserves of 23.6 GCF, less behavior than what was expected in the Montañuelo and Cerrito fields (1.9 GCF). 36% of the proved reserves are in a marketing (commercialization?) process, and there are also some not proved reserves of 1,779 GCF, which do not have a definite marketing a scheme. According to the previous graph, total reserves have been maintained almost at the same level during the last five years with values close to 7,000 GCF, except in 2003 when the rhythm of additions was less than consumption. In general terms the growth rate of reserves has been similar to the growth rate of consumption. This has allowed replacing growing volumes of consumption. It is necessary to note that since 2002, a new reported reserve category is used, and these are reserves destined for consumption in field operation. Of the total, 10.8% is under direct operation by ECOPETROL S.A. including Gibraltar, whereas 89.2% is under the partnership modality which corresponds to 6,517 GCF. 2.3.4 Reserve to production ratio The reserve to production ratio (R/P) varies every year depending on the amounts produced, considering that there are no new findings. In order to do the calculation of the ratio, the internal demand for gas was taken as the production scenario, adding the exportations to Venezuela starting in 2008 and to Panamá starting in 2007.

41
According to the results presented in graph 22, the current R/P ratio is 26 years, with an abrupt reduction until 2008. After this year, the slope is not so steep basically due to the reduction of the rates of increase of electric consumption. As it is set forth in Colombian regulations, gas exportations will only be feasible when the country has a reference R/P ratio of more than 7 years. This is done in order to guarantee the national supply of natural gas. Exportations, therefore, must be suspended around 2014, taking into account what was defined in Decree 3428 of 2003.
Graph 22 RESERVE TO PRODUCTION RATIO
Is worth noting that the reference R/P ratio that was defined by the Ministry of Mines and Energy for March 31, 2005 was 14.94 years, taking into account that reference reserves were 4,186.9 GCF and reference production was 280.2 GCF. This means that the 7 years will be reached around 2010, in case we continue without adding new natural gas reserves, and that production fluctuates like total gas demand does. Although it is a disturbing situation, it is necessary to start actions that will allow turning this trend around and thus maintain the contribution of the energy sector to the balance of payments by means of natural gas exportations, and at the same time guaranteeing that the internal demand is covered. 2.3.5 Production and supply Gross Production of natural gas includes gas lift, flared gas, gas consumed in field operations, gas to the plant and gas delivered into the gas pipelines, unlike the supply which only refers to the gas that is delivered into the gas pipeline for its corresponding consumption in the sector. 2.3.5.1. Gross production During 2005 gross production was 3.54 GCFD which declined by 3% with respect to 2004, the year of the largest production during the five years. The growth of the average interannual production rate was 1.5% in the same period. This information is shown in graph 23.
Graph 23

42
PRODUCCIÓN DE GAS NATURAL
Source: Ministry of Mines and Energy. During 2005, only 5 fields (Ballena and Chuchupa in La Guajira and Floreña, Cusiana and Cupiagua in the Piedemonte Llanero), account for 94.2% of the production, which has been stable since the last decade. Cusiana with 40% and Cupiagua with 41% are the largest producers of natural gas in Colombia. The production of the Llanos Orientales basin accounts for 81% of the national production, and the production of La Guajira equals 13%, while the remaining 6% comes from fields which are located throughout the country with minimal contributions and which cover the basins of Valle Medio and Valle Inferior of the Magdalena and Sinú rivers. During the last year the production of all the fields dropped, in some of them due to the reservoir's own decline and in others such as Floreña due to the decrease of the generation of electricity based on gas, which exclusively demands this gas. The production of the Chuchupa field has been declining at a higher rate than expected, which made it necessary to move forward the drilling of three development wells with respect to contractual commitments. The production of the smaller fields which corresponds to the category of “others” in Graph 23, has increased since 2003, which confirms the breaking away from them downward trajectory that they had been showing in the last 10 years. This behavior is the result of the work carried out by the operators of said fields, which are aimed at maintaining an increasing production. As of September of 2005 the operation of the Cusiana treatment plant started with a capacity for 180 million cubic feet per day. For this reason of the natural gas that is produced in Cusiana and Cupiagua, only 4% which equals 107 MMCF/D was used for the consumption of the sector, the remaining volume was reinjected into the reservoir in order to increase the production of petroleum. In the case of La Guajira, where the fields have shown a fast decline, it is expected that with the work that started at the end of 2005 its production capacity will increase by 34% reaching 700 MMCF/D. That is, as of March of 2006, the country will have a maximum capacity of production in the order of 900 MMCF/D.

43
It is convenient to point out that the production capacity of natural gas exceeds the expected average demand and it may attend exceptional consumptions of the electric sector during the occurrence of climatic phenomena. The fluctuations in this sector’s demand is particularly important, given that it accounts for 35% to 40% of the total consumption of natural gas, due to the high hydroelectric component of the generation facilities. 2.3.5.2 Supply The volumes of natural gas production and the volumes of supply for internal consumption cannot be compared due to the fact that most of the production is reinjected into the reservoirs in order to maintain the recovery of oil. This is why, although Cusiana and its neighboring fields are the greatest producers, the fields of La Guajira supplied the greatest share of gas for internal consumption. The supply coming from the fields of La Guajira and from the Piedemonte Llanero account for 90.1% of the national supply and all the smaller fields together supply the additional requirements. In Graph 24 it can be seen that La Guajira has been the support of the plan to achieve the massive use of gas, not only to meet the requirements of the Atlantic Coast, but also of inland Colombia. A global increase of 7% was recorded in the supply of natural gas, going from 596 MMCF/D in 2004 to 637 MMCF/D in 2005, which shows an important recovery of this fuel’s market.
Graph 24 SUPPLY OF NATURAL GAS TO THE TRANSPORTATION SYSTEM
Source: ECOPETROL S.A. As it has been normal in recent years, the supply of gas from La Guajira has accounted for an average of close to 80% of the total, in spite of showing a certain degree of decline which is inherent of the geology of this type of reservoir. Nevertheless, it is still the major source of national supply. During the same period that can be seen in the graph, the reservoirs of Cusiana have gradually started to increase their share, while the fields located in the area of Santander have maintained their share at around 5%, with a slight increases in the last two years. There is another small group of fields which are distributed in the north and south of the country, who share in the supply had been decreasing due to the decline of their production, but thanks to the works carried out in the fields, they have been able to maintain their share, although as a whole they represent minor amounts. The same situation is taking place with the

44
Apiay field, which supplied the demand of Bogotá during many years and whose production is gradually declining, therefore, it has only supplied gas for the Apiay refinery as of 2007. Work has been intensified in order to increase the supply of natural gas, such as the case of the implementation of the 180 MMCF/D plant in Cusiana and the drilling of three wells in the Chuchupa field. In this context, the production of associated gas starts to take on great importance in the scheme of its supply and demand. This way, the expansion of the internal supply will be concentrated geographically in the inland in the case that no new reserves are found. When the supply of gas comes from associated gas, some concerns arise since the production of gas in this type of reservoirs directly depends on the production of liquids that are associated to it. However, the importations of natural gas coming from Venezuela as of 2012 (according to information provided by the Ministry of Mines and Energy) will increase the supply of gas, with which the supply and demand may be balanced. 2.3.6 Extension of association contracts The analysis of the “UPSTREAM” is worthy of a special mention due to the legal changes that took place in association contracts with the objective of making more investment by the Associates viable in the marginal stage of the fields that are being exploited. Pursuant to the provisions of CONPES Document 3245 of September 15, 2003, it was recommended that the National Hydrocarbons Agency and ECOPETROL S.A. adopt and apply the strategy of extending in time the association contracts which are in force until their economic limit and that they defined the terms and conditions that will allow generating additional production in the current fields, thus increasing not only the levels of production but also recovery factors and therefore their base of reserves. Moreover, this measure was aimed at promoting the exploration of hydrocarbons in Colombia by means of investments carried out by the associates as part of the commitments that they assume within the complementary covenants to the extension agreements. This way, as they increase exploratory activities, they are intensifying the possibilities for the discovery of new reserves in the country. In the development of this strategy, ECOPETROL S.A. agreed on the terms and conditions of the expansion in time of the association contract with the associate company under the approval of the National Hydrocarbons Agency. The extension of the Guajira Association contract, which was entered into initially in 1974 by and between ECOPETROL and Texas Petroleum Company (now CHEVRON) was made by means of an addendum to the contract of December 16, 2003 until its economic limit, with the following agreements: The Associates invests 100% of the capital requirements for the performance of the required activities which will allow the exploitation of the field. They will share the production by 53% for ECOPETROL and 43% for the associate, after the royalties which are maintained at 20%. They will share the costs of abandonment of the fields, which due to the fact that they are offshore fields may turn out to be very important sums. They will share the payment of the

45
BOMT18 of the Chuchupa B platform (57% Ecopetrol, 43% associate) and guarantee the
performance of the performance of three additional wells, considering that the owner of the Chuchupa B platform is Guajira Gas Services (subsidiary of CHEVRON), who must endorse the drilling of the wells. 2.3.7 Prospective study of natural gas Currently, there is an intense hydrocarbons exploration program underway which is aimed at incorporating new natural gas reserves as well as expanding the capacity of production, in order to provide a greater reliability to the system and to guarantee the internal supply and natural gas exportations. The joint effort of the government and the companies to incorporate new natural gas reserves and to maintain the levels of production above the requirements in order to guarantee the full and timely supply of this fuel, gave rise to an evaluation carried out by the National Hydrocarbons Agency and by the UPME in order to analyze the future situation of supply The above brought about the realization of an exercise where four reserve incorporation scenarios were studied, taking into account the current exploration projects, the programs of improved recovery or new developments and discoveries to be made. The different scenarios take into account the development of greatly important projects as to the possibility of incorporation of reserves and of diverse and find the regions where production is to be obtained. In Graph 25 the figures that were found for each one of the scenarios are shown. The abundance scenario takes into account the incorporation and development of 34.4 TCF, which come mostly from the results of the current exploration projects and whose investments range around 16.9 billion dollars in the next 20 years. The petroleum bias scenario, as well as the abundance scenario, incorporates the largest amount of gas reserves as a result of the current exploration projects. The investments required for the finding of 1.2 new TCF and their development are close to 5.0 billion dollars.
Graph 25 PROSPECTIVE STUDY OF GAS RESERVES
18 BOMT: Build, Operate, Maintain and Transfer.

46
Source: ANH Supply Study. On the other hand, the gas bias scenario, as well as the two previous ones, incorporates 30% of the estimates in the current exploration projects. The scenario takes into account a total increase of 22.6 TCF, a figure that is higher than the petroleum bias scenario and lower than the figures of the abundance scenario, whose investments are estimated at 10.4 billion dollars. Finally, an adverse scenario was considered, in which 6.0 TCF are discovered and developed in the next 20 years and the greatest contributions originate in the exploration of the three contracts that are being performed in the basins of northern Colombia. The necessary investments to achieve the goals are close to 2.9 billion dollars. With these premises of reserves different production curves are obtained for each one of the scenarios that were studied. These were calculated based on the maximum production, which may be different from the actual production. Graph 26 shows the production curves that correspond to the four scenarios that were evaluated. Except in the shortage scenario, levels of production of more than 1.000 MMCF/D can be seen in the short term, with the growing volumes that allow developing new projects, that would be aimed at developing exportations of this fuel or their use for the production manufactured products which would give a greater added value to the country. The gas production scenario is shown independently with the current reserves and the inclusion of importations coming from Venezuela, as a backup measure for the attention of the internal demand, assuming that there are no discoveries of gas in the years to come.
Graph 26 PROSPECTIVE STUDY OF PRODUCTION

47
Source: ANH-UPME Supply Study. By observing graph 26 it can be seen that in spite of the decline of the fields of la Guajira, including the drilling of three wells and the compression work done towards 2009, their loss will be compensated by a gradual increase in the production of the Piedemonte Llanero fields and the development of the Gibraltar field as of 2009 with a production in the order of 30 MMCF/D. In 2008, the maximum contribution of the internal supply can be seen with figures close to 1,000 MMCF/D, and later there is an average yearly reduction of 3%, which equals 90 MMCF/D towards 2011. This situation is reversed with the importation of 150 MMCF/D from Venezuela. However, the importations of natural gas coming from Venezuela as of 2012 (according to the information provided by the Ministry of Mines and Energy), will increase gas supply with which the supply and demand may be balanced. The Floreña field, which is located among the fields of the Piedemonte maintains a constant profile of 23 MMCF/D in the analysis horizon, while the area of Santander continues on a downward path, as well as the category of other fields, all of which are located inland. A fast look at the production forecasts shows that the contribution of free gas to the total supply starts to decrease its share, which implies less flexibility in the supply; therefore, gas production will directly depend on crude production. The .
Graph 27 PRODUCTION FORECAST

48
Source: ECOPETROL and BRITISH PETROLEUM. In the current situation, the supply of natural gas depends on two large production centers which are geographically located in different regions. This affects not only the markets that can be supplied, but also the physicochemical properties of the gas and therefore the way to produce and treat it so that it may be delivered to the final users. With this short-term perspective, the limitations for the integration of the inland and coastal markets seem to increase, besides explicitly pointing out the presence of two monopolies, where the participation of a sole agent producer, suggests a greater participation of regulations to avoid possible abuse of a dominant position.
49

50
CHAPTER 3 DOWNSTREAM SITUATION for NATURAL GAS
3 DOWNSTREAM SITUATION FOR NATURAL GAS The term “Downstream” within a chain of energy and particularly in the case of natural gas, refers to the set of activities that involve the processed gas that is used for consumption in the different sectors of demand, whether it is used as a fuel or as a raw material. In other words, it has to do with the activities that are related to the way that natural gas is brought from the time that it is injected into a gas pipeline under quality specifications, and it is transported to the point of its final use. This process comprises transportation, distribution, marketing and demand.
3.1 General Aspects In Colombia, there is a 3,882 km gas transport system which covers the demand of approximately 42% of Colombian homes. The development of the gas mass consumption plan started in the 90s. The objective was to decrease the dependence on only one fuel in the residential sector and to expand the options in the other sectors of consumption. With the global trend toward the integration of energy markets in the construction of electric and gas interconnections in the South American region, in Colombia the process of exportation of natural gas to Panamá and Venezuela is underway. The growth of the demand during 2005 reached 7.16%, while in 2004 it was 4.31%. Motor vehicle transportation had the largest increase during the same two years, with 54.3% and 36.1% respectively. This originated particularly due to the withdrawal of subsidies for liquid fuels, which makes the option of vehicle conversion to natural gas attractive for those users whose daily consumption of fuel allows recovering the investment in short periods that do not exceed six months.
3.2 Transportation The National Transportation System of Colombian natural gas links the gas production centers with the consumption centers, excluding dedicated connections and gas pipelines, distribution systems, non-regulated users, international interconnections and storage systems19.
19 Resolución CREG 001 de 2000.

51
The National Gas Pipeline Network comprises two subsystems that are clearly defined by their property and operation, as well as their functioning. On one side we have the Atlantic Coast subsystem with the Ballena-Barranquilla-Cartagena-Cerromatoso line, which belongs to PROMIGÁS, a private company with foreign capital shares through ENRON from the United States. On the other side we have the subsystem that mainly comprises the Ballena-Barrancabermeja-Vasconia-Cali, Cusiana-Apiay-Bogotá and Cusiana-La Belleza-Vasconia-Cali lines, which belong to ECOGAS, plus the Sebastopol-Medellín lines that belong to the company TRANSMETANO, Payoa-Provincia-Bucaramanga belonging to TRANSORIENTE, Yumbo-Cali delivery station belonging to TRANSOCCIDENTE, Hobo-Neiva production field belonging to PROGASUR, Cogua-Bogotá station that belongs to TRANSCOGÁS and the Tolima Gas Pipeline, which comprises two small lines, is known as the inland transportation subsystem. The eight natural gas transportation companies that currently operate in the country are: PROMIGÁS, ECOGAS, TRANSMETANO, TRANSCOGÁS, TRANSOCCIDENTE, TRANSORIENTE, GASODUCTO DEL TOLIMA and PROGASUR. The evolution of the transportation system of the Atlantic Coast, unlike the inland, was fully established before the beginning of the gas plan of the 90s. As of that date, it was necessary to carry out expansions with new regional gas pipelines in order to expand the coverage to more people given that the large markets were already covered and developed by the main transportation system at the time. The transportation system of the inland was developed as the main axis of the Gas Mas Consumption Plan. However, before the Plan, the country had small regional gas pipelines, which supplied towns that were located near the production field. These were: the Apiay-Bogotá Gas Pipeline and the Payoa Provincia-Bucaramanga Gas Pipeline. The characteristics of the transportation infrastructure and the share in the volume that is transported are shown in table 7.
Table 7 VOLUME OF TRANSPORTED NATURAL GAS
GAS PIPELINE LENGTH
Km CAPACITY
MPCD
VOLUME TRANSPORTED 2005
MPCD
Promigás 575 480 319.6
Ecogás 2,451 300* 270.8
Transcogas 60 100 62.57
Transoccidente 340 75 26.7
Transmetano 145 75 25.5
Transoriente 158 47 12
Gasoducto del Yolima 46 5 1.8
Progasur 62 5 1.3
52
*Average volume adding the different sections. The transportation systems moved an average of close to 720.2 MMCF/D during 2005, of which 44.3% corresponds to the system of the Atlantic Coast, followed by the ECOGAS system which transported 37.6% of the national supply. Transcogás, the line that connects the Central-Eastern gas pipeline of ECOGAS with city of Bogotá, has been increasing its share and during 2005 it transported 8.7% of the total gas that was transported. The other gas pipelines are lines that are connected whether to the ECOGAS system, or to fields with small production and serve delimited areas. Graph 28 shows the gas pipeline system. (See the next page). The Transoccidente and Transcogás gas pipelines were initially built as part of the distribution systems of the cities of Cali and Bogotá respectively. However, as a result of the modification of the regulations, and given that the stretches are not part of an exclusive distribution system but that they also serve other municipalities, they had to become a transportation system (an independent company) in honor of serving the principle of openness and free access. The Colombian transportation system has approximately 3,850 kilometers of pipelines outside the distribution lines. Transportation of natural gas currently plays preponderant role in view of the existing conditions. Transportation is an arbitrage activity of the gas resources that are used in the different markets. This way, the gas from La Guajira is competitive only in the Atlantic Coast, while the gas from Cusiana is competitive in the inland. The above indicates that no matter what the cost of the resources is, they are used according to whether the transportation signal facilitates their penetration in the markets. This situation has kept the gas from La Guajira from competing with Cusiana to the south of Barrancabermeja and in turn it will not allow the gas from Cusiana to reach the market of the Atlantic Coast competitively. This makes the Colombian market behave like two segmented submarkets which are independent from one another. On the other hand, there is great uncertainty regarding the volumes to be transported by the companies Promigás and Ecogas, partly due to the consumption of gas for the generation of electricity, which may create stress on the system and therefore an eventual loss of pressure and a decrease in the packaging capacity, which may in turn caused difficulties in covering the demand.
3.3 Distribution of Natural Gas The distribution activity is currently carried out by close to 27 agents, serving 407 towns with 3,883,000 users, which are distributed 98.4% in the residential sector, 1.5% in the commercial sector and 0.07% in the industrial sector.
Gráfica 28 SISTEMA NACIONAL DE TRANSPORTE DE GAS NATURAL
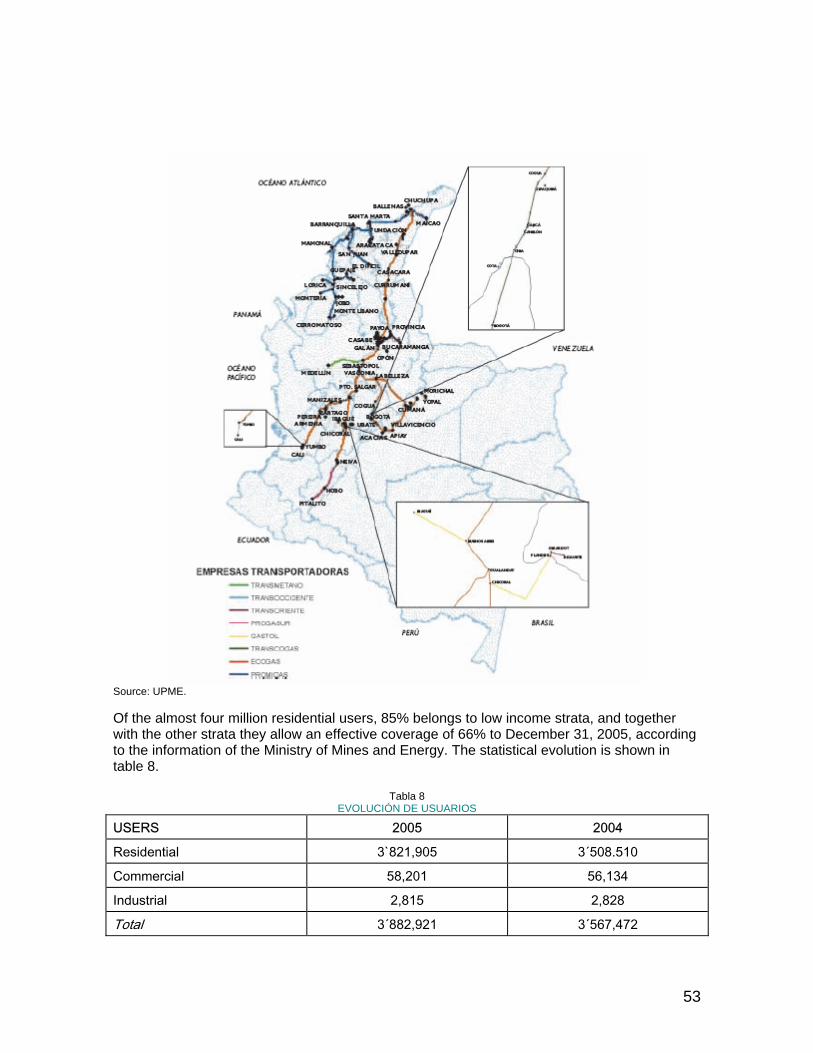
53
Source: UPME. Of the almost four million residential users, 85% belongs to low income strata, and together with the other strata they allow an effective coverage of 66% to December 31, 2005, according to the information of the Ministry of Mines and Energy. The statistical evolution is shown in table 8.
Tabla 8 EVOLUCIÓN DE USUARIOS
USERS 2005 2004
Residential 3`821,905 3´508.510
Commercial 58,201 56,134
Industrial 2,815 2,828
Total 3´882,921 3´567,472

54
Source: Ministerio de Minas y Energía. The number of residential users increased by 8.9%, while commercial users increased by 3.6%, and industrial users decreased by 0.4%, which equals 13. 12 years after starting the gas mas consumption plan, the distribution of natural gas activity presents a comforting general panorama with high growth rates in the number of users connected to the distribution networks, placing Colombia as an example in Latin America. Before the inland transportation system started to operate, the number of distributors was always 11, changing only the coverage of those distributors. In the years 1997 to 1999, when the inland transportation system started to operate, the number of distributors increased to 20. Since that date, the increases in the number of distributors have been marginal and not very significant in the total number of users and zones that are served, since the seven new distributors that were incorporated into the market since 2002 have had small developments and a joint coverage of less than 10,000 users.
Graph 29 EVOLUTION OF NATURAL GAS USERS
Source: Analysis of the Gas Mass Consumption Plan. It is important to note that among four distributors (Gas Natural, Gases de Occidente, Surtigás and Gases del Caribe), they serve 64% of the market, while 9 agents contribute with less than 1% each one, and the remaining 14 account for 33.4%. Most of the regions where natural gas is present have achieved an important coverage, with indexes exceeding 85%. However, there are zones with a low penetration of the service such as Medellín where the coverage is still fairly low (43.6% potential and 21.4% effective). In other cases such as Cali (Gases de Occidente) Sucre, Córdoba and Bolívar (Surtigás) and central Tolima (Alcanos), the effective coverage is significant, with percentages exceeding 55%. In terms of population coverage and their corresponding strata to December 31, 2005, the residential sector has the following participation of users: Stratum 1 580,629 Stratum 2 1’416,263 Stratum 3 1’251, 335 Stratum 4 341,410
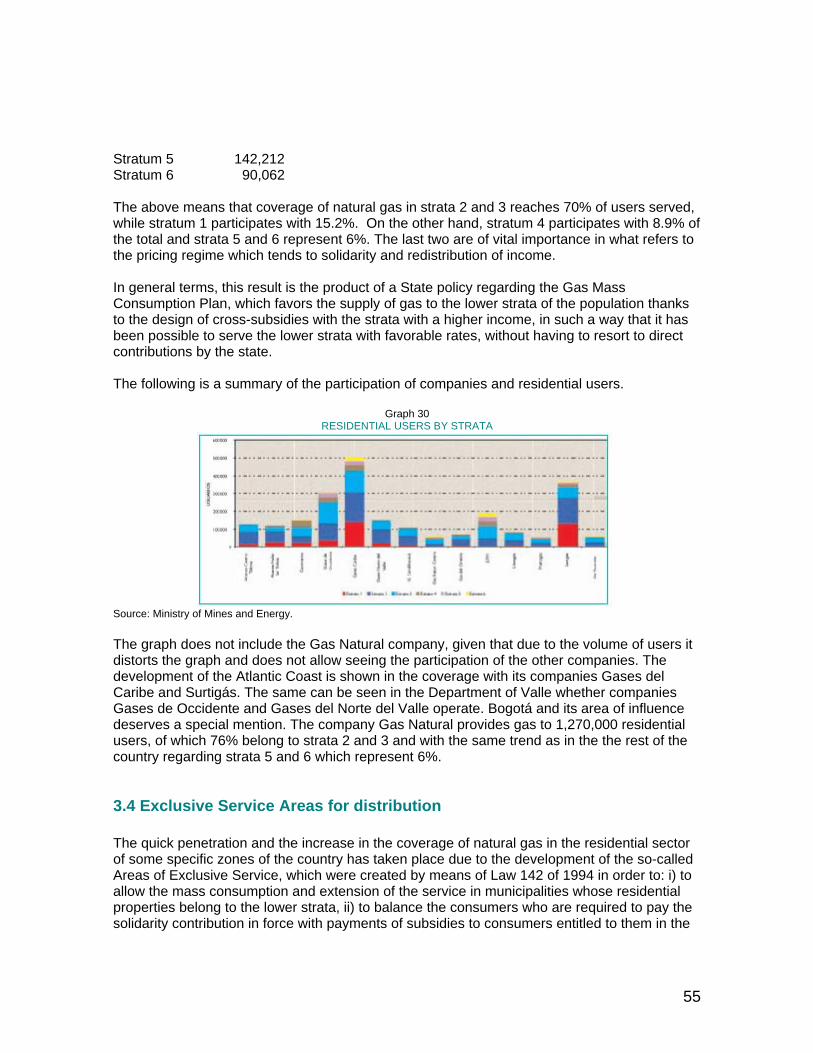
55
Stratum 5 142,212 Stratum 6 90,062 The above means that coverage of natural gas in strata 2 and 3 reaches 70% of users served, while stratum 1 participates with 15.2%. On the other hand, stratum 4 participates with 8.9% of the total and strata 5 and 6 represent 6%. The last two are of vital importance in what refers to the pricing regime which tends to solidarity and redistribution of income. In general terms, this result is the product of a State policy regarding the Gas Mass Consumption Plan, which favors the supply of gas to the lower strata of the population thanks to the design of cross-subsidies with the strata with a higher income, in such a way that it has been possible to serve the lower strata with favorable rates, without having to resort to direct contributions by the state. The following is a summary of the participation of companies and residential users.
Graph 30 RESIDENTIAL USERS BY STRATA
Source: Ministry of Mines and Energy. The graph does not include the Gas Natural company, given that due to the volume of users it distorts the graph and does not allow seeing the participation of the other companies. The development of the Atlantic Coast is shown in the coverage with its companies Gases del Caribe and Surtigás. The same can be seen in the Department of Valle whether companies Gases de Occidente and Gases del Norte del Valle operate. Bogotá and its area of influence deserves a special mention. The company Gas Natural provides gas to 1,270,000 residential users, of which 76% belong to strata 2 and 3 and with the same trend as in the the rest of the country regarding strata 5 and 6 which represent 6%.
3.4 Exclusive Service Areas for distribution The quick penetration and the increase in the coverage of natural gas in the residential sector of some specific zones of the country has taken place due to the development of the so-called Areas of Exclusive Service, which were created by means of Law 142 of 1994 in order to: i) to allow the mass consumption and extension of the service in municipalities whose residential properties belong to the lower strata, ii) to balance the consumers who are required to pay the solidarity contribution in force with payments of subsidies to consumers entitled to them in the

56
area defined as exclusive grant and iii) to provide the service of natural gas to urban zones with a low population density and lower strata. The scope of the exclusivity considers that only the distributor awardee of the special concession contract may provide the public service of natural gas distribution in the geographic area which is the object of the exclusivity. As to the large consumers (100,000 CFD20 since January 1, 2005), they may freely connect to a transportation system or subsystem, but they may not connect to a distribution system other than the contractor of the exclusive service area, and small and large consumers must be exclusive users of the concessionaire. With the application of the norm, six areas were defined into two zones: Zona Occidente (The Western Zone), and Zona Centro Oriente (the Central Eastern Zone), as follows: North of Valle, Quindío, Risaralda and Caldas in the first zone and those in the Center and Tolima, and the Altiplano Cundiboyacense. The Ministry signed the respective concession contracts with the companies that won the corresponding bid. Regarding these Exclusivity Areas, the total population that is served in 126 municipalities amounts to 553,356 residential users, which is approximately 15.5% of the national total and its composition by strata is presented in graph 31. The users that are served in strata 2 and 3 of the areas of exclusive service represent of 80% of the conglomerate in the six areas and 45.2% and 31.15% of the total number of users in the country that belong to these strata, whereas the volume of users in strata 5 and 6 represent only 1.3% and 0.7% respectively. These results show the benefits of the State Policies concerning the coverage of the low income population. The coverage goals that were defined in the concession contracts have already been achieved since 2004, in 5 of the areas of exclusive natural gas service. Table 9 presents the evolution of the coverage of the natural gas service of the above-mentioned concession contracts to December 31, 2005. The potential coverage shows the relation of residential users that are connected with relation to the official land register and the effective coverage of the users that are connected with relation to the official land register.
Graph 31 RESIDENTIAL USERS IN AREAS OF EXCLUSIVE SERVICE
Source: ITANSUCA.
20 CFD: Cubic Feet per Day.
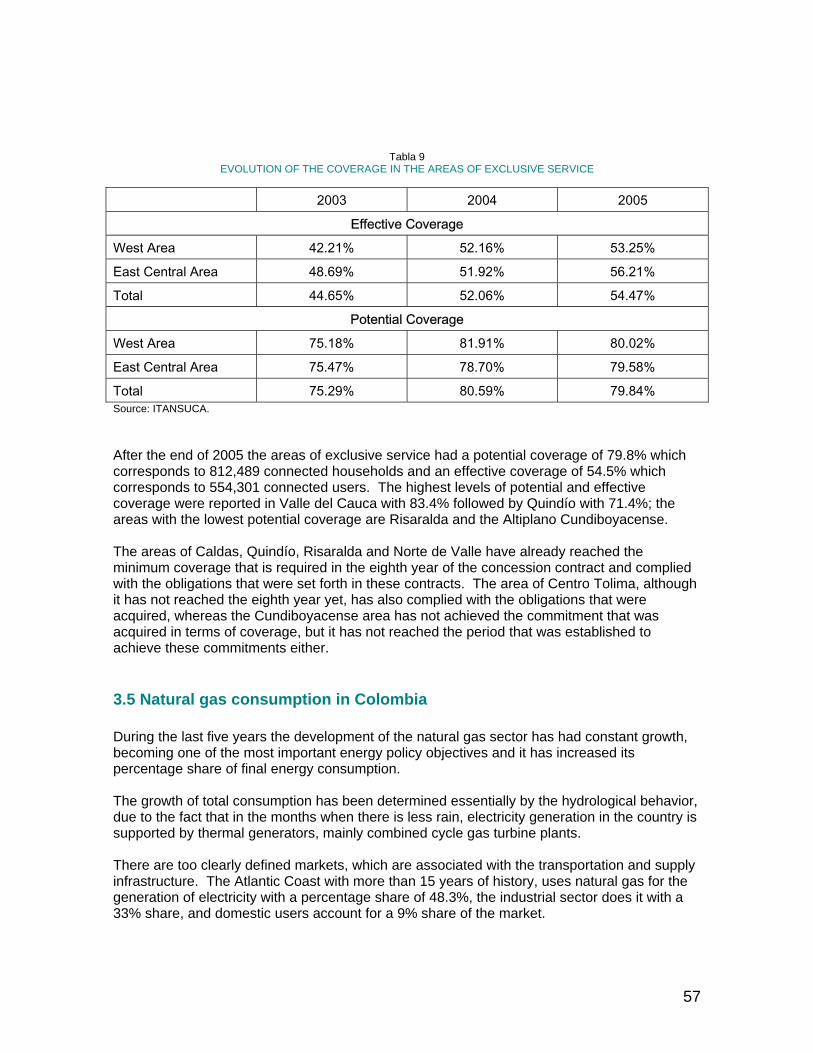
57
Tabla 9 EVOLUTION OF THE COVERAGE IN THE AREAS OF EXCLUSIVE SERVICE
2003 2004 2005
Effective Coverage
West Area 42.21% 52.16% 53.25%
East Central Area 48.69% 51.92% 56.21%
Total 44.65% 52.06% 54.47%
Potential Coverage
West Area 75.18% 81.91% 80.02%
East Central Area 75.47% 78.70% 79.58%
Total 75.29% 80.59% 79.84% Source: ITANSUCA. After the end of 2005 the areas of exclusive service had a potential coverage of 79.8% which corresponds to 812,489 connected households and an effective coverage of 54.5% which corresponds to 554,301 connected users. The highest levels of potential and effective coverage were reported in Valle del Cauca with 83.4% followed by Quindío with 71.4%; the areas with the lowest potential coverage are Risaralda and the Altiplano Cundiboyacense. The areas of Caldas, Quindío, Risaralda and Norte de Valle have already reached the minimum coverage that is required in the eighth year of the concession contract and complied with the obligations that were set forth in these contracts. The area of Centro Tolima, although it has not reached the eighth year yet, has also complied with the obligations that were acquired, whereas the Cundiboyacense area has not achieved the commitment that was acquired in terms of coverage, but it has not reached the period that was established to achieve these commitments either.
3.5 Natural gas consumption in Colombia During the last five years the development of the natural gas sector has had constant growth, becoming one of the most important energy policy objectives and it has increased its percentage share of final energy consumption. The growth of total consumption has been determined essentially by the hydrological behavior, due to the fact that in the months when there is less rain, electricity generation in the country is supported by thermal generators, mainly combined cycle gas turbine plants. There are too clearly defined markets, which are associated with the transportation and supply infrastructure. The Atlantic Coast with more than 15 years of history, uses natural gas for the generation of electricity with a percentage share of 48.3%, the industrial sector does it with a 33% share, and domestic users account for a 9% share of the market.

58
In the inland gas consumption has had a homogenous behavior, reporting an average annual rate of 10.5%. This is the result of joint efforts not only of the private sector and the users, but also of the government in the coordination and implementation which are aimed at promoting the use of this source of energy in all the sectors of consumption. The behavior of consumption by sectors points at the industrial and thermoelectric sectors with the greatest demand for natural gas with a high dynamism in the domestic and CNG (gas for the transportation sector) sectors. The consumption of natural gas by ECOPETROL has been stable throughout the period and constitutes the compensation axis of marginal consumption increases in other sectors. Consumption of natural gas in the country reached 651 MMCF/D in 2005 being 5.6% higher than consumption in 2004 (5616 MMCF/D), according to the information in graph 32. The industrial sector is noted mainly due to the fact that natural gas has become a competitive fuel because of the high prices of petroleum; this has also led to the substitution of fuels in the transportation sector with CNG for vehicles, which starts to show an increasing share of consumption. Consumption in the thermoelectric there is one of the most dynamic, which is explained by the growing use of combined cycle technology due to its efficiency. This reflects the fact that most of the new installed generating capacity will be done with natural gas.
Graph 32 EVOLUTION OF NATURAL GAS CONSUMPTION IN COLOMBIA
In the last five years the behavior has been stable, due to the fact that there have not been any dry climatic conditions which adversely affect the generation of electricity. In graph 32 it can be seen how in 1997 consumption peaked in the sector, mainly due to the “niño” phenomenon which affected the country's hydrology that year. The domestic sector represents a medium portion of the gas market exhibiting high growths that are evidenced by the success of the substitution of sources of energy particularly in cooking and water heating. During 2005 natural gas was able to cover 18.7% of the residential demand, which historically more than half has been covered by electricity. The natural gas sector has grown steadily at an average annual rate of 9.6% during the last five years. This situation is due not only to the substitution effect, but also as a response to the growth of the population that has access to fuels and may decide between the advantages of using one or the other.

59
In spite of being the sector with the greatest demand for gas with an average annual growth of 11.8%, the industrial sector varies greatly from one year to another, and it has fluctuated with the prices of the other fuels that make up the package in the industrial sector. The growth in consumption of the last two years responded mainly to the behavior of the industrial GDP which was shared by most of the branches of manufacturing activities despite the increase in the prices of natural gas. Consumption in the inland was outstanding; it went from 36 MMCF/D in 2000 to 108 MMCF/D in 2005, an average annual growth rate of 29.1%, in spite of the decrease in consumption during 2001 and 2002 as a consequence of the drop in the GDP. Comparatively, consumption on the coast has stayed at the same level while the inland has had steady growth. The share of consumption by sectors during 2005 is shown in graph 33. The transportation sector has been the most dynamic; and it has doubled its consumption in the last 5 years thanks to the programs that are underway and which are being developed jointly by the agents of this chain. It has been making inroads into big cities as a solution to pollution problems and especially to a price policy that reflects a shortage of resources.
Graph 33 THE SHARE OF CONSUMPTION BY SECTOR
3.6 Natural Gas for Vehicles The use of natural gas as vehicle fuel in Colombia dates back to the early 90s in the Atlantic Coast. In the inland its development started in 1999, when a policy of full fuel substitution was established and achieved important advances to consolidate CNG as a transportation alternative. This can be seen in the results there were achieved at the end of 2005, which report the conversion of 42,780 vehicles for a grand total of 95,917 with an average consumption of 30.1 MMCF/D, as well as an important increase in the supply infrastructure, given that now there are 144 service stations and more than 175 conversion workshops throughout the country. An incentive program and vehicle conversion which ranges between $400,000 and $1,000,000 per vehicle is being developed in the country, according to the information provided by

60
ECOPETROL. Graph 34 shows devolution of vehicle conversions, whose results in recent years rest on the incentive program. Considering that the growth rate of conversions is higher than the growth of new stations, it is necessary to increase the supply infrastructure in order to avoid crowding in some cities, where the number of converted cars is increasing rapidly.
Graph 34 EVOLUTION OF CONVERTED VEHICLES
Source: Revista Gas Vehicular. Undoubtedly, one of the great advances in this matter is the use of gas in the segments of private transportation and large vehicles for the transportation of cargo. According to the results obtained in the study on the fuel market and CNG for vehicles that was carried out at the end of 2005, CNG has gained important space in the different transportation segments on a national level, as it is shown in graph 35. Passenger transportation, which has an important market in which accounts for 65.4% of the total gas consumed to power vehicles, which includes taxicabs, different types urban vehicles and the mixed category. In all regional markets, taxicabs are vehicles that are basically used in urban and metropolitan settings account for the greatest consumptions of CNG with a share of 70.8%, followed by the urban passenger segment with 25.1% and mixed transport with 4.02%. It is expected that in the future passenger transport in large cities will have a larger share in the energy package, thanks to the new technological options such as buses with gas engines, which have been tested in different Colombian capitals. The results of a recent study show not only technical but also economical benefits which allow us to conclude that articulated and “feeder” buses, such as those that are used by the Transmilenio de Bogotá system, may operate satisfactorily with natural gas. The private transportation segment has also acquired a strong presence with 16.2% of the internal demand. As is expected, the vehicles with the greatest engine displacement and/or productive use have taken an important part of the market with light trucks and large SUVs which account for 35.1%, small SUVs 32.6% and pickup trucks 32.3%
Graph 35 DISTRIBUTION OF GAS CONSUMPTION BY TRANSPORTATION SEGMENT
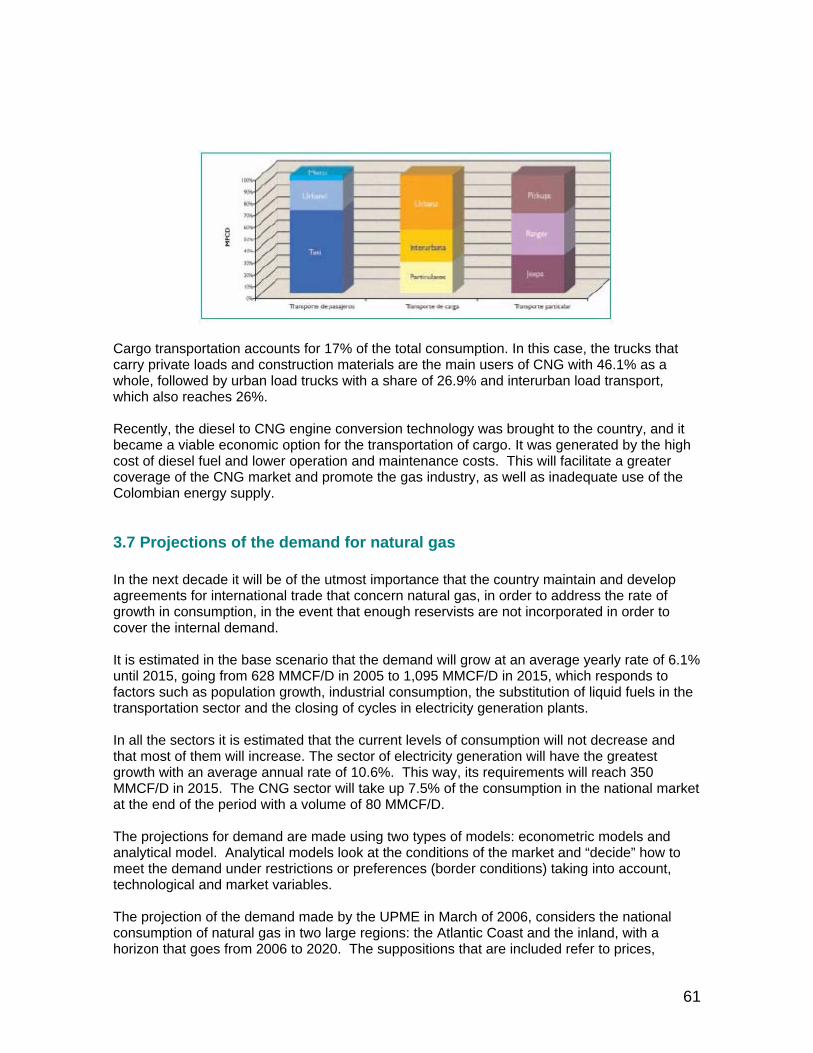
61
Cargo transportation accounts for 17% of the total consumption. In this case, the trucks that carry private loads and construction materials are the main users of CNG with 46.1% as a whole, followed by urban load trucks with a share of 26.9% and interurban load transport, which also reaches 26%. Recently, the diesel to CNG engine conversion technology was brought to the country, and it became a viable economic option for the transportation of cargo. It was generated by the high cost of diesel fuel and lower operation and maintenance costs. This will facilitate a greater coverage of the CNG market and promote the gas industry, as well as inadequate use of the Colombian energy supply.
3.7 Projections of the demand for natural gas In the next decade it will be of the utmost importance that the country maintain and develop agreements for international trade that concern natural gas, in order to address the rate of growth in consumption, in the event that enough reservists are not incorporated in order to cover the internal demand. It is estimated in the base scenario that the demand will grow at an average yearly rate of 6.1% until 2015, going from 628 MMCF/D in 2005 to 1,095 MMCF/D in 2015, which responds to factors such as population growth, industrial consumption, the substitution of liquid fuels in the transportation sector and the closing of cycles in electricity generation plants. In all the sectors it is estimated that the current levels of consumption will not decrease and that most of them will increase. The sector of electricity generation will have the greatest growth with an average annual rate of 10.6%. This way, its requirements will reach 350 MMCF/D in 2015. The CNG sector will take up 7.5% of the consumption in the national market at the end of the period with a volume of 80 MMCF/D. The projections for demand are made using two types of models: econometric models and analytical model. Analytical models look at the conditions of the market and “decide” how to meet the demand under restrictions or preferences (border conditions) taking into account, technological and market variables. The projection of the demand made by the UPME in March of 2006, considers the national consumption of natural gas in two large regions: the Atlantic Coast and the inland, with a horizon that goes from 2006 to 2020. The suppositions that are included refer to prices,
62
supply, technology and the demand of the electric sector which is obtained with the simulation of the operations of the electrical system by means of the MPODE21 model. The demand of the residential sector was estimated using analytical models which project the consumptions of each one of the municipalities and towns with the natural gas service starting with the coverage, average consumption per user and the estimated penetration of natural gas in each region. Once the demand of each municipality is obtained it is added on a regional and national level. There are two demand scenarios which are differentiated by the final coverage and the speed of penetration of natural gas in the markets. The base scenario starts with estimated penetration curves of natural gas for each distributor which are applied to the towns of their jurisdiction, while the high scenario supposes a program that promotes the use of residential gas which reaches high coverages in a five-year horizon. With the objective of simulating the penetration curve of natural gas for each distributor, the ENPEP analysis model was used. In this model natural gas competes with substitute fuels in each one of the different markets by costs of useful energy and taking into account economic variables, human behavior, and infrastructure and policy restrictions and incentives. LPG and natural gas compete for the cooking market in this model; this considering that LPG is main competitor of natural gas for this energy service not only in big cities, but also in smaller ones. In relation with the price of gas the regulation in force to 2006, which was established for that purpose, was applied. The demand scenario in the residential sector starts by using the typical estimated penetration curve for each one of the distributors and it is applied to each company's own towns, with a calculated level of coverage starting with the historical behavior. The average consumption of residential users was estimated for each region and distributor. The demand of the commercial sector was estimated using analysis models which projected number of users and their demand in each town starting with information provided to the UPME by the distributing companies. Considering that the commercial activity is linked to the growth of the residential sector, the same growth rates that were obtained for the sector were used.
Graph 36 NATURAL GAS DEMAND BASE CASE
21 Modelo de Proyección de Demanda de Energía.
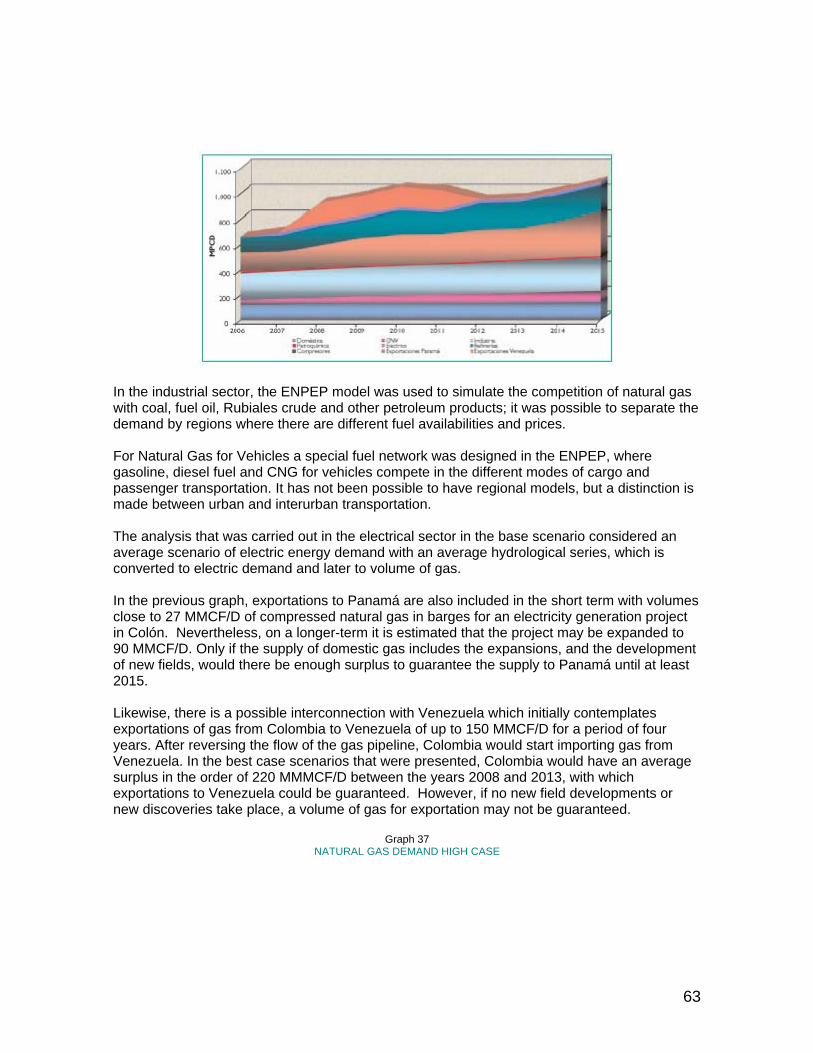
63
In the industrial sector, the ENPEP model was used to simulate the competition of natural gas with coal, fuel oil, Rubiales crude and other petroleum products; it was possible to separate the demand by regions where there are different fuel availabilities and prices. For Natural Gas for Vehicles a special fuel network was designed in the ENPEP, where gasoline, diesel fuel and CNG for vehicles compete in the different modes of cargo and passenger transportation. It has not been possible to have regional models, but a distinction is made between urban and interurban transportation. The analysis that was carried out in the electrical sector in the base scenario considered an average scenario of electric energy demand with an average hydrological series, which is converted to electric demand and later to volume of gas. In the previous graph, exportations to Panamá are also included in the short term with volumes close to 27 MMCF/D of compressed natural gas in barges for an electricity generation project in Colón. Nevertheless, on a longer-term it is estimated that the project may be expanded to 90 MMCF/D. Only if the supply of domestic gas includes the expansions, and the development of new fields, would there be enough surplus to guarantee the supply to Panamá until at least 2015. Likewise, there is a possible interconnection with Venezuela which initially contemplates exportations of gas from Colombia to Venezuela of up to 150 MMCF/D for a period of four years. After reversing the flow of the gas pipeline, Colombia would start importing gas from Venezuela. In the best case scenarios that were presented, Colombia would have an average surplus in the order of 220 MMMCF/D between the years 2008 and 2013, with which exportations to Venezuela could be guaranteed. However, if no new field developments or new discoveries take place, a volume of gas for exportation may not be guaranteed.
Graph 37 NATURAL GAS DEMAND HIGH CASE
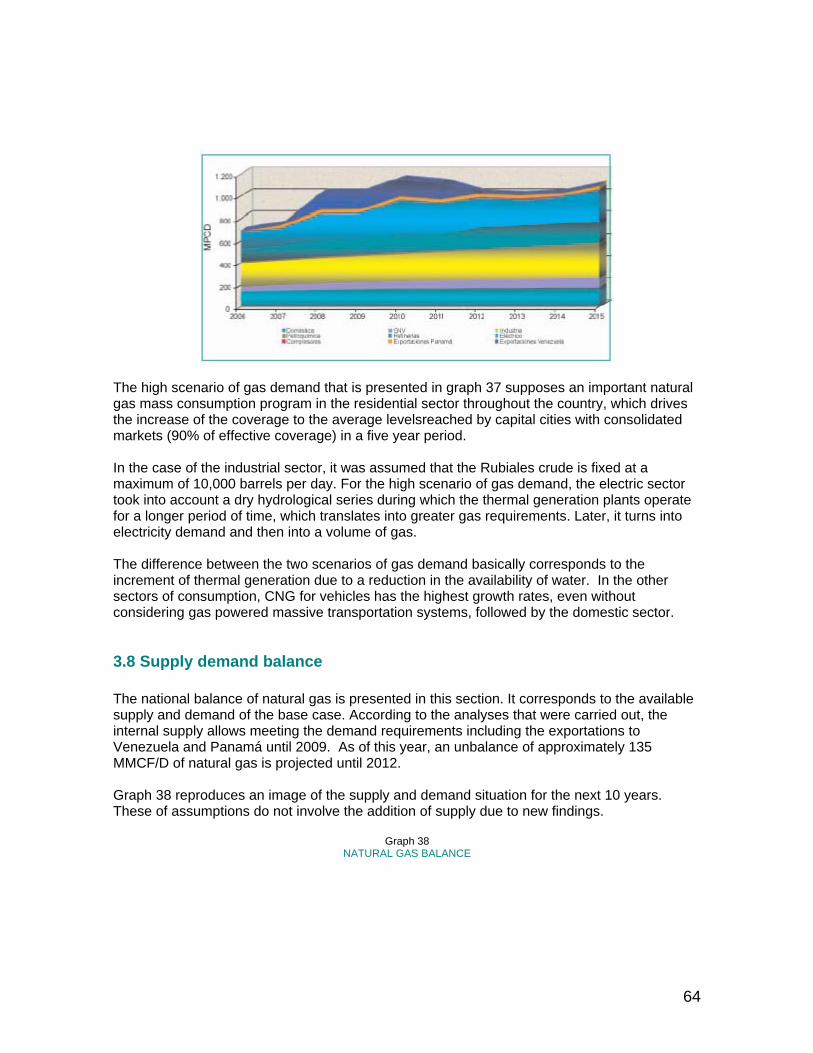
64
The high scenario of gas demand that is presented in graph 37 supposes an important natural gas mass consumption program in the residential sector throughout the country, which drives the increase of the coverage to the average levelsreached by capital cities with consolidated markets (90% of effective coverage) in a five year period. In the case of the industrial sector, it was assumed that the Rubiales crude is fixed at a maximum of 10,000 barrels per day. For the high scenario of gas demand, the electric sector took into account a dry hydrological series during which the thermal generation plants operate for a longer period of time, which translates into greater gas requirements. Later, it turns into electricity demand and then into a volume of gas. The difference between the two scenarios of gas demand basically corresponds to the increment of thermal generation due to a reduction in the availability of water. In the other sectors of consumption, CNG for vehicles has the highest growth rates, even without considering gas powered massive transportation systems, followed by the domestic sector.
3.8 Supply demand balance The national balance of natural gas is presented in this section. It corresponds to the available supply and demand of the base case. According to the analyses that were carried out, the internal supply allows meeting the demand requirements including the exportations to Venezuela and Panamá until 2009. As of this year, an unbalance of approximately 135 MMCF/D of natural gas is projected until 2012. Graph 38 reproduces an image of the supply and demand situation for the next 10 years. These of assumptions do not involve the addition of supply due to new findings.
Graph 38 NATURAL GAS BALANCE

65
One of the options to make the balance positive and to improve the supply is the early development of Gibraltar, with higher volumes than those currently projected. Another alternative will be to increase the production of Cusiana in case the construction of the plan for the production of liquid fuels is not made viable. The most desirable situation is to incorporate new reserves, whose contributions are fundamental to reverse the deficit situation and to achieve surplus production of natural gas. Although it is not easy to predict the demand and production of natural gas on the short and medium term, it is even more difficult to carry out a prospective balance when the greatest demand for gas comes from the electricity generation sector and the exchanges with other countries, due to the fact that the variables may be subjected to continues fluctuations, which may turn out to be significant. For there to be equilibrium in the prospective balance, it is necessary to mention that the transportation infrastructure must have enough and timely capacity to meet the requirements. Therefore, it would be necessary to expand the transportation capacity mainly of the inland, since it would be the Cusiana field that would supply this market. In general terms, the future balance of natural gas will depend on other factors, which include the results of the exploratory policy, the regulation of the sector, the development of new projects and the interconnection with other countries. For this reason and for a better understanding, different scenarios may be built with different assumptions based on new findings and demand scenarios whose growths exceed historical growths. Graph 39 presents the balance of natural gas in the gas bias supply scenario that is mentioned in the second chapter. It can be seen that the incorporation of reserves in the order of 22.6 TCF will allow the country not only to supply the internal demand, but also to develop projects such as GTL and/or LNG with the surplus production, besides the virtue of extending the gas producing regions.

66
Graph 39
BALANCE OF NATURAL GAS IN THE GAS BIAS SUPPLY SCENARIO
Gráfica 40 BALANCE OF NATURAL GAS IN THE PETROLEUM BIAS SUPPLY SCENARIO
Another of the exercises that were carried out includes the balance of natural gas under a scenario of the incorporation of 10 TCF of reserves which corresponds to the so-called petroleum bias of the previous chapter. Graph 40 presents the results that were obtained. This exercise shows sufficient capacity to meet the internal requirements, as well as to study the development of projects that will allow monetizing reserves mainly in the inland.

67

68
CHAPTER 4 PRICES
4 PRICES Price regulation for the provision of natural gas service is defined by the Comisión de Regulación de Energía y Gas-CREG (Electricity and Gas Regulation Commission) an entity that was delegated the function by means of the Law of Public Services (142 of 1994) where it was defined that the pricing regime to be oriented by the criteria of economic efficiency, neutrality, solidarity, redistribution, financial sufficiency, simplicity and openness. Taking into account the characteristics of each activity the CREG has defined the following price schemes: 1. Wellhead price 2. Transport 3. Distribution 4. Marketing 5. Natural gas for vehicles
4.1 Regulation of wellhead prices Taking into account what was defined in the regulation, a maximum prices fixed for the entry into the main network for: l Fields that existed before 1995. They correspond to resolutions 039 of 1975 (recently modified by CREG Resolution 119 of 2005 whose indexation is now with the New York Harbor Residual Fuel Oil index) and 061 of 1983 which were issued by the former Petroleum and Natural Gas Pricing Commission were the price is associated with the variation of fuel oil prices for exportation, and a new alternative is given defining the WTI as an indexation mechanism; it was only adopted by smaller fields. In addition, price liberation is established in 2005 depending on the level of competition, which did not take place since the CREG considered that the requirement was not fulfilled. There was only a partial liberation for the case of Cusiana, with the construction of the treatment plant of more than 180 MMCF/D. l Fields after 1995, free price. Prices in the last three decades have had a "pendulum" effect, where they started with a level close to 2 US$/MBTU in the 80s, and later dropped the values of 0.70 US$/MBTU in the 90s,

69
and in recent years returning to prices close to 2 US$/MBTU, which are the maximum historical prices. However, these prices in terms of Colombian pesos have been attenuated because of the revaluation of the peso which has been taking place for close to two years. Resolution 057 of 1996 which has an indexation mechanism with the price of the WTI, has had a fairly stable behavior. However, it was only adopted by a smaller field (Payoa). Resolution 018 of 2002 which applies only to the fields of Cusiana and Cupiagua, in the case of volumes of entry into the main network of 180 MMCF/D, presents a stable price behavior. However, with the provisions of Resolution 119 of 2005, a price was established without being subject to a maximum limit, if the capacity of the facilities for the treatment of the associated gas that all-out injecting it into the National Transport System is higher than 180 MMCF/D. The same resolution defined a new formula for the determination of maximum wellhead prices in the fields of La Guajira and Opón, but it also determined free prices without being subject to maximum limits under the regime of supervised freedom, for the rest of the production fields.
Graph 41 BEHAVIOR OF MAXIMUM WELLHEAD PRICES
Maintaining the signal of controlled prices for the Guajira gas could limit the start of new exploratory activities in the zone that might result in the discovery of new natural gas fields with a free price according to the regulation in force, due to the fact that they would be forced to compete with the Guajira field of regulated price. It must be noted that the development costs of new fields will certainly be higher than the current production costs of Guajira gas, due to the fact that these would also be found in open sea, which would imply additional investments in order to start production. Under this consideration it will be necessary to find mechanisms that will become long-term alternatives so that new discoveries may be developed commercially, and moreover, it

70
eliminates the uncertainty that by means of new regulatory provisions, the application of price liberation schemes will be postponed indefinitely.

71
4.2 Regulation of transportation prices For the determination of transportation fees the following methodologies have been used: i) first pricing period (Res. 057 of 1996): a system of costs per distance was adopted, for the case of the inland gas pipelines, which was referenced by a certain node in respect of which it was assumed as a node of transactions between producers and buyers, for which access and exit fees were defined; for the gas pipeline of the Coast, a stamp scheme was defined, and ii) second pricing period (Res. 001 of 2000): transportation prices by system, based on the average cost of long-term that is set as a function of the firmness of the contracts, the valuation of the assets and the efficient costs of AOM22 taken as the base. The total cost of transportation is defined as the summation of the charges for the different stretches of the gas pipeline that the natural gas must cover. These pass-through charges remunerate the following concepts: maximum fixed and variable charges per distance to remunerate the investment, fixed charge to remunerate the AOM expenses and two stamp tariffs whose purpose is to remunerate part of the investment in the system of main gas pipelines and branches. The characteristic of this methodology for the determination of transportation charges is in the distance signal, which approaches what would happen in a competition market where the prices reflect the costs of providing the services. The consequence of this situation is that the gas cost more as the centers of demand are located at greater distances from the fields of production, which is what happens with the markets of Bogotá, Medellín and particularly in the West. This methodology allowed the flexibility of the contracting of transportation by introducing the concept of pairs of charges, which allows the client to propose the combination of fixed and variable charges that better fits his load curve. It must be noted that each pair of charges must be indifferent for the transporter since if the level of risk changes from one pair to another, this is compensated by the price, which increases as there is a pair of charges, with a variable component with a greater percentage. However, a discretional faculty of a transporter to accept or not proposals of pairs of charges could eventually be configured, for example, 0% Fixed and 100% Variable for those consumptions with the smallest probability of occurrence, or with a low load curve. Essentially, a sender must be autonomous in the decision regarding the pairs of charges that he wishes to apply to the contract, based on the criterion that transporter must be neutral regarding the range of pairs of charges that the norm places for the consideration of the agents in order to enter into transportation agreements. According to the pricing structure that is defined in the CREG 011Resolution of 2003, the payments for transportation taxes and other contributions that are related to it should also be included in the cost of transportation. Regarding this we have the following: Transport Tax and Special Progress Fund.
22 AOM: Administration, Operation and Maintenance.
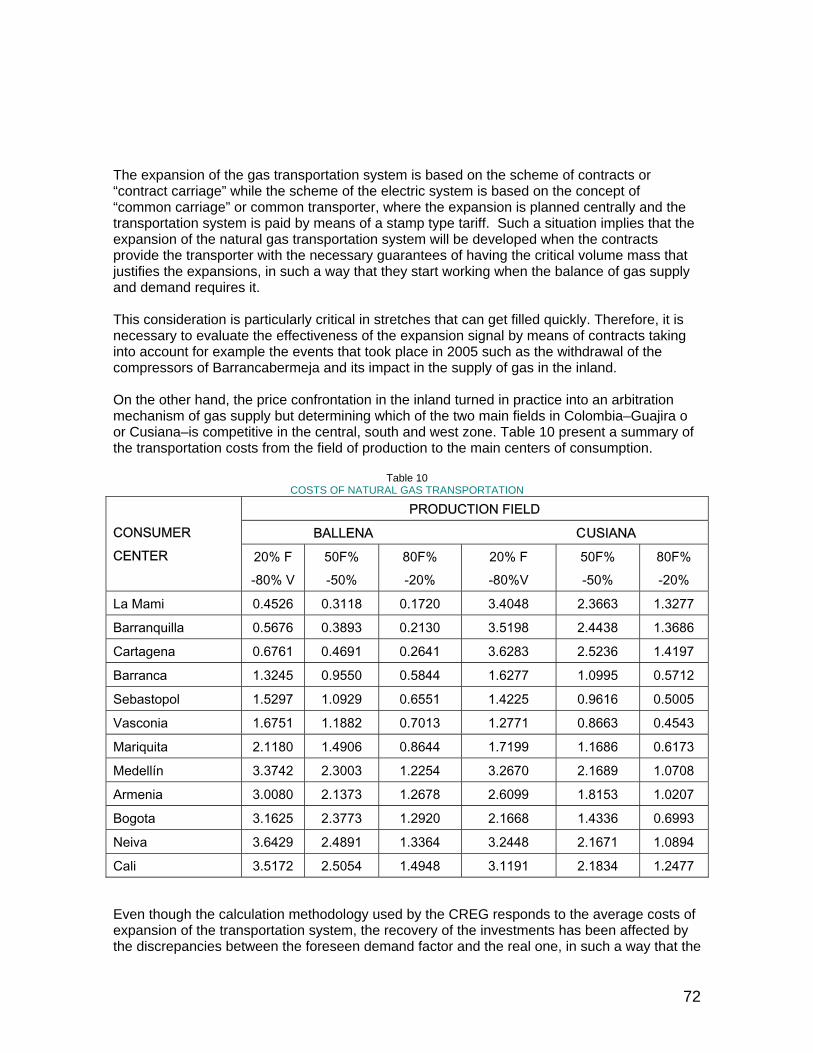
72
The expansion of the gas transportation system is based on the scheme of contracts or “contract carriage” while the scheme of the electric system is based on the concept of “common carriage” or common transporter, where the expansion is planned centrally and the transportation system is paid by means of a stamp type tariff. Such a situation implies that the expansion of the natural gas transportation system will be developed when the contracts provide the transporter with the necessary guarantees of having the critical volume mass that justifies the expansions, in such a way that they start working when the balance of gas supply and demand requires it. This consideration is particularly critical in stretches that can get filled quickly. Therefore, it is necessary to evaluate the effectiveness of the expansion signal by means of contracts taking into account for example the events that took place in 2005 such as the withdrawal of the compressors of Barrancabermeja and its impact in the supply of gas in the inland. On the other hand, the price confrontation in the inland turned in practice into an arbitration mechanism of gas supply but determining which of the two main fields in Colombia–Guajira o or Cusiana–is competitive in the central, south and west zone. Table 10 present a summary of the transportation costs from the field of production to the main centers of consumption.
Table 10 COSTS OF NATURAL GAS TRANSPORTATION
PRODUCTION FIELD
BALLENA CUSIANA CONSUMER CENTER 20% F
-80% V 50F% -50%
80F% -20%
20% F -80%V
50F% -50%
80F% -20%
La Mami 0.4526 0.3118 0.1720 3.4048 2.3663 1.3277
Barranquilla 0.5676 0.3893 0.2130 3.5198 2.4438 1.3686
Cartagena 0.6761 0.4691 0.2641 3.6283 2.5236 1.4197
Barranca 1.3245 0.9550 0.5844 1.6277 1.0995 0.5712
Sebastopol 1.5297 1.0929 0.6551 1.4225 0.9616 0.5005
Vasconia 1.6751 1.1882 0.7013 1.2771 0.8663 0.4543
Mariquita 2.1180 1.4906 0.8644 1.7199 1.1686 0.6173
Medellín 3.3742 2.3003 1.2254 3.2670 2.1689 1.0708
Armenia 3.0080 2.1373 1.2678 2.6099 1.8153 1.0207
Bogota 3.1625 2.3773 1.2920 2.1668 1.4336 0.6993
Neiva 3.6429 2.4891 1.3364 3.2448 2.1671 1.0894
Cali 3.5172 2.5054 1.4948 3.1191 2.1834 1.2477
Even though the calculation methodology used by the CREG responds to the average costs of expansion of the transportation system, the recovery of the investments has been affected by the discrepancies between the foreseen demand factor and the real one, in such a way that the

73
Ecogas transportation system has had very low use factors in many of its stretches. Likewise, the expansions that were made to address the greater electric demand have had financial problems. Currently the internalized average price in distribution prices is 1.76 US$/MBTU for the exclusive areas and 1.08 US$/MBTU for the non exclusive areas. That is, taking into account that the greatest demand is concentrated in these last ones, the average price has ranged around 1.2 US$/MBTU. If we consider standard guidelines of gas pipeline investment costs in the order of 60 million dollars per m3/day of additional capacity (the amount is approximately similar to the one that you get from dividing the pipeline investment recognized by the CREG to December 31, 2004 by the average daily demand) and that the projections of increase in the demand between 2006 and 2025 are in the order of 39 million m3/day, it is inferred that investments in gas transportation in the order of 2.33 billion dollars are required. Considering that the quotient is NPV23
at 16% of the transported flows valued at an average price of 1.2 US$/MBTU and the required investments, we have that the price would adequately cover the expansion costs. On the other hand, you may also think that in a maturing natural gas market like the Colombian market with two big production fields, a transportation system with two main branches as far as Vasconia and from there on one big gas pipeline to the inland, a greater penetration and natural gas could be achieved by means of a stamp tax rather than a scheme based on distance signals, opening the doors to a greater competition among the gas fields to attend the markets of the inland and the Atlantic Coast. Moreover, the pricing model that is defined to be applied after 2007, must be such that it allows the exchange of gas between the North and South Systems in such a way that it would be possible to support new businesses in both systems, particularly taking into account that the new developments of the gas sector may be oriented to exportation businesses or to GTL.
4.3 Regulation of distribution and marketing The regulatory policy that came into force with Resolution 057 of 1996, established a maximum charge per distributor, which reflected all the costs incurred by the distributor in providing the service, including marketing costs. Since it is about maximum prices, the Distributor could modify the distribution price downward at the time that some other marketer wanted to attend a non-regulated user, even below the economic costs of providing this service. The new regulation that came into force by means of Resolution 011 of 2003, established a methodology that allows the distributor to structure differential prices per ranges of consumption in such a way that the total revenue does not exceed the revenue that corresponds to the average distribution charge and is based on the application of the so-called charges for the use of the distribution systems based on the following general principles: i) users shall pay only one charge for the use of each system, ii) the necessary infrastructure to take the supply from the leaving point of the National Transport System to the point of delivery to the user shall be remunerated and iii) the charge for the use must be the same regardless of
23 NPV: Net Present Value.

74
the Marketer that attends the user. It also takes into account the investment in expansion for the following five years. The regulatory framework of natural gas distribution also contemplates efficiency criteria making adjustments between the total longitude of the distribution system and the number of users, as well as adjustments in the costs of new investments by means of the definition of the efficient costs of the Constructive Units. In respect of the Marketing of Natural Gas, Resolution 057 of 1996 established an only charge for all the markets or agents, which was set at $3/m3 since November of 1995, making annual adjustments with the index of consumer prices - IPC. This price did not allow the incursion of other marketers insofar as the Distributor of a zone competes with the charge of distribution whose final effect in the price is far higher than the marketing charge. With Resolution 011 of 2003, marketers have the opportunity to compete for the non regulated market given that the current distribution prices are unique for each market, and the marketing prices are the maximum prices, which allows competing with efficiencies in the purchase of the gas, the negotiation of the transportation service and the efficiency in the provision of the service, thus being able to charge a marketing fee according to the services provided. In general, this methodology, as it was mentioned before, allows the distributor to establish prices for volume, which makes competition processes even more difficult given that the distributor may establish the “price options” for his own market that are most convenient for his interests and that also allow him to neutralize the incursion of independent marketers. On the other hand, this methodology is subject to be used by regulated users to end up leveraging non regulated users, for the two following considerations: i) the pricing discrimination by volume which was explicitly authorized in Resolution 011 of 2003 and ii) the lack of information of the users as to the commercial practices of the distributors and particularly as to the price scales with respect to volume. This situation constitutes an access barrier for the entry of an external marketer due to the restriction of information, except in those cases of non regulated users that may connect directly to the transportation system, bypassing the distribution network. On the other hand, an analysis that was carried out has shown a considerable amplitude of distribution prices to cover the total costs at an adequate profitability rate. Such amplitude comes from the fact that, for the purpose of price calculation, the companies present figures of five year investment plans which imply marginal costs that are higher than the average. In this context, the regulations should tend to link the charges with real investments.
4.4 Natural gas prices In Colombia, there are 15 non-exclusive areas of distribution and 6 exclusive service areas. The following is the price formation in both categories, on the level of estimated average price. 4.4.1 Exclusive Service Areas

75
We have the following distributors: Gases del Quindío; Gases de Risaralda; Gases del Norte del Valle; Gas Natural del Centro; Gas Natural Cundiboyacense; Alcanos de Colombia, Center and Tolima. Table 11 shows the amounts in force in 2006 expressed in $ of 2004 per m3 and in US$ of 2004 per MBTU. According to the information in the table, the distribution cost represents the greatest proportion of the average price with 36.8% followed by the cost of transportation, whose share amounts to 28.49%. The purchase of the gas accounts for 26.5%, while marketing has a minority share of 1.4% and the correction factor accounts for 6.7%.
Table 11 AVERAGE MEDIAN PRICES IN FORCE EXCLUSIVE AREAS
CONCEPT $ for 2004 per m2 US$ for 2004 per MBTU
Natural Gas purchase 137.0 1.650
Transportation Costs 146.9 1.768
Distribution Costs 189.8 2.285
Commercialization Costs 7.4 0.089
Correction factor -34.7 -0.418
Final cost per unit 446.3 5.374 Source: Pricing Policy Study, Fundación Bariloche. 4.4.2 Nonexclusive Service Areas The following are the distributors, that provide the service in the nonexclusive service areas: Alcanos Colombia-Huila and Sur Tolima; Gases del Cusiana; Gases de Barrancabermeja; Gases del Caribe; Gases del Oriente; Gas Natural del Cesar; Gases de La Guajira; Llanotas; Madigás Ingenieros; Surtidora de Gases del Caribe; Gas Natural; EPM; Empresa de Gases de Occidente; Metrogás; Gas Natural de Oriente. Table 12 presents the average amounts that compose the median distribution pricein the areas where exclusivity is not available.
Table 12 AVERAGE MEDIAN PRICES IN FORCE, NONEXCLUSIVE AREAS
CONCEPT $ for 2004 per m2 US$ for 2004 per MBTU
Natural Gas purchase 136.5 1.644
Transportation Costs 89.8 1.081
Distribution Costs 263.0 3.167
Commercialization Costs 94.5 1.138
Correction factor 583.9 7.030
Final cost per unit 136.5 1.644

76
Source: Pricing Policy Study, Fundación Bariloche. According to the amounts that are shown in table 12, as well as in the exclusive service areas, distribution has a share of 45.3%, transportation stays at 15.3%, purchases account for 23.3%, and marketing accounts for 16.1%. The average prices of nonexclusive areas exceed the price of exclusive areas by 31%. The average price for the purchase of the gas is similar in both cases and the lower costs of transportation of the nonexclusive areas are compensated with higher distribution charges. However, the costs of marketing in nonexclusive areas constitute an important share of the final price (16 %) and the correction factor is null.

77

78
CHAPTER 5 REGULATORY AND NORMATIVE ASPECTS
5 REGULATORY AND NORMATIVE ASPECTS
5.1 Integration of the businesses Existing norms in the manner of natural gas seek to promote competition schemes, generating the adequate conditions for the presence of multiple agents in the market while limiting the concentration of the companies’ property. Bearing in mind that the objective of the regulating function is to supervise the efficiency in the provision of services and to control activities that go against greater competition, these controls are facilitated by the separation of the activities of the chain. The limitation to the integration of businesses is included in the following regulations: l The natural gas transporter may not carry out production, marketing or distribution activities. (Res. 057 of 1996) l The companies whose objective is to sell, market or distribute natural gas, may not be transporters nor have economic interests in electricity generation companies. (Res. 057 of 1996) l The companies that develop production, sales or distribution activities may be marketers of natural gas. (Res. 057 of 1996) l Producers and/or transporters of natural gas may not develop the activity of gas-fired electricity generation. Maximum share: 25% of capital stock of the company that develops this activity. (Res. 057 of 1996). l Public utilities that were established before Law 142 of 1994 came into effect, may continue to carry out the activities that they developed up to that date in combination with the marketing activity, as long as they establish separate accounting systems for each activity. l On January 1, 2015, no company may attend, neither directly nor indirectly, more than 30% of the users of the distribution market. (Res. 071 of 1998) l No person may have more than 25% of the traded volume in the market of commercialization to end-users, regulated and non regulated, excluding gas for electricity generation, petrochemical production and the producer’s own consumption. The companies that up to the date of the Resolution have a higher share may not expand their systems by means of the purchase of stock shares or other mechanisms. (Res. 071 of 1998). Taking the Colombian market into account, it seems fundamental to avoid any kind of vertical and horizontal integration scheme due to the fact that this could increase the risks and inconveniences of an oligopoly, in spite of the advantages of a horizontal or vertical integration due to cost reduction. The following is an analysis of the consequences of possible vertical integration cases in the activities of the natural gas sector:

79
l Production and Transportation: it may cause limitations to free access to the transportation system, which is more likely to happen in situations of high concentration of the supply such as the case of Colombia; therefore it is recommendable to maintain the restrictions to vertical integration according to the regulations that were set forth for that purpose. l Transportation and Distribution: this type of integration may have an impact on the market when there is the possibility to establish which is the gas field that will be used in the different regions, not only due to the prices of gas but also transportation prices, especially if they involve discounts in respect of the maximum values that have been established. l In the case of non-regulated users, it may become a limiting factor of free access to the transportation networks when they decide to bypass the distribution network and connect directly to the transportation system. It is worth pointing out that the regulated user, according to the national norms, is supposed to have protection that allows him to pay only those charges for production and transportation that result from a bidding process by the respective distributors. l Production of Natural Gas and Generation of Electric Energy: closing deals between these two agents continues to pose the same problems that the projects installed in the inland faced in the middle of the last decade. While the producer of natural gas demands a high take or pay contract (in the order of 70%) for the delivery of gas under conditions of guaranteed firmness and with penalization in case of a breach, for a new thermal plant it would be difficult to guarantee a high minimum consumption due to the uncertainty of its own deliverability. It is worth noting that volumes of gas that are contracted under conditions other than full firmness, may cause the generator considerable economic losses (for example, lower charge per capacity) if the generator does not have the necessary gas to attend the dispatches of the CND24. An eventual integration between the gas producer and electricity generator could facilitate the development of business although the producer-marketer would be required to respect the principle of neutrality in the sense of offering the same commercial conditions as those of the project that is integrated to a third-party that takes the gas, as long as the technical conditions allow it. The obstacle that could appear in this respect is precisely having the capacity to verify that the principle of neutrality is complied with. In summary, a medium-sized or small market with a great concentration of supply, and few actors on the side of the demand requires rigorous handling in respect of the issue of integration in order to preserve the few agents that participate in the market and avoid the inconveniences that oligopolies bring.
5.2 Wellhead prices of natural gas In respect of wellhead prices, the regulations in force established that the prices at the Point of Entry into the National Transport System are determined freely subject to supervised freedom by the producers in all the fields of the country, except those located in la Guajira (Ballena) y Opón, with the following regulatory treatment:
24 CND: National Dispatch Center.
80
l Campo Guajira: it has its own regulated maximum price defined by Resolution 119 of 2005, and that to this date its value is 2,76 US$/MBTU. The Opón field also has a regulated maximum price that was established by Resolución 119 of 2005, which equals 3.121 US$/MBTU with the additional purpose of serving as reference for gas supply contracts signed by ECOPETROL and gas-fired thermal generators in inland Colombia . l Campo Cusiana: the prices for this field are fixed at 1,44 US$/MBTU at the entry of the national transport system by means of Resolution 050 of 2002. However, the price would not be subject to a maximum when production capacity increases over 180 MMCF/D. The free price system must be understood as supervised freedom, given that the CRE could revise the provisions of price liberation is in their opinion they are not adjusted to the conditions of the market. But on the other hand, a revision of this decision in the sense of returning to regulated regime, would be a changing the rules of the game that could serve as the base for private partners to make investments in natural gas production and treatment. l New Commercial Discoveries: they have free prices without conditions in terms of production capacity or date (CREG Resolution 0119 of 2005). However, as the previous case, the CREG could revise this situation if the minimum conditions of competition on the natural gas market are not met. The objective of price control is the protection of the user within the framework of the financial viability of the companies. Nevertheless, it may happen that for the sake of this protection, prices are established that fail to encourage investment in exploration and production, and therefore do not provide the market with the volumes of gas that are required to meet the demand. The case of Cusiana-Cupiagua reflects a price scheme where the initial signs turned out to be insufficient, to the point that the Cusiana Treatment Plant only started operations in September of 2005, with a four year delay in respect of the date that was initially planned. In the meantime, the gas system in the inland had to face situations of deficit due to production limitations of ECOPETROL to attend consumptions of new clients, particularly industrial clients. As a result, it was also impossible to carry out the negotiation of minimum volumes that would justify the gas interconnection project between Colombia and Panamá, due to the need to destine part of the production of La Guajira to attend the inland market. It is also worth mentioning that the R/P ratio, whose value is currently calculated at 14.94 years, is a clear signal of the sufficiency of reserves to attend the national gas demand, while the reality of the markets indicate that it is not possible to guarantee volumes for the attention of new clients. Maintaining the signal of controlled prices for the gas from La Guajira could limit the beginning of new exploratory activities in the zone since any discovery of natural gas would have free prices according to the regulations in force, and they would be forced to compete with the Guajira field with regulated prices. It is worth mentioning that the costs of the development of new fields will certainly be higher than the current costs of production of Guajira gas. The proposal is to establish another mechanism that will define long-term rules of the game, for example that the gas price liberation of La Guajira be conditioned on the existence of at least one new commercial-sized field that will become an alternative to supply the market that is
81
attended by that Guajira field. This way, investors would have clarity from the beginning as to the price signal of this field, which would eliminate the uncertainty for the application of the price liberation scheme. Nevertheless, the CREG may always make use of the powers stipulated in Articles 88.2 and 88.3 of Law 142 of 1994 to periodically determine if the conditions are present for there to exist competition between suppliers, to detect abuse in prices to the market and therefore if there are elements of judgment to maintain the price freedom regime.
5.3 Competition among producers and joint marketing Joint marketing of natural gas production which takes place under association contracts is related to the issue of competition in marketing on the level of producers. Joint marketing was the commercial mechanism that was used in the past in order to allow ECOPETROL to assume subsidies if the final prices did not compensate the prices of gas in the field of production and transportation costs. This way, the associate felt free from assuming the risks of marketing natural gas under conditions of uncertainty with prices to the final user that were administrated with a different kind of criteria that did not consider economic efficiency. In Resolution 071 of 1998, the CREG determined that as of September of 2000, producers of natural gas could not market their production jointly, nor jointly market the production of two or more different exploration and production contracts. Later, by means of Resolution 018 of 2002, Resolution 071 of 1998 was modified, and it was provided that producers of natural gas could not jointly market their production with other partners of the respective exploration and production contract, nor jointly market the production of two or more different exploration and production contracts. The CREG also pointed out that this prohibition would not allow the joint marketing of natural gas production coming from associated natural gas fields. The above would indicate that in the case of free gas fields, independent marketing is the norm to follow. It is evident that if the distribution and marketing of natural gas offers a broad portfolio of commercial opportunities, the different members of an Association Contract would not have incentives to market jointly, given that each one of them may individually find the type of demand that satisfies his sales expectations. On the contrary, if the market does not present an adequate diversity, producers will tend to market their sales jointly in order to reduce risks. As it is expressed below in this document, every day there is less competition in this segment of the gas chain, which leads us to conclude that with a market with the characteristics of an oligopoly in the demand, it would be difficult to have independent marketing in the supply and vice versa. Consequently, any decision that is made about joint marketing should be made strictly within the framework of the situation of the Colombian natural gas market, which advances towards levels of competition that are increasingly precarious.

82
5.4 Take or pay and take and pay contracts Purpose signing contracts is to establish the commercial conditions of the business and to determine the balance of risks between the parties. In this sense, the definitions of the terms “take or pay” and “take and pay” do not allow an adequate balance of risks between producer-marketer and final clients, particularly in respect of gas-fired thermal generators. Negotiations between producers-marketers and new thermal project could become even more complicated if modifications that allow equilibrium are not introduced. In the take or pay scheme, the producer-marketer receives a price that is lower than the maximum regulated price in terms of the agreed percentage of minimum consumption and requires a practically annual correction in the liquidation of the contract, bearing in mind that if gas consumption is less than the percentage of minimum consumption, the resulting price would be higher than the maximum regulated price, which necessarily requires making adjustments against the seller and in favor of the buyer. Under these conditions, the “take or pay” sense of a contract is completely lost. When the objective is to provide the producer-marketer a guaranteed minimum income that will allow recovering the risk investments in exploration and the corresponding development phase of the fields. The take and pay modality does not require any minimum consumption commitment by the buyer, but it assigns, the producer-marketer the full responsibility of guaranteeing firmness in the supply of natural gas, which causes fines in case of a breach. This commitment to firmness must be guaranteed “as long as there are reserves and the supply is technically feasible”, that is, even if the user did not consume the natural gas (which is possible in case of a thermal generator), the producer-marketer must maintain the obligation of firmness during the contractual period. In a scheme of this nature the distribution of risks is asymmetrical, since it is the seller, who assumes the risks while the buyer has no commitments to fulfill, even though compensation for the application of the maximum price of Resolution 119 of 2005 is considered. Therefore, these contracting modalities have the following inconveniences: l They do not adjust to the universal concepts of contracting. l They offer an inadequate balance of risks between the producer-marketer and the contracting party. In the definitions as they are, the perception is that there is a benefit for the second party in respect of the first, given that the risks are fully assumed by the producers-marketers. l There is no clarity as to what may happen when gas prices are liberated and there is no reference to Resolution 119 of 2005.
5.5 Regulation of the transportation activity The current methodology establishes pass-through charges, where the total cost of transportation is defined as the summation of charges for the different stretches of the gas pipeline that the natural gas must run through. Said pass-through charges remunerate the following items: 1. Maximum fixed and variable charges per distance to remunerate the investment 2. Fixed charge to remunerate the AOM expenses

83
3. Two stamp prices whose purpose is to remunerate part of the investment in the main and branch gas pipeline system. The fixed and variable charges, in turn, as well as the stamp charge items, are organized in pairs. In one extreme there is a pair that remunerates the transportation service by means of the application of 100% of the fixed charge and 0% of the variable charge, which means that the risk is assumed by the sender, while the transporter receives the payment of the service. Regardless of the volume of gas that is transported. In the other extreme, there is the pair of charges 0% of the fixed charge and 100% of the variable charge, which indicates that the risk is totally on the transporter since he receives the payment for his service only when the gas is transported. The characteristic of this methodology is in the distance signal, which approaches what would happen in a competition market where the prices reflect the costs of providing the services. The effect is that the gas costs more as the centers of demand are located farther from the fields of production as it happens with the markets of Bogotá, Medellín and particularly the West. The following issues about the topic are presented: 1. The expansion of the transport system is based on the scheme of contracts or “contract carriage” whereas the electric transportation system is based on the concept of “common carriage” or common transporter where the expansion is planned centrally in the transportation service is paid by means of a stamp type price. The natural gas transport system will be expanded when the contracts provide the transporter with the necessary guarantees and the transporter has a volume that justifies the expansions of the transportation capacity in such a way that they will start operating when the gas supply and demand balance requires it. This consideration is critical in stretches that may quickly get fully loaded like El Porvenir-Vasconia, which does not allow the total evacuation of the gas from Cusiana in the production of La Guajira decreases rapidly. Consequently, it is necessary to evaluate the effectiveness of the expansion signal by way of contracts taking into account the events that took place this year, such as the withdrawal of compressors and their impact in the supply of gas to the inland. 2. The current regulations made the contracting of transportation flexible by introducing the concept of the pairs of charges, which allows the sender to propose the fixed and variable charge combination that better fits his load curve. However, each pair of charges should be indifferent for the transporter, given that although the level of risks changes from one pair to the other, he is compensated by the price, which increases as there is a pair of charges with a greater variable component in percentage. Moreover, it can be seen that the regulations in force allow the transporter to resort to the procedure of ordinal approximation, which converges at an intermediate point, which is not convenient for the interests of the client as it does not allow optimizing the handling of his load curve. In summary, the sender should be autonomous in the decision in respect of the pair of charges that he wishes to apply to the contract, based on the criterion that the transporter must be neutral regarding the range of pairs of charges that the norm allows the agents to consider.

84
3. On the other hand, transportation prices in the inland became an arbitration mechanism of the gas supply by determining which of the two main fields is competitive in the central, southern and western zones. Under these conditions a production field with a higher economic cost but whose transport to consumption centers is relatively lower is used at the expense of another field, whose economic cost is lower, but with higher transport prices. In the midst of this disposition are the options to define transport prices: signal per distance and in charge. In the latter, transportation has a neutral effect regarding the different fields of production and the signals are given which allow optimizing the country's resources, first by using the fields with the lower economic cost and later those with a higher cost. However, in a maturing natural gas market such as ours with two large fields of production, the implementation of a stamp price before a scheme based on distant signals would possibly allow a greater penetration of natural gas.
5.6 Regulation of the Distribution Activity The scheme that came into force by means of Resolution 011 of 2003, allows the distributor to structure differential prices for ranges of consumption in such a way that the total revenue does not exceed what corresponds to the average distribution charge. According to the norms in effect, the distributor (although being required to public processes for the purchase of gas from the regulated market) may make discriminate purchases not only for the regulated market, but also for the non-regulated market. In the first case he may handle higher prices than in the second due to the price level of the substitutes: this may lead the regulated sector to end up “leveraging” the prices of the non-regulated sector given that the latter has a much tighter limiting factor by virtue of the prices of the substitutes (coal, heavy crudes). It is possible that this way of discriminating the purchases between regulated and nonregulated users is the only way to guarantee a reasonable penetration of natural gas in a sector with such intense competition. In general terms, the possibility of having brought competition in the provision of the service on the level of regulated and non-regulated final users among distributors and marketers becomes difficult because of the following two reasons: l Price discrimination by volume l The users’ lack of information regarding the commercial practices of the distributors, and particularly of the price scales in respect of volume. In practice, it is difficult to verify the distributor’s compliance with the principle of neutrality towards the consumers. One particular consumer does not have the tools to verify he is being treated on equal terms in respect of other users of similar characteristics, unless he has the information about the distributor’s price scales, which will allow him to reach conclusions as to the treatment that he is receiving compared to the market universe. Likewise, for an external marketer, entering a market under these conditions imposes some very difficult access barriers due to the restriction of information, except in the case of
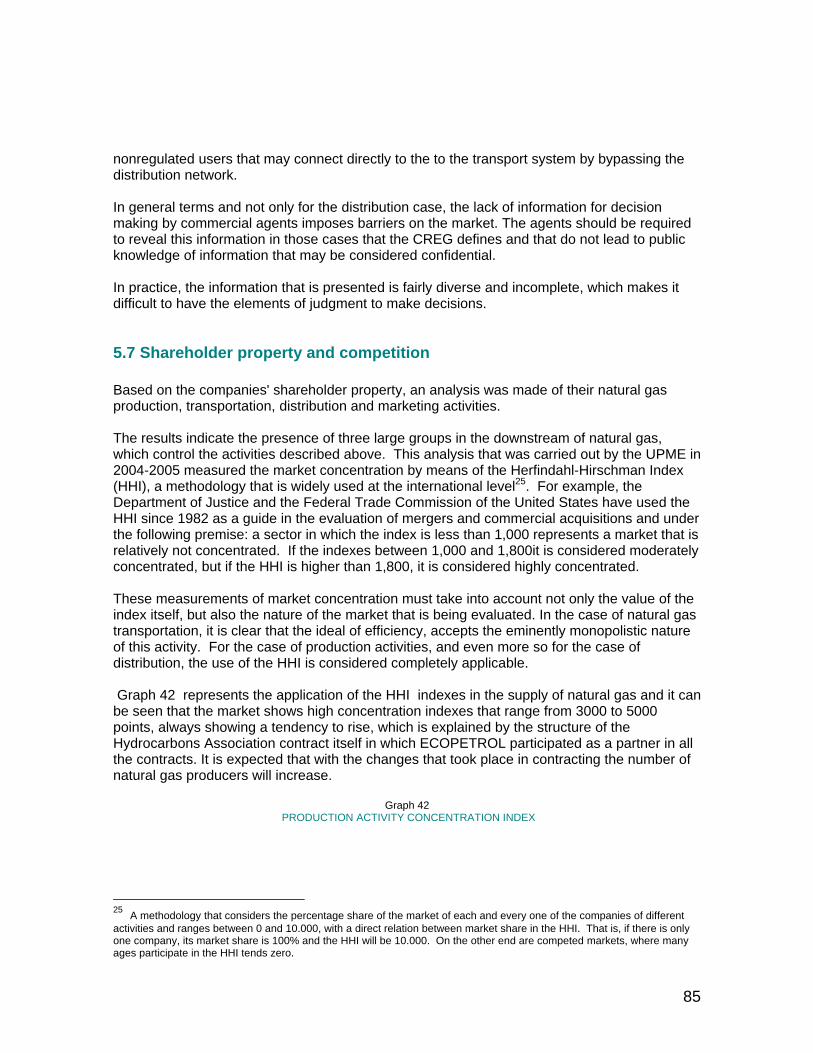
85
nonregulated users that may connect directly to the to the transport system by bypassing the distribution network. In general terms and not only for the distribution case, the lack of information for decision making by commercial agents imposes barriers on the market. The agents should be required to reveal this information in those cases that the CREG defines and that do not lead to public knowledge of information that may be considered confidential. In practice, the information that is presented is fairly diverse and incomplete, which makes it difficult to have the elements of judgment to make decisions.
5.7 Shareholder property and competition Based on the companies' shareholder property, an analysis was made of their natural gas production, transportation, distribution and marketing activities. The results indicate the presence of three large groups in the downstream of natural gas, which control the activities described above. This analysis that was carried out by the UPME in 2004-2005 measured the market concentration by means of the Herfindahl-Hirschman Index (HHI), a methodology that is widely used at the international level25. For example, the Department of Justice and the Federal Trade Commission of the United States have used the HHI since 1982 as a guide in the evaluation of mergers and commercial acquisitions and under the following premise: a sector in which the index is less than 1,000 represents a market that is relatively not concentrated. If the indexes between 1,000 and 1,800it is considered moderately concentrated, but if the HHI is higher than 1,800, it is considered highly concentrated. These measurements of market concentration must take into account not only the value of the index itself, but also the nature of the market that is being evaluated. In the case of natural gas transportation, it is clear that the ideal of efficiency, accepts the eminently monopolistic nature of this activity. For the case of production activities, and even more so for the case of distribution, the use of the HHI is considered completely applicable. Graph 42 represents the application of the HHI indexes in the supply of natural gas and it can be seen that the market shows high concentration indexes that range from 3000 to 5000 points, always showing a tendency to rise, which is explained by the structure of the Hydrocarbons Association contract itself in which ECOPETROL participated as a partner in all the contracts. It is expected that with the changes that took place in contracting the number of natural gas producers will increase.
Graph 42 PRODUCTION ACTIVITY CONCENTRATION INDEX
25 A methodology that considers the percentage share of the market of each and every one of the companies of different activities and ranges between 0 and 10.000, with a direct relation between market share in the HHI. That is, if there is only one company, its market share is 100% and the HHI will be 10.000. On the other end are competed markets, where many ages participate in the HHI tends zero.

86
Source: Study Analysis of the Gas Mass Consumption Plann. In this case ECOPETROL holds a clearly monopolistic position in the market of natural gas production, which is slightly starting to decrease as of 2002 when the partners of the Guajira Contract started independent marketing. Graph 43 shows the evolution of the application of the HHI for the case of the groups. Concentration indicators change significantly for the case of corporate groups. The Herfindahl indexes that were found have stayed over 2,600 points, although there is a tendency to decrease that can be seen since 2000. This can be explained by the lower growth rate of the large markets compared to the exclusive areas. The conclusion is that unions on the level of corporate groups increase the Herfindahl index, taking it to levels where the market is no longer considered moderate, but highly concentrated.
Graph 43 COMPARISON OF CONCENTRATION INDEXES IN DISTRIBUTION
Source: Study Analysis of the Gas Mass Consumption Plann. Initially, it may be said that the marketing activity allows the aggregation of the consumptions of distributors, which in turn facilitates the negotiation of better terms with natural gas producers and transporters. Theoretically, this is good for the interests of consumers that are attended by these companies. Nevertheless, it would be necessary to determine if this hypothesis is confirmed when the work of consumption aggregation is the result of commercial management that serves the interests of the distributors and not the effect of shareholder control of companies.

87
5.8 Norms With the goals that were proposed in the gas mass consumption plan and in the 2002-2006 National Development Plan, the norms are aimed at finding ways for this fuel to reach smaller municipalities and rural areas. The potential that this fuel represents has also been seen if it is marketed internationally; for this reason, the conditions under which the exportation would be made possible have been defined. In this sense, the Ministry of Mines and Energy announced two greatly transcendental decrees. Decree 3428 of 2003, which regulates Article 59 of Law 812 of 2003 and Article 23 of Law 142 of 1994 in respect of international commercial exchanges of natural gas and other provisions are set forth. It establishes the definitions that are applicable to the international marketing of natural gas and fundamental guidelines are offered for the practice of this activity, guaranteeing the protection of national interests in terms of access and use of its gas resources. The second is Decree 3429 of 2003, which regulates Article 65 of Law 812 of 2003 in relation to the marketing of natural gas and other provisions are set forth. Within this framework of governmental policies that were presented in the Development Plan and for the sake of protecting the market and guaranteeing the provision of the domiciliary public service of natural gas, the rules are given for the marketing of natural gas in the national territory. Likewise, decree 802 of 2004 was passed, which establishes some provisions, to promote the consumption of compressed natural gas for natural gas vehicles (NGV), in order to accelerate the process of liquid fuel substitution in the transportation sector. In order to increase the coverage in natural gas service Decree 3531 of 2004 was passed, by means of which the necessary rules were defined so that not only companies but also territorial entities would formulate projects to promote the use of natural gas, especially aimed at Colombians located in the zones of influence of the main gas pipelines and those with the highest indexes of unsatisfied basic needs. The Ministry also issued Decrees 1404 of 2005 and 1404 of 2006, which approved the alienation of state participation program which is represented in assets, rights and contracts belonging to ECOGÁS, which are related to natural gas transport, its operation and explication, by means of the establishment by successive subscription of stock from the company Transportadora de Gas del Interior S.A. E.S.P. TGI S.A. E.S.P. On the other hand, Decree 1484 of 2005 was issued in relation to the occurrence of restrictions in the supply of gas to provide this public service, fixing priorities in the order of attention when insurmountable restrictions in the supply of Natural Gas or non transitory situations of serious emergency take place which impede guaranteeing a minimum supply of the demand. This decree takes into account the effects on the population, the needs of electricity generation, the duly executed contracts, as well as all those criteria that allow a balanced solution to the consumption needs of the region or regions that are affected. Decree 2400 of 2006 was passed in order to make international interconnections possible. It regulates the construction of International Interconnections of Natural Gas and it establishes other provisions.

88

89
CHAPTER 6 NATURAL GAS AND THE ELECTRIC SECTOR
6 NATURAL GAS AND THE ELECTRIC SECTOR 26
6.1 Colombian Electric Sector The installed net effective capacity of the National Interconnected System-SIN for the 2003–2006 period is presented in table 13. On August 31, 2006 it was 13.3 GW27
of which 12,910 MW28
(96.2%) are dispatched centrally and 444 MW (3.3%) without central dispatch. Of the net effect of capacity that is not dispatched centrally, 378 MW (85.1%) correspond to hydraulic plants, 22 MW (4.9%) correspond to plants that operate with natural gas, 19 MW (4.4%) to wind generators and 25 MW (5.7%) to cogeneration. The average daily availability of electric power generation plants in the 2003-2006 period was 11,889 MW. The month with the lowest power availability was May of 2005 with 11,027 MW and the month with the greatest availability was December of 2004 with 12,668 MW, although percentage wise the month with the greatest availability in respect of the installed capacity was December of 2003.
Table 13 2003-2006ELECTRICITY GENERATION DATA
2003 2004 2005 2006
Average effective capacity (GW)
13.30 13.23 13.36 13.32
Average Availability (%)
90% 88% 89% 90%
Actual power generation (GWh/día)
125.39 128.47 133.79 137.53
Percentage generated
14.5% 14.0% 14.1% 11.5%
26 La información suministrada en esta capítulo se tomó de la Versión Preliminar del Plan de Expansión de Referencia de Generación y Transmisión, versión 2005–2019 publicada por la Unidad de Planeación Minero Energética. 27 GW Giga Vatios. 28 MW Mega Vatios.

90
Thermal gas (%)
Percentage generated Hydraulic (%)
76.8% 78.4% 77.3% 79.0%
Source: Neón-XM. The SIN had an average daily generation of 130.73 GWh29, where the generation of hydraulic plants has the largest share, followed by gas-fired thermal plants with a much smaller percentage compared to hydraulic plants (13% approximately) and then coal-fired plants, whose share is in the order of 7%. There is an additional category of plants that generate with nonconventional energy, whose contribution to the system accounts for around 1%. The energy that was generated with hydraulic resources accounted for a daily average of 105 GWh of which Guavio had a 15% share, followed by the plants San Carlos and Chivor with 14.9% and 11.3% respectively. In June of 2006 the Calderas generation plant started to operate. It is located in the Department of Antioquia with a capacity of 26 MW. The largest share of hydraulic generation corresponds to plants that had high levels of as-needed dispatch.
Graph 44 2003-2006ELECTRICITY GENERATION OF HYDRAULIC PLANTS
Source: Datos Neón-XM. During the period that was analyzed, the generation of electric power that was attended by plants that operate with natural gas or fuel oil, was a daily average of 18 GWh, of which 59% was generated by the Tebsa plant in Barranquilla, 16% by the Flores planned, and 7.7% by the Termoguajira plant. Graph 45 presents an evolution of the behavior of the different thermal plants. The average generation with thermal plants was 5.88 GWh per day, of which 41% was generated by Paipa 4, followed by Tasajero with 31%. (See Graph 46).
29 Giga Vatios Hora.

91
In 2004, the total domestic demand was 47,019 GWh, which equals 2.73% over the total accumulated to the same date in 2003. However, if the leap year effect is corrected, normalizing the demand over the total of the day that passed, the accumulated growth would be 2.45%.
Graph 45 2003-2005 SHARE OF ELECTRICITY GENERATION OF GAS-FIRED PLANTAS
Source: Neón-XM Data. Elaboró UPME.
Graph 46 2003-2006 ELECTRICITY GENERATION OF COAL-FIRED PLANTS
Source: Neón-XM Data. Elaboró UPME. Regarding month-to-month growth, the “calendar effect”, which is produced by holidays, can clearly be seen in the last semester. Consumption declines and it affects the growth of the demand. In June of 2003, there were three holidays, whereas in 2004 there were only two, which is why there was more growth in 2004. In 2006 there has been significant growth of the demand for electricity which is related to the economic growth of the country, which also has had above average figures. Graph 47 presents the evolution of the demand for electricity of the last 4 years. It must be pointed out that the information of 2006 corresponds to the average until August. This crap shows the recovery of the demand, where the daily average went from 125 GWh in 2003 to 137 GWh in 2006, which means an annual growth of close to 2.5%. The demand for electric power has among the highest correlations with economic growth, this is why the same trend in its behavior is seen in the behavior of the of the GDP.

92
Graph 47
EVOLUTION OF THE DEMAND FOR ENERGY
Source: Neón-XM Data. Written by UPME.
6.2 Coordination between the Natural Gas and Electricity sectors The gas and electricity sectors have developed their national and international markets apart from one another although in certain aspects they share some similarities and potentials. However, it is important to take into account that there are important benefits in examining the gas and electricity issues together as a complement and not as competition. In order to improve the quality and lower prices, the governments, regulators and agents of the chain are in charge of making the integration of these two sectors of viable30. The development of the electricity sector in the country has been marked by strong regulatory component and is centralized. The proposal for this sector is made based on the demand projections. The natural gas sector has had a different development, given that the expansion of the infrastructure is made based on the contracts that have been signed, and it is not centralized. In large and mature markets, vertical and horizontal integration reduces operation costs, but in small and medium-sized markets there is the risk that these may become oligopolies. In the case of vertical integration, the following situations may take place: in production and transportation, free access is limited in a situation of high concentration of supply such as the Colombian case. In transportation and distribution, the field from which the preferred gas comes from can be chosen, and in the case of non-regulated users, it can become a limiting factor of free access to the transportation networks when the decision is made to connect directly to the transportation system. Due to the nature and development of the two sectors, the gas sector does not have the equivalent of a charge for reliability, since the producers would have to be paid for the required 30 Conclusiones: “SIEGE - Seminario Internacional Integración Energética Gas y Electricidad, CIER”, septiembre de 2004

93
expansions of their infrastructure and these would have to stay available for the occasions when temporary demand increases took place; likewise, a charge would have to be recognized for transporters to make the necessary expansions to cover those demands, and those costs would be transferred to the users. The CREG has proposed that the expansion of the generation capacity in the country be made by means of market mechanisms, which basically consist of auctions accompanied by price options from which the obligation of the delivery of energy by the offerer would be requirable. However, those who participate in these option mechanisms must guarantee that they are capable of generating the energy which they are committing to generate in case that the price of the Wholesale Energy Market exceeds the price of the option. In order to guarantee power generation in the case of a natural gas project, it is necessary to have the gas supply contracts, otherwise any generator agent could enter the auction mechanism and not be available to generate when the obligation becomes requirable. For this it is required that producers start formal conversations with the generators. However, the installed capacity based on natural gas may reach a total of about 3,661 MW, which would imply the need to sign contracts of about 610 MBTU per day, a figure that is much higher than the national demand for gas. Therefore, no points of convergence can be seen between the gas and electricity sectors regarding such a vital issue for expansion as the levels of contracting of natural gas for electricity generation, given that the Colombian electric sector generates most of its power with hydraulic plants and has thermal generation plants as a backup component for dry spells and periods of high demand. On the other hand, the CREG has proposed the possibility that other fuels or sources of energy be used for electricity generation. In respect of liquid fuels, there is no clarity as to the way to develop the supply and transport logistics which would be necessary to implement in order to receive the fuel-oil, or diesel fuel and kerosene, so that they may be used in the current thermal plants. There is no clarity either about the dimension of the needs for liquid fuels that would replace natural gas. For example, Termovalle, with a 263 MW capacity, requires a volume of diesel fuel of approximately 6,200 barrels per day working at full capacity, which in fact, is a significant percentage of the regional demand of this fuel. In the case of natural gas production and generation of electric power, with high supply and low demand could become an oligopoly. While the natural gas producer, demands a high Take or pay for the delivery of gas under conditions of guaranteed firmness and with penalizations in case of a breach, for a new thermal plant it would be difficult to guarantee a high minimum consumption due to the uncertainty of its own deliverability. It is worth noting that volumes of gas that are contracted under conditions other than full firmness, may cause the generator considerable economic losses if the generator does not have the necessary gas to attend the dispatches of the National Dispatch Center. An eventual integration between the gas producer and electricity generator could facilitate the development of business although the producer-marketer would be required to respect the principle of neutrality.

94
6.3 Definition of generation alternatives in strategies The Reference Generation Transmission Expansion Plan 2005 - 2019 takes into consideration several generation alternatives which contemplate among other variables and an assumption the following: historical flows 1975-2004, cost the fuels, energy and power demand and installation and withdrawal of generation units among others. The prospective generation analysis is intended to determine the short-term alternatives and long-term generation strategies with the lowest cost for the system which will allow meeting the energy requirements in the country. The preliminary results of the generation analysis that were presented for the short and long-term indicate the following: 1. It is necessary that the country have a generation expansion of at least 150 MW by the beginning of 2010, in addition to the entry of the Porce III project. In order to limit the vulnerability of the Atlantic Coast for depending on only one fuel for its generation, this capacity should be located in the north of the country and based on mineral coal. 2. The generation requirements to adequately meet the demand for energy show that in the 2010-2014 period the system requires the installation of 320 MW in addition to the entry into operation of the 660 MW of the Porce III project. In case the electric interconnection with Panamá is carried out, the Clinton them will require 800 MW in addition to the Porce III project, in order to meet the local demand, as well as maintaining the level of energy exportations towards Ecuador and Panamá. The following are the projects that are being considered in the analysis of the generation expansion plan not only on the short-term, but also on the medium-term.
Table 14 PROJECTS UNDER EXECUTION IN COLOMBIA
PROJECT TYPE CAPACITY
MW DATE LOCATION
Río Amoyá Hidro 80 Jul-09 yolima
Porce III Hidro 660 Jun-10 Antioquia
Río Manso Hidro 27 Ago-10 Caldas
Total – MW 767 Source: UPME.

95

96
CHAPTER 7 Natural Gas Substitutes
7 NATURAL GAS SUBSTITUTES Natural gas is a fuel that entered the national energy market as a backup and substitution fuel. This is evidence of the importance of the existence of different fuel options that may be used in periods of shortage. Currently, the objective is to encourage the use of fuels that produce fewer emissions that pollute the atmosphere, are clean fuels. In this aspect natural gas represents an advantage in its use given that in sectors such as transportation and industry, it substitutes mainly fossil fuels with a high level of emissions. On the other hand, gas may be obtained from different sources such as the biomass and wastes, which allows a better use of the resources and sustainability on the long-term. In the electric sector, some generation plants whose main fuel is natural gas, may operate with substitute fuels, which allows a higher reliability in the operation, due to the uncertainty in the projections of production and a low level of reserves that have been added to the already known reserves in the country. What determines the mass use of this fuel are the availability, the price, the efficiency and the technology. These are the factors that mainly affect the preferences of users and that determine the competitiveness of a fuel among the options y for the different demand sectors.
7.1 Comparative analysis of natural gas substitutes by price 2003-2006 7.1.1 Commercial-Residential Sector Total energy consumption in the residential sector shows an evolution with a tendency to drop, due to the process of substitution between sources with significant results in the structure of the consumption matrix. The substitution of firewood for gas, both natural gas and LPG, have allowed important changes in the Colombian energy balance, besides the considerable contribution to the preservation of the environment. In the residential and commercial sectors, natural gas concentrates its uses basically in the heating of water and cooking, where it competes with technologies that use electricity and LPG and coal to a lesser degree. The costs of service, without including the change of technology, represent savings in the bill when you compare the consumption of 20m3 of natural gas with 205 KWh of electric energy and 7.6 gallons of LPG. The savings are proportional to the stratum, given that the amount in
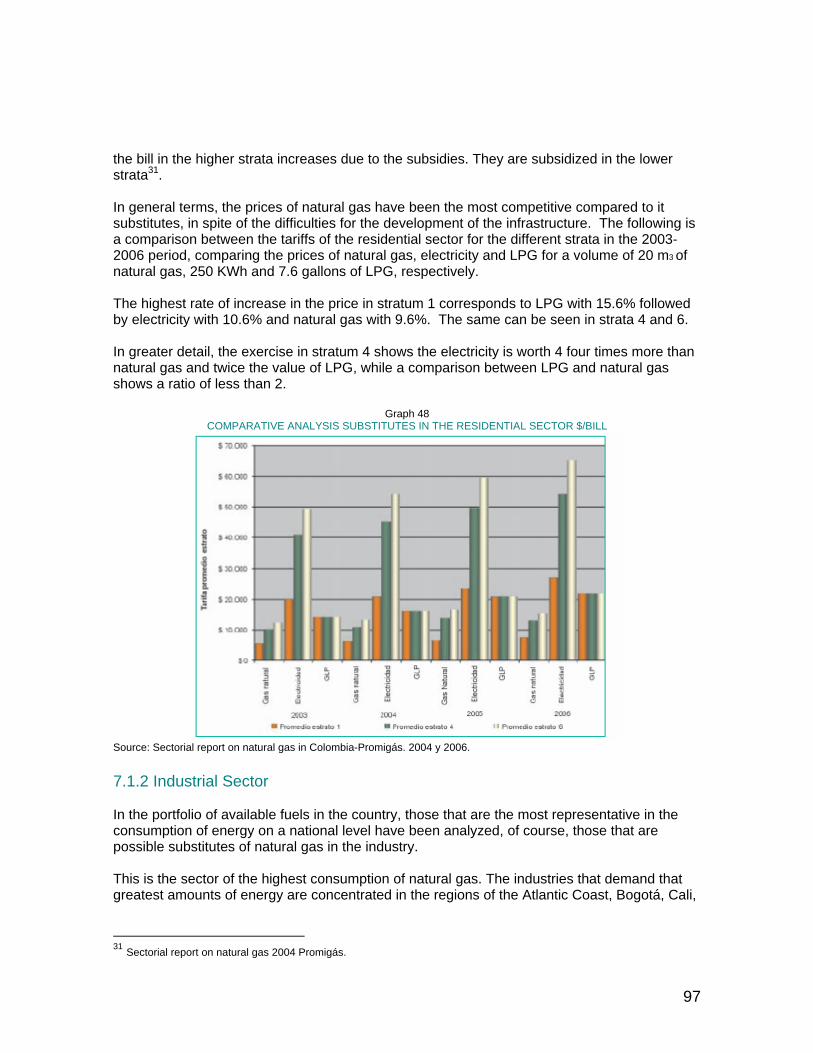
97
the bill in the higher strata increases due to the subsidies. They are subsidized in the lower strata31. In general terms, the prices of natural gas have been the most competitive compared to it substitutes, in spite of the difficulties for the development of the infrastructure. The following is a comparison between the tariffs of the residential sector for the different strata in the 2003-2006 period, comparing the prices of natural gas, electricity and LPG for a volume of 20 m3 of natural gas, 250 KWh and 7.6 gallons of LPG, respectively. The highest rate of increase in the price in stratum 1 corresponds to LPG with 15.6% followed by electricity with 10.6% and natural gas with 9.6%. The same can be seen in strata 4 and 6. In greater detail, the exercise in stratum 4 shows the electricity is worth 4 four times more than natural gas and twice the value of LPG, while a comparison between LPG and natural gas shows a ratio of less than 2.
Graph 48 COMPARATIVE ANALYSIS SUBSTITUTES IN THE RESIDENTIAL SECTOR $/BILL
Source: Sectorial report on natural gas in Colombia-Promigás. 2004 y 2006. 7.1.2 Industrial Sector In the portfolio of available fuels in the country, those that are the most representative in the consumption of energy on a national level have been analyzed, of course, those that are possible substitutes of natural gas in the industry. This is the sector of the highest consumption of natural gas. The industries that demand that greatest amounts of energy are concentrated in the regions of the Atlantic Coast, Bogotá, Cali,
31 Sectorial report on natural gas 2004 Promigás.
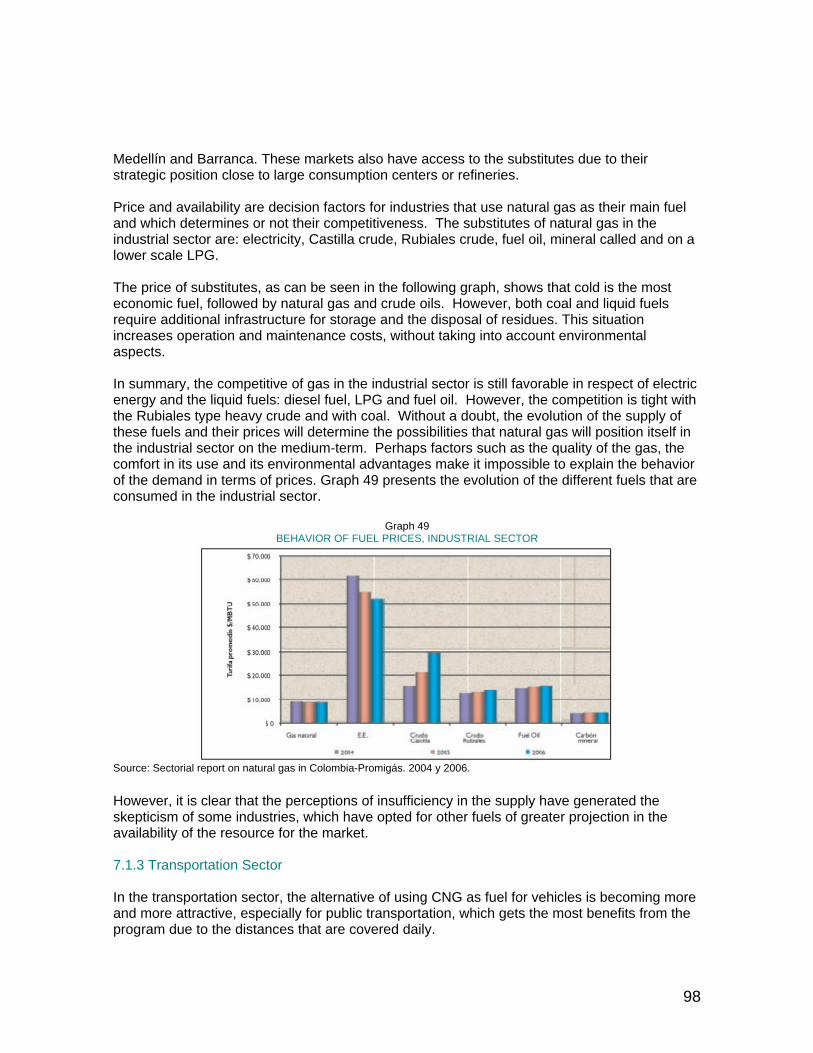
98
Medellín and Barranca. These markets also have access to the substitutes due to their strategic position close to large consumption centers or refineries. Price and availability are decision factors for industries that use natural gas as their main fuel and which determines or not their competitiveness. The substitutes of natural gas in the industrial sector are: electricity, Castilla crude, Rubiales crude, fuel oil, mineral called and on a lower scale LPG. The price of substitutes, as can be seen in the following graph, shows that cold is the most economic fuel, followed by natural gas and crude oils. However, both coal and liquid fuels require additional infrastructure for storage and the disposal of residues. This situation increases operation and maintenance costs, without taking into account environmental aspects. In summary, the competitive of gas in the industrial sector is still favorable in respect of electric energy and the liquid fuels: diesel fuel, LPG and fuel oil. However, the competition is tight with the Rubiales type heavy crude and with coal. Without a doubt, the evolution of the supply of these fuels and their prices will determine the possibilities that natural gas will position itself in the industrial sector on the medium-term. Perhaps factors such as the quality of the gas, the comfort in its use and its environmental advantages make it impossible to explain the behavior of the demand in terms of prices. Graph 49 presents the evolution of the different fuels that are consumed in the industrial sector.
Graph 49 BEHAVIOR OF FUEL PRICES, INDUSTRIAL SECTOR
Source: Sectorial report on natural gas in Colombia-Promigás. 2004 y 2006. However, it is clear that the perceptions of insufficiency in the supply have generated the skepticism of some industries, which have opted for other fuels of greater projection in the availability of the resource for the market. 7.1.3 Transportation Sector In the transportation sector, the alternative of using CNG as fuel for vehicles is becoming more and more attractive, especially for public transportation, which gets the most benefits from the program due to the distances that are covered daily.

99
The price of CNG for vehicles is pondered at 60% of the price of gasoline. Therefore, a fast recovery is made of the investment in technology conversion. There have also been programs with economic incentives aimed at speeding up the substitution process of liquid fuels for gas; such is the case of discount certificate for the installation of conversion kits, which translates to more savings. Graph 50 shows the behavior of the price in Colombian pesos per gallon or gallon equivalent for the case of CNG. The competitiveness of CNG lies in the price difference which since 2000 tends to converge with the price of diesel fuel, which in turn is moving away from the price of regular gasoline and only since 2005 is the price of CNG tending to move away from the price of diesel fuel. The price of premium gasoline is always higher and its use is confined to the reduced number of vehicles that require it. Given the historical importance of the consumption of gasolines and the change in their prices from 2001 to this date, it is convenient to point out that according to the econometric analysis that was carried out, a price elasticity of demand of approximately -0.4 has been recorded. Therefore, it can be said that the price policy that has been applied has significantly contained the demand in recent years. The consumption of diesel fuel was encouraged, thus reversing the historical tendency of gasoline deficit and intermediate fuel surplus. This required the importation of diesel fuel, while gasolines are being exported. (See graph 50). 7.1.4 Electric Sector The electric sector in Colombia has been characterized by having a high hydraulic component. However, rationing events such as what happened in 1992 showed the need to diversify the primary sources of electricity generation. Besides having hydraulic generation, the country now has thermal generation facilities powered by non-renewable energy sources such as gas and coal, and on a lower scale, alternative sources of energy such as wind energy (Jepirachi, located in the Department of La Guajira). In order to evaluate the different generation alternatives that are required for the expansion of the system, it is necessary to analyze investment, fuel and operation costs among others. As general information about the different technologies, the production of electricity with hydropower has economical advantages given that production costs do not imply costs that are associated with fuel for production and transportation: the same characteristic is shared with the generación coming from wind power, which makes use of the natural resource. However, these plants are associated with opportunity costs. On the other hand, technologies that use fossil fuels such as natural gas, mineral coal, liquid fuels such as diesel and fuel oil, have costs that are associated with fuels, which can be traded on the market. This is one of the reasons that makes the variable cost of thermal generation higher than the cost in a hydroelectric plant. Moreover fuel costs vary depending on the plant location.
Graph 50 PRICE BEHAVIOR IN THE TRANSPORTATION SECTOR

100
Source: UPME. In this sector natural gas competes mainly with coal-fired generation, in relation to fuel costs and efficiency. The average installation and operation costs for generation centrals with different technologies are compared in table 15.
Tabla 15 PLANT COSTS BY TYPE OF FUEL AND TECHNOLOGY
FUEL WATER GAS GAS GAS COAL WIND
TECHNOLOGY SIMPLE COMBINED
CYCLE CLOSED CYCLE
PULVERIZED AERO-
GENERATOR
Capacity (GW) 200 150 200 450 150 19.5
Power Generation Costs (USD/MWh)
$0.03 $0.05 $0.04 $0.03 $0.04 $0,03
Installation cost (USD/MW)
$1,125 $495 $700 $1,018 $1,069 704
Efficiency % 34.3 49.3 29.7
Yearly Fuel Costs (MUS$/año)
$0 $18.73 $17.10 $4.5 $5.34 $0
Source: CIGE Version 1.0 of Integral S.A. 2005. Fuel costs depend on the plant factor, which for this case are supposed to be 0.65 for natural gas-fired plants and 0.7 mineral coal-fired plants.

101
From the table above it and can be concluded that natural gas-fired thermal plants have lower installation costs than mineral coal-fired plants. However, coal centrals have a lower generation cost, a lower efficiency, and higher level of greenhouse gas emissions that natural gas plants.
7.2 Projections-Substitution Scenarios 32 The study carried out by the Fundación Bariloche on price policies, did a substitution analysis between sources in order to estimate the impact of prices on the projections of final demand, taking 2005 as the base year. In order to determine the projections, different fuel substitution alternatives were assumed, starting from structure of the current consumption of energy by sources in each sector, subsector and/or use,33 using the relative prices of the fuels, the costs of investment, the quality of providing the service and environmental impact of each equipment-source option. The substitutions are presented in the residential, commercial, industrial and transport sectors. The scenarios are configured starting from a basic assumption such as considering the different wellhead prices of natural gas as follows: 1.65 US$/MBTU for the base case and 2.5, 3.5 and 4.0 US$/MBTU for each one of the scenarios. The price per barrel of oil was assumed to be between 60 and 65 dollars to establish the supply of petroleum products starting from a diversified range of alternative sources (CTL, GTL and biofuels). In the case of mineral coal, a price of 77 US$34
/ton was used for the year 2005 and 92 US$/ton as of 2010 both for the base case and for the different scenarios. The price structure for the different fuels is presented in table 16. (Next page). For the base case, that is with the current price structure and a Natural Gas wellhead price of 1.65 US$/MBTU, the results showed that the increase in fuel consumption during the 2005-2025 period is a yearly average of 2.73%, natural gas being the source with the greatest penetration with an average rate of 5.54%, therefore gaining a 11.0% share in the total final consumption of the energy package. This increase would be reflected in the following uses: 1. Urban Residential: mainly in cooking where it displaces electricity. LPG maintains its share in this use 2. Commercial and Public: displaces LPG35
and electricity in process heating
Tabla 16 FUEL PRICE SCENARIOS US$/MBTU
32 The information for the section was taken from the “Study: Design of an integral price policy of fuels for the Colombian case”. Fundación Bariloche. 2006. 33 They worked with the consumption of useful energy in all the sectors, except the Transportation sector, where they worked directly with net energy. 34 This price includes handling and transportation. You start with a low wellhead amount and then take it to the estimated price in order to make a reorganized industry supportable. 35 In fact the displacement of LPG in urban areas starting from the PMG was predicted in this study carried out by the IDEE/FB in association with C. García and J. E. Torres, UPME, study of the potential demand of fuel gases, 1997. This leads us to analyze the role and potential of LPG in rural areas which is contemplated in this analysis in an approximate manner.

102
BASE CASE SCENARIO 1 SCENARIO 2 SCENARIO 3
2005 2010
further 2005
2010 further
2005 2010
further 2005
2010 further
Cost wellhaed
1.65 2.50 3.50 4.00
Residential
Natural Gas
6.64 7.58 9.63 12.23
PLG 10.88 11.51 10.88 11.51 10.88 11.51 10.88 11.51
Electricity 22.19 22.99 24.23 25.56
Public / Commercial
Natural Gas
6.87 7.83 9.91 12.56
PLG 10.88 11.51 10.88 11.51 10.88 11.51 10.88 11.51
Electricity 26.63 28.53 32.32 36.47
Industry
Natural Gas
6.87 7.83 9.91 12.56
Coal 2.57 3.06 2.57 3.06 2.57 3.06 2.57 3.06
Diesel 18.50 20.17 18.50 20.17 18.50 20.17 18.50 20.17
Fuel Oil 10.57 11.25 10.57 11.25 10.57 11.25 10.57 11.25
Transportation
Gasoline 25.93 27.26 25.93 27.26 25.93 27.26 25.93 27.26
Diesel 18.50 20.17 18.50 20.17 18.50 18.50 20.17 18.50
20.17GNV 9.63 10.48 12.33 14.68 Source: FB Price Policy Study. 3. Industrial: with the moderate penetration due to its competition with coal 4. Land Transportation: in all the subsectors displacing mainly gasoline, with a greater penetration in taxis, urban buses and urban cargo 36
. Graph 51 presents a comparison of the prospective analysis under differentnatural gas wellhead price scenarios, according to what is shown in table 16.
36 As there is an increase in the number of vehicles of other modalities as well as the availability of loading centers, CNG may still have a greater penetration.

103
The results of the projections of total final consumption by sources for the year 2025, show that higher prices of natural gas, as well as electricity due to the increase of generation costs, would cause a reduction of the consumption of natural gas in the matrix and some small increases of electricity, and it is shown in graph 51.
Graph 51 COMPARISON OF FINAL CONSUMPTION OF SOURCES IN 2025
Source: FB Price Policy Study. As the prices of natural gas increased progressively, there was a higher consumption of mineral coal in scenarios 1, 2 and 3 in respect of the base case. The same thing happens with gasoline and diesel fuel, with the corresponding increase of ethanol and biodiesel. As compensation, lower consumptions of natural gas can be seen. It's worth mentioning that there was a reduction in the consumption of electricity in 2025 of scenario 3 in respect of the base case. This is because the increase in the prices of electricity would lead to a larger share of LPG in heat uses of urban residential, commercial and public. Specifically, the use of crude oil as fuel does not seem advisable due to its supply and the need to supply refineries. In the cases in which the differences are very small, it is not that the evolution of natural gas prices and electricity do not affect their share, but it is considered that this effect is very small. Considering the results of the base case, gasoline is the only fuel that reduces its share and the other fuels show growths that allow significant increases during the period, except the case of LPG. In this case, the relative share of petroleum products decreases by 30% while in 2005 it was close to 49%. These results are due, to a great extent, to the increase of natural gas, which gains in a relative way close to 12 percentage points in 2025.
104

105
CHAPTER 8 ACTIONS FOR THE CONSOLIDATION OF THE NATURAL GAS SECTOR
8 ACTIONS FOR THE CONSOLIDATION OF THE NATURAL GAS SECTOR In this chapter current issues of the subsector are revised, such as the National Energy Plan, the Strategies of the CONPES in order to dynamize and consolidate the Natural Gas Sector in Colombia, for the development of the Special Progress Fund, the Meeting of the Ad Hoc Group on Gas Issues of the Andean Community and activities of the National Operation Council.
8.1 National Energy Plan (PEN) In relation to the gas industry, transportation has the conditions of a natural monopoly and distribution the conditions of a regional monopoly. The greatest way to promote the development of the market lies in establishing a relative price policy that adequately expresses the economic cost of each fuel, particularly the cost of petroleum products. In the first place, it is considered that price regulation could be hindering the interest in exploratory activities, and secondly, it is said that if there are so few agents the productive segment, price liberation could end up with unequal handling, whose results could have repercussions. In Colombia, the identity of the sheer marketer has not developed leaving large-scale marketing in the hands of producers. There are actions that could contribute to facilitating competition such as keeping the gas produced in one field from being marketed by only one of the partners, carrying out the development of the Cusiana field and developing international interconnections. The existing schemes of concessions and exclusive areas have facilitated the participation of a good number of agents in the distribution that has been made based on private agents with a current situation of financial sufficiency and good management. As to marketing37, there's a need of a regulatory framework that provides more liberty to fixing prices and setting the conditions of contracting on a wholesale scale, which will open spaces so that a marketer can add value as a point of contact between the producer and the big consumers.
37By Means of CREG Resolution 011 of 2003, the Commission established the general criteria to remunerate the activities of distribution and marketing of fuel gas.
106
In order to develop a secondary natural gas market, it is important that the RUT38 be duly applied , by implementing the BEO39
whose objective is to make the market visible and transparent. It is also necessary to avoid the inclusion of restrictive secondary market clauses by producers and transporters in the contracts that are signed. As an additional tool, the structuring of an integrated information system of the whole chain of gas and its substitutes, would decrease the existing asymmetries. Fuel gases constitute less costly alternatives which have a lower environmental impact in diverse industrial, commercial and domestic uses than their potential substitutes. It is convenient to consolidate the Natural Gas Mass Consumption Plan and take the necessary measures to increase its production and consumption (expansion of the coverage, uses of natural gas for a vehicle, gas as a petrochemical raw material, among others), complementing it with LPG in those zones where the gas pipeline network can not reach economically. Essentially, as a complement to the Natural Gas Mass Consumption Plan, LPG must maintain and increase its coverage in small cities and rural areas. On the long-term it is necessary to incorporate in reserves that will allow consolidating the gas market. To achieve that it is necessary to send signals that encourage searching and finding natural gas. There are two types of signals, one is on the level of prices that justify the investments involved, and the other is guaranteeing a large market, adding an exportation market to the national market.
8.2 Strategies to dynamize and consolidate the gas sector in Colombia The National Government set forth the strengthening of the gas mass consumption policy by means of the CONPES 3244 document of 2003, for which purpose the immediate conciliation of the sustainability policy of gas exploration, production and transportation activities in the inland is required as well as having competitive prices of the fuel package. As an antecedent, the CONPES40
had recommended adopting a strategy based on three main aspects: 1. Adopting a stable and integral fuel price policy, especially for liquid fuels. This implies the dismantling of subsidies for gasoline and diesel fuel and the adoption of a general price system which acknowledges the reality of international prices41
. 2. To guarantee the availability of natural gas on the short and long-term. It is a priority to continue with the policies that have already been established in all the activities of the chain, especially in the exploration and production stages, in order to guarantee the normal supply of natural gas in the future. This policy encourages offshore explorations in order to make this activity more attractive and thus increase the supply of natural gas in the country. 3. Financial sustainability of ECOGAS on the long-term. The CREG established new maximum prices for the ECOGAS system42
based on a distance signal, and the Ministries of
38 RUT Reglamento Único de Transporte (Sole Transportation Regulations). 39 BEO Boletín Electrónico de Operaciones (Electronic Operations Bulletin). 40 CONPES No. 3190 Document of 2002 “Balance and Strategies to Follow to Promote the Natural Gas Mass Consumption Plan”. 41 Pursuant to the provisions of Law 812 of 2003 – “National Development Plan–Towards a Community State” in Article 8.

107
Mines and Energy and Finance and Public Credit, and the National Planning Department, jointly developed a study in order to assess the behavior of the company's cash flow on the medium and long-term. 8.2.1 Policy guidelines and strategies In this in text, the CONPES 3244 document recommended adopting the following policy and strategy guidelines: 1. Regulate Article 8 of Law 812 of 2003 the National Development Plan, establishing a path of increases that allow equalizing and maintaining internal prices of liquid fuels at an international crude oil price on the long-term. 2. Homogenize the fuel indexation periods. 3. Regulate exportations of natural gas and establish limits or instruments that guarantee, the national supply43 of this fuel, respecting the existing contract. 4. Make the business of transportation of natural gas to the inland viable on the long-term in order to lead the business of gas transportation associated with ECOGAS to the market with two fundamental objectives: to involve a private investor and operator in the business of gas transportation, and to increase the value of the business. 8.2.2 Recommendations One of the recommendations of the CONPES document was to establish a general framework for the natural gas exportation activity, for which purpose the National Government, by means of Decree No. 3428 of November 28, 2003, regulated international commercial exchanges of natural gas, whose principal elements are: 1. Only when the Reference R/P Ratio44
is more than seven years may producers of natural gas freely dispose of Proved Reserves. 2. The senders of the National Transport System are required to give the priority to meeting the national demand. 3. The natural gas exportation activity does not constitute a domiciliary public service, nor a complementary activity of this service. 4. The price of natural gas that is destined for exportation, including the price of transportation, will be agreed on freely between the parties. 5. The Producers that market natural gas may establish and operate the infrastructure that is required in order to transport the natural gas that is destined for exportation or importation and have the transportation capacity of international interconnections of natural gas. 6. In the event that situations arise that impede guaranteeing a minimum supply of the national demand, the contracts entered into by the Exporting Agents for the exportation of natural gas
42 As it is described in Chapter 3. 43 Such as it is provided in Article 59 of the National Development Plan. 44 The Reference R/P Ratio: It is the result of dividing the Reference Reserves, defined as Proved Reserves of natural gas plus the volumes that are committed in importation contracts that guarantee firmness between Reference Production which results from adding the definitive volumes of the supply and exportation contracts and the volumes of natural gas that are demanded in the definitive supply requests. The MME regulated the procedure for the annual calculation of the Ration pursuant to Resolution 180270 of March 11, 2004.

108
will be treated the same as a contract entered into to attend the national consumption, pursuant to Decree 1515 of 200245. A retrospective analysis of the document shows that almost all of the recommendations are being implemented, but there is to work to be done, and maybe why all the incorporation of reserves is not explicit, the sector must prepare itself for changes that will allow it to face the challenges that are involved in following global trends within a framework of growing demand and with scarce findings on the national scene.
8.3 Special Progress Fund The purpose of this fund is to promote natural gas development projects in municipalities and the rural sector. Projects within the area of influence of main gase pipelines are the priority, that is, those municipalities, which due to their location in respect of the Transportation System, make it possible for an infrastructure project to be technically and economically viable, and that also have the highest index of unsatisfied basic needs. This Fund was created in article 15 of Law 401 of 199746, it is managed by ECOGAS and it is supported with the resources that are paid by the users of the natural gas national transportation system, with 1.5% of the amount of the price that is charged for the transportation of the gas that is effectively carried out47. Cofinanciable Infrastructure projects are construction projects, including the supply of materials and equipment, and the start up of the operation of: l Gas pipeline branches and/or Regional Transport Systems of natural gas l Natural gas distribution systems in municipalities that do not belong to an Exclusive Service Area l Connections of low income users. The requests for cofinancing of infrastructure projects must be submitted by the territorial entities or companies that provide the service to the UPME, taking into account the requirements that are defined in the UPME 0026 Resolution of 2005, who evaluate the project submitted for consideration and issues an opinion that is duly motivated regarding their eligibility, establishing quarterly priorities. Once the order of priority of the eligible projects is submitted by the UPME, ECOGAS will submit the cofinancing requests for approval, taking into account the availability of resources on the date of the approval.
45 By which the priority in the order of attention is fixed when insurmountable restrictions in the supply of Natural Gas or non transitory situations of serious emergency take place which impede guaranteeing a minimum supply of the demand. 46 Regulated by Decree No. 3531 of October 28, 2004. 47 The resources coming from the returns in financial operations that are made with the resources of the Fund also conform the Special Progress Fund as well as the financial surplus that may result at the closing of each accounting year and the delayed payment surcharges that are generated by a breach in the payment or transfer of the Special Fund.

109
The petitioners are in charge of the execution, supervision and control of the use of the resources of the Fund, which in no case may be destined to directly or indirectly cover ordinary functioning expenses of any entity which is involved in the development of the project, nor its inspectorship. The company that provide natural gas transportation or distribution services by networks, whichever applies, must reflect the amount that is not charged in the prices in the billing of low income users and must supply the required information to the administrator of the Fund for the purpose of the provisions in numeral 87.9 of Article 87 of Law 142 of 1994. The resources that are approved to cofinance infrastructure projects will be provided to the Public Service Company that is committed to the project in the terms established in numeral 87.9 of Article 87 of Law 142 of 1994 and, subject to said norm, the contribution must appear in the budget to of the Special Progress Fund. The to the of the cofinanced infrastructure will be shared in direct proportion to the contributions of the resources of those who participate in the cofinancing, as long as the repayment is not made by the company that provides the public service of natural gas transportation or distribution by networks, whichever applies. The share of the investments that was made with cofinancing resources of the Fund regarding the subsidized users will not be remunerated by way of prices.
8.4 Discussion spaces to consolidate the Natural Gas sector 8.4.1 Meeting of the Ad Hoc Group of Experts on Gas of the CAN The Ad Hoc Group of Experts on Gas was created by the Andean Community of Nations - CAN, which is making advancements in the execution of a work plan aimed at the integration of natural gas, evaluating the convenience that the countries of the Andean subregion work on the binational integration processes with criteria that are not only economical but also that include a strong social component and with the objective of achieving integral long-term development. Consequently, they are working on the definition of an agenda that involves the Member Countries in participating creatively in the articulation of this long-term vision which is aimed at energy integration. 8.4.2 National Operation Council The National Operation Council of Gas is composed of members that represent producers, senders and transporters, pursuant to the provisions in the norms in force. The most important issues that have been discussed by the CNO-Gas referred to: l Change project of the transportation nomination cycle and the gas supply cycle: This this project contemplates delaying these cycles by 45 minutes, in order to allow international exchanges of electric energy. The CNO - Gas issued an opinion about the budget adjustments that were sent to the CREG as support for the issue of CREG Resolution 014 of 2003.

110
l Condensation of hydrocarbons in the Ballena Cartagena gas pipeline and proposal about the value of the cricondentherm48: Experts were hired to deal with the issue and propose solutions in order to avoid the production of hydrocarbon liquids in conditions of transportation, such as the case that has been observed of the condensation of hydrocarbons in the Ballena-Cartagena gas pipeline. Moreover, proposals were discussed to modify existing quality regulations in Colombia, such as including the specific reference of the standards that must be adopted for the measurement of each one of the natural gas quality guidelines and consider the addition of other quality specifications. l RUT modification proposal: Given that currently the CNO -Gas has run into problems in the application of these regulations, it has been working on the difficulties that have been detected in the modifications that would have to be made in order to solve them. With that purpose in mind, it was agreed to classify the topics into for large groups: Technical, Commercial, Gas-Electricity Coordination and Legal. The purpose of these analyses, once they have been finished, is propose that the CREG make a reform and to make the necessary recommendations to guarantee the fulfillment of the objectives established in the RUT49. To this date, the CNO-Gas has informed the CREG about its position regarding the methodology for the calculation of the losses of gas in the inland, the operational information and ways to divulge it in order to coordinate the gas and electricity sectors, the gas pipeline integrity administration, a proposal to regulate the secondary market of gas transportation, service interruptions, access to dedicated gas pipelines, among others. Likewise, the CNO-Gas has sent communications to the Ministry of Mines and Energy in respect of the ACOLGEN proposal for the creation of an independent, neutral and transparent company, to be in charge of the administration of the secondary market of gas supply and transportation, and to the ICONTEC in respect of the project draft of the Andean Norm on gas quality. l Discussion of the document coming from the Dirección General para la Prevención y Atención de Desastres (DGPAD) (General Directorate for Disaster Prevention and Attention), which is denominated Plan Nacional de Contingencia Sector Transporte de Gas Natural (PNCTGN)(National Contingency Plan Natural Gas Transport Sector): The CNO-Gas analyzed aspects such as the legal framework, the institutional framework, the general objective, specific objectives, conceptual framework, institutional framework, response scheme, functions of the organization (strategic, tactical, operational, technical), and stated the importance that related competition be defined from then on, with the revision and approval of the gas pipeline contingency plans among the Ministry of the Environment, Housing and Territorial Development, the Ministry of Mines and Energy and the Ministry of the Interior and of Justice.
8.5 Actions for Strengthening
48 Term that is applied to the highest temperature at which at least one cup of liquid may be made to appear in a vapor at any pressure, however high it may be.(Thermodynamics, Weber and Meissner). 49 Reglamento Único de Transporte (Sole Transportation Regulations).

111
The Colombian energy policy has been aimed at maintaining its contribution to the commercial balance in a market environment, in harmony with the environment. The framework where these policies develop is the energy market, which in recent years has been characterized by steady growth of the demand for most fuels, except gasoline which has corresponded with a sufficient supply, but which has begun to show unbalance in the use of diesel fuel in spite of the generalized increase in prices. In this context, government strategies and goals have been defined; some have been achieved and others are yet to be finished. In the particular case of natural gas, there have been outstanding advances in recent years due to its positioning as a source of energy for cooking and heating water in the residential sector and as a gasoline fuel substitute in the transport sector. For the natural gas sector to continue its expansion process su proceso in the national energy market, continuously increasing its share in the balance of primary energy, it is necessary to further some actions that will allow the strengthening of this industry and its consolidation as a primary source of energy with a greater presence in the energy package. The following are some of the actions that are considered pertinent for improvement: 1. Taking into account that the regulations of the sector are disseminated in different governmental institutions, it is desirable that according to the model of development that the government has laid out, they be concentrated harmoniously with the defined institutional framework. 2. To give adequate signals in order to guarantee the internal supply for the different socioeconomic sectors of consumption, such as gas importations by way of LNG, barges or other technological options in the event that no new reserves are incorporated. 3. Once there's a full definition of the supply schemes, further the substitution of liquid fuels for natural gas for the transportation sector. 4. Reflect on the regulations of the natural gas sector, the policies of rational and efficient use of energy, explicitly enabling the development cogeneration and cell generation as a very important energy solution for the country and its competitiveness in the globalized world. 5. The regulator must define the mechanisms for the remuneration of the different alternatives that make it possible to increase the reliability in the supply of gas in view of different events. 6. Regulations must be revised thoroughly regarding the pricing methodology, so that the expansions of the transport system will be opportune and make the full supply possible. 7. The way that agents must provide the information must be established clearly and accurately, so that gathering the information, handling and communicating it will avoid asymmetry and the markets will function better.

112
BIBLIOGRAPHY AND SOURCES OF INFORMATION 1. Ministerio de Minas y Energía. República de Colombia. www.minminas.gov.co 2. Comisión de Regulación de Energía y Gas – CREG. www.creg.gov.co 3. Superintendencia de Servicios Públicos Domiciliarios www.superservicios.gov.co 4. Unidad de Planeación Minero Energética – UPME. www.upme.gov.co 5. Empresa Colombia de Petróleos ECOPETROL www.ecopetrol.com.co
a. Ventas Nacionales b. Informe Anual 2003 y 2004 c. Informe de Reservas 2003 – 2004 – 2005. d. Estadísticas Volumétricas de la Industria Petrolera – Dirección General de Planeación y Riesgos. 2000-2006
6. Agencia Nacional de Hidrocarburos. www.ahn.gov.co 7. Department of energy. Energy Information Administration (EIA).
a. Energy Outlook b. International energy annual c. Energy Review d. Country Briefs
8. BP Statistical Review of World Energy. June 2005 9. Oil and Gas Journal. www.oilandgasjournal.com 10. Dirección de Estudios Económicos DNP. Escenario macroeconómico DNP del 3 de mayo de 2005. 11. Banco de la República. www.banrep.gov.co 12. Departamento Administrativo Nacional de Estadística – DANE. www.dane.gov.co 13. Ecogas. www.ecogas.com.co 14. Promigás. www.promigas.com
a. Informe Sectorial Gas Natural en Colombia 2004 y 2005 15. Transoriente www.transoriente.com.co 16. Transoccidente www.transoccidente.com.co 17. Transmetano www.transmetano.com.co 18. Progasur. www.progasur.com.co 19. Gastol. www.gasoductodeltolima.com.co 20. Transcogás www.transcogas.com.co 21. Itansuca - Argos. 22. “NGV: un sector dinámico y en crecimiento” Publigás al Día. Enero – Marzo de 2005. pg.25 23. Gas Vehicular. Ediciones noviembre-diciembre 2005, septiembre 2005. Orvisa Comunicaciones Ltda. Bogotá – Colombia. 24. XM. Servicio de consulta en línea NEON. 25. SIEGE - Seminario Internacional Integración Energética Gas Y Electricidad - Cier. Septiembre de 2004 26. CONPES No. 3244 de septiembre 15 de 2003. 27. CONPES No. 3190 de 2002 “Balance y Estrategias a Seguir para Impulsar el Plan de Masificación de Gas.” 28. Ley 812 de 2003 – “Plan Nacional de Desarrollo” 29. “Estudio: Diseño De Una Política Integral de Precios de Los Energéticos Para El Caso Colombiano”. Fundación Bariloche. 2006. 30. Crisis de la industria del gas natural en Argentina”, KOZULJ, Roberto. CEPAL, División de Recursos Naturales e Infraestructura. Santiago de Chile, Marzo de 2005. 31. “Estudio para la formulación de una estrategia nacional de abastecimiento energético”. Arthur D’Little. 2006. 32. UPME. “Evaluación de la evolución del plan de masificación de gas combustible – resumen de investigación”. 2005. pp 3-14 33. UPME. Plan Energético Nacional. Estrategia Energética Integral. Visión 2003 – 2020 34. UPME. “Proyecciones de demanda de gas natural sector residencial y comercial”. Subdirección de planeación energética, grupo de Demanda. 2006 35. UPME. “Proyecciones de demanda de gas natural sector transporte”. Subdirección de planeación energética, grupo de Demanda. 2006 36. CIGE Versión 1.0 de Integral S.A. 2005. 37. Petróleo Internacional. www.petroleo.com. Víctor G. Prieto-Consultor editorial, Octubre 2005 38. “Gas Natural: Perspectivas para el Mercado Nacional y Exportación” Juan Miguel Cayo M. Viceministro de Energía. Presentación Mayo de 2005. http://www.eia.doe.gov/oiaf/ieo/nat_gas.html

113