the natural earth ii world map projection - bernie jenny
TRANSCRIPT

Full Terms & Conditions of access and use can be found athttp://www.tandfonline.com/action/journalInformation?journalCode=tica20
Download by: [Bernhard Jenny] Date: 15 January 2016, At: 18:59
International Journal of Cartography
ISSN: 2372-9333 (Print) 2372-9341 (Online) Journal homepage: http://www.tandfonline.com/loi/tica20
The Natural Earth II world map projection
Bojan Šavrič, Tom Patterson & Bernhard Jenny
To cite this article: Bojan Šavrič, Tom Patterson & Bernhard Jenny (2016): TheNatural Earth II world map projection, International Journal of Cartography, DOI:10.1080/23729333.2015.1093312
To link to this article: http://dx.doi.org/10.1080/23729333.2015.1093312
Published online: 15 Jan 2016.
Submit your article to this journal
View related articles
View Crossmark data

The Natural Earth II world map projectionBojan Šavriča,b, Tom Pattersonc and Bernhard Jennyd
aCollege of Earth, Ocean, and Atmospheric Sciences, Oregon State University, 104 CEOAS AdministrationBuilding, Corvallis, OR, USA; bEsri Inc., Redlands, CA, USA; cU.S. National Park Service, Harpers Ferry Center,Harpers Ferry, WV, USA; dSchool of Mathematical and Geospatial Sciences, RMIT University, Melbourne,Australia
ABSTRACTThe Natural Earth II projection is a new compromisepseudocylindrical projection for world maps. The Natural Earth IIprojection has a unique shape compared to most otherpseudocylindrical projections. At high latitudes, meridians bendsteeply toward short pole lines resulting in a map with highlyrounded corners that resembles an elongated globe. Itsdistortion properties are similar to most other established worldmap projections. Equations consist of simple polynomials. A userstudy evaluated whether map-readers prefer Natural Earth II tosimilar compromise projections. The 355 participating generalmap-readers rated the Natural Earth II projection lower than theRobinson and Natural Earth projections, but higher than theWagner VI, Kavrayskiy VII and Wagner II projections.
ARTICLE HISTORYReceived 21 January 2015Accepted 9 September 2015
KEYWORDSNatural Earth II projection;map-reader preference;world projection; NaturalEarth projection; FlexProjector
1. Introduction
This article introduces the Natural Earth II projection (Figure 1), a new compromise pseudo-cylindrical projection for world maps. Pseudocylindrical projections, such as the popularRobinson projection, are characterized by straight parallels and curved meridians. TheNatural Earth II extends the work done on the Natural Earth projection (Jenny, Patterson,& Hurni, 2008; Šavrič, Jenny, Patterson, Petrovič, & Hurni, 2011), which applies moderaterounding to the four corners where bounding meridians and pole lines meet. Thisconcept was taken one step further by eliminating all indication of corners on a worldmap for the Natural Earth II projection. At high latitudes, the bounding meridians bendsteeply inward toward the central meridian and join seamlessly with relatively short polelines. The result is a pseudocylindrical projection with a more rounded form resemblingan elongated globe (Figure 1).
The design process, polynomial equation and characteristics of the Natural Earth IIprojection are described in the following section. A user study was conducted to evalu-ate whether map-readers prefer the Natural Earth II projection to similar compromiseprojections with straight parallels. The design of the user study, statistical significancetests and results are presented. The article concludes with a short discussion of ourfindings.
© 2016 International Cartographic Association
CONTACT Bojan Šavrič [email protected]
INTERNATIONAL JOURNAL OF CARTOGRAPHY, 2016http://dx.doi.org/10.1080/23729333.2015.1093312
Dow
nloa
ded
by [
Ber
nhar
d Je
nny]
at 1
8:59
15
Janu
ary
2016

2. Natural Earth II
2.1. Design and polynomial equations
The Natural Earth II projection (Figure 1) is a compromise pseudocylindrical projectiondesigned by Tom Patterson. Flex Projector, a freeware application for the interactivedesign and evaluation of map projections (Jenny & Patterson, 2014), was used to designNatural Earth II. For developing projections, Flex Projector takes a graphic approach thatwas first introduced by Arthur H. Robinson during the design of his well-known, epon-ymous projection (Jenny & Patterson, 2013; Jenny et al., 2008; Jenny, Patterson, & Hurni,2010; Robinson, 1974). In Flex Projector, the user adjusts the length, shape, and spacingof parallels and meridians for every 5° of latitude and longitude. The Natural Earth II pro-jection was designed by adjusting the relative length of parallels and the relative distanceof parallels from the equator, while spacing of meridians remained constant and nobending was applied to parallels. The design process required trial-and-error experimen-tation and visual evaluation of the resulting map projection. By shortening the relativelength of the pole lines, smoothly rounded corners of the bounding meridians werecreated, which resulted in a rounded graticule resembling an elongated globe.
When the Natural Earth II projection design was completed, the least squares adjust-ment method was used to develop a polynomial expression of the projection. Šavričet al. (2011) detail the derivation of the polynomial expression for the Natural Earth pro-jection, a similar projection designed by Tom Patterson (Jenny & Patterson, 2014). Thegraphical design in Flex Projector defined the Natural Earth II projection with 37 controlpoints distributed over the complete range of the bounding meridian for every 5°. Eachpoint defined the relative length of parallels and the relative distance of parallels fromthe equator. Control points were used to approximate the graphical design with twopolynomials. To ensure the symmetry about the x and y axes, the x coordinate containsonly even powers of latitude w, and the y coordinate consists of only odd powers of
Figure 1. The Natural Earth II projection.
2 B. ŠAVRIČ ET AL.
Dow
nloa
ded
by [
Ber
nhar
d Je
nny]
at 1
8:59
15
Janu
ary
2016

latitude w. By multiplying the even powers of the latitude with longitude l, the meridiansremained equally spaced curves. Details on polynomial derivations are presented byCanters (2002, p. 133).
Three additional constraints were used in the least square adjustment. The first twoconstraints enforced the distance of the pole line from the equator and the length ofthe equator to the values selected in Flex Projector. The third constraint fixed the slopeof the y coordinate equation to 0° at poles, which ensured smoothly rounded cornerswhere bounding meridians meet the pole lines. Šavrič et al. (2011) detail how constraintsare applied and included in the least square adjustment method. Equation (1) is the result-ing polynomial equation for the Natural Earth II projection.
x = R · l · (A1 + A2w2 + A3w
12 + A4w14 + A5w
16 + A6w18)
y = R · (B1w + B2w9 + B3w
11 + B4w13)
(1)
where x and y are the projected coordinates, l and w are the latitude and longitude inradians, R is the radius of the generating globe, and A1 to A6 and B1 to B4 are polynomialcoefficients given in Table 1. The polynomial expression for the Natural Earth II projectionconsists of 10 coefficients, 6 for the x coordinate and 4 for the y coordinate. With an appro-priate factorization, the polynomial equation can be simplified to 15 multiplications and 8additions per point. To convert Cartesian coordinates to spherical coordinates, theNewton–Raphson method is used to find the latitude w from the y equation; longitudel is computed by inverting the x equation.
2.2. Projection characteristics
The Natural Earth II projection has short pole lines that are 0.226 times as long as theequator. The smoothly rounded corners of the bounding meridians give the graticule arounded appearance. The graticule is symmetric about the central meridian and theequator. The length of the equator is 0.847 times the circumference of a sphere. Thecentral meridian is a straight line 0.535 times as long as the equator. Other meridiansare equally spaced polynomial curves and the smoothness of their ends at the pole linedecreases toward the central meridian. The parallels are straight and unequally spaced.The ratio between the lengths of pole lines and the equator as well as the ratiobetween the length of the central meridian and the equator are a result of the projectiondesign and the derivation of the polynomial equations.
As a compromise projection, Natural Earth II is neither conformal nor equal area, but itsdistortion characteristics are comparable to other established projections. The distortionvalues of Natural Earth II fall between those of the Kavraiskiy VII, Robinson, Winkel
Table 1. Coefficients for the polynomial expression Equation (1) of the NaturalEarth II projection.x Equation y Equation
A1 0.84719 B1 1.01183A2 –0.13063 B2 –0.02625A3 –0.04515 B3 0.01926A4 0.05494 B4 –0.00396A5 0.02326A6 0.00331
INTERNATIONAL JOURNAL OF CARTOGRAPHY 3
Dow
nloa
ded
by [
Ber
nhar
d Je
nny]
at 1
8:59
15
Janu
ary
2016

Tripel, Wagner VI and Natural Earth projections. Table 2 compares the weighted meanerror in the overall scale distortion index Dab, the weighted mean error in areal distortionindex Dar, and the mean angular deformation index Dan of the Natural Earth II projection toother compromise and equal-area projections commonly used for small-scale mapping(for details on how indices are defined, see Canters & Decleir, 1989, pp. 42–43 andCanters, 2002, p. 48). The local linear scale along meridians and parallels, areal scale anddistortion of angles can be computed from the Gaussian fundamental quantities (fordetails on equations, see Canters, 2002, pp. 9–16).
As with all compromise projections, the Natural Earth II projection exaggerates the sizeof high-latitude areas. Figure 2 illustrates the distortion characteristics of Natural Earth II. Inthe top image, Tissot’s indicatrices are placed at the intersection of the 30° meridians andparallels that make up the graticule. The area of indicatrices increases toward the poles,indicating an exaggeration of the size of high-latitude areas.
The middle and bottom images of Figure 2 show isocols of area distortion andmaximum angular distortion. Areal distortion increases with latitude, but does notchange with longitude. Therefore, all isocols of areal distortion are parallel to theequator. Isocols of maximum angular distortion increase with latitude, which follows thegeneral pattern common to most pseudocylindrical projections.
Compared to the Natural Earth projection, Natural Earth II has a larger height-to-widthratio, shorter pole lines and a rounder appearance (Figure 3). It has a similar overall scaledistortion index Dab, a slightly better weighted mean error in areal distortion index Dar anda larger mean angular deformation index Dan (Table 2). Unlike the Natural Earth projectionwhich has standard parallels at 33°18′ N/S, the Natural Earth II projection has standard par-allels at 37°4′ N/S.
Besides the Natural Earth projections, there are several other compromise pseudocy-lindrical projections with rounded corners. Winkel II is one example that is similar inappearance, commonly used and available in many GIS and mapping applications. TheWinkel II projection with standard parallels at approximately 29°41′ N/S (Figure 3) hasthe same height-to-width ratio as the Natural Earth II projection. Winkel II also has a
Table 2. The weighted mean error in the overall scale distortion index Dab theweighted mean error in areal distortion index Dar and the mean angulardeformation index Dan for the Natural Earth II projection and other world mapprojections.Projection Dab Dar Dan
Kavrayskiy VII 0.23 0.279 19.15Natural Earth 0.251 0.194 20.54Natural Earth II 0.254 0.175 21.43Winkel Triple 0.256 0.179 23.28Wagner VI 0.263 0.342 20.41Robinson 0.265 0.275 21.26Winkel II (wS � 29
W
41′) 0.268 0.194 21.49Plate Carrée 0.285 0.571 16.84Wagner II 0.315 0.116 26.88Eckert IV 0.363 0 28.73Miller Cylindrical 0.393 1.303 32.28Mollweide 0.394 0 7.63
Note: Lower values indicate better distortion characteristics. The Natural Earth II projection ismarked in bold.
4 B. ŠAVRIČ ET AL.
Dow
nloa
ded
by [
Ber
nhar
d Je
nny]
at 1
8:59
15
Janu
ary
2016

similar mean angular deformation index Dan, but Natural Earth II has a better overall scaledistortion index Dab and weighted mean error in areal distortion index Dar (Table 2).Because the Natural Earth II projection has shorter pole lines and a rounder appearance,areas near the poles are stretched less in the east-west direction than with the Winkel IIprojection.
Figure 2. Tissot’s indicatrices (top), isocols of area distortion (middle) and isocols of maximum angulardistortion (bottom) for the Natural Earth II projection.
INTERNATIONAL JOURNAL OF CARTOGRAPHY 5
Dow
nloa
ded
by [
Ber
nhar
d Je
nny]
at 1
8:59
15
Janu
ary
2016

3. User study
In a previous study of world map esthetics, student test subjects strongly preferred ellip-tical map graticules to rectangular ones (Gilmartin, 1983). We conducted a user study totest whether the highly rounded shape of the Natural Earth II projection (which is not
Figure 3. Comparing the Natural Earth II projection with the Natural Earth projection and the Winkel IIprojection with standard parallels at 29°41′ N/S.
6 B. ŠAVRIČ ET AL.
Dow
nloa
ded
by [
Ber
nhar
d Je
nny]
at 1
8:59
15
Janu
ary
2016

elliptical) appeals to map-readers. Participants compared the Natural Earth II projection tofive commonly used compromise projections with straight parallels. The study was part ofa larger user study about map-readers’ preferences for world map projections Šavrič,Jenny, White, & Strebe, 2015; Jenny, Šavrič, & Patterson, 2015.
3.1. Design, process and statistics
The user study used a paired comparison test to evaluate map-readers’ preference for theNatural Earth II projection. The paired comparison test compared each map projectionwith every other map projection in the set. The set contained the Kavrayskiy VII, NaturalEarth, Robinson, Wagner II, Wagner VI and Natural Earth II projections (Figure 4). All pro-jections in the set have compromise distortion and straight parallels. The difference
Figure 4. The six small-scale map projections used in the user study. They are arranged in descendingorder, from top left to bottom right, based on general map-reader preference.
INTERNATIONAL JOURNAL OF CARTOGRAPHY 7
Dow
nloa
ded
by [
Ber
nhar
d Je
nny]
at 1
8:59
15
Janu
ary
2016
between the projections lies mostly in the shape of meridians, height-to-width ratio,length of pole lines and the representation of pole line corners.
The study contained all 15 possible projection pairs. Participants of the online studywere recruited through Amazon’s Mechanical Turk, online forums and social networks. Par-ticipants were categorized into two groups of subjects: (1) general map-readers withlimited or no map-making experience, and (2) experts in map projections, cartographersor experienced GIS users. Each participant evaluated all pairs of map projections by select-ing the map in a presented pair that he or she personally preferred. Study participantswere also asked demographic questions regarding their gender, age, education level, car-tographic experience and how often they use maps. Details about the user study surveyprocess, recruiting, selection of valid responses and participants’ demographics can befound in Šavrič et al., 2015.
For the statistical analysis of the paired comparison study, two non-parametric tests ofsignificance, proposed by David (1988), were used. The overall test of equality (David,1988) determined which map projections were significantly different from each otherbased on how many times users selected a projection from the set. In the post hoc analy-sis, the multiple comparison range test (David, 1988) identified which graticules weresignificantly different from each other based on which graticules participants preferred.The x2 test for the 2× C table, where C represents the number of categories for eachparticipant’s demographic characteristics, evaluated the influence that demographiccharacteristics and frequency of map use had on participants’ preferences. The x2 testwas used on all 15 map projection pairs separately. The overall test of equality, multiplecomparison range test and x2 test were performed separately for both groups ofsubjects.
3.2. Results
A total of 448 participants submitted valid responses. Participants were categorized intotwo groups: (1) general map-readers with 355 participants, and (2) projection experts, carto-graphers or experienced GIS users with 93 participants.
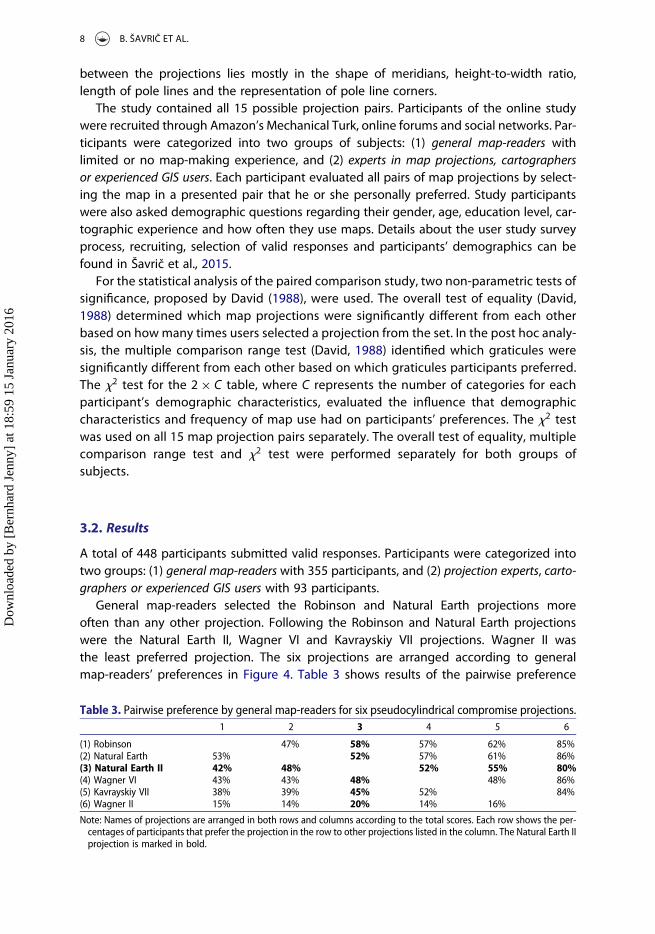
General map-readers selected the Robinson and Natural Earth projections moreoften than any other projection. Following the Robinson and Natural Earth projectionswere the Natural Earth II, Wagner VI and Kavrayskiy VII projections. Wagner II wasthe least preferred projection. The six projections are arranged according to generalmap-readers’ preferences in Figure 4. Table 3 shows results of the pairwise preference
Table 3. Pairwise preference by general map-readers for six pseudocylindrical compromise projections.1 2 3 4 5 6
(1) Robinson 47% 58% 57% 62% 85%(2) Natural Earth 53% 52% 57% 61% 86%(3) Natural Earth II 42% 48% 52% 55% 80%(4) Wagner VI 43% 43% 48% 48% 86%(5) Kavrayskiy VII 38% 39% 45% 52% 84%(6) Wagner II 15% 14% 20% 14% 16%
Note: Names of projections are arranged in both rows and columns according to the total scores. Each row shows the per-centages of participants that prefer the projection in the row to other projections listed in the column. The Natural Earth IIprojection is marked in bold.
8 B. ŠAVRIČ ET AL.
Dow
nloa
ded
by [
Ber
nhar
d Je
nny]
at 1
8:59
15
Janu
ary
2016

as a percentage for general map-readers. Of the 355 general map-reader participants,58% preferred Robinson and 52% preferred Natural Earth to the Natural Earth IIprojection. Natural Earth II was preferred to Wagner VI by 52%, to Kavrayskiy VIIby 58%, and to Wagner II by 80% of participants. An overall test of equality(x25, 0.01 = 15.09, Dn = 877.8) showed statistically significant differences in generalmap-readers’ preferences. Results from a post hoc multi comparison range test are dis-played in Figure 5. Projections are arranged left to right according to user preferenceand any projection that is not outlined by the same line is significantly different basedon user preferences.
Of the 93 participants that made up the group of projection experts, cartographers orexperienced GIS users, 74% preferred the Natural Earth II projection to the Wagner II pro-jection. Sixty-seven percent preferred Robinson, 62% preferred Kavrayskiy VII and NaturalEarth, and 61% preferred Wagner VI to Natural Earth II. The Robinson and Natural Earthprojections were selected most frequently, followed by Kavrayskiy VII and Wagner VI.Natural Earth II ranked second to last and Wagner II was the least preferred projection.The overall test of equality (x25, 0.01 = 15.09, Dn = 284.04) showed statistically signifi-cant differences in map-readers’ preferences for projections. Figure 5 shows results fromthe post hoc multi comparison range test (Table 4).
The x2 tests on the 15 map projection pairs did not show any differences in user pre-ference due to gender, age, education level, background in cartography or cartographicexperience for either group of participants. There were no differences attributable to par-ticipants’ frequency of using web or virtual globe maps, or related to the type of map mostoften utilized by participants.
Table 4. Pairwise preference by projection experts, cartographers or experienced GIS users for sixpseudocylindrical compromise projections.
1 2 3 4 5 6
(1) Robinson 51% 57% 63% 67% 88%(2) Natural Earth 49% 62% 52% 62% 86%(3) Kavrayskiy VII 43% 38% 52% 62% 94%(4) Wagner VI 37% 48% 48% 61% 89%(5) Natural Earth II 33% 38% 38% 39% 74%(6) Wagner II 12% 14% 6% 11% 26%
Note: The table has the same ordering and units of measure as Table 3. The Natural Earth II projection is marked in bold.
Figure 5. Projection preference summary. Projections are arranged with the most preferred on the left.Preference differences are significantly greater between outlined groups than within.
INTERNATIONAL JOURNAL OF CARTOGRAPHY 9
Dow
nloa
ded
by [
Ber
nhar
d Je
nny]
at 1
8:59
15
Janu
ary
2016
4. Conclusion
The method for creating Natural Earth II involved three steps: (1) using the graphical userinterface of Flex Projector to design a rough draft projection with a desired look; (2) devel-oping the polynomial equation that approximates the Flex Projector draft; and (3) finetuning the polynomial equation for projection appearance, distortion characteristics andcomputational efficiency. The resulting Natural Earth II projection is a rounder pseudocy-lindrical projection with compromise distortion characteristics similar to other projectionsin its class.
Creating the Natural Earth II projection was partially motivated by the idea that map-readers would prefer a pseudocylindrical projection with rounded corners that moreclosely resembles the spherical shape of Earth. However, the user study found that partici-pants did not have a strong preference for the Natural Earth II projection. Preferences forthe Natural Earth projection, which has slightly rounded corners, and the Robinson projec-tion, which has more defined corners, were too close statistically to assume that either pro-jection was preferred to the other. Both the Natural Earth and Robinson projections werepreferred to the highly rounded Natural Earth II projection.
Wagner II was the least preferred projection. Wagner II differs from the other projec-tions included in the set because meridian lines have a more sinusoidal shape, whichresults in the bulging of areas along the equator. Šavrič et al. (2015) found that map-readers generally dislike meridians that strongly bulge outwards at the equator. Ouruser study confirms these findings.
Projection experts, cartographers and experienced GIS users strongly preferred fourmap projections – Robinson, Natural Earth, Karayskiy VII and Wagner VI – all of whichlook more similar to the Robinson projection than to the Natural Earth II and Wagner II pro-jections. In contrast, general map-readers liked the Natural Earth II projection, preferring itimmediately behind the Robinson and Natural Earth projections. The discrepancy betweenthe two groups is possibly due to different exposures to the Robinson projection. Wespeculate that mapping professionals who routinely use the Robinson projection mayregard it as the standard against which all other pseudocylindrical projections aremeasured, thereby favoring projections most similar to it. General map-readers who areless familiar with the Robinson projection may presumably be more open to projectionswith alternative shapes.
The popularity of world map projections changes over time and varies according to thetaste of publishers. For those looking for a new pseudocylindrical projection with accep-table distortion characteristics, Natural Earth II is available as an option.
Acknowledgments
The authors thank all participants for taking the user study, Brooke E. Marston, Oregon State Univer-sity, and Jillian A. Edstrom, Esri Inc., for editing the text of this article, as well as the anonymousreviewers for their valuable comments.
Disclosure statement
No potential conflict of interest was reported by the authors.
10 B. ŠAVRIČ ET AL.
Dow
nloa
ded
by [
Ber
nhar
d Je
nny]
at 1
8:59
15
Janu
ary
2016

Notes on contributors
Bojan Šavrič is a Software Development Engineer at Esri, Inc. He holds a Ph.D. in geography and aminor in computer science from Oregon State University. He received his Diploma degree in geode-tic engineering from the University of Ljubljana and his graduate certificate in geographic infor-mation science from Oregon State University. His main research interests are map projections,mathematical techniques in cartography, and the development of tools for cartographers. He isthe author of Projection Wizard, an online map projection selection tool, and a member of the Inter-national Cartographic Association Commission on Map Projections.
Tom Patterson is Senior Cartographer at the U.S. National Park Service, Harpers Ferry Center. He hasan M.A. in Geography from the University of Hawai‘i at Mānoa. He maintains the www.ShadedRelief.com website and is the co-developer of the Natural Earth cartographic dataset. Tom is a former pre-sident of the North American Cartographic Information Society and is now Vice Chair of the Inter-national Cartographic Association, Commission on Mountain Cartography.
Bernhard Jenny is a Senior Lecturer at the School of Mathematical and Geospatial Sciences of RMITUniversity, Melbourne, Australia. He obtained a Ph.D. degree and a post-graduate certificate in com-puter graphics from ETH Zurich, and a M.S. degree in Rural Engineering, Surveying and Environ-mental Sciences from EPFL Lausanne. His research combines computer graphics, geographicinformation science, and cartographic design principles to develop new methods for the visual rep-resentation and analysis of geospatial information.
References
Canters, F. (2002). Small-scale map projection design. London: Taylor & Francis.Canters, F., & Decleir, H. (1989). The world in perspective: A directory of world map projections.
Chichester: John Wiley and Sons.David, H. A. (1988). The method of paired comparisons (2nd ed.). New York, NY: Oxford University
Press.Gilmartin, P. P. (1983). Aesthetic preferences for the proportions and forms of graticules. The
Cartographic Journal, 20(2), 95–100.Jenny, B., & Patterson, T. (2013). Blending world map projections with Flex Projector. Cartography and
Geographic Information Science, 40(4), 289–296.Jenny, B., & Patterson, T. (2014). Flex Projector. Retrieved August 3, 2014, from http://www.
flexprojector.comJenny, B., Patterson, T., & Hurni, L. (2008). Flex Projector – Interactive software for designing world
map projections. Cartographic Perspectives, 59, 12–27.Jenny, B., Patterson, T., & Hurni, L. (2010). Graphical design of world map projections. International
Journal of Geographical Information Science, 24(11), 1687–1702.Jenny, B., Šavrič, B., & Patterson, T. (2015). A compromise aspect-adaptive cylindrical projection for
world maps. International Journal of Geographical Information Science, 29(6), 935–952.Robinson, A. (1974). A new map projection: Its development and characteristics. In G. M. Kirschbaum
& K.-H. Meine (Eds.), International yearbook of cartography (pp. 145–55). Bonn-Bad Godesberg:Kirschbaum.
Šavrič, B., Jenny, B., Patterson, T., Petrovič, D., & Hurni, L. (2011). A polynomial equation for the NaturalEarth projection. Cartography and Geographic Information Science, 38(4), 363–372.
Šavrič, B., Jenny, B., White, D., & Strebe, D. R. (2015). User preferences for world map projections.Cartography and Geographic Information Science, 42(5), 398–409.
INTERNATIONAL JOURNAL OF CARTOGRAPHY 11
Dow
nloa
ded
by [
Ber
nhar
d Je
nny]
at 1
8:59
15
Janu
ary
2016