the national organization of the petroleum industry … - bruno.pdf · the national organization of...
TRANSCRIPT
The National Organization of the Petroleum Industry
(ONIP)
Presentation to the UK Delegation
Rio de Janeiro March 11th, 2013

PETROBRAS – Monopoly system
Constitutional Amendment – End of monopoly
National Petroleum Agency (ANP) –
regulator 10 bidding rounds
Petroleum Law
Institutional Framework
ONIP – support to local development
. . . . . . . . . 1953 1995 1997 1998 1999 2008

Mission
3
TO CONTRIBUTE TO THE INCREASE OF THE
COMPETITIVENESS AND SUSTAINABILITY OF THE
NATIONAL INDUSTRY, TO MAXIMIZE THE LOCAL
CONTENT, EMPLOYMENT GENERATION AND INCOME IN
THE OIL AND GAS SECTOR.

ONIP Associates/Members
ONIP - Organização Nacional da Indústria do Petróleo
SISTEMA NACIONAL DA INDÚSTRIA
INDUSTRY
FEDERAL GOVERNMENT
OPERATORS
STATE GOVERNMENT
1

ONIP Activities (1)
5
LOCAL CONTENT MANAGEMENT SYSTEM
• Local Content Measurement of Projects
• Plataforms (P51; P52; P53; P54; P-55; P56; P-57; P-
59; P-60; P-58; P-62;P-61; P-63; P66-73cascos;
PRA1; PMXL1)
• Refining / Terminals: Caraguatatuba, Cacimbas,
UTGSulRecap, Replan, Repar, Rpbc, Regap, Reduc,
Revap, Rlam e Renest
• Local Content Management System -
INSTITUTIONAL
• Regional Offices
• Breakfast with Energy
• PROMINP
• Regulatory Framework
• Interface with ANP
• Associates Support
• CB-50 / ABNT – Executive Secretariat
Brazilian Standards (ISO TC67)
KNOWLEDGMENT
• Competitiveness Agenda
• REPETRO taxation system

SUPPLY CHAIN DEVELOPMENT PROGRAM
ONIP Activities (2)
6
• Suppliers Registration and
Qualification
• ONIP Supplier Registry System
• CadFor
• Navipeças Registry System
• Business Rounds (“one-to-one”)
• Specific Seminars
• Thematic Road Maps
• Innovation
• Mature Technologies
• Technology Transfer
• R&D&I
• Platec – Technological Platforms
• Prototype Labs
• International Competitiveness
Increase
• Prointer O&G (Sebrae)
• Navipeças
• FPSO
• Drilling Rigs
• Onshore

O&G Investments
Scenarios 1.

Investments - Infrastructure and O&G
2011-2014
8 Fonte: BNDES. Visão do Desenvolvimento nº 100 abril2011
Total: US$ 550 billion
Oil Sector: 38%
Oil and Gas
Electricity
Telecommunications
Sanitation
Mining and Quarrying
Highways
Eletronics
Petrochemicals
Steel
Automotive
Railroads
Harbors
Paper and Cellulose

9
Petrobras Investment over time * US$ billion
* Total in Brazil
Source: Petrobras.(2011)
3.7 3.8 4.4 5.4 6.7 9.2
12.2
19.9
25.7
32
40.7
33.3
45
2000 2001 2002 2003 2004 2005 2006 2007 2008 2009 2010 2011 2012
Estimated
10
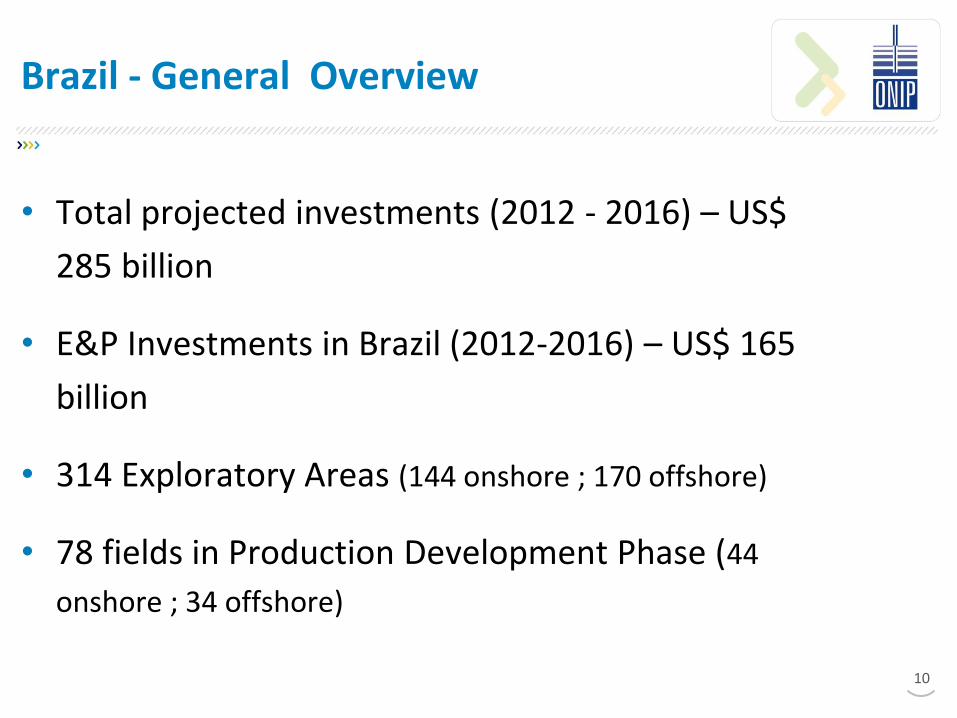
Brazil - General Overview
• Total projected investments (2012 - 2016) – US$
285 billion
• E&P Investments in Brazil (2012-2016) – US$ 165
billion
• 314 Exploratory Areas (144 onshore ; 170 offshore)
• 78 fields in Production Development Phase (44
onshore ; 34 offshore)

11
Total O&G Investments in Brazil 2012-2016
US$ 285 billion
Petrobras US$ 225 billion
Others US$ 60 billion
79%
21%
Petrobras
Others
Source: Petrobras and IBP.

12
E&P Investments in Brazil 2012-2016
Source: Petrobras and IBP.
US$ 165 billion
Petrobras US$ 132 billion
Others US$ 33 billion
80%
20%
Petrobras
Others
13
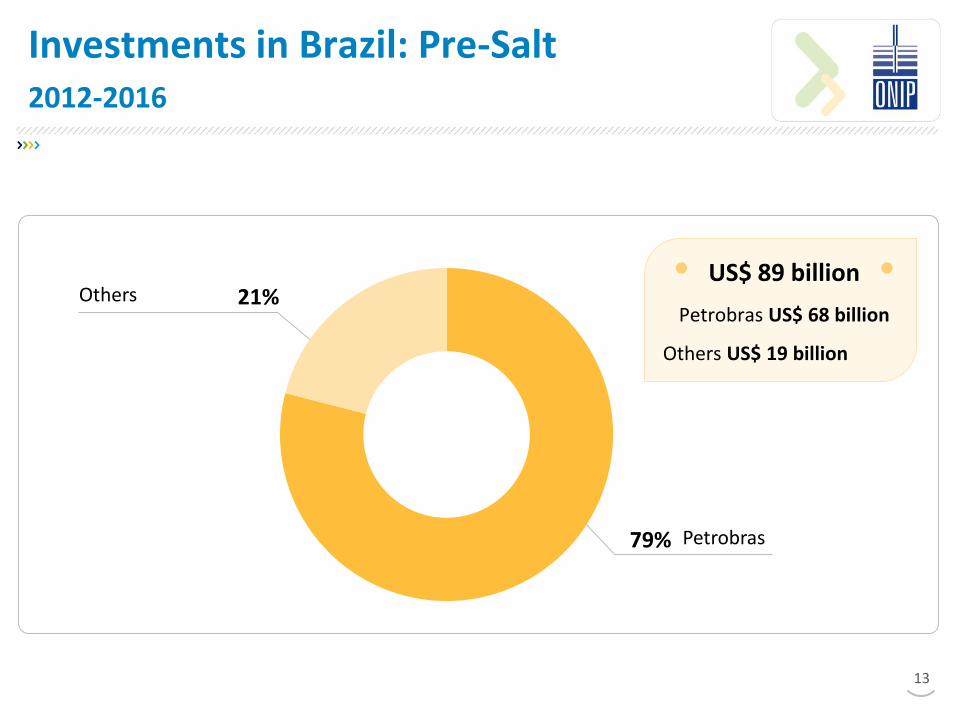
Investments in Brazil: Pre-Salt 2012-2016
US$ 89 billion
Petrobras US$ 68 billion
Others US$ 19 billion
79%
21%
Petrobras
Others

Production and Consumption of crude oil (10 major countries - 2011)
14 Source: EIA US Energy Information Administration
World 88.255,82
1 United States 18.949,43 21,5%
2 China 9.810,00 11,1%
3 Japan 4.464,06 5,1%
4 India 3.360,00 3,8%
5 Russia 3.110,00 3,5%
6 Brazil 2.650,00 3,0%
7 Saudi Arabia 2.620,00 3,0%
8 Germany 2.400,14 2,7%
9 Canada 2.289,31 2,6%
10 South Korea 2.230,17 2,5%
Petroleum Consumption
(Thousand Barrels Per Day)
World 87.192,33
1 Saudi Arabia 11.153,02 12,8%
2 Russia 10.228,52 11,7%
3 United States 10.131,55 11,6%
4 China 4.335,69 5,0%
5 Iran 4.234,12 4,9%
6 Canada 3.599,97 4,1%
7 United Arab Emirates 3.087,85 3,5%
8 Mexico 2.959,87 3,4%
9 Brazil 2.686,78 3,1%
10 Kuwait 2.681,89 3,1%
Oil Supply
(Thousand Barrels Per Day)
Operational Legacy 2.
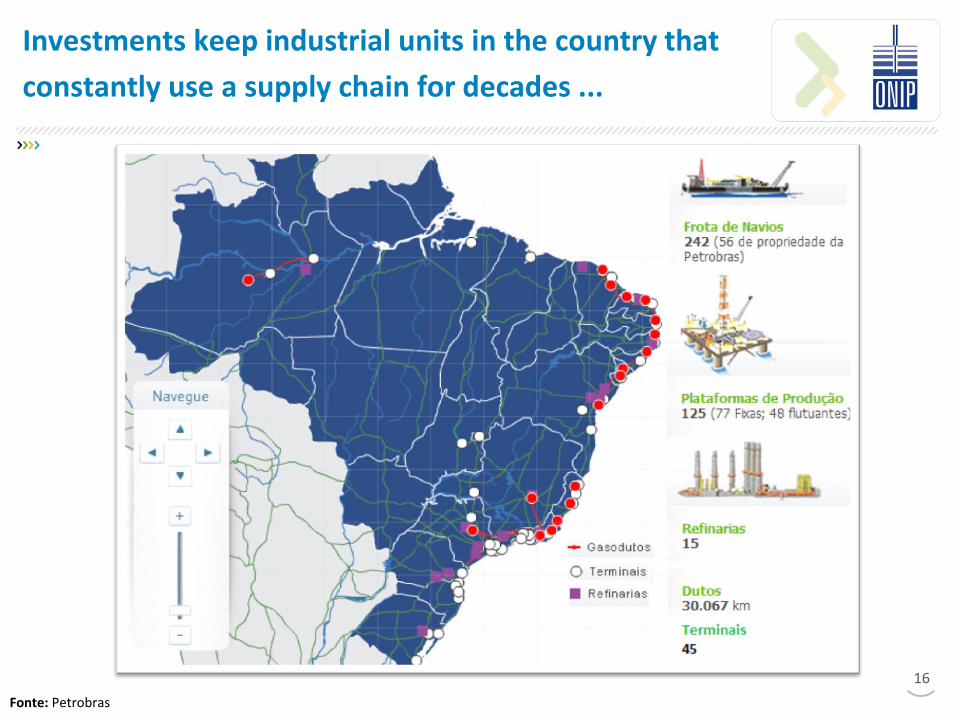
Investments keep industrial units in the country that
constantly use a supply chain for decades ...
16
Fonte: Petrobras

GOIÁS
MINAS GERAIS
SÃO PAULO
ESPÍRITO SANTO
RIO DE JANEIRO
PARANÁ
SANTA CATARINA
SÃO PAULO
RIO DE JANEIRO
CURITIBA
VITÓRIA
FLORIANÓPOLIS 0 100 200
Km
LEGENDA
Poços Testados
Campos de HC
Blocos Exploratórios
Reservatórios Pré-Sal
Charneira
Limite Oeste do SAG Carbonático
Limite Leste do Sal
There will be no difference in developing the pre-salt
and other exploratory frontiers ...
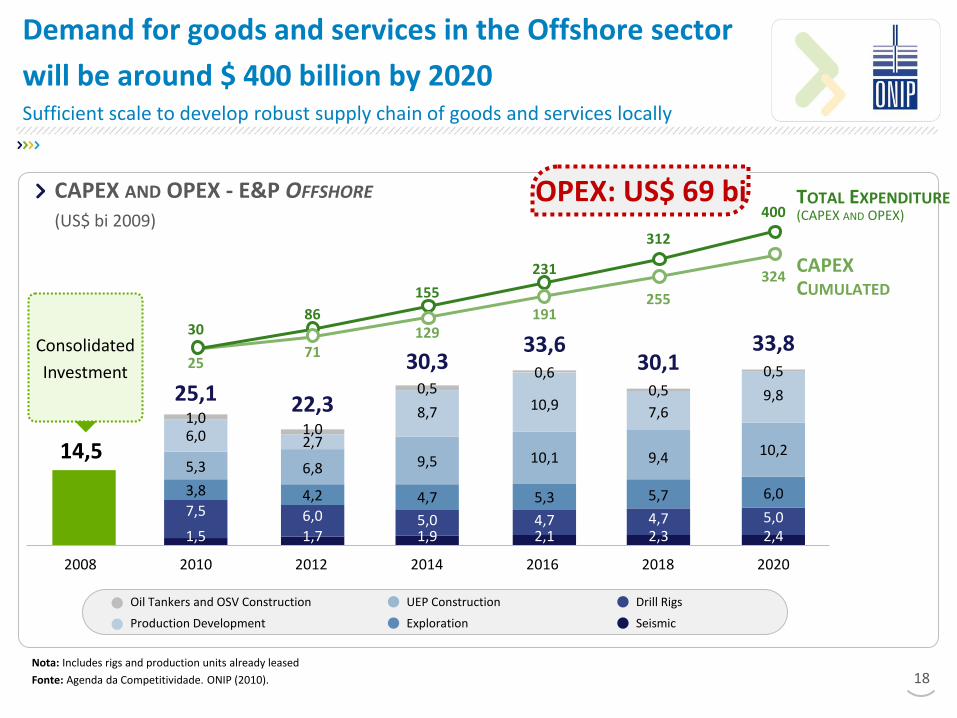
Demand for goods and services in the Offshore sector
will be around $ 400 billion by 2020 Sufficient scale to develop robust supply chain of goods and services locally
18
0,5
2018
30,1
2,3 4,7
2012
22,3
1,7
6,0
2,7 1,0
2010
2,4
2020
33,8
5,0
25,1
1,5
7,5
1,0
2008
0,6
2014
30,3
1,9 5,0
0,5 0,5
2016
33,6
2,1 4,7
Nota: Includes rigs and production units already leased
Fonte: Agenda da Competitividade. ONIP (2010).
Seismic
Drill Rigs
Exploration
UEP Construction
Production Development
Oil Tankers and OSV Construction
CAPEX AND OPEX - E&P OFFSHORE (US$ bi 2009)
Consolidated
Investment
TOTAL EXPENDITURE (CAPEX AND OPEX)
CAPEX CUMULATED
3,8
5,3
6,0
4,2
6,8
4,7
9,5
8,7
14,5
5,3
10,1
10,9
5,7
9,4
7,6
6,0
10,2
9,8
25
30 86
71
155
129 191
231
255
312
324
400 OPEX: US$ 69 bi

Impact over Reserves
Proven Reserves
19 Source: ANP Annual Report 2011 and Petrobras.
Bilh
õe
s d
e b
bl
Tupi, Iara e Guará (Pré-Sal) ~ 13 bi
0
5,000
10,000
15,000
20,000
25,000
30,000
1995 1996 1997 1998 1999 2000 2001 2002 2003 2004 2005 2006 2007 2008 2009 2010 2011

ONIP x Scenario 3.

21
• The pre-salt exploration increased the
demand for FPSO platforms;
• The FPSOs match most platforms used
in the Pre-Salt;
• ONIP studies have identified possible
1000 parts and equipments to be
fabricated in Brazil only in FPSOs;
• MultiFor Program available since
June/2012.
Opportunities
Goods and Services
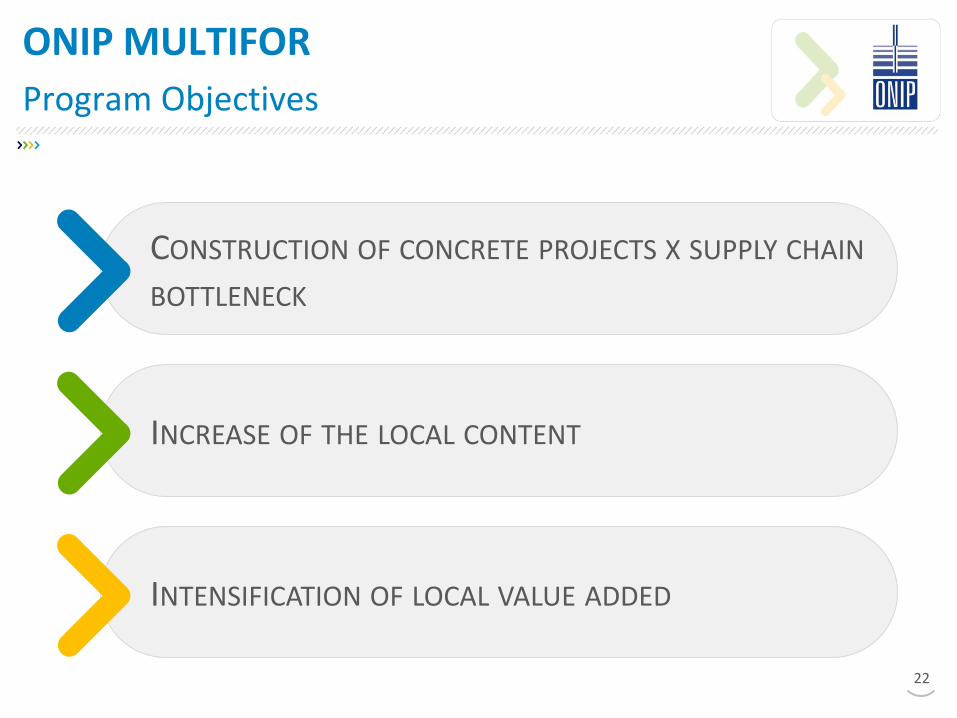
ONIP MULTIFOR
Program Objectives
22
INCREASE OF THE LOCAL CONTENT
INTENSIFICATION OF LOCAL VALUE ADDED
CONSTRUCTION OF CONCRETE PROJECTS X SUPPLY CHAIN
BOTTLENECK

SUPPLY SOLUTION
ONIP MULTIFOR
Supply Chain Development
23
Competitive Intelligence
Business Solution Center
Project Management
DEMANDS
Approved before the ONIP Deliberative Council on 19/04/2012

ONIP Activities
24
LOCAL CONTENT MANAGEMENT SYSTEM (2011 -2012)
• MORE THAN 5000 ITEMS
INSTITUTIONAL
• Breakfast with Energy ( 1999-2012) : 24
• CB-50 / ABNT – Executive Secretariat
Brazilian Standards (ISO TC67) :
• 2011-2012 : 34 norms
KNOWLEDGMENT
• Competitiveness Agenda :
http://novosite.onip.org.br/wp-
content/uploads/2011/07/English-version-final.pdf

SUPPLY CHAIN DEVELOPMENT PROGRAM
ONIP Activities
25
• Suppliers Registration and Qualification
• ONIP Supplier Registry System
28
315
591 721
943 1157
1381 1561
1812 1979
2176 2421 2325
2000 2001 2002 2003 2004 2005 2006 2007 2008 2009 2010 2011 2012

SUPPLY CHAIN DEVELOPMENT PROGRAM
ONIP Activities
26
• Suppliers Registration and Qualification
• CadFor - CADFOR – REGISTRY SYSTEM FOR OPERATORS IN BRAZIL
THE OBJECTIVE IS TO INCREASE THEIR KNOWLEDGE ABOUT LOCAL SUPPLIERS IN SUPPORT OF THE
FULFILLMENT OF LOCAL CONTENT OBLIGATIONS.

SUPPLY CHAIN DEVELOPMENT PROGRAM
ONIP Activities
27
• Suppliers Registration and Qualification
• CadFor
187 246
331
515 573 581
2008 2009 2010 2011 2012 Jan/13

SUPPLY CHAIN DEVELOPMENT PROGRAM
ONIP Activities
28
• Suppliers Registration and Qualification
• Navipeças Registry System
125
327
500
2010 2011 2012

SUPPLY CHAIN DEVELOPMENT PROGRAM
ONIP Activities (2)
29
• Business Rounds
BUSINESS ROUNDS 2011-2012
Place/ Fair Estimation of business in R$: Protection Offshore 2012 R$ 87 million
Rio Oil & Gas 2012 R$ 152 million
Navipeças Rio Grande do Sul R$ 62 million
Navipeças Bahia 2012 R$ 61 million
Santos Offshore 2012 R$ 86 million
Brasil Offshore R$ 170 million
Pernambuco Petroleum Business R$ 992 million
Vitória Oil and Gas R$323 million
Navipeças - Rio de Janeiro R$ 51 million
Total : 1.984 million

SUPPLY CHAIN DEVELOPMENT PROGRAM
ONIP Activities
30
• R&D&I
• Platec – Technological Platforms
• Prototype Labs
• International Competitiveness Increase
• Prointer O&G (Sebrae)

31
SUPPLY CHAIN DEVELOPMENT PROGRAM
ONIP Activities
• R&D&I
• Platec
The Technology Platform Program for the Oil and Gas Industry
was structured to meet the demands for technological
innovation of the oil, gas, and shipbuilding industry. The program
seeks to identify domestic suppliers with potential for
nationalization of goods and services currently imported.

PLATEC - NAVAL EQUIPMENTS
Results
• Identified Equipment: 1876
• Analyzed in 6 workshops: 622
• Identified Projects : 63
• Pontential Projects : 48
• Participants: 381 companies
32

33
PLATEC - NAVAL EQUIPMENTS
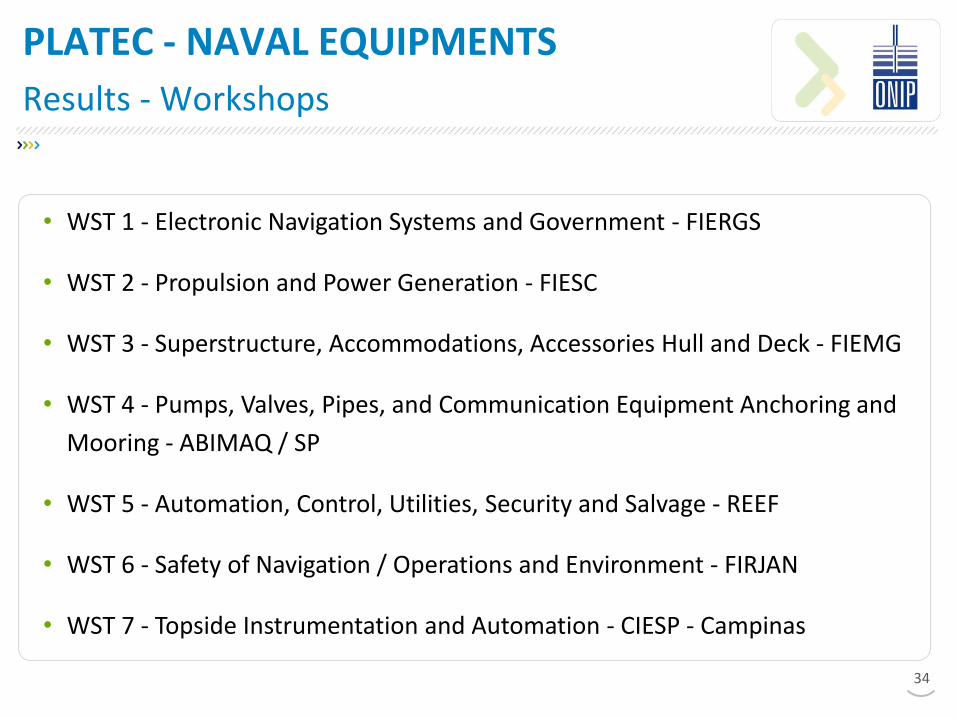
• WST 1 - Electronic Navigation Systems and Government - FIERGS
• WST 2 - Propulsion and Power Generation - FIESC
• WST 3 - Superstructure, Accommodations, Accessories Hull and Deck - FIEMG
• WST 4 - Pumps, Valves, Pipes, and Communication Equipment Anchoring and
Mooring - ABIMAQ / SP
• WST 5 - Automation, Control, Utilities, Security and Salvage - REEF
• WST 6 - Safety of Navigation / Operations and Environment - FIRJAN
• WST 7 - Topside Instrumentation and Automation - CIESP - Campinas
PLATEC - NAVAL EQUIPMENTS
Results - Workshops
34

PLATEC - NAVAL EQUIPMENTS
Results - examples
1. LUBE OIL PURIFIERS
• Company Centrifugar - Rio de Janeiro
• Nor-Shipping 2011 fair(Norway)
• Edital FINEP - Pre-Salt
• Development Project with COPPE UFRJ and RBNA RJ
2. FUEL OIL PURIFIERS
• Company Centrifugar - Rio de Janeiro
• Nor-Shipping 2011 fair(Norway)
• Edital FINEP – Pre-Salt
• Development Project with COPPE UFRJ and RBNA RJ

In progress . . .
Goods and Services for:
• FPSO
• Offshore rigs
• Supply Boats and Ship Repair
36

In progress . . .
Goods and Services for:
37
• Subsea infrastructure and
maritime
• Onshore Exploration and
Production

Workshop Platec FPSO
Results
• Theme: Topside Instrumentation and Automation
• AnaIysed items: 78
• Participants: 70
• Identified Projects : 30
• Magnetic flowmeters: ABB, SIEMENS, SMAR, RBNA, IPT
• Software control setting type "PID":DEVICE, CONCERT, CHEMTECH,
MECTRON, RBNA, IPT
• Vibration Monitoring System: ALTUS, DEVICE, CONCERT, RBNA, IPT
• Pontential Projects : 13
38
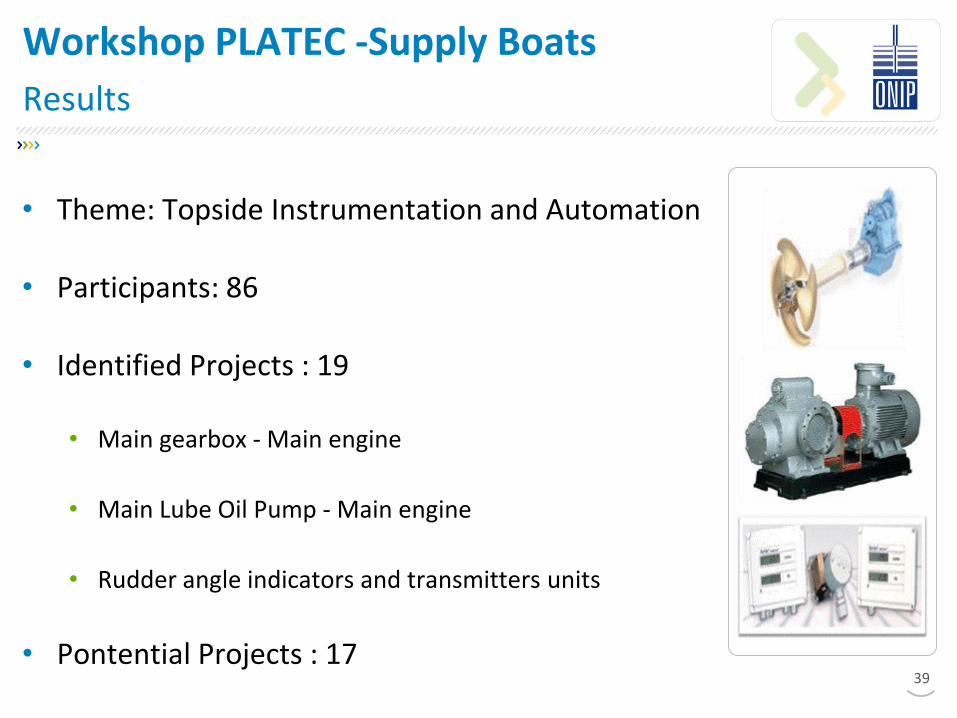
Workshop PLATEC -Supply Boats
Results
• Theme: Topside Instrumentation and Automation
• Participants: 86
• Identified Projects : 19
• Main gearbox - Main engine
• Main Lube Oil Pump - Main engine
• Rudder angle indicators and transmitters units
• Pontential Projects : 17 39

SUPPLY CHAIN DEVELOPMENT PROGRAM - Prointer O&G (Sebrae)
ONIP Activities
40
Prointer 2011
• OTC / Houston / USA
• ONS / Norway
• Offshore Europe / Aberdeen /
Scotland
• Europort /Rotterdam /Netherland
Prointer 2012
• OTC / Houston / USA
• Spain and Italy
• ONS / Stavanger / Norway

Conclusion 4.
42
Conclusion
ONIP HAS BEEN CONTRIBUTING SIGNIFICANTLY FOR
THE BRAZILIAN INDUSTRY REGARDING O&G VALUE
CHAIN SINCE 1999. THIS CONTRIBUTION HAS BEEN
SUPPORTED BY ROBUST RESULTS, EITHER STRATEGIC,
OR PRACTICAL.
- Do your market research;
- Local content is an important issue, so consider partnerships as a
way to access the Brazilian market;