the national lottery: is it progressive? · questions of values and identity. ... a consortium of...
TRANSCRIPT

The National Lottery: Is it Progressive?by Paul Bickley


what Theos isTheos is a public theology think tank which exists to undertake research and provide commentaryon social and political arrangements. We aim to impact opinion around issues of faith and belief insociety. We were launched in November 2006 with the support of the Archbishop of Canterbury, DrRowan Williams, and the Cardinal Archbishop of Westminster, Cardinal Cormac Murphy-O'Connor.Our first report "Doing God": A Future for Faith in the Public Square examined the reasons why faith willplay an increasingly significant role in public life.
what Theos stands forSociety is embarking on a process of de-secularisation. Interest in spirituality is increasing acrossWestern culture. Faith is on the agenda of both government and the media. In the arts, humanitiesand social sciences there are important intellectual developments currently taking place aroundquestions of values and identity. Theos speaks into this new context. Our perspective is that faith isnot just important for human flourishing and the renewal of society, but that society can only trulyflourish if faith is given the space to do so. We reject notions of a sacred-secular divide.
what Theos works onTheos undertakes research across a wide range of subject areas. We analyse social and politicalchange and offer interesting new angles and alternative perspectives on the issues that matter.
what Theos providesTheos provides:
• a research and publishing programme,
• conferences, seminars and lectures,
• outreach to university, college and school students,
• news, information and analysis to media companies and other opinion formers,
with a one-stop information line available to journalists,
• regular email bulletins,
• other related activities.
In addition to our independently driven work, Theos provides research, analysis and advice toindividuals and organisations across the private, public and not-for-profit sectors. Our uniqueposition within the think tank sector means that we have the capacity to develop proposals thatcarry values - with an eye to demonstrating what really works. Our staff and consultants have strongpublic affairs experience, an excellent research track record and a high level of theological literacy.We are practised in campaigning, media relations, detailed policy development and effecting policy change.
www.theosthinktank.co.uk

The National Lottery: is it Progressive?by Paul Bickley

Published by Theos in 2009© Theos
Some rights reserved – see copyright licence for details
For further information and subscription details please contact:
TheosLicence Department34 Buckingham Palace RoadLondonSW1W 0REUnited Kingdom
T 020 7828 7777E [email protected]

introduction
chapter 1 - National Lottery play
chapter 2 - National Lottery spending
conclusion
appendix - survey questions
contents
8
13
21
27
30

8
introduction - the development of the National Lottery
Lotteries have a long history in the United Kingdom. The first was licensed by Elizabeth Iin 1569 in order to fund the repair of the Cinque Ports on the Kent and Sussex coasts.Traditionally, these lotteries existed solely for the funding of public building projects,including Westminster Bridge.1 During the 18th century opposition to lotteries, predicatedpartly on their social ill effects and partly on their inefficiency in raising revenue, grew. In1808, a Select Committee of the House of Commons argued that:
No mode of raising Money appears to Your Committee so burdensome, sopernicious, and so unproductive; no species of adventure is known, where thechances are so great against the adventurer, none where the infatuation is morepowerful, lasting, and destructive,2
and
Idleness, poverty and dissipation are increased [by the lottery]…truth betrayed,domestic comfort destroyed, madness often created, crimes are committed, andeven suicide itself is produced … And this unseemly state of things is to continue,in order that the state may derive a certain annual sum from the encouragementof a Vice, which it is the object of the law, in all other cases, and at all other times,most diligently to repress.3
The last lottery in the United Kingdom for over 100 years was held in 1826.
Following the publication of a Home Office White Paper in 1992, a Bill was introduced toParliament in 1993 which cleared the way for the National Lottery and established aregulatory system.4 After the National Lottery etc Act received Royal Assent on 21 October1993 Camelot – a consortium of various companies including Cadbury Schweppes andthe Post Office – was awarded the licence to operate the Lottery. The first draw was heldon 19 November 1994.
There have been two basic forms of game: the first is the draw-based game, where, in themost basic form, participants pay £1 to choose 6 numbers from a 1-49 numbered balldraw; prizes are then determined by the number of correct matches; the second is a

9
the developement of the national lottery
scratchcard game (branded “Instants” by Camelot), where particular values must bematched on a scratchcard to win a prize. Instants are often marketed through film andevent tie-ins, such as those using imagery from popular films like Pirates of the Caribbean:At World’s End and Indiana Jones and the Temple of the Crystal Skull. Latterly, a line ofOlympic-branded games has been launched with the express purpose of developing afunding stream for the 2012 London Games.
The founding principle for the Lottery, unlike those earlier in history, is “additionality”.Under the principle of additionality, the ‘funds raised for good causes from the operationof the Lottery should not be subsumed into public expenditure’, i.e. the money raised bythe National Lottery should only be spent on projects that are additional to core publicsector responsibilities.5 Thus, spending of National Lottery funds was initially channelledinto five categories: the arts, sports, heritage, charitable and millennium celebrationprojects. Subsequent changes led to the establishment of the New Opportunities Fundto support initiatives in health, education and the environment, much criticised ascontravening the additionality principle. More recently, the administration of good causespending has been restructured again with the establishment of the Big Lottery, whichadministers 50% of all ‘good cause’ spending under the headings of health, education,environment and charitable expenditure. The National Lottery will also provide £2.2 billion or more of funding to the 2012 London Olympic and Paralympic Games.
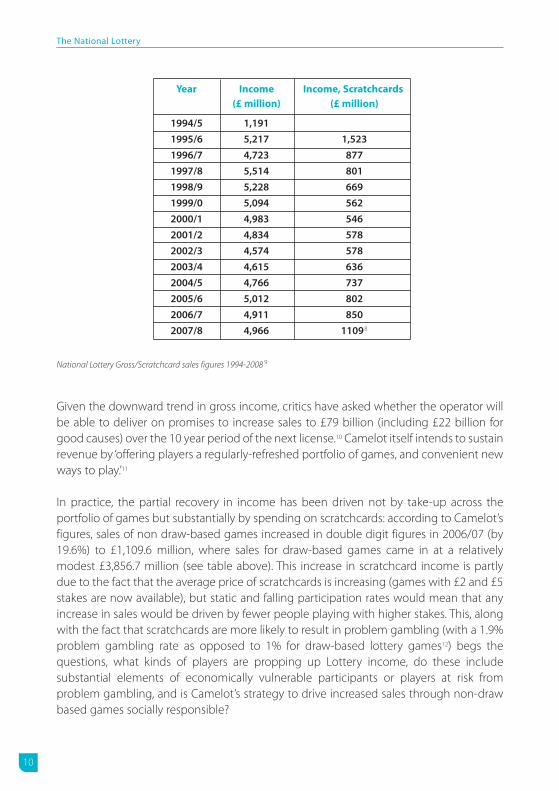
Lottery operator Camelot claims that 70% of theadult population play at least one National Lotterygame regularly.6 In fact, a variety of surveys indicatea trend for diminishing rates of play in the yearssince the Lottery’s inception. Research carried outby Sawkins and Dickie indicates that only just overhalf of households participated in the Lottery in theyear 1999/2000, and the British Gambling Prevalence Survey of 2006/07 found that only10 million adults participated in the National Lottery during that year.7 Total receipts havefallen significantly since a peak in 1997/98 (£5,514 million), bottoming out in 2002/03(£4,575 million), rising only slightly after a rebrand and relaunch in 2002 to £4,966 millionin 2007/08 (see table below). This finding appears to be consonant with research carriedout in 2002 by the National Lottery Commission which suggests that only ‘four in tenrespondents (41%) played National Lottery games regularly (at least every week)’. Themost recent data from the Expenditure and Food Survey (2006) suggest that only around45% of households are participating in the National Lottery.
A variety of surveys indicatea trend for diminishing ratesof play in the years sincethe Lottery’s inception.
10
The National Lottery
1994/5 1,1911995/6 5,217 1,5231996/7 4,723 8771997/8 5,514 8011998/9 5,228 6691999/0 5,094 5622000/1 4,983 5462001/2 4,834 5782002/3 4,574 5782003/4 4,615 6362004/5 4,766 7372005/6 5,012 8022006/7 4,911 8502007/8 4,966 11098
Year Income Income, Scratchcards(£ million) (£ million)
National Lottery Gross/Scratchcard sales figures 1994-2008 9
Given the downward trend in gross income, critics have asked whether the operator willbe able to deliver on promises to increase sales to £79 billion (including £22 billion forgood causes) over the 10 year period of the next license.10 Camelot itself intends to sustainrevenue by ‘offering players a regularly-refreshed portfolio of games, and convenient newways to play.’11
In practice, the partial recovery in income has been driven not by take-up across theportfolio of games but substantially by spending on scratchcards: according to Camelot’sfigures, sales of non draw-based games increased in double digit figures in 2006/07 (by19.6%) to £1,109.6 million, where sales for draw-based games came in at a relativelymodest £3,856.7 million (see table above). This increase in scratchcard income is partlydue to the fact that the average price of scratchcards is increasing (games with £2 and £5stakes are now available), but static and falling participation rates would mean that anyincrease in sales would be driven by fewer people playing with higher stakes. This, alongwith the fact that scratchcards are more likely to result in problem gambling (with a 1.9%problem gambling rate as opposed to 1% for draw-based lottery games12) begs thequestions, what kinds of players are propping up Lottery income, do these includesubstantial elements of economically vulnerable participants or players at risk fromproblem gambling, and is Camelot’s strategy to drive increased sales through non-drawbased games socially responsible?
11
the developement of the national lottery
Further to this, concerns have been raised that National Lottery play, and more specificallythe 12% Lottery Duty (calculated to recover tax revenues lost through diversion ofconsumer spending from taxable gambling and other consumer products towards thepurchase of Lottery tickets) is regressive. As the House of Commons Culture, Media andSport Select Committee has noted:
…analysis of levels of play suggested that ‘the probability of participating...is astrongly decreasing function of income. The richer you get, you are much lesslikely to play ... If you do play the game, the amount that you play increases slightlywith your income.’ Levels of play among low income groups have led to claims, inboth the United Kingdom and the United States, that the Lottery has a regressiveimpact. That view was also stated anecdotally by retailers, who said that someplayers consider the Lottery to be ‘a tax on the poor for the patronage of the rich.’ 13
To establish this point on anything other than a rhetorical basis, we must determine whatthe economic profile of Lottery players might be. Further to this, does good causeexpenditure mitigate or aggravate the allegedly regressive profile of National Lotteryplay? In short, we will seek to answer the question: who plays and where does the money go?
This paper reviews existing literature and other evidence on these questions and reportsthe findings of new Theos-commissioned research into the characteristics of players. Itfinds that the average player lives in a household of below average income, is relativelypoorly educated, and is spending proportionatelymore than his more affluent counterparts on theNational Lottery. In order to maintain and increaserevenues, the operator, Camelot, has adopted astrategy of moving away from the draw-basedgames towards scratchcards. These are particularlyattractive to low income players, even those whoare unemployed or on benefits. We go on toconsider how Lottery money is spent, and find thatit fails to reward high rates of play among lessaffluent players with high levels of grant-making inareas where they are likely to live. Lottery play, andthe 12% Lottery Duty, is regressive, and distribution of Lottery money fails to mitigate thiswith markedly progressive grant-making. The public funding package for the 2012Olympic Games, which relies heavily on the National Lottery, will exacerbate this problemby reducing the amount of money available to projects in deprived areas.
In order to maintain andincrease revenues, theoperator Camelot hasadopted a strategy ofmoving away from thedraw-based games towards scratchcards.

12
1. Peter G Moore, “The Development of the UK National Lottery: 1992–96”, Journal of the Royal Statistical Society,
Series A (Statistics in Society), vol. 160, no. 2 (1997), p. 169.
2. “Laws relating to Lotteries”, Second Report from the Select Committee with Appendix, 1808 (323) Vol II pp. 11-12,
republished in British Parliamentary Papers IUP series: “Social Problems-Gambling (2): Reports from Select
Committees ... 1808-98”, pp. 19-20. Quoted in House of Commons Culture, Media and Sport Select Committee,
“The Operation of the National Lottery”, First Report, Session 2001-02, The Stationery Office HC56-I, paragraph 7.
3. Quoted in David M Downes, “Gambling, Work and Leisure: A Study Across Three Areas”, Routledge, 1976, p. 30.
4. The 1992 White Paper specifically made the case for the Lottery as a way of funding otherwise under-resourced
good causes in the arts, heritage and charitable arenas.
5. House of Commons Library Home Affairs Section, “The National Lottery and Additionality”, House of Commons
Library Standard Note, 10 April 2000.
6. http://www.national-lottery.co.uk/player/p/help/responsibleplay/underageplaystrategy.ftl.
7. JW Sawkins and VA Dickie,“National Lottery Participation and Expenditure: the First Five Years”, unpublished
discussion paper, Heriot-Watt University, May 2001, p. 9.
8. Figure for 2007/08 includes Interactive Instant Win Games.
9. Figures drawn from National Lottery Commission Annual Reports and House of Commons Culture, Media
and Sport Select Committee, “Reform of the National Lottery”, Volume 1, Fifth Report Session 2003-04,
The Stationery Office, HC196-I, p. 7.
10. National Lottery Commission, “Statement of Reasons: Licence to Run the National Lottery”, August 2007.
Available at http://www.natlotcomm.gov.uk/UploadDocs/Contents/Documents/Statement%20of%20Reasons
%20final%20with%20covers%2016.08.07.pdf.
11. Camelot Press Release, “Camelot Tops Bid-Winning Year With Rises In National Lottery Ticket Sales And Returns
To The Good Causes”, 27 May 2008. Available at
http://www.camelotgroup.co.uk/pressreleases/2008/May/2008finalresults.pdf.
12. Heather Wardle et al., “British Gambling Prevalence Survey”, National Centre for Social Research, 2007, p. 95.
13. House of Commons Culture, Media and Sport Select Committee, “The Operation of the National Lottery”,
paragraph 32.
introduction - references

There is quite a lot of evidence on who plays the National Lottery. Existing materialincludes the British Gambling Prevalence Survey (BGPS), a roughly five-yearly survey of arandom sample of 9,003 individuals commissioned by GamCare1; studies using the FamilyExpenditure Survey/Expenditure and Food Survey (FES/EFS), a continuous annual surveyof around 10,000 households carried out by the Office for National Statistics2; and poll-based surveys, including those commissioned by the statutory regulatory agency,the National Lottery Commission. We review some of this evidence below, including theresults of a new survey carried out by ComRes on behalf of Theos.
the Gambling Prevalence SurveyThe survey found that 68% of the population, that isabout 32 million adults, had participated in someform of gambling activity in 2007. This compares to72% (about 33 million adults) in 1999. For around athird of these – roughly 10 million people – theironly gambling activity in the past year had been participation in a National Lottery draw.Participation in the National Lottery had decreasedsince 1999, when the figure was 11 million.Nevertheless, it remains the most popular form ofgambling in the UK (57%), followed by NationalLottery scratchcards (20%), though scratchcard playhad also dropped from 1999 levels.
A brief review of Lottery play by National Statistics Socio-Economic Classification (NS-SEC)shows that past year gambling prevalence in general was highest for those from lowersupervisory and technical households (75%), and lowest for those frommanagerial/professional households and intermediate households (both 67%).3 In regardto the National Lottery, participation in the main weekly draw was some sevenpercentage points higher among those from semi-routine households (61%) and 12percentage points higher among those from lower supervisory and technical households(66%) than managerial and professional households (54%). Significantly morerespondents from semi-routine and routine households bought scratchcards than did
13
who plays the National Lottery?
1
Past year gamblingprevalence in general was highest for those from lower supervisory and technical households,and lowest for those frommanagerial/professionalhouseholds andintermediate households.

those from managerial and professional households (24% compared with 17%). There arealso high rates of scratchcard play amongst the unemployed (29%); lower only than thosewho list their economic activity as ‘looking after the family home’ (31%).
There appears to be quite a strong inverse relationship between level of education andinvolvement in gambling as a whole and in National Lottery play in particular. Of thosewhose highest educational qualification is GCSE/O Level, 63% participated in the NationalLottery draw and 26% played scratchcards. Of those whose highest educationalqualification was a degree, 48% participated in the National Lottery draw and 16% playedscratchcards. In short, both NS-SEC classification and levels of education can be used aspredictors of National Lottery play.
participation, expenditure and attitudesIn 2003, the National Lottery Commission undertook research into player profile by meansof an NOP omnibus poll across the United Kingdom.4 The survey also sought to exploreattitudes to different games within the National Lottery. The survey found that 67% ofadults in the United Kingdom had participated in some form of the National Lottery in theprevious year which, again, is low in comparison to rates of play earlier in the life of theNational Lottery. Only 41% of respondents played National Lottery games once a week ormore. There was no statistically significant distinction in terms of gender of therespondents, though players are more likely to be older: the proportion of people playingNational Lottery games on a weekly basis increased with age from around a sixth (17%)of the youngest group, and just under a third of those aged 25 to 34, to around half ofthose in the older age groups.
The research finds that those of higher social class are less likely to play and those of lowersocial class are more likely to play. In terms of respondents who participated in anyNational Lottery game, 49% of C2 respondents played, compared to only 31% of ABrespondents. Rates of non-participation were also highest among AB respondents andlowest among C2s. In terms of scratchcards, participation was highest also among lowersocial classes. 8% of DE respondents play instant games every week, compared to only 3%of ABs. Gross spending is higher amongst C2s and Ds than ABs and C1s. While the report’sauthor observes that, “expenditure among players was found to increase along withhousehold income, from £1.90 among those in the lowest income group [<£4,500], up to£2.90 among those with an income of between £9,500 and £24,999, dropping onlyslightly in the highest income band (£25,000+)”, this should not distract us from the factthat, by proportion of income, spending is significantly higher amongst lower socio-economic groups: a £98.80 annual spend constitutes at least 2.2% of annualearnings for those on <£4,500, compared to as little as 0.6% of annual earnings for thoseearning £24,999 and spending £2.90 every week.
14
The National Lottery

studies using the Expenditure and Food SurveyA number of studies have been carried out using data from the Family Expenditure Survey(up to 2001) and the Expenditure and Food Survey (since 2001). These tend to illustratethe trends reviewed above.
For instance, a 2001 review of the data found that in the first five years for which figureswere available, participation in draw-based games across all households decreased from69% to 52%.5 The authors, JW Sawkins and VA Dickie, also found, however, thathouseholds in the lowest income decile also have the lowest Lottery participation rate.The highest participation rates relate to households in the upper half of the incomedistribution – the 6th, 7th and 8th deciles – but not the highest category. Again, theynoted a discrepancy between findings against income and social class. Participation rateswere highest in houses headed by skilled manual, partly skilled and unskilled workers (in1999/2000, figures were 64%, 57% and 57% respectively, as against 38% for professionals).Participation rates fell uniformly across the social classes throughout the five years.
The authors also found an increase in the averagestake: “In nominal terms the all-household meanweekly stake has risen from £3.18 in 1995/6 to £3.95in 1999/2000; an increase of 24.2% ... During thesame period the retail prices index rose by 11.5%.”In absolute terms, higher income households did spend more. However, proportionate to income Sawkins and Dickie found the Lottery to be regressive:
For participating households, National Lottery expenditure as a proportion of total household expenditure ranged – in 1995/6 – from 0.64% (highest incomedecile) to 1.84% (lowest income decile). The corresponding figures for 1999/2000were 0.63% and 1.88%.
Furthermore, when classifying households according to their occupational social class,Sawkins and Dickie found that participation rates are highest for households in the skilledmanual social class and lowest for professionals.
ComRes survey reportIn December 2008, Theos commissioned ComRes to undertake a public poll on NationalLottery play and perceptions amongst British adults. Interviews were carried out using an online questionnaire between and December 2008. Data are weighted to be representative demographically of all British adults.
who plays the national lottery?
15
In the first five years for which figures wereavailable, participation indraw-based games acrossall households decreasedfrom 69% to 52%.

We sought to examine participation in the two main forms of play – scratchcards anddraw-based games. The poll then introduced questions on the stakes in both scratchcardand draw-based game play before concluding the poll with two questions on publicperceptions of the Lottery (the first to test what would stop people from playing theLottery and the second whether respondents felt they or a close family member hadpersonally benefited from a project funded by the National Lottery good causespending). All questions, apart from those seeking to measure perceptions, weremodelled on the Gambling Prevalence Survey’s National Lottery questions.
scratchcards24% of people spend money on National Lottery scratchcards once a month or morefrequently, with 56% having participated at least once over the last 12 months (this issignificantly higher than the rates of participation recorded in the Gambling PrevalenceSurvey). 55-64 year-olds were more likely to play scratchcards than any other category,with 31% participating once a month or more. In terms of social class, respondents in theC2 and DE categories were significantly more likely to play than their counterparts in ABand C1 categories (34% and 25% compared to 20% and 18% respectively playing once amonth or more). Rates of play in these social classes were found to be higher than in someof the research reviewed above (e.g., the Gambling Prevalence Survey indicated that 8%of DEs played at least once a week, compared to 13% in our survey). Similarly,respondents in the AB and C1 categories were more likely than C2s never to have boughtscratchcards (34%, 26%, and 19% respectively).
36% of households with an annual household income of £15-20,000 (well below thenational average of £33,492) play once per month or more, with 18% playing more than
once per week (compared to an average across thesample of 14%). Those in receipt of state benefitswere marginally more likely to have played (26%)than those who are not (22%). Respondents with aneducation level of A Level or lower were also morelikely to play, with 26% buying a scratchcard once amonth or more frequently, than those withundergraduate degrees, graduate degrees or thosein full time education. These latter categories werealso more likely never to have played a scratchcard.
Furthermore, the survey indicates that categories of individuals more likely to play are alsomore likely to spend more when they do play. Of respondents who spent money onscratchcards once a month, or 2-3 times per month, respondents in the C1 and C2categories spent, on average, £4.38 and £3.95 respectively, against an average across the
16
The National Lottery
Respondents in the C2 and DE categories
were significantly morelikely to play than their
counterparts in ABand C1 categories.

base of £3.77 per month. In terms of income categories, spending is highest in low-middle and middle income homes. For instance, households earning £15-20,000 in thisbase spent an average of £4.07, and those earning £25-35,000 spent £4.93. However, thekey point is that spending is higher as a proportion of income in lower income categories(e.g., a weekly spend of £5.02 equates to just over 1% of the income of a householdearning £25,000 but £5.01 per week equates to 2.6% of the income of a householdbringing in £10,000).
draw-based gamesOur survey found that participation rates in the draw-based games are lower thanrecorded in some of the literature above, with around 46% playing once a week or more,and this in spite of recent developments in the portfolio. Only 56% were playing once a month or more frequently, with 37% ofpeople stating that they had never played, notplayed in the last 12 months or that they onlyplayed ‘very rarely’.
Again, C2 respondents were the most likely to playdraw-based games, with over 67% of intervieweesin this category participating once a month ormore, compared to 47% of ABs. Rates of play were highest, by a small margin, amongsthouseholds earning £75,000+ (69% once a month or more) and £20-25,000 (65% once amonth or more). Again, weekly stakes were higher amongst C2s and DEs: of respondentsin our survey playing once per week or more, the average weekly stakes of C2s and DEswere £5.92 and £5.81 respectively; higher by a modest, but significant, margin (ABrespondents played at an average stake of £5.33 and C1 respondents at £5.11). There issome interesting regional variation in stakes, with residents in Scotland, Wales andLondon all playing at significantly higher stakes than the mean average (£7.20, £8.25 and£5.95 compared with £5.55). An analysis of stakes by household income shows again thatstakes are relatively flat across the spectrum, but that those on lower incomes arespending proportionately more by a considerable degree. For instance, frequent playersearning £15-20,000 per year had an average weekly stake of £6.73 (£349.96pa or at least1.74% of annual household income), the same as respondents with a household incomeof over £75,001 per year (£349.96pa or less than 0.46% of annual household income). Inother words, low income households are spending proportionately over three times asmuch as high income households.
17
who plays the national lottery?
Low income households arespending proportionatelyover three times as much ashigh income households.

values and perceptionsTurning to the values and perceptions question in our poll, it seems clear that ‘good cause’spending is a significant motivational factor for participants in the National Lottery. Whenasked, ‘Which of the following would probably convince you to stop playing the NationalLottery?’, 43% of all respondents said that a withdrawal of funding from good causes ingeneral would discourage them from playing the Lottery. The idea of redirecting goodcause spending to major infrastructure projects and, specifically, the Olympic Games,would put roughly a quarter of respondents off playing the Lottery. The idea of limitingcash prizes to £100,000 proved particularly unpopular amongst AB respondents (29% saidthis would make them reconsider playing the Lottery, compared to only 18% of DErespondents). Indeed, players from across the higher income categories strongly objectedto this idea, with 37% of respondents from households in the £55-65,000 bracket sayingthis would discourage their participation in the National Lottery, compared to an averageacross the base of 21%. Overall, C2s and DEs were the most committed Lottery players,with 28% of those groups saying none of the reasons given would prevent them playingthe National Lottery, compared to 20% of ABs). 32% of players in the £10-15,000 categorysaid that none of the reasons offered would prevent them from playing the NationalLottery, compared to an average of 25% across the whole poll.
Finally, an overwhelming majority of respondents – 81% across the poll – stated thatneither they nor a close family member had personally benefited from a project fundedby the National Lottery. This figure was fairly consistent over age, social class, andhousehold income demographics; people tend not to feel that they are benefiting fromgood cause spending. There is, therefore, a mix of motivations for playing the Lottery.High prizes are highly valued only by a significant minority, usually existing high earners,where lower income players are simultaneously less interested in high value prizes andmore likely to play regardless of the prize structures. No firm conclusions can be drawn,except to say that players are unlikely to be participating because they perceive that theymight benefit personally through good cause spending.
the typical playerWho plays the National Lottery? On the basis of theGambling Prevalence Survey we know thatparticipation in the National Lottery is the mostpopular form of gambling in the United Kingdom,with roughly 57% of UK adults participating at thetime of the last survey. It is not without justification,therefore, that both the operator and successivegovernments have claimed that all sectors of society participate.
18
The National Lottery
It is not the case that all sectors of
society participate to the same degree.
19
It is not the case, however, that all sectors of society participate to the same degree, andto make this claim, in the light of the mounting evidence reviewed above, looksincreasingly tendentious. A typical Lottery player lives in semi-routine or a lower-supervisory/technical household. He or she is not, in the main, professional or welleducated. Indeed, he or she is as likely to be unemployed as living in an affluent home.Although the typical player will be spending only the same as, or perhaps even slightlyless than his affluent counterparts, proportionate to household income he or she will bespending perhaps two or three times more than high income players.
Finally, most players like the idea that a significant part of Lottery revenue goes to goodcauses. There are, however, important caveats here: over 1 in 4 people object to therefocusing of Lottery spending on the Olympic Games when it has an adverse impact onLottery spending in their own area. Interestingly, the typical player would object less to acap on prizes than his more affluent counterparts. He or she is probably not aware ofprojects that have benefited him/her or a close associate. This raises the question, is thewealth created by National Lottery play reaching those that create it?
who plays the national lottery?

1. The full report is available at: http://www.gamblecommission.gov.uk/UploadDocs/publications/Document
/Prevalence%20Survey%20final.pdf.
2. The FES/EFS relies on voluntary, diary-based reporting of spending. The Office of National Statistics believes
that ‘reported expenditure on a few items (notably tobacco and alcohol) is below the levels which might be
expected by comparison with other sources of information,’ and that, ‘National Lottery spending has also been
significantly under-recorded in the EFS, particularly for scratchcards. For this reason, researchers have tended to
exclude scratchcard data from their work, focusing instead on the more reliable data for the draw-based play.
3. Respondents are assigned to an NS-SEC category based on the current or former occupation of the household
reference person.
4. Kelly Sprotson, “Report of Participation, Expenditure and Attitudes”, National Lottery Commission 2002.
Available at http://www.natlotcomm.gov.uk/UploadDocs/Contents/Documents/social_research_2003_pdf(3).pdf.
5. JW Sawkins and VA Dickie,“National Lottery Participation and Expenditure: the First Five Years”, unpublished
discussion paper, Heriot-Watt University, May 2001.
20
chapter 1 - references
The founding raison d’être of the National Lottery was to provide a funding stream fordesirable but otherwise unfunded good causes, and its undergirding principle“additionality”, i.e., funds raised for good causes from the operation of the Lottery shouldnot be subsumed into public expenditure. Since the inception of the National Lottery,nearly £21 billion has been given to good causes, with grants ranging from £12 (for acycling award) to £604 million (given to the Millennium Dome), with the highest averagegrant value going to millennium projects, and the lowest to charitable expenditure.1
National Lottery grants are administered by 14 semi-autonomous agencies2 in five broadareas of spending: arts, heritage, sport, charity/community/voluntary groups, andprojects concerned with health, education and the environment.3 These broad areas offunding (excepting health, education and environment) were established in the initial Act(National Lottery etc. Act 1993). This legislation provided for the establishment of theNational Lottery Distribution Fund, which would in turn allocate funds to the distributionagencies to apportion money to projects within the five initial areas (arts, sports, heritage,charitable, and millennium) in equal proportion (i.e., 20% to each of the five areas). Thenow defunct Community Fund, known earlier in its life as the National Lottery CharitiesBoard, would apportion funds to the four countriesof the United Kingdom on the basis of populationweighted by deprivation. Distributors would havean obligation to ensure that all parts of the countrywould have fair access to funds and, morespecifically, that awards should be made with aview to reducing economic and social deprivation.4
Following repeated reorganisation and redesign ofthe grant-awarding bureaucracy, the Big Lottery Fund now administers 50% of all thegood cause money raised, attributing it to projects in the final two categories.5 Thesecond largest fund is the Heritage Lottery Fund. Respectively, they have awarded £4,155and £4,141 million. Other significant bodies include Arts Council England (£2,435 million), Sport England (£2,734 million) and the (now closed) Millennium Commission (£2,156 million).
21
National Lottery spending
2
The founding raison d’êtreof the National Lottery wasto provide a funding streamfor desirable but otherwiseunfunded good causes.
22
Since the Lottery’s inception, concerns have been raised that money is not reaching thepoorest communities:
Some of the most deprived areas have yet to see the full benefit of Lotterymoney… The people who most need help from the Charities Board can be thoseleast able to seek it. The Board are prepared to provide practical support to helpsmaller groups prepare bids, but their NOP survey has confirmed that theirprocesses are a potential barrier.6
National Lottery funding for the Olympic GamesIn the light of the National Lottery’s significant role in funding the Olympic Games theissue of spending has now been re-politicised. Under a 2003 memorandum ofunderstanding on the subject of public spending for the Games, the National Lotterywould provide £750 million from the sales of Olympic Lottery tickets, £340 million fromthe budgets of sport distributors and a further £410 million in contingency budget todraw on if necessary (this was indeed deployed by the then Secretary of State for Culture,Media and Sport in June 2006).
Following a budget review in March 2007, the Secretary of State announced that theNational Lottery would be called upon to invest a further £675 million towards a revisedtotal budget of £9,325 billion in the form of loans. All Lottery distributors, with theexception of UK Sport, will experience a reduction in grants from the National LotteryDistribution Fund. The Big Lottery, for instance, will have contributed £638.1 million to theOlympic Games – considerably more than its annual budget for a single year (£603 millionin 2006/07). This, together with concerns that Olympic-themed games will “cannibalise”sales of other National Lottery products (Camelot has estimated up to a 77% rate), hasraised concerns that the public funding package for the Olympics will have significantramifications for Lottery funding of arts, heritage and voluntary sector projects, as well asan adverse impact on sports projects outside the capital. A recent report from the Houseof Commons Culture, Media and Sport Select Committee states categorically that“amounts available to non-Olympic Lottery distributors are decreasing and can beexpected to continue to decrease for the next few years.” 7 The report also notes thepotential difficulties for Olympic funding should there be any reduction in Lottery sales,especially in view of tough targets income for the next 10 year licence. The net effect on good cause spending will be both significant and detrimental to deprived communities.
The National Lottery

are grant-making patterns progressive?There has been little academic analysis of the social effects of Lottery spending, with theexception of a brief paper by Feehan and Forrest, who carried out an analysis of thedistribution of UK Lottery grants by local authority area, effectively using the affluence ofa local authority area to estimate regressivity.8
Drawing on information available from the Department of Culture, Media and Sport, theyconverted the number of grants made to 376 local authority areas to a per capita figureby dividing the cumulative sum received in a local authority by its population as recordedin the 2001 Census. Measures of the characteristics of each area were also extracted from2001 Census data, specifically from the Local Authority National Report for England andWales. The results illustrate a tendency for big cities to win a disproportionate share ofLottery grants, with the relationship most clearly defined in the arts category, where boththe metropolitan county and London dummies attract significant coefficients. Localauthority areas in the metropolitan counties and London are estimated to have procuredper capita arts funding approximately £50 and £92 higher than other local authority areas,controlling for education, social class and ethnicity effects. This represents substantialdisparity in funding given that the mean across all areas, unweighted by population, is£34.07. They also found that non-white was a significant negative category in the awardof heritage grants. For education, total grants and funding under each of the six sub-headings are positively related to the proportion of graduates in the area. In essence,affluent areas receive higher levels of grants, hence, “the overall impact of the UKNL GoodCauses package is regressive.” The authors suggested that the complex applicationprocess for National Lottery grants means that groups with a committed and educatedmembership or staff may be preferenced and recommend that, at the least, theapplication process could be simplified. A more radical proposal would be to scale downthe tax and expenditure elements of the National Lottery, thereby reducing the regressiveelement of the National Lottery in favour of greater prizes for those who play.
For the purposes of this report, we repeated a similar calculation, using the Index ofMultiple Deprivation, or IMD (a combination of a variety of indicators covering economic,social and housing issues) to identify correlative patterns between Lottery grant-makingand pockets of deprivation. Although the indices are produced at lower super outputareas9, we present them here as aggregated in local authority areas.10 We have brokendown Lottery spending into the broad spending categories, excluding millenniumprojects. Our categories therefore are: arts, sports, heritage and health, education,environment and charitable expenditure (the funding stream now administered by theBig Lottery). We suggest that, at the least, the final category ought to display correlationbetween high levels of deprivation and high levels of grant-making. Results are set outdiagrammatically below.
23
national lottery spending

IMD Score
250
200
150
100
50
0
Figure 1 Big Lottery Grants/IMD of Local Authority
We see from Figure 1 that only a mild correlative pattern between grant-making underthe headings of health, education, environment, charitable expenditure and deprivation,presents itself. It must also be noted that the top seven grant winners are excluded from thegraph. The median per capita grant across the board is £16.36 (notably low in comparisonwith other categories); the 119 local authorities that received an above average grant hadan average IMD score of 23.43, only slightly above the overall average score of 19.24.
24
100
90
80
70
60
50
40
30
20
10
00 10 20 30 40 50 60 70 80
0 10 20 30 40 50 60 70 80
The National Lottery
Gra
nt p
er c
apit
aG
rant
per
cap
ita
Figure 2 Arts Grants/IMD of Local Authority
Again, there is no strong correlation between arts grants and IMD scores. Indeed, Figure2 (again, excluding outlying high end results) shows a fairly flat distribution.
The average per capita arts grant across local authorities comes in at £82.45. The averageIMD score of Local Authorities in receipt of higher-than-average per capita grants is 26.14
IMD Score

IMD Score
500
450
400
350
300
250
200
150
100
50
0
Gra
nt p
er c
apit
a
25
0 10 20 30 40 50 60 70 80
national lottery spending
(i.e., those receiving higher than average grants are more deprived than average). Again,it appears that that there is a mildly progressive pattern.
300
250
200
150
100
50
0
Gra
nt p
er c
apit
a
IMD Score0 10 20 30 40 50 60 70 80
Figure 3 Heritage Grants/IMD of Local Authority
Turning now to heritage Lottery grants (Figure 3), we witness again the lack of aparticularly strong correlation. The average per capita level of grants across all localauthorities is £73.68. The 133 local authorities that received higher-than-average fundinghad a close to average IMD score (21.29). The distribution of funds is not regressive, but isfairly flat.
Figure 4 Sport Grants/IMD of Local Authority
Turning finally to sports funding, we see that the average per capita grant across localauthorities is £52.39. 131 local authorities received above-average levels of funding; ofthese 131 local authorities, the average IMD was 21.79. Again, particularly deprivedconstituencies did not on average receive significantly higher levels of funding.
26
1. When combining the three merged categories, HEE and charitable expenditure have the lowest grant average,
only slightly higher than charitable expenditure alone.
2. Sport England; Sport Scotland; the Sports Council for Wales; the Sports Council of Northern Ireland; UK Sport;
Arts Council England; Arts Council of Wales; Arts Council of Northern Ireland; Scottish Arts Council; Scottish
Screen; the UK Film Council; the Heritage Lottery Fund; Big Lottery Fund and the Olympic Lottery
Distribution Fund.
3. The last category here is a later category introduced under the National Lottery Act 1999, initially for
distribution by the New Opportunities Fund, but later by the Big Lottery.
4. House of Commons Hansard, col. 332W, 6 December 2004.
5. http://www.biglotteryfund.org.uk.
6. Committee of Public Accounts, Fourth Report, Grants Made by the National Lottery Charities Board, The
Stationery Office HC 490-I (1999-2000), paragraph 14-16.
7. House of Commons Culture, Media and Sport Select Committee, “London 2012 Games: the next lap”, sixth
report Session 2007-08, volume 1, The Stationery Office HC104-I, 2008, paragraph 43.
8. Patrick Feehan and David Forrest, “Distribution of UK National Lottery grants across local authority areas”,
Applied Economics Letters, 14:5 2007, pp. 361-365.
9. Super Output Areas (SOAs) are geographical categorisations introduced in 2004 and replacing electoral wards
as the primary means of the dissemination of small area statistics. SOAs are designed to be consistent in size
thus allowing comparisons to be more meaningfully made. It is also envisaged that the boundaries will not
change, allowing trend based analysis for particular areas (e.g. specific area based initiatives such as
regeneration schemes) to be developed.
10. The Department of Communities, Local Government and the Regions states that “The Indices are used widely
to analyse patterns of deprivation, identify areas that would benefit from special initiatives or programmes and
as a tool to determine eligibility for specific funding streams.”
chapter 2 - references
27
conclusion
Camelot has set itself a target of ensuring that the Lottery remains a mass pursuit so thatrevenues are maintained by many people playing with low stakes, and looks to ensurethat it remains outside the global top ten in terms of spend per capita. Though theoperator is not even remotely at risk on this point, fixed participation or comparativelyslow rates of growth in participation in the main draw-based games will see the operatorfocus increasingly on raising scratchcard revenue.
The GPS surveys based on the FES/EFS and recent polling data do indeed suggest a lackof any significant growth in the draw-based games, with only 46% participating in theprevious week, or 63% in the previous year (down 4% on the National LotteryCommission’s figures reported above). If the operator cannot engage new players then itwill certainly fail to achieve its substantial commitments of £79 billion in sales and £22billion for good causes over the ten-year period from the start of the current ten-yearlicence (February 2009). In any case, we have notedthat, on average, respondents from households onlower incomes are more likely to play and play athigher stakes.
We have noted that the operator seeks to maintainand build revenue by providing players with anincreasing portfolio of games and ways to play. Thesuccess story for Camelot has been scratchcardsand these are producing higher revenues than ever.If scratchcard play includes economicallyvulnerable groups (our survey shows that it does)then any strategy for maintaining long term revenue which emphasizes scratchcard playrisks exacerbating existing regressive effects. Both our review of wider literature and ourown survey suggest that scratchcard play is probably growing (at 32% participatingwithin the last year compared with 20% in the Gambling Prevalence Survey) and that it ismore “regressive” than the draw-based games (i.e., disproportionately focused in lowincome groups). Respondents from households earning between £15,001 and £20,000,well below the national average, are far more likely to play, with 36% of respondentsparticipating once a month or more, compared to an average of 24% across the poll.
Fixed participation orcomparatively slow rates of growth in participationin the main draw-basedgames will see the operatorfocus increasingly onraising scratchcard revenue.
Further, our research shows that average stakes may be growing: 67% of those who spendmoney on scratchcards once a week or more frequently spend between £2 and £5 perweek. The average stake in the base sample (i.e., the 13% of respondents playingscratchcards once a week or more), is £4.99.
Again, the basic objection might be raised that even if play decreases as incomeincreases, stakes increase with income. But players with an income of £5,000 playing at anaverage of £1.90 per week would be spending roughly 2% of their income on the NationalLottery whereas players earning £25,000 and spending £2.90 per week would bespending less than 1% of their annual income, i.e., lower income players are spendingproportionately more on the National Lottery.
Furthermore, National Lottery spending appears notto be well targeted in areas of high deprivation. Evenexcluding local authorities which receive high levelsof grant-making for unique cultural/geographicalreasons, Lottery spending is, at best, only weaklycorrelated to high levels of deprivation. Otheranalyses have found it to be focused on affluent,urban, white, well-educated areas.
The National Lottery has without doubt created anew source of funding for projects that would otherwise have remained un- or under-funded. It has contributed to the cultural and civil life of the nation for over twenty yearsbut, as the new licence comes into operation, we must recognise that this comes at aprice. The good cause funding created by Lottery play is disproportionately drawn fromthe less affluent, yet it is not spent for their benefit.
28
The National Lottery
The good cause funding created by Lotteryplay is disproportionately
drawn from the lessaffluent, yet it is not spent
for their benefit.

29
1. Camelot Social Report, 2005. Available at http://www.camelotgroup.co.uk/socialreport2005/strategy-and-
consultation.htm.
2. Camelot press release, “Camelot Reports £181 Million Increase In National Lottery Half Year Ticket Sales To Over
£2,559m”. Available at http://www.camelotgroup.co.uk/pressreleases/2008/October/2008finalresults.pdf.
conclusion - references

Demographic
GenderAgeRegionEmployment statusEducationSocial class
Household incomeHow much is your annual household income?
£0-5,000£5-10,000£10-15,000£15-20,000£20-25,000£25-35,000£35-45,000£45-55,000£55-65,000£65-75,000Over £75,000
Benefits questionAre you in receipt of any of the following state benefits? Yes / No
• Employment and Support Allowance• Jobseeker’s Allowance • Housing Benefit• Council Tax Benefit• Working families tax credit• Other
30
appendix: survey questions

Lottery PlayWe would like to ask you two questions about National Lottery Scratchcards.
1. How often have you spent money on National Lottery scratch cards (include online scratchcard games, not newspaper or magazine scratchcards) over the last 12 months?
a. Almost every day;b. 2-3 times per week;c. About once per week;d. 2-3 times per month;e. Once every monthf. About once every other month;g. Very rarelyh. Not in the last 12 months
2. How much, on average, have you spent on National Lottery scratchcards perweek (if answered a,b,c)/ month (if answered d,e,f )/ year (if answered g,h)?
a. Nothingb. £1 c. £ 2 -£5 d. £ 6 -£10 e. £10-£20 f. More than £20
We would now like to ask you two questions about National Lottery draw
based games, including Thunderball, Euromillions and Daily Play.
3. How often have you spent money on National Lottery draw based games over the last 12 months?
a. Almost every day;b. 2-3 times per week;c. About once per week;d. 2-3 times per month;e. Once every monthf. About once every other month;g. Very rarelyh. Not in the last 12 months
31
national lottery questions

4. How much, on average, have you spent on National Lottery draw based gamesper week (if answered a,b,c)/ month (if answered d,e,f )/ year (if answered g,h)?
a. Nothingb. £1 c. £ 2 -£5 per week d. £ 6 -£10 per week e. £10-£20 f. More than £20 per week
Perceptions5. Which, if any, of the following would probably convince you to
stop playing the national lottery?
a. If cash prizes were limited to £100,000b. If there wasn’t a special show for the resultsc. If funding was withdrawn from community projects
and given to the Olympic Gamesd. If funding was withdrawn from community projects in my area
and given to projects like Wembley Stadium.e. If funding was withdrawn from good causes in generalf. If funding was withdrawn from cultural institutions like museums
and art galleries
6. To your knowledge, have you, or a close member of your family, personally benefited from a project funded by the National Lottery?
Yes / No / Don’t know
The National Lottery
32

33
Open access. Some rights reserved
Policy Statement
This work is licenced under the Creative Commons
Attribution - Noncommercial - No Derivative Works 2.5 Licence (the ‘Licence’).
To view a copy of this Licence:
• visit http://creativecommons.org/licenses/by-nc-nd/2.5/
• or send a letter to Creative Commons, 543 Howard Street, 5th Floor,
San Francisco, California, 94105, USA.
creativecommons.org
As the publisher of this work, Theos has an open access policy that enables anyone to
access our content electronically without charge.
Please read and consider the terms and conditions set out in the Licence, details of which
can be obtained via the Internet or post at the relevant addresses set out above.
Users are welcome to download, save, perform, or distribute this work electronically or in
any other format, including in foreign language translation, without written permission
subject to the conditions set out in the Licence. The following are some of the conditions
imposed by the Licence:
• Theos and the author(s) are credited;
• Theos’ website address (www.theosthinktank.co.uk) is published together with
a copy of this Policy Statement in a prominent position;
• the text is not altered and is used in full (the use of extracts under existing fair
usage rights is not affected by this condition);
• the work is not resold; and
• a copy of the work or link to use on-line is sent to the address below for
our archive.
TheosLicence Department
34 Buckingham Palace Road
London
SW1W 0RE
United Kingdom
Please contact us if you would like permission to use this work for purposes outside of the scope of the Licence.

34
Attribution-NonCommercial-NoDerivs 2.5
You are free:
• to copy, distribute, display, and perform the work
Under the following conditions:
Attribution. You must attribute the work in the manner specified by the author or licensor.
Noncommercial. You may not use this work for commercial purposes.
No Derivative Works. You may not alter, transform, or build upon this work.
• For any reuse or distribution, you must make clear to others the license terms of this work.
• Any of these conditions can be waived if you get permission from the copyrightholder.
Your fair use and other rights are in no way affected by the above.
C O M M O N S D E E D

The National Lottery:Is it Progressive?
Fifteen years ago, the National Lottery wasestablished with the express purpose ofproviding financial support for projects thatseemed desirable but for which there is noalternative source of funding. These have rangedfrom the redevelopment of the Royal OperaHouse and the building of the Millennium Domeand major sporting venues to local charitableendeavours. To date, the Lottery has providedover £21 billion to such projects.
The significant revenue created by the Lottery,both in the form of ‘good cause’ money and the12% levied in tax, begs the questions, who plays, and who benefits? Are critics right tosuggest that lower income households arefunding projects which, more often than not,benefit the wealthy? In short, is the National Lottery progressive?
Lottery operator Camelot claims that players are spread across social class and otherdemographics. This paper, which reviews existingevidence and reports findings from new Theos -commissioned polling, argues that this is not thecase. The typical player lives in a semi-routine or a lower-supervisory/technical household, will bespending two or three times more than affluentcounterparts proportionate to householdincome and is unlikely to perceive any personalbenefit from Lottery grant-making. The reportgoes on to observe a mildly progressive patternin the distribution of funds, but suggests that theoverall effect of the Lottery is regressive.