the national blood service - national audit office (nao) · national audit act 1983 for...
TRANSCRIPT
The National Blood Service
REPORT BY THE COMPTROLLER AND AUDITOR GENERALHC 6 Session 2000-2001: 20 December 2000

The National Audit Officescrutinises public spending
on behalf of Parliament.
The Comptroller and Auditor General, Sir John Bourn, is an Officer of the
House of Commons. He is the head of theNational Audit Office, which employs some750 staff. He, and the National Audit Office,
are totally independent of Government.He certifies the accounts of all Government
departments and a wide range of other publicsector bodies; and he has statutory authority
to report to Parliament on the economy, efficiency and effectiveness
with which departments and other bodieshave used their resources.
Our work saves the taxpayer millions ofpounds every year. At least £8 for every
£1 spent running the Office.

This report has been prepared under Section 6 of theNational Audit Act 1983 for presentation to the Houseof Commons in accordance with Section 9 of the Act.
John Bourn National Audit OfficeComptroller and Auditor General 12 December 2000
The Comptroller and Auditor General is the head of theNational Audit Office employing some 750 staff. He, andthe National Audit Office, are totally independent ofGovernment. He certifies the accounts of all Governmentdepartments and a wide range of other public sectorbodies; and he has statutory authority to report toParliament on the economy, efficiency and effectivenesswith which departments and other bodies have used theirresources.
For further information about the National Audit Officeplease contact:
National Audit OfficePress Office157-197 Buckingham Palace RoadVictoriaLondonSW1W 9SP
Tel: 020 7798 7400
Email: [email protected] address: www.nao.gov.uk
ContentsExecutive Summary 1
Part 1 6Background
Role of the National Blood Service 6
Organisation, functions, objectives and accountability 6
Collection, processing, safety and distribution of bloodcomponents and products 8
Recent events affecting the National Blood Service 10
Why we examined the National Blood Service 13
The scope of our examination 13
Part 2 14Is the National Blood Service meetinghospitals' demands for blood, medical advice and support?
Conclusions 14
Is the National Blood Service meeting 15demand for blood?
Does the National Blood Service provide 19effective medical support and advice?
Is the National Blood Service investment in scientific 21and medical research well targeted and disseminated?
Is the National Blood Service responsive to its users? 22
Part 3 24How effectively does the National BloodService encourage people to give blood?
Conclusions 24
Part 4 30Are National Blood Service bloodcomponents safe?
Conclusions 30
Deaths caused by unsafe blood 31
Action taken by the National Blood Service 31to secure safety
Medicine Control Agency inspections 32
Accreditation 34
Quality of Blood Components 34
Quality of diagnostic and non-diagnostic services 35
Part 5 36How effectively does the National BloodService manage its efficiency and performance?
Conclusions 36
How efficient is the National Blood Service? 37
Does the National Blood Service make use of internal 39and external benchmarking?
Do the National Blood Service's performance indicators 40provide an adequate basis for managing the business?
Appendices
1 Major forms of blood components supplied by 42the National Blood Service
2 Independent review of proposals for the transfer 43of bulk blood processing and testing fromLiverpool to Manchester
3 "Better Blood Transfusion" 45
4 Chronology of main events referred to 46in this report
5 Study Methodology 47
6 Expert advice 49
7 Performance indicators used by the 50National Blood Service
8 Public attitudes survey methodology 52
9 Ways in which the Blood Service obtains 53independent quality assurance
10 The main components of the 55National Blood Service's Expenditure, 1998-99
11 Methodology used to compare the National Blood 56Service's expenditures for 1995-96 and 1998-99
Glossary 57
Bibliography 59
THE NATIONAL BLOOD SERVICE
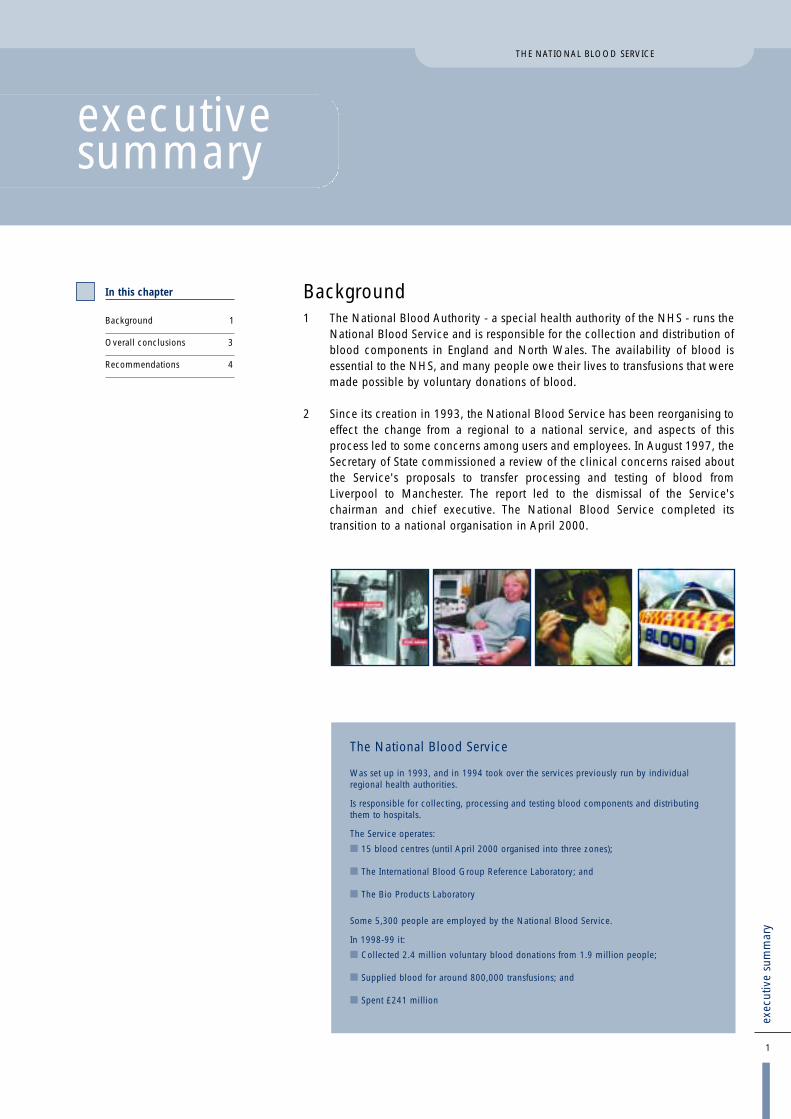
Background1 The National Blood Authority - a special health authority of the NHS - runs the
National Blood Service and is responsible for the collection and distribution ofblood components in England and North Wales. The availability of blood isessential to the NHS, and many people owe their lives to transfusions that weremade possible by voluntary donations of blood.
2 Since its creation in 1993, the National Blood Service has been reorganising toeffect the change from a regional to a national service, and aspects of thisprocess led to some concerns among users and employees. In August 1997, theSecretary of State commissioned a review of the clinical concerns raised aboutthe Service's proposals to transfer processing and testing of blood fromLiverpool to Manchester. The report led to the dismissal of the Service'schairman and chief executive. The National Blood Service completed itstransition to a national organisation in April 2000.
1
exec
utiv
e su
mm
ary
In this chapter
Background 1
Overall conclusions 3
Recommendations 4
THE NATIONAL BLOOD SERVICE
executivesummary
The National Blood Service
Was set up in 1993, and in 1994 took over the services previously run by individualregional health authorities.
Is responsible for collecting, processing and testing blood components and distributingthem to hospitals.
The Service operates:� 15 blood centres (until April 2000 organised into three zones);
� The International Blood Group Reference Laboratory; and
� The Bio Products Laboratory
Some 5,300 people are employed by the National Blood Service.
In 1998-99 it:� Collected 2.4 million voluntary blood donations from 1.9 million people;
� Supplied blood for around 800,000 transfusions; and
� Spent £241 million

THE NATIONAL BLOOD SERVICE
3
exec
utiv
e su
mm
ary
3 The emergence of variant Creutzfeldt-Jakob disease has led the government tomake two changes to the way the Service operates:
� It extended the use of leucodepletion - the removal of white cells - for allblood destined for transfusion, by 31 October 1999, to reduce thetheoretical risk to recipients of donated blood of human to humantransmission of the disease. The Service reports that leucodepletion resultsin a one per cent loss of donations, and costs £60 million a year.
� It required the Bio Products Laboratory, which had used British plasma tomanufacture blood products, to obtain all its plasma from non-UK sources.This has lost the Service income of around £25 million a year that itreceived for supplying plasma to the laboratory. From 1999-2000, theService has recovered that loss through prices for blood componentscharged to hospitals. Ministers have yet to decide on the future role of theBio Products Laboratory.
4 We focused on how well the National Blood Service performed and the actionit was taking to improve its efficiency and effectiveness. We excluded the BioProducts Laboratory from our examination because of the considerationcurrently being given to its future. We obtained most of the evidence for ourfindings by undertaking a census of blood bank heads at NHS hospitals;conducting interviews and examining documents at the National Blood Serviceand the NHS Executive; and commissioning a survey of the public to determineattitudes towards blood donation. Also, in examining safety issues, we placedreliance on the inspection and licensing work of the Medicines Control Agency.
Overall Conclusions5 The National Blood Service has taken a long time to complete the transition to
its national role, although there are clear signs that it is now doing so. Since itsestablishment, it has had to cope with the emergence of variant CreutzfeldtJakob disease.
6 Responses to our census and current data on collection of blood from donorsand delivery to hospitals indicate that the Service is performing as well as, andin many areas better than, it was before its establishment as a national service.There were restrictions in the supply of blood to hospitals in 1998-99, and theService acted promptly to avoid any repetition in 1999-2000. There are alsoeffective measures in place to ensure that blood is safe for transfusion. Userswere broadly satisfied with the service provided and the responsiveness of theorganisation.
7 Information provided by the National Blood Service indicates that, between1995-96 and 1998-99, the Service cut its costs by some 5.4 per cent in realterms. The National Blood Service's current performance indicators have,however, a number of weaknesses that prevent them from forming a completeand appropriate basis for accountability to the NHS Executive, or for thedirection and management of the Service's business. There is scope forimproving or developing performance indicators for overall efficiency and forother areas of its work, such as meeting hospital demand, wastage, safety andpromotion of the optimal use of blood in hospitals.

4
exec
utiv
e su
mm
ary
THE NATIONAL BLOOD SERVICE
Recommendations8 Building on the improvements brought about since the creation of the National
Blood Service, particularly in supply and safety, we identified a number ofareas where the Service could make further changes. Our detailed conclusionsare set out on pages 14, 24, 30 and 36 our recommendations are at paragraphs9 to 14.
On meeting hospitals' demands for blood, medical adviceand support
9 Hospitals need medical support and advice on transfusion matters so that theycan put into practice measures developed to reduce transmission error and useblood more effectively. We recommend that the Service increases further thenumber of hospitals it involves in clinical audits to widen awareness of goodpractice.
10 Because the results of scientific and medical research projects have notroutinely been widely disseminated, there is a risk that hospitals will not beaware of findings that could improve patient care, and that full benefit will notbe derived from those projects. We therefore recommend that the Service usesmore active ways of disseminating information, for example through post-graduate lectures, or by publishing results on its website, to enable the findingsto reach a wider audience.
11 The Service employs a number of mechanisms that aim to secureresponsiveness to users. But users' complaints are not subject to the samecentral monitoring and control as are those from donors. Without suchmanagement, there is a risk that users' complaints may not be given the prioritythey merit and that remedial action may be delayed. To ensure that the NationalBlood Service takes speedy and appropriate action in dealing with users'complaints, we recommend that the Service sets targets for responding to them;and monitors performance against those targets and the action taken to dealwith the cause of the complaints.
On encouraging people to give blood
12 The Service currently collects sufficient blood to meet hospital demand. But,unless it continues to recruit and retain a substantial body of regular donors,there is a risk that collections may decline. Our survey of public attitudes todonation highlighted groups likely to donate and approaches that mightcontinue to attract new donors. But retaining donors is a considerablechallenge. Some factors that put donors off, such as the fear of needles, arelargely outside the Service's control, although it can influence other factors,such as the time it takes to give blood. We recommend that, to keep the numberof donors lapsing to a minimum, the Service (i) addresses further the factors thatinhibit donation, for example by reducing the time it takes to donate blood; and(ii) sets more demanding donor care performance targets, for example for theproportion of donors waiting longer than 30 minutes before registration andscreening.

THE NATIONAL BLOOD SERVICE
5
exec
utiv
e su
mm
ary
On managing efficiency and performance
13 The National Blood Service has improved the efficiency of its operations. Toimprove further, and keep blood prices charged to the NHS to a minimum, theService needs to:
� examine and harmonise best working practices across its operations inorder to ensure that it is able to operate at consistent levels of efficiency
� apply its improved procurement practice to cover all the classes of goodsand services it uses to secure further economies; and
� make fuller use of its unit cost information and of new or improvedapproaches by (i) comparing unit costs across the Service, and investigatingdifferences to identify good practice; and (ii) comparing its performancewith that of other blood suppliers - in the other home countries andelsewhere - and with other organisations engaged in similar collection,testing, or distribution activities in the public and private sector.
14 Unless the Service has relevant performance indicators, it will lack theinformation it needs to identify and deal with aspects of its activities thatrequire attention. The Service's senior management recognise the importanceof good performance indicators, and set up a working group that identifiedindicators relating to donor care. However, other activities and aspects of theService are not at present represented in the performance indicators; and thereis a lack of measures of efficiency that would provide the Board, managers, theNHS Executive and users with the information they need. We recommend thatthe Service undertakes a comprehensive review to establish which performancemeasures (including measures of efficiency) would provide useful indicators ofsuccess or warnings of failure for the purposes of management andaccountability. This should lead to it adopting high level indicators, withtargets, supported by indicators and targets tailored to local needs andcircumstances.
15 The National Blood Service welcomes the broad thrust of theserecommendations, and plans to encompass them in the design andimplementation of the new management structures and systems, which iscurrently taking place.
6
part
one
Role of the National Blood Service 1.1 The availability of blood is essential to the NHS.
Hospitals use blood and blood components to treatpatients, deal with accident victims and enable manyelective procedures, such as hip replacements. Manypeople owe their lives to transfusions that were madepossible by voluntary donations of blood.
1.2 The National Blood Service collects blood from donors,and supplies processed and tested blood componentsand products to NHS hospitals and those in theindependent sector. In 1998-99, 1.9 million people gave 2.4 million donations of blood; and around 800,000 people received blood transfusions.
Organisation, functions, objectivesand accountability
Organisation
1.3 The National Blood Authority - a special healthauthority of the NHS - runs the National Blood Serviceand is responsible for the collection and distribution ofblood components in England and North Wales. TheAuthority was set up in 1993, and in 1994 took overresponsibility for 15 regional blood transfusion centresfrom regional health authorities. It employs some 5,300 people and spent £241 million in 1998-99.
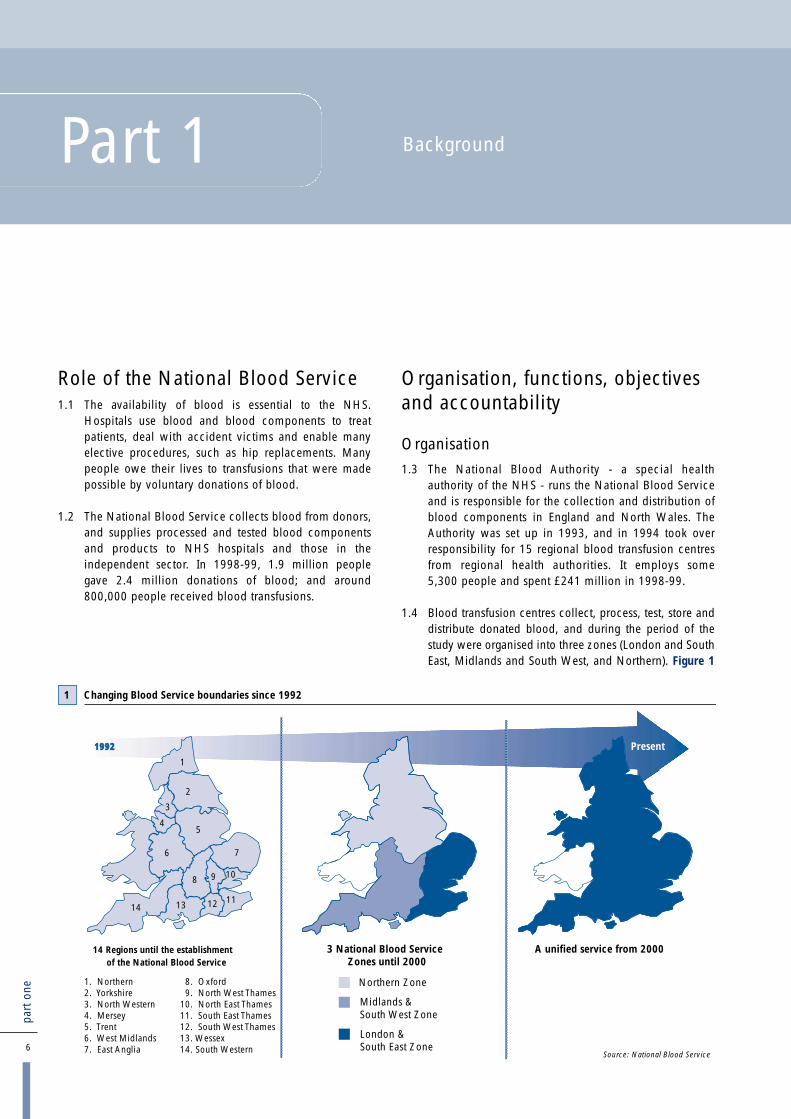
1.4 Blood transfusion centres collect, process, test, store anddistribute donated blood, and during the period of thestudy were organised into three zones (London and SouthEast, Midlands and South West, and Northern). Figure 1
BackgroundPart 1
1992 Present
Source: National Blood Service
Northern Zone
London &South East Zone
Midlands &South West Zone
14 Regions until the establishmentof the National Blood Service
3 National Blood ServiceZones until 2000
A unified service from 2000
1
2
3
5
6
8
7
9 10
11121314
4
Changing Blood Service boundaries since 19921
1. Northern 8. Oxford2. Yorkshire 9. North West Thames3. North Western 10. North East Thames4. Mersey 11. South East Thames5. Trent 12. South West Thames6. West Midlands 13. Wessex7. East Anglia 14. South Western

7
part
one
THE NATIONAL BLOOD SERVICE
shows for England and Wales the organisation up to1993, from 1994 to 1999 and from 2000. The NationalBlood Service also operates the International BloodGroup Reference Laboratory and the Bio ProductsLaboratory, which makes therapeutic blood productsfrom plasma. Figure 2 shows how much the NationalBlood Service spends on each of its divisions (i.e. bloodcentres, International Blood Group Reference Laboratory,the Bio Products Laboratory and its headquarters).
Functions
1.5 The Authority's statutory functions are set out inStatutory Instrument 587 of 1993, as amended by SI 589of 1994. They are:
� The provision of laboratories for the manufacture ofblood products and for other purposes.
� Collecting, screening and processing blood and itsconstituents and supplying blood, plasma and otherblood products for the purposes of the health service.
� The preparation of plasma fractions and other productsfor therapeutic, diagnostic and other purposes.
� Research and development in plasma proteinfractionation and for other purposes.
� The manufacture of blood grouping re-agents andother related re-agents.
� The supply of products prepared or manufacturedabove for the purposes of the health service.
� The promotion, by advertisement or otherwise, ofthe giving of blood or its constituents for thepurposes of the health service, with a view inparticular to maintaining an adequate number ofpersons who are willing to give blood or itsconstituents for those purposes.
Objectives
1.6 The National Blood Service's main objective, as set outin its 1999-2000 operational plan and agreed with theSecretary of State, is:
to collect and process enough blood to meet hospitaldemand and to work with hospitals to ensure theoptimum use of blood.
1.7 The National Blood Authority's other objectives for1999-2000 are set out in Figure 3.
National Blood Authority's Principal Objectives for 1999-2000
� Maintain the core business.
�� Improve the rate of donor retention.
�� Continue progress on achieving the optimum use of blood.
�� Ensure the total availability of leucodepleted blood components by 31 October 1999.
�� Continue the development of nucleic acid testing with a view to the availability of frozen and labile components as soon as possible.
�� Improve good manufacturing standards across the service.
�� Ensure an adequate supply of blood components and services over the millennium period.
�� Improve staff performance and motivation.
�� Strengthen the leadership of the National Blood Service
3

The National Blood Service: Lines of Accountability during the period of the study
National BloodAuthority Board Chairman
HQOrganisation
ChiefExecutive
MedicalDirector
Director ofFinance and
Administration
InternationalBlood Group
Reference Laboratory
Non-ExecutiveDirectors (4)
NHS ExecutiveDeputy
Chief MedicalOfficer
Secretary of Statefor Health
Zones (3)
BloodCentres (15)
Bio ProductsLaboratory
4
Accountability
1.8 The Chairman is accountable to the Secretary of Statefor Health and the Chief Executive is accountable to theBoard of the National Blood Authority and is anaccountable officer to the Chief Executive of the NHS.The National Blood Service collects and supplies bloodin North Wales in accordance with service agreementswith the NHS Trusts in that area.
1.9 Safety standards for blood components, which followEuropean directives, are the responsibility of the Secretaryof State, who is advised by a departmental committee, theAdvisory Committee on the Microbiological Safety ofBlood and Tissues for Transplantation. The MedicinesControl Agency monitors safety standards on his behalfthrough a programme of inspections upon which thelicensing of National Blood Service blood centres is based.
1.10 In 1995, the Department of Health established theNational Blood Service Users Group for a fixed periodending 31 March 1998. The purpose was to enablerepresentatives of healthcare professionals who werereliant on the National Blood Service to monitor itsperformance. In particular, they were to focus on thecommitments the National Blood Authority had given onmaintaining or improving delivery times and providingthe specialist services required by hospitals. The Secretaryof State for Health required the Group to report to himannually and to bring to the Authority's attention anyproblems that could not be resolved at a local level.
1.11 Figure 4 sets out the lines of accountability within, andsurrounding, the National Blood Service.
Collection, processing, safety anddistribution of blood componentsand products
Collection
1.12 Collecting blood involves recruiting and retaining blooddonors; inviting them to donor sessions; providingmobile and permanently-based teams of staff to conductdonor sessions; and transporting donated blood to theblood centre. Figure 5 sets out the stages blood passesthrough from collection from donors to delivery tohospitals.
Processing
1.13 Blood processing breaks blood down into its constituentparts - red cells, platelets and plasma. Additionalprocessing results in some 20 major forms ofcomponent (Appendix 1). Figure 6 describes the threemain constituents of blood and their medical uses.Processing blood involves some losses.
8
part
one
THE NATIONAL BLOOD SERVICE

The main Blood Service processes
THE NATIONAL BLOOD SERVICE
9
part
one
The three main constituents of blood and their medical uses6
PLASMA
Description: The fluid in which blood cells are suspended. It acts as acarrier for the blood cells and contains factors such as immunoglobin(antibodies), albumin and clotting factors.
Direct uses in patient care: coagulation and treatment of severe burns
Platelets (contained in buffy coat)
Description: small discs of tissue that enable coagulation and thecontraction of clots.
Direct uses in patient care: blood diseases e.g., leukaemia, to assist inclotting
Red cells
Description: the most numerous type of blood cell, containing the redpigment haemoglobin that facilitates the transport of oxygen necessaryfor respiration
Direct uses in patient care: anaemia, surgical and traumatic bloodloss (open heart surgery, liver transplant, heart bypass)
5
Recruitmentand retention of donors
Collection of bloodfrom donors
Processing andtesting of donations
Distribution ofsupplies to hospitals
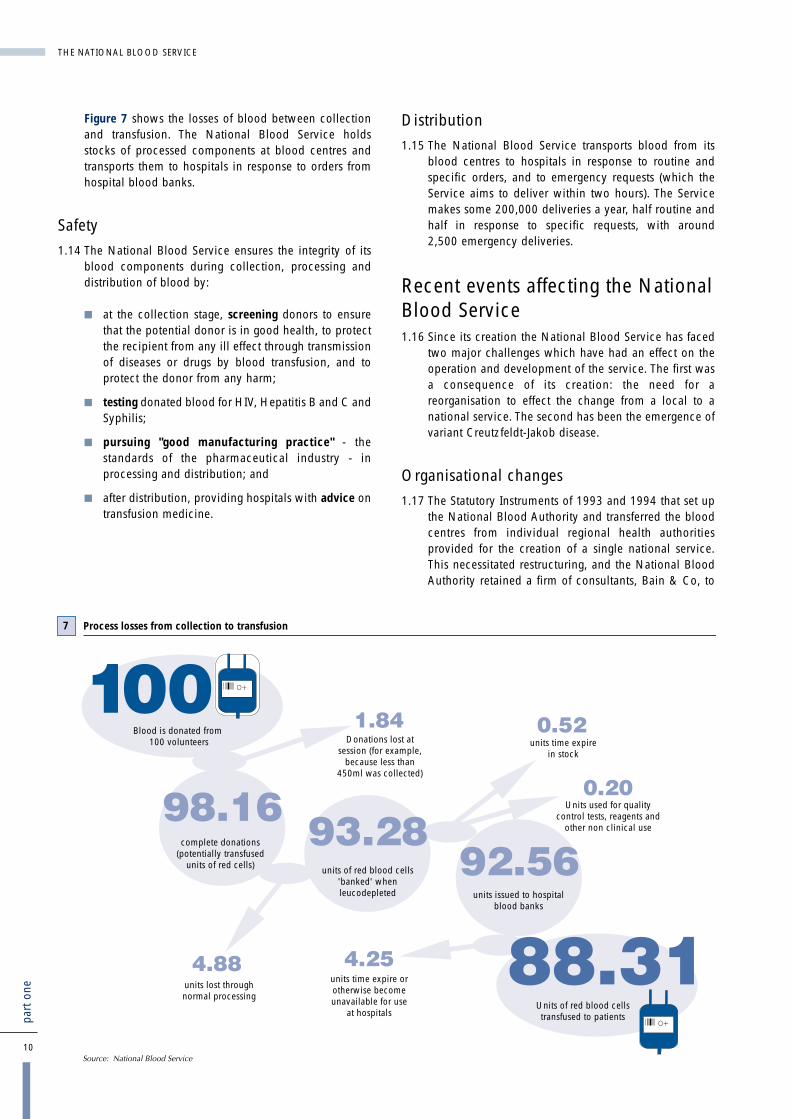
Figure 7 shows the losses of blood between collectionand transfusion. The National Blood Service holdsstocks of processed components at blood centres andtransports them to hospitals in response to orders fromhospital blood banks.
Safety
1.14 The National Blood Service ensures the integrity of itsblood components during collection, processing anddistribution of blood by:
� at the collection stage, screening donors to ensurethat the potential donor is in good health, to protectthe recipient from any ill effect through transmissionof diseases or drugs by blood transfusion, and toprotect the donor from any harm;
� testing donated blood for HIV, Hepatitis B and C andSyphilis;
� pursuing "good manufacturing practice" - thestandards of the pharmaceutical industry - inprocessing and distribution; and
� after distribution, providing hospitals with advice ontransfusion medicine.
Distribution
1.15 The National Blood Service transports blood from itsblood centres to hospitals in response to routine andspecific orders, and to emergency requests (which theService aims to deliver within two hours). The Servicemakes some 200,000 deliveries a year, half routine andhalf in response to specific requests, with around2,500 emergency deliveries.
Recent events affecting the NationalBlood Service1.16 Since its creation the National Blood Service has faced
two major challenges which have had an effect on theoperation and development of the service. The first wasa consequence of its creation: the need for areorganisation to effect the change from a local to anational service. The second has been the emergence ofvariant Creutzfeldt-Jakob disease.
Organisational changes
1.17 The Statutory Instruments of 1993 and 1994 that set upthe National Blood Authority and transferred the bloodcentres from individual regional health authoritiesprovided for the creation of a single national service.This necessitated restructuring, and the National BloodAuthority retained a firm of consultants, Bain & Co, to
10
part
one
THE NATIONAL BLOOD SERVICE
O+
O+
Process losses from collection to transfusion7
Blood is donated from 100 volunteers Donations lost at
session (for example, because less than
450ml was collected)
units time expire in stock
Units used for quality control tests, reagents and
other non clinical use
Units of red blood cells transfused to patients
units issued to hospital blood banks
units time expire or otherwise become unavailable for use
at hospitals
units of red blood cells 'banked' when leucodepleted
complete donations (potentially transfused
units of red cells)
units lost through normal processing
advise it on how to proceed. Bain & Co recommendedstructural changes and identified opportunities forperformance improvements. However, the way inwhich the Service implemented certain changes, inparticular the scaling down of the Liverpool BloodCentre, led to considerable concerns among users andemployees. Consequently, in August 1997, the Secretaryof State appointed Professor John Cash to review theclinical concerns raised about the Service's proposals totransfer bulk processing and testing of blood fromLiverpool to Manchester. Professor Cash's keyconclusions and recommendations are summarised atAppendix 2. Following publication of the report inMarch 1998, the Secretary of State dismissed theNational Blood Authority's chairman. Subsequently, aspecial committee of the National Blood Authoritydecided to dismiss the chief executive. The chairmanreceived no compensation for loss of office. The chiefexecutive received six months pay (to which he wascontractually entitled) and an out of court settlement forbreach of contract by the National Blood Authority. Inaddition, the Authority made a lump sum payment onhis behalf to the NHS Pensions Agency.
1.18 The National Blood Service completed its transition to anational organisation in April 2000.
1.19 Following agreement with the NHS Executive, theNational Blood Service introduced national pricing anda national service agreement with effect from April 1999. Up to that time, prices varied, and werenegotiated locally by blood centres and the hospitalsthey supplied; and each Trust had its own locallynegotiated contract with its local blood centre.
Variant Creutzfeldt-Jakob Disease
1.20 In July 1998, the government announced that it wouldextend the use of leucodepletion - the removal of whitecells to reduce the risk of infection from variantCreutzfeldt-Jakob Disease - for all blood destined fortransfusion. This was to reduce the theoretical risk torecipients of donated blood of human to humantransmission of variant Creutzfeldt-Jakob Disease. Theannouncement followed a recommendation from theSpongiform Encephalopathy Advisory Committee thatleucodepletion should be undertaken on aprecautionary basis. Leucodepletion brings otherbenefits; for example, it significantly reduces theincidence of febrile transfusion reaction and reduces therisk of cytomegalo virus infection in susceptible patientssuch as new-born babies and some cancer andleukaemia patients. Leucodepletion is mandatory insome, though not most, other European countries,including France and Austria.
1.21 The National Blood Service reports that leucodepletionresults in a one per cent loss of donations, and costs£60 million a year.
THE NATIONAL BLOOD SERVICE
11
part
one
1.22 As part of the precautions against any risk oftransmission of variant Creutzfeldt-Jakob disease, thegovernment also accepted in February 1998 the adviceof the Committee on Safety of Medicines that plasma forthe manufacture of blood products should be obtainedfrom non-UK sources. This was because the theoreticalrisk that variant Creutzfeldt-Jakob disease could betransmitted could not be discounted; and there was notest that could be applied to donors to detect thepresence of the infective agent.
1.23 This change also had financial implications for theService. Up to then, the Bio Products Laboratory hadused British plasma to manufacture products, such asthe factor VIII used for the treatment of haemophiliacs.But the Bio Products Laboratory now imports plasmafrom the USA, and the Service has therefore lost theincome of £23 million (1998-99) that it would havereceived from supplying the laboratory. To smooth thedisruptive effect on the NHS of this change, the NHSExecutive made good that loss by increasing theAuthority's cash limit in 1998-99. In 1999-2000 the costwas recovered from hospitals using blood in accordancewith normal arrangements, that is within the prices forcellular components (red cells and platelets). The totalextra cost to the Bio Products Laboratory was about£5 million in 1999-2000. Following this major change,the Treasury, the Scottish Office and the Department ofHealth set up a joint review of UK blood productmanufacturing in autumn 1998 to consider its future.Its preliminary results were put to ministers in July 1999,and a further submission was made in February 2000with recommendations for the next stage of the review.The aim is to complete the review by March 2001.
Hospitals' use of blood
1.24 There are considerable variations in the way hospitalsuse and manage blood stocks. The National BloodService and the Department of Health consider that theadoption of best practice has the potential to reducesignificantly the overall demand for blood components.The NHS cannot yet estimate the scale of that reduction.But the National Blood Service's national blood stocksgood practice report, due to be published in April 2001,will enable estimation of some elements.
1.25 The Chief Medical Officer has launched an initiative -"Better Blood Transfusion" - aimed at improving the wayhospitals use blood. This sets out, among other matters,the need for, and role of, hospital transfusioncommittees. In December 1998, he set out the actionhospitals should take, and the NHS Executive intend toaudit progress in 2000-01 (Appendix 3). The NationalBlood Stocks Project, which began in January 1998, is afurther initiative concerned with hospitals' use of blood.The project was set up by the National Blood Serviceand involves its working alongside 22 hospitals. It aimsto improve the management of blood stocks throughgreater collaboration between the Blood Service andhospitals. The National Blood Service considers theproject has been successful in underlining the value andimportance of collaboration. A further 24 hospitals haveasked to participate in the next phase of the project.
12
part
one
THE NATIONAL BLOOD SERVICE

Why we examined the NationalBlood Service1.26 We examined the performance of the National Blood
Service because:
� the availability of blood is essential to patients;
� since the creation of the National Blood Authority in1993, the National Blood Service has beenundergoing major structural changes that attractedsome criticism; and
� there had been shortages of blood during 1998.
The scope of our examination1.27 We examined:
� the performance of the National Blood Service inmeeting hospitals' demands of the service (Part 2);
� the National Blood Service's effectiveness inencouraging people to give blood (Part 3);
� the mechanisms for securing the safety of theService's blood components (Part 4); and
� the measures the National Blood Service was takingto improve its efficiency and monitor itsperformance (Part 5).
1.28 We excluded the use of blood by hospitals from thescope of our examination. Efficient use of so scarce aresource is a crucial element in keeping supply anddemand in balance, but we sought to avoid anyduplication with the Chief Medical Officer's continuingwork in the area. We also excluded the Bio ProductsLaboratory, because of the joint review that was beingundertaken at the same time by the Treasury, TheScottish Office and the Department of Health.
1.29 Our report is based on evidence collected in 1999through:
� a census of blood bank heads at NHS hospitals;
� a survey of the public to determine attitudes towardsblood donation;
� interviews and examination of documentation at theNHS Executive, the National Blood Serviceheadquarters and at its zones and blood centres;
� a review of existing donor research;
� an examination and comparison of unit costs, withinthe National Blood Service;
� reliance on the work of the Medicines ControlAgency.
1.30 A chronology of the main events referred to in thisreport is at Appendix 4 and details of our methodologyare at Appendix 5.
1.31 We benefited from the comments of a panel of experts,whom we thank for their important contribution. Thepanel members are listed at Appendix 6.
THE NATIONAL BLOOD SERVICE
13
part
one
14
part
one
� In 1998-99, the National Blood Service experiencedsome difficulty in achieving its core target ofmeeting, in full, hospitals' demand for bloodcomponents. But it delivered sufficient to avoidmajor problems. It took steps to ensure that it couldmeet foreseeable demand; and in 1999-2000 it met99.76 (effectively 100) per cent of hospital demand.
� Blood bank heads were satisfied with the range ofcomponents and services; and arrangements are inplace to ensure that requests for additional serviceswill be met where users make a good case for them.
� Many blood bank heads told us that their hospitalswere affected by occasional distribution failures in1998. However, the total number of such failureswas a low proportion (less than 0.5 per cent) of alldeliveries made. The timeliness of routine andemergency deliveries was generally good, althoughnot always convenient.
� The National Blood Service has in placearrangements for securing delivery of blood to thesites where it is required. It can and does moveblood strategically to iron out surpluses andshortfalls as part of a national stock managementprocess. And it has recently drawn up a nationalcontingency plan based on identified threats thatcould lead to local interruptions to supply. It has alsoprepared and tested local plans for coping withmajor incidents requiring blood components.
� It is clearly important that the National Blood Serviceminimises wastage and losses of blood prior to issueto hospitals, through whatever cause. It has beensuccessful in containing losses through componentsgoing out of date, although there is a continuing, andunavoidable, tension between maintaining sufficientstocks and minimising wastage. In 1998-99 theService did not achieve its targets for minimisingother losses, mainly because of additional processlosses associated with the introduction of large-scaleleucodepletion. That impact continued into 1999-2000, although performance in the year was betterthan the revised target.
� There is increasing focus on the use of blood inhospitals. This use is outside the direct control of theNational Blood Service; and, for that reason,providing medical support and advice to hospitals isan important role for the Service. National BloodService consultants' expertise and contributions haveearned considerable respect from hospitals; and theirperformance ratings have improved slightly since1994. Further scope for the development of their roleremains, particularly involvement in clinical auditand ensuring visibility during visits to hospitals.
� There are a number of indicators measuringperformance of aspects of the National BloodService's medical support for hospitals. But none ofthem measures the Service's contribution to securingthe optimal use of blood, a responsibility it shareswith the wider NHS. We consider that a higher levelmeasure should also be developed for the sharedresponsibility. This task could form part of the agendafor the new National Transfusion User Group.
� Procedures are in place to ensure that all newscientific and medical research is properlyconsidered before being funded, although someolder less relevant projects were still being fundedduring the course of our study. The Service couldimprove the way it disseminates the results of itsscientific and medical research.
� There are mechanisms - the national serviceagreement, the National Commissioning Group forBlood, the National Blood Service Users Group andthe complaints procedure - set up to secure theNational Blood Service's responsiveness to therequirements and concerns of its users. The future ofan important element of those mechanisms - theNational Blood Service Users Group - has beenunder review. The Department of Health decided inApril 2000 to set up a successor body, which wouldfunction from April 2001. The National BloodService does not monitor the content and handlingof users' complaints as closely as it does those fromdonors.
Is the National Blood Servicemeeting hospitals' demands forblood, medical advice and support?Part 2
Conclusions

15
part
two
THE NATIONAL BLOOD SERVICE
2.1 This part of our report examines how well the NationalBlood Service performs in terms of:
� meeting demand for blood;
� providing effective medical support and advice;
� targeting medical and scientific research; and
� responding to users.
2.2 A key part of our methodology (Appendix 5) was acensus of consultant haematologists or senior medicallaboratory officers in charge of hospital blood banks.This repeated a survey by Bain & Co in 1994 (paragraph1.17), whom the National Blood Service retained toadvise it on structural changes and performanceimprovements. Our 1999 census of the same grouptherefore indicated both current performance and howperformance had changed since 1994.
2.3 The National Blood Service uses 28 performanceindicators for measuring achievement against targets; 11of them relate to this part of the report. A detailed list isat Appendix 7. The National Blood Service set up theindicators in April 1996 in consultation and agreementwith the NHS Executive. It intended them to be used ashigh level performance measures for the purposes ofaccountability. Within each section of this part of thereport we highlight the indicators and performanceagainst the associated targets.
Is the National Blood Servicemeeting demand for blood?
The Service's current ability to supply bloodcomponents to hospitals
2.4 The National Blood Service estimates its requirementsfor donated blood as part of its annual business planningprocess, and in consultation with hospitals. Itdetermines how much each of its three zones shouldcollect; and the zones in turn prepare programmes ofblood collection sessions that will deliver the estimatedquantities of blood.
2.5 The Service has a high level target for supply: it aims tomeet 99.51 per cent, rather than 100 per cent, ofhospital demand for blood and blood components. In1998-99, it fell short of that target, and reported meeting93.74 per cent of demand. The Service and the NHSExecutive agreed on a target below 100 per centbecause the indicator records all instances where theService does not fulfil hospitals' orders in their entirety,for whatever reason. The National Blood Serviceprovides hospitals with clinical advice as well as bloodcomponents, and may advise that there is a preferableclinical alternative to the component ordered. Wherehospitals agree to such a substitution, the indicator willrecord the fact that the Service did not fulfil the originalorder.
2.6 At its accountability review with the NHS Executive inApril 1999, the Service accepted that the 1998-99indicator reflected the broad picture of supply, whichhad been restricted for a limited part of the year. But itcontended that the actual shortfall was less thanreported, because of the element of double countingthat arose when the Service negotiated hospitals' ordersdown, and hospitals increased subsequent orders tomake up for the shortfall. Case Study 1 demonstrates theimpact postponement of deliveries has on theperformance indicator. The National Blood Service isseeking a better indicator of its ability to meet hospital
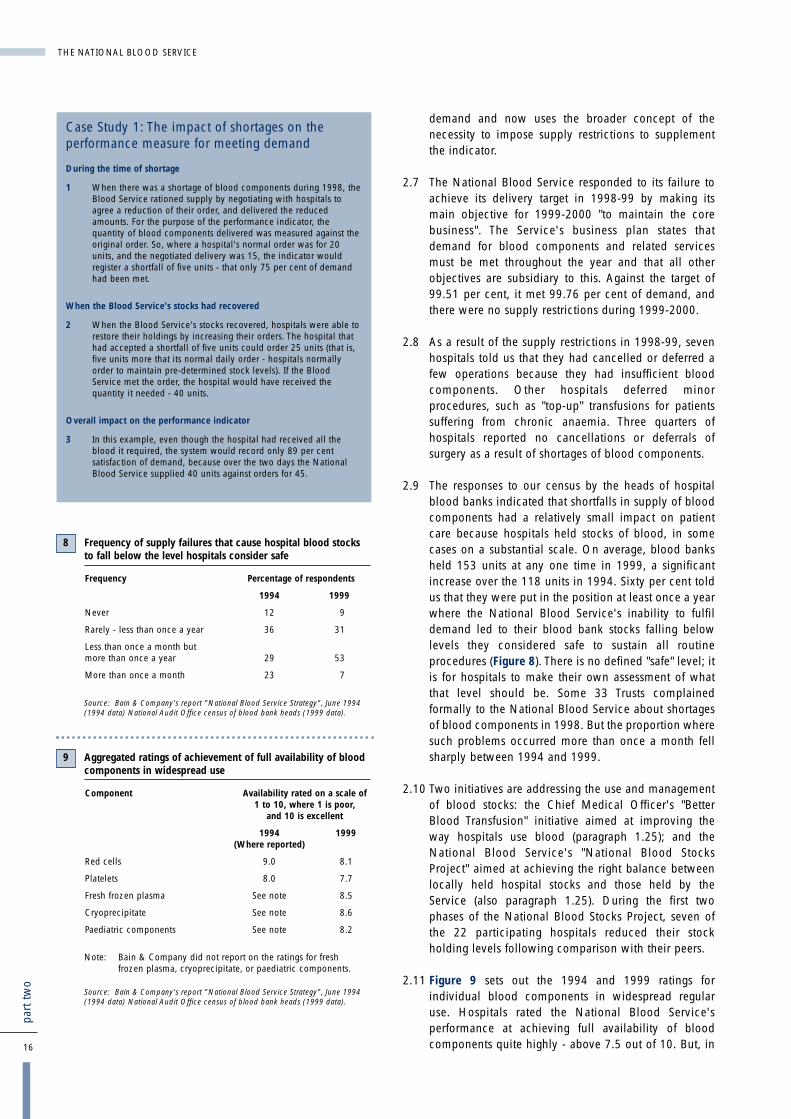
demand and now uses the broader concept of thenecessity to impose supply restrictions to supplementthe indicator.
2.7 The National Blood Service responded to its failure toachieve its delivery target in 1998-99 by making itsmain objective for 1999-2000 "to maintain the corebusiness". The Service's business plan states thatdemand for blood components and related servicesmust be met throughout the year and that all otherobjectives are subsidiary to this. Against the target of99.51 per cent, it met 99.76 per cent of demand, andthere were no supply restrictions during 1999-2000.
2.8 As a result of the supply restrictions in 1998-99, sevenhospitals told us that they had cancelled or deferred afew operations because they had insufficient bloodcomponents. Other hospitals deferred minorprocedures, such as "top-up" transfusions for patientssuffering from chronic anaemia. Three quarters ofhospitals reported no cancellations or deferrals ofsurgery as a result of shortages of blood components.
2.9 The responses to our census by the heads of hospitalblood banks indicated that shortfalls in supply of bloodcomponents had a relatively small impact on patientcare because hospitals held stocks of blood, in somecases on a substantial scale. On average, blood banksheld 153 units at any one time in 1999, a significantincrease over the 118 units in 1994. Sixty per cent toldus that they were put in the position at least once a yearwhere the National Blood Service's inability to fulfildemand led to their blood bank stocks falling belowlevels they considered safe to sustain all routineprocedures (Figure 8). There is no defined "safe" level; itis for hospitals to make their own assessment of whatthat level should be. Some 33 Trusts complainedformally to the National Blood Service about shortagesof blood components in 1998. But the proportion wheresuch problems occurred more than once a month fellsharply between 1994 and 1999.
2.10 Two initiatives are addressing the use and managementof blood stocks: the Chief Medical Officer's "BetterBlood Transfusion" initiative aimed at improving theway hospitals use blood (paragraph 1.25); and theNational Blood Service's "National Blood StocksProject" aimed at achieving the right balance betweenlocally held hospital stocks and those held by theService (also paragraph 1.25). During the first twophases of the National Blood Stocks Project, seven ofthe 22 participating hospitals reduced their stockholding levels following comparison with their peers.
2.11 Figure 9 sets out the 1994 and 1999 ratings forindividual blood components in widespread regularuse. Hospitals rated the National Blood Service'sperformance at achieving full availability of bloodcomponents quite highly - above 7.5 out of 10. But, in16
part
two
THE NATIONAL BLOOD SERVICE
Case Study 1: The impact of shortages on theperformance measure for meeting demand
During the time of shortage
1 When there was a shortage of blood components during 1998, theBlood Service rationed supply by negotiating with hospitals toagree a reduction of their order, and delivered the reducedamounts. For the purpose of the performance indicator, thequantity of blood components delivered was measured against theoriginal order. So, where a hospital's normal order was for 20units, and the negotiated delivery was 15, the indicator wouldregister a shortfall of five units - that only 75 per cent of demandhad been met.
When the Blood Service's stocks had recovered
2 When the Blood Service's stocks recovered, hospitals were able torestore their holdings by increasing their orders. The hospital thathad accepted a shortfall of five units could order 25 units (that is,five units more that its normal daily order - hospitals normallyorder to maintain pre-determined stock levels). If the BloodService met the order, the hospital would have received thequantity it needed - 40 units.
Overall impact on the performance indicator
3 In this example, even though the hospital had received all theblood it required, the system would record only 89 per centsatisfaction of demand, because over the two days the NationalBlood Service supplied 40 units against orders for 45.
Frequency of supply failures that cause hospital blood stocksto fall below the level hospitals consider safe
Frequency Percentage of respondents
1994 1999
Never 12 9
Rarely - less than once a year 36 31
Less than once a month but more than once a year 29 53
More than once a month 23 7
Source: Bain & Company's report "National Blood Service Strategy", June 1994(1994 data) National Audit Office census of blood bank heads (1999 data).
8
Aggregated ratings of achievement of full availability of bloodcomponents in widespread use
Component Availability rated on a scale of1 to 10, where 1 is poor,
and 10 is excellent
1994 1999(Where reported)
Red cells 9.0 8.1
Platelets 8.0 7.7
Fresh frozen plasma See note 8.5
Cryoprecipitate See note 8.6
Paediatric components See note 8.2
Note: Bain & Company did not report on the ratings for freshfrozen plasma, cryoprecipitate, or paediatric components.
Source: Bain & Company's report "National Blood Service Strategy", June 1994(1994 data) National Audit Office census of blood bank heads (1999 data).
9

two areas where comparisons can be made with theoutcome of the survey undertaken by Bain & Co in1994, levels of satisfaction had fallen.
Range of blood components and services
2.12 In our census, most blood bank heads were satisfiedwith the range of blood components provided by theService. On a scale of 1 to 10, they rated the range ofcomponents at 8.8 compared with Bain & Company's1994 survey rating of 8.6. Twenty eight per cent did,however, suggest further components that would beuseful. For example 10 per cent saw a need for virallyinactivated fresh frozen plasma. Hospitals can requestcomponents outside the normal range; the Service hasprocedures for considering such requests, though theyare not uniform throughout the country. Where theService supplies additional components, it charges tocover its costs. Sixty eight per cent of blood bank headssaid they had discussed their component needs with theService. This may, however, under represent the numberwho have been involved in such discussions, sincemany of the 68 per cent reported having been involvedin discussions on component needs at technical andadvisory groups, and at other groups where most, if notall, users routinely meet National Blood Service staff.Of those who said they had had such discussions,89 per cent had either reached agreement, or were stillin discussion.
2.13 The Service also provides diagnostic services tohospitals, such as identifying rare blood groups anddiagnosing blood diseases of unborn children; and non-diagnostic services, such as enabling autologouspredeposit of blood and tissue and bone banking. Inresponse to our census, blood bank heads rated thesediagnostic and non-diagnostic services fairly highly witha score of 8.3 out of 10 (very similar to the 8.26 in the1994 Bain survey). Only six blood bank heads said theyneeded additional diagnostic services, with two citingantibody screening for bone marrow donors.
Seven Trusts said they needed autologous predeposit,but that it was not available to them, and four othersindicated that they wanted other non-diagnosticservices. We found evidence of only one complaint in1998 from Trusts about the range of products orcomponents available.
The Service's ability to maintain supply ofblood in the medium to long term
2.14 Over the last three years, trends in the relationshipbetween supply of and demand for blood suggest thatseasonal tendencies to collect more blood at certaintimes of the year and less at others are becoming moremarked. Also the emerging long-term trend showeddemand growing more quickly than collection, madeworse by the predicted additional two per cent processloss arising from leucodepletion (now reassessed at oneper cent). Had those trends continued, they could haveled to serious shortages in blood from summer 2000.The National Blood Service recognised and took actionto avoid this by increasing their collection of O negativeblood, both absolutely and as a proportion of all bloodcollected, and by working to influence hospitals' use ofO negative blood (Case Study 2).
Accuracy of order filling
2.15 The National Blood Service makes some 200,000deliveries of blood a year, half routine and half inresponse to specific requests. The number of incidentsreported in our census indicates that, in 1998, theService fulfilled accurately all but a very smallproportion (less than half of one per cent) of hospitalorders. But those failures affected almost half of all Trustsserved. In 1998, distribution and administrativearrangements were the third most common subject ofcomplaint, with hospitals making a total of620 complaints to the Service. These complaintscovered incorrect component, incorrect expiry date,incorrect labelling and supply of expired, or nearly
THE NATIONAL BLOOD SERVICE
17
part
two
As part of its 1999-2000 business planning cycle, the National BloodService examined supply and demand trends and concluded that,without corrective action, it would be likely to have to restrict thesupply of O negative blood at some time in that year.
The Problem
The main problem was that hospitals used a higher proportion ofO negative (up to 12 per cent) than existed in the donor population orthe population at large (10 per cent). It is used disproportionatelybecause O negative blood is suitable for transfusion to recipients ofany blood group. Hospitals may therefore request and use O negativecomponents for patients with less common blood groups. By doing so,they can avoid the need to maintain stocks of, and estimate demandfor, components from those groups.
Action Taken
The National Blood Service has approached this problem in two ways:it has tried to increase its O negative stocks by targeting O negativedonors, including lapsed ones, when requesting donations. And it hastried to influence demand by opening discussions with those hospitalsthat used the most disproportionate amounts of O negative blood. Inaddition, the National Blood Stocks project has worked to see to whatextent it can influence hospitals' management of blood stocks. TheBlood Service has found that the combined impact of these activitieshas been to achieve the necessary increase in O negative collectionsand stock levels without a corresponding increase in stocks of groupsfor which there is less demand. They were thus able to meet demandand build stocks during 1999-2000 while collecting fewer donationsof blood than they had originally planned.
Case Study 2: Action taken by the National Blood Service to avoid shortages of blood

expired, component. In our census, 106 blood bankheads reported instances of orders not being metsatisfactorily, of whom:
� twenty reported components, particularly platelets,being delivered with "use by dates" that - althoughcurrent - were older than they had specified.Platelets have a shelf life of only five days, anddemand is sporadic, making it difficult to ensure thatstock is always on hand to meet orders. Red bloodcells have a shelf life of 35 days, but the Servicefinds hospital blood banks unwilling to takecomponents that are close to their "use by date"; and
� twenty reported the Service supplying red cells thatwere not compatible with the blood groups ordered.
Timeliness of deliveries
2.16 Although most deliveries of blood are used initially toreplenish hospital stocks, late deliveries can createdifficulties for hospitals and may cause treatment to bedelayed. In our census, 82 per cent of blood bank headsrated timeliness of deliveries as good, although18 per cent said that delivery times did not alwaysmatch the requirements of clinical practice. Almostthree-quarters of hospitals had discussed delivery timeswith the Service, and two thirds had reached satisfactoryagreement. A few hospitals did, however, complain tothe Service about the late delivery of components. In1998, the London and South East Zone received107 complaints, the Midlands & South West Zone 21;and the Northern Zone 15 (14 of which concerned onecentre). One aim of the recent managementrestructuring was to provide a clearer focus on customerservice. The Service expects this to lead to furtherimprovements in the timeliness of deliveries.
2.17 The Service aims to make all emergency deliverieswithin two hours of the request, and achievementagainst that target is one of the service's high levelperformance indicators. In 1998-99, it achieved thattarget in 99.82 per cent of cases, and in 1999-200099.81 per cent. The total number of emergencydeliveries increased from 2,251 in 1998-99 to 2,573 in1999-2000; and the number falling outside the two hourlimit increased from four to five. In their responses toour census, blood bank heads reported that emergency
deliveries took an average of 53 minutes from request todelivery. The average satisfaction score for the Service'shandling of emergency requests was 8.4 out of 10, animprovement over the 8.0 recorded in 1994.
Strategic control of blood stocks
2.18 As reported at paragraph 2.15, blood components havea limited shelf life. The Service must, therefore, managestocks carefully to avoid wastage. It has a high leveltarget for wastage: no more than 0.76 per cent. In 1998-99, it performed better than target, keeping wastagedown to 0.36 per cent. However, increased donations inearly 1999 led to an increase in blood stocks, which wasmaintained throughout 1999-2000. The Serviceexpected this planned increase in stock levels to lead tohigher levels of wastage. It therefore retained its target ofno more than 0.76 per cent. In the event, it strengthenedits stock management procedures, for example bymonitoring the age profile of stocks and rotating them;and reported that it kept losses through time expirydown to 0.56 per cent in 1999-2000.
2.19 The Service also has high level targets for wastage orloss from all causes (Figure 10). Those targets are cast interms of the percentage of donations that result incompleted donations, additions to stocks of blood atblood centres and issues to hospitals. In the case of thetwo targets relating to events after collection,performance in 1998-99 fell short of the target, mainlybecause of additional process losses associated with theintroduction of large-scale leucodepletion. That impactcontinued into 1999-2000, although performance inthat year was better than revised target.
2.20 The National Blood Service takes a strategic approach tohandling stocks of blood components. In some parts ofthe country, the supply of blood exceeds demand, andin others demand exceeds supply. Since its inception,the National Blood Service has operated on theprinciple that there is no inherent reason why demandand supply should be balanced locality by locality. Itconsiders that there are economic and social reasons fornot doing so - people give blood as a resource for thebenefit of fellow citizens wherever it might be needed,not just locally. It therefore treats blood as a nationalresource. The National Blood Service collects and banks
18
part
two
THE NATIONAL BLOOD SERVICE
Reported performance against wastage and loss targets
Measure 1998-99 1999-2000
Target per cent Reported Performance Target per cent Reported Performance
Donations resulting in completed donations 98.02 98.00 98.00 98.16
Donations resulting in blood being added to National Blood Service stocks 94.94 93.74 93.00 95.03
Donations resulting in blood being issued to hospitals 94.34 92.32 91.00 93.25
Source: National Blood Service
10
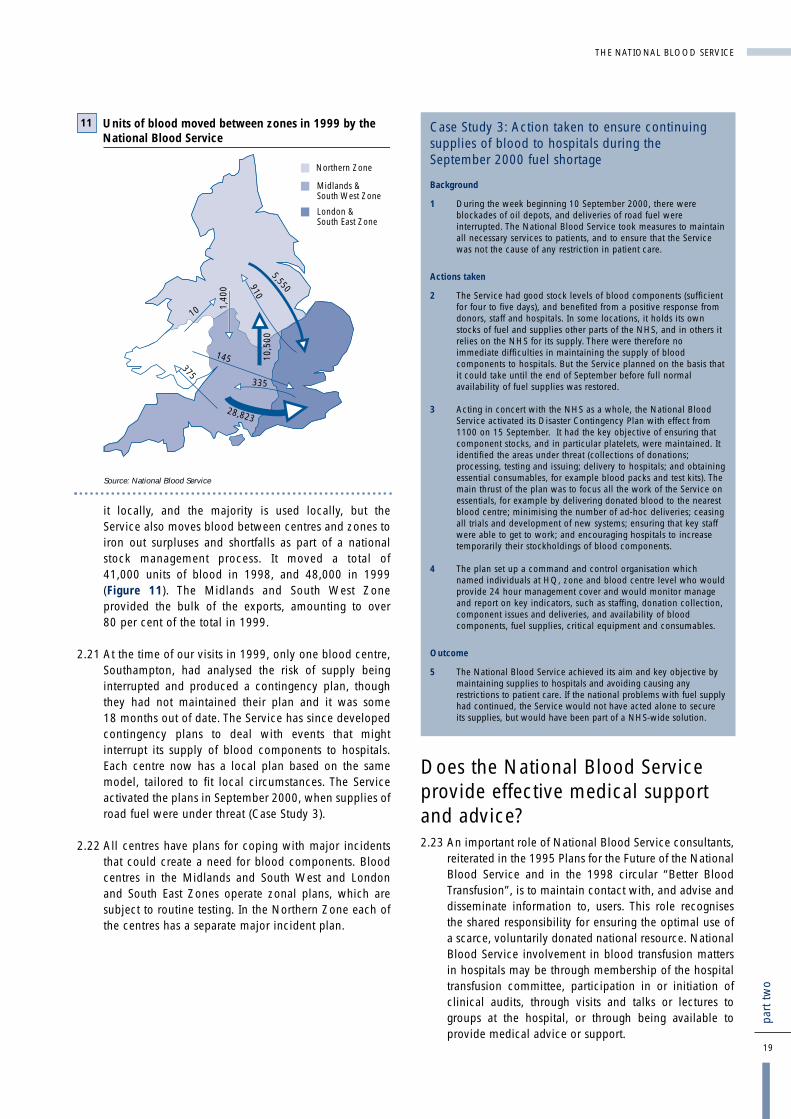
it locally, and the majority is used locally, but theService also moves blood between centres and zones toiron out surpluses and shortfalls as part of a nationalstock management process. It moved a total of41,000 units of blood in 1998, and 48,000 in 1999(Figure 11). The Midlands and South West Zoneprovided the bulk of the exports, amounting to over80 per cent of the total in 1999.
2.21 At the time of our visits in 1999, only one blood centre,Southampton, had analysed the risk of supply beinginterrupted and produced a contingency plan, thoughthey had not maintained their plan and it was some18 months out of date. The Service has since developedcontingency plans to deal with events that mightinterrupt its supply of blood components to hospitals.Each centre now has a local plan based on the samemodel, tailored to fit local circumstances. The Serviceactivated the plans in September 2000, when supplies ofroad fuel were under threat (Case Study 3).
2.22 All centres have plans for coping with major incidentsthat could create a need for blood components. Bloodcentres in the Midlands and South West and Londonand South East Zones operate zonal plans, which aresubject to routine testing. In the Northern Zone each ofthe centres has a separate major incident plan.
Does the National Blood Serviceprovide effective medical supportand advice?2.23 An important role of National Blood Service consultants,
reiterated in the 1995 Plans for the Future of the NationalBlood Service and in the 1998 circular “Better BloodTransfusion”, is to maintain contact with, and advise anddisseminate information to, users. This role recognisesthe shared responsibility for ensuring the optimal use ofa scarce, voluntarily donated national resource. NationalBlood Service involvement in blood transfusion mattersin hospitals may be through membership of the hospitaltransfusion committee, participation in or initiation ofclinical audits, through visits and talks or lectures togroups at the hospital, or through being available toprovide medical advice or support.
THE NATIONAL BLOOD SERVICE
19
part
two
Case Study 3: Action taken to ensure continuingsupplies of blood to hospitals during the September 2000 fuel shortage
Background
1 During the week beginning 10 September 2000, there wereblockades of oil depots, and deliveries of road fuel wereinterrupted. The National Blood Service took measures to maintainall necessary services to patients, and to ensure that the Servicewas not the cause of any restriction in patient care.
Actions taken
2 The Service had good stock levels of blood components (sufficientfor four to five days), and benefited from a positive response fromdonors, staff and hospitals. In some locations, it holds its ownstocks of fuel and supplies other parts of the NHS, and in others itrelies on the NHS for its supply. There were therefore noimmediate difficulties in maintaining the supply of bloodcomponents to hospitals. But the Service planned on the basis thatit could take until the end of September before full normalavailability of fuel supplies was restored.
3 Acting in concert with the NHS as a whole, the National BloodService activated its Disaster Contingency Plan with effect from1100 on 15 September. It had the key objective of ensuring thatcomponent stocks, and in particular platelets, were maintained. Itidentified the areas under threat (collections of donations;processing, testing and issuing; delivery to hospitals; and obtainingessential consumables, for example blood packs and test kits). Themain thrust of the plan was to focus all the work of the Service onessentials, for example by delivering donated blood to the nearestblood centre; minimising the number of ad-hoc deliveries; ceasingall trials and development of new systems; ensuring that key staffwere able to get to work; and encouraging hospitals to increasetemporarily their stockholdings of blood components.
4 The plan set up a command and control organisation whichnamed individuals at HQ, zone and blood centre level who wouldprovide 24 hour management cover and would monitor manageand report on key indicators, such as staffing, donation collection,component issues and deliveries, and availability of bloodcomponents, fuel supplies, critical equipment and consumables.
Outcome
5 The National Blood Service achieved its aim and key objective bymaintaining supplies to hospitals and avoiding causing anyrestrictions to patient care. If the national problems with fuel supplyhad continued, the Service would not have acted alone to secureits supplies, but would have been part of a NHS-wide solution.
Units of blood moved between zones in 1999 by the National Blood Service
Source: National Blood Service
Northern Zone
London &South East Zone
Midlands &South West Zone
11
10 1,40
0
375
10,5
00
145
28,823
335
5,550910
Hospital transfusion committees
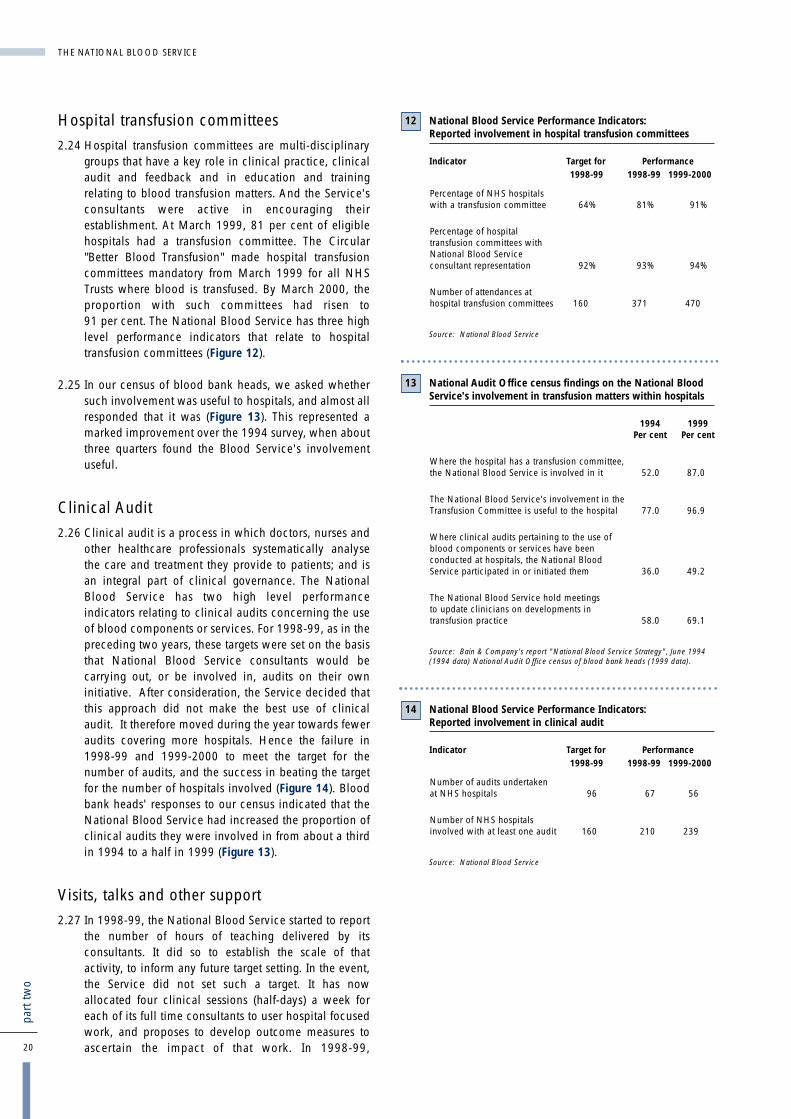
2.24 Hospital transfusion committees are multi-disciplinarygroups that have a key role in clinical practice, clinicalaudit and feedback and in education and trainingrelating to blood transfusion matters. And the Service'sconsultants were active in encouraging theirestablishment. At March 1999, 81 per cent of eligiblehospitals had a transfusion committee. The Circular"Better Blood Transfusion" made hospital transfusioncommittees mandatory from March 1999 for all NHSTrusts where blood is transfused. By March 2000, theproportion with such committees had risen to91 per cent. The National Blood Service has three highlevel performance indicators that relate to hospitaltransfusion committees (Figure 12).
2.25 In our census of blood bank heads, we asked whethersuch involvement was useful to hospitals, and almost allresponded that it was (Figure 13). This represented amarked improvement over the 1994 survey, when aboutthree quarters found the Blood Service's involvementuseful.
Clinical Audit
2.26 Clinical audit is a process in which doctors, nurses andother healthcare professionals systematically analysethe care and treatment they provide to patients; and isan integral part of clinical governance. The NationalBlood Service has two high level performanceindicators relating to clinical audits concerning the useof blood components or services. For 1998-99, as in thepreceding two years, these targets were set on the basisthat National Blood Service consultants would becarrying out, or be involved in, audits on their owninitiative. After consideration, the Service decided thatthis approach did not make the best use of clinicalaudit. It therefore moved during the year towards feweraudits covering more hospitals. Hence the failure in1998-99 and 1999-2000 to meet the target for thenumber of audits, and the success in beating the targetfor the number of hospitals involved (Figure 14). Bloodbank heads' responses to our census indicated that theNational Blood Service had increased the proportion ofclinical audits they were involved in from about a thirdin 1994 to a half in 1999 (Figure 13).
Visits, talks and other support
2.27 In 1998-99, the National Blood Service started to reportthe number of hours of teaching delivered by itsconsultants. It did so to establish the scale of thatactivity, to inform any future target setting. In the event,the Service did not set such a target. It has nowallocated four clinical sessions (half-days) a week foreach of its full time consultants to user hospital focusedwork, and proposes to develop outcome measures toascertain the impact of that work. In 1998-99,20
part
two
THE NATIONAL BLOOD SERVICE
National Blood Service Performance Indicators: Reported involvement in hospital transfusion committees
Indicator Target for Performance1998-99 1998-99 1999-2000
Percentage of NHS hospitals with a transfusion committee 64% 81% 91%
Percentage of hospital transfusion committees with National Blood Service consultant representation 92% 93% 94%
Number of attendances at hospital transfusion committees 160 371 470
Source: National Blood Service
12
National Audit Office census findings on the National BloodService's involvement in transfusion matters within hospitals
1994 1999Per cent Per cent
Where the hospital has a transfusion committee, the National Blood Service is involved in it 52.0 87.0
The National Blood Service's involvement in the Transfusion Committee is useful to the hospital 77.0 96.9
Where clinical audits pertaining to the use of blood components or services have been conducted at hospitals, the National Blood Service participated in or initiated them 36.0 49.2
The National Blood Service hold meetings to update clinicians on developments in transfusion practice 58.0 69.1
Source: Bain & Company's report "National Blood Service Strategy", June 1994(1994 data) National Audit Office census of blood bank heads (1999 data).
13
National Blood Service Performance Indicators: Reported involvement in clinical audit
Indicator Target for Performance1998-99 1998-99 1999-2000
Number of audits undertaken at NHS hospitals 96 67 56
Number of NHS hospitals involved with at least one audit 160 210 239
Source: National Blood Service
14

consultants delivered 958 hours of teaching and, in1999-2000, 902 hours; this information was derivedfrom data provided by those consultants. In theirresponses to our census, some 70 per cent of bloodbank heads told us that the National Blood Service heldmeetings at their hospitals to update clinicians ondevelopments in transfusion practice. This representedan increase in activity compared with 1994 (Figure 13).
2.28 Taken together, attendance at hospital transfusioncommittees, participation in clinical audits and teachingcommitments represent a sizeable programme of visitsto hospitals. And almost all (94 per cent) of respondentsto our census who were aware of having been visitedsaid those visits were helpful. However, seven per centof blood bank heads said they were not aware of anyvisit in the previous two years, and a furthereight per cent either did not know when the last visitwas, or described it as being "a long time ago". TheNational Blood Service accepts that, where the bloodbank head is not a doctor, he or she might not always beaware of visits made by the Service's consultants. TheService considers, however, that effective liaison issecured through other contacts that take place betweenblood centres and blood bank heads.
2.29 Over 90 per cent of blood bank heads responding to ourcensus regarded National Blood Service consultants asexperts in transfusion medicine, and contacted themwhen they needed advice on that subject, althoughmany respondents said they would also contact otherconsultants and experts. These figures represent a smallimprovement over the results of the 1994 Bain survey.On a scale of 1 to 10, blood bank heads rated clinicaladvice on transfusion medicine at 8.4. Almost all(97 per cent) of those who offered an opinion of theusefulness of their point of contact at the National BloodService for medical matters put it in a range betweenuseful and essential.
2.30 The Service recognises that it needs effective consultantsto enable it to deliver a high quality service. It has,therefore established joint posts - medical staff alsoholding university appointments, for example - andattached research and development responsibilities tojobs, in an effort to attract higher calibre doctors.
Is the National Blood Serviceinvestment in scientific and medicalresearch well targeted anddisseminated?2.31 In 1998-99 the National Blood Service spent
£2.5 million (excluding non-NHS funding) on scientificand medical research. It does not undertake long term,intrinsically expensive, research into areas such asblood substitutes, but has left such research to thepharmaceutical industry. The Service considers that thelimited funds available to it for research anddevelopment mean that it cannot cover the entire field,and the NHS Executive supports this view.
2.32 In 1996, the National Blood Service undertook an auditof all research activity then current and rated projectsaccording to their quality and appropriateness to theneeds of the Service. They also established a procedurefor obtaining approval to proceed with research work.This requires those wishing to undertake research tosubmit an application to a Projects Board, which meetsannually. We found, however, that some older projects,for example research into the immunology of cold blood,that had been rated as being of limited relevance, werecontinuing to receive funding at the time of our audit.
2.33 Effective dissemination of research results adds value tothe research work by placing the material at the disposalof a wider audience. There is evidence, however, thatthe findings of research are not being communicated toall who may need or wish to know. Most disseminationhas been through restricted channels, such aspublication as peer reviewed papers in journals,through the British Blood Transfusion Society, or duringliaison meetings with NHS colleagues. Fifty one percent of respondents to our hospital census said that theyreceived information on National Blood Serviceresearch and all of those except two said that they foundthe information useful. But 44 per cent said that they didnot receive such information. The Service needs toconsider using existing channels more intensively, andhow to use other channels of communication, such asthrough postgraduate lectures, or by publishing resultson its website.
THE NATIONAL BLOOD SERVICE
21
part
two
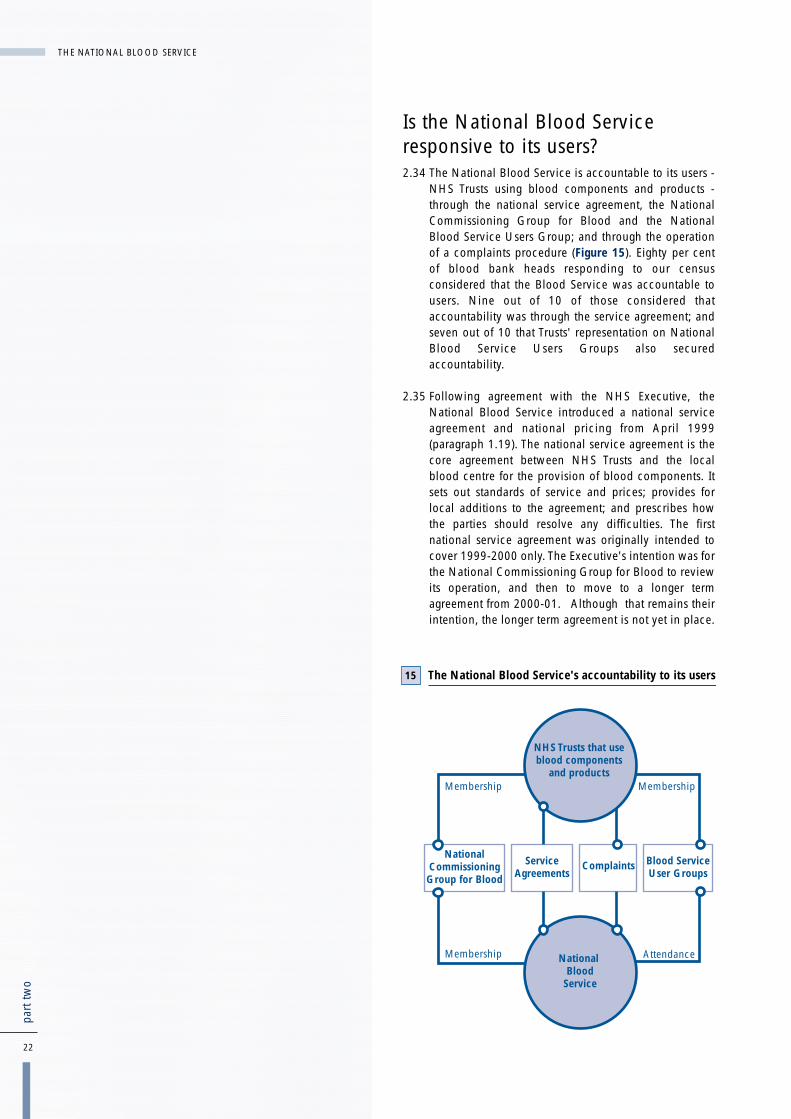
Is the National Blood Serviceresponsive to its users?2.34 The National Blood Service is accountable to its users -
NHS Trusts using blood components and products -through the national service agreement, the NationalCommissioning Group for Blood and the NationalBlood Service Users Group; and through the operationof a complaints procedure (Figure 15). Eighty per centof blood bank heads responding to our censusconsidered that the Blood Service was accountable tousers. Nine out of 10 of those considered thataccountability was through the service agreement; andseven out of 10 that Trusts' representation on NationalBlood Service Users Groups also securedaccountability.
2.35 Following agreement with the NHS Executive, theNational Blood Service introduced a national serviceagreement and national pricing from April 1999(paragraph 1.19). The national service agreement is thecore agreement between NHS Trusts and the localblood centre for the provision of blood components. Itsets out standards of service and prices; provides forlocal additions to the agreement; and prescribes howthe parties should resolve any difficulties. The firstnational service agreement was originally intended tocover 1999-2000 only. The Executive's intention was forthe National Commissioning Group for Blood to reviewits operation, and then to move to a longer termagreement from 2000-01. Although that remains theirintention, the longer term agreement is not yet in place.
22
part
two
THE NATIONAL BLOOD SERVICE
The National Blood Service's accountability to its users15
National Commissioning Group for Blood
Service Agreements
Complaints Blood ServiceUser Groups
Membership
Membership Membership
AttendanceNational Blood
Service
NHS Trusts that use blood components
and products
2.36 The National Blood Service discusses its pricing planswith the National Commissioning Group for Blood. TheGroup includes representatives from the Department ofHealth, the NHS and the National Blood Service andprovides an opportunity for users to call on the Serviceto justify its pricing proposals before agreeing to them.
2.37 The Department of Health established the NationalBlood Service Users Group in 1995 to enable users tomonitor the performance of the National Blood Service.The Group was to have a limited life, and held its lastmeeting in April 1999 (paragraph 1.10). The three ZonalBlood User Groups continue to operate, however,because the Department consider there is a need forusers to be actively involved, a view supported by ourcensus findings. And they are represented on theNational Commissioning Group for Blood.
2.38 In his final report to the Secretary of State, the Chairmanof the National Blood Service Users Grouprecommended that user groups should have a wider rolein determining blood transfusion practice, and that auser group for the future should be based on local bloodtransfusion committees, which should provide themembership of the zonal groups. In April 2000, theDepartment of Health asked the National Blood Serviceto coordinate and oversee the work of ensuringconsistent national practice on the safe and effective useof blood. The blood user groups would be central to thiswork.
2.39 The Department propose to establish a NationalTransfusion User Group to succeed the National BloodService Users Group. This body will includerepresentatives from the regional groups, the SeriousHazards of Transfusion Scheme, the medical royalcolleges, the National Blood Service and theDepartment of Health. The three zonal groups will besucceeded by eight regional blood transfusion usergroups. Those regional groups will be represented onthe National Commissioning Group for Blood, to enableusers to continue to be involved in discussions on bloodprices and the national service agreement. TheDepartment also intend the National Transfusion UserGroup to develop links with national groups that aredeveloping guidelines, such as the National Institute forClinical Excellence. They aim to have the structure inplace by March 2001.
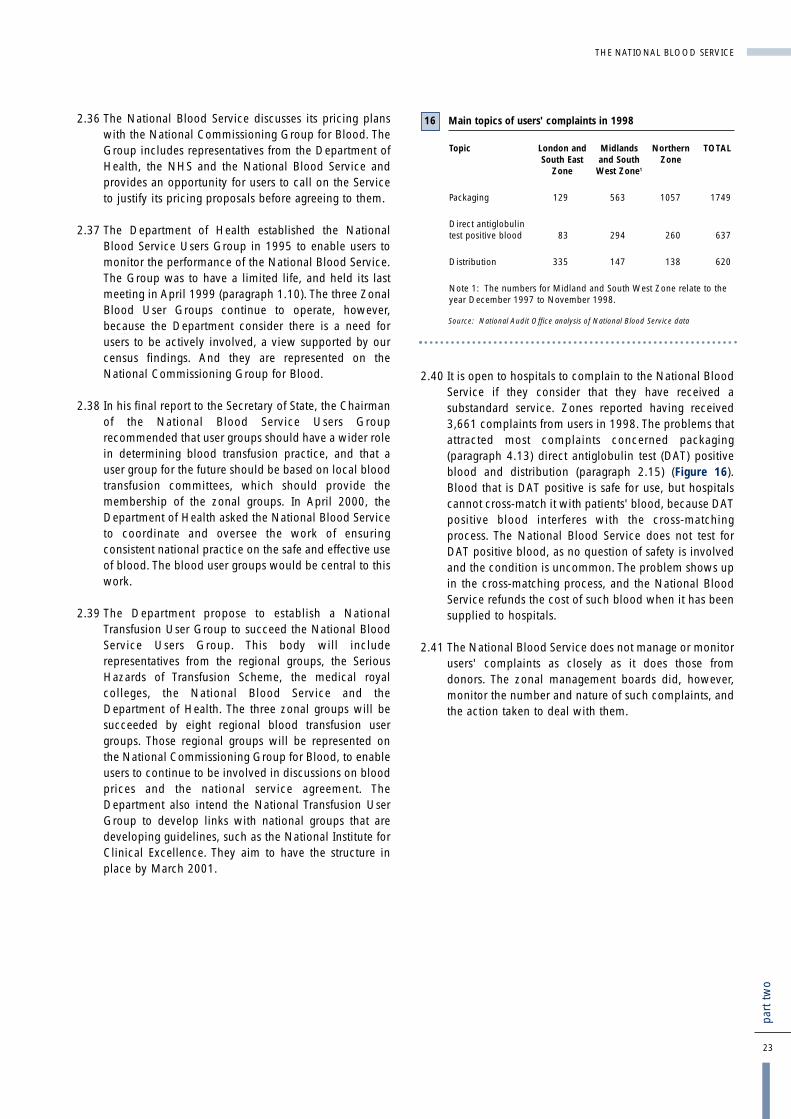
2.40 It is open to hospitals to complain to the National BloodService if they consider that they have received asubstandard service. Zones reported having received3,661 complaints from users in 1998. The problems thatattracted most complaints concerned packaging(paragraph 4.13) direct antiglobulin test (DAT) positiveblood and distribution (paragraph 2.15) (Figure 16).Blood that is DAT positive is safe for use, but hospitalscannot cross-match it with patients' blood, because DATpositive blood interferes with the cross-matchingprocess. The National Blood Service does not test forDAT positive blood, as no question of safety is involvedand the condition is uncommon. The problem shows upin the cross-matching process, and the National BloodService refunds the cost of such blood when it has beensupplied to hospitals.
2.41 The National Blood Service does not manage or monitorusers' complaints as closely as it does those fromdonors. The zonal management boards did, however,monitor the number and nature of such complaints, andthe action taken to deal with them.
THE NATIONAL BLOOD SERVICE
23
part
two
Main topics of users' complaints in 1998
Topic London and Midlands Northern TOTALSouth East and South Zone
Zone West Zone1
Packaging 129 563 1057 1749
Direct antiglobulin test positive blood 83 294 260 637
Distribution 335 147 138 620
Note 1: The numbers for Midland and South West Zone relate to theyear December 1997 to November 1998.
Source: National Audit Office analysis of National Blood Service data
16
24
part
thre
e
� Although the National Blood Service experiencedsome difficulty in 1998-99 in meeting in fullhospitals' demands for blood components, itcollected sufficient donations of blood in 1999-2000 to avoid such problems and increase the stocksheld at blood centres.
� While it has undertaken regular qualitative surveysof people's attitudes towards its campaigns, theService has been less active in carrying outquantitative surveys. Our quantitative survey of thepublic highlighted the potential for increasing thepool of donors and the benefits to be gained fromaddressing the time constraints people operateunder and the need to stem the loss of donorsthrough bad experiences of giving blood.
� The Blood Service goes to some lengths toencourage donors to continue giving blood. Itmonitors its handling of complaints from donors andperformance indicators for donor care duringdonation sessions.
� Although the Service's performance in 1998-99 wasbetter than the targets set for donor care, the volumeof complaints increased. This increase may in parthave been a result of a greater confidence on thepart of donors that their complaints would be takenseriously. But it also indicates a need for the Serviceto reduce the time it takes to give blood, a point thatalso emerged from our survey of attitudes to blooddonation; and the Service is taking action to dealwith this.
How effectively does the NationalBlood Service encourage people togive blood?Part 3
Conclusions

25
part
thre
e
3.1 This part of our report examines how well the NationalBlood Service performs in terms of encouraging peopleto give blood.
3.2 Securing the co-operation of blood donors is essential tothe National Blood Service. The Department of Health's"Plans for the Future of the National Blood Service"(1995) recognised that donors are the foundation of theNational Blood Service and announced steps to improveits service to donors.
3.3 The Service maintains a record of existing donors, andinvites them to attend donor sessions. Not all donorscontinue to give blood after their first donation,however, and existing donors lapse for many reasons,including becoming ineligible. The Service needstherefore to recruit and retain donors. It does so throughthe use of publicity and through care of existing donors.
3.4 The National Blood Service uses 28 performanceindicators for measuring achievement against targets(Appendix 7); seven of them relate to this part of thereport. Its performance indicators for collection,recruitment and retention are at Figure 17. The targetsfor collection were set before the beginning of the year,on the basis of forecast need. Failure to hit the target in1998-99 did lead to some supply difficulties (paragraphs2.5 to 2.9). But the amount collected in 1999-2000 wassufficient to meet demand and increase stocks held atblood centres.
Publicity and Research
3.5 Until recently, the Service's publicity has largely takenthe form of posters and advertising campaigns in thepress and local radio and public relations events. In1998-99 as a whole, the Service did better than its targetfor new donors enrolled, and lost fewer donors throughlapsing than it had expected. But, importantly, it failedto meet its target for donations (Figure 17). The NationalBlood Service reported at its annual accountabilityreview that the shortfall resulted from obtaining fewer
donations than planned in autumn 1998, probablybecause of the poor weather. In early 1999, itcommissioned a television advertising campaign.During the campaign, which was associated with theintroduction of a national call line, there was a26 per cent increase in blood collection and thenumber of new donors enrolled was 104 per cent abovethe normal number for that period.
3.6 There was a significant difference between the numbersof new donors enrolled and new donors attending in1998-99 and 1999-2000 (Figure 18). This differencearose because enrolment is an expression of interest inbecoming a donor, and not all of the people making thatexpression actually give blood. In 1997-98, 75 per centof those who enrolled donated blood, by 1999-2000 theproportion had fallen to 60 per cent. This is not atpresent a serious problem for the National BloodService. Its policy, for reasons of safety and cost-effectiveness, is to retain existing donors; and it hasbecome more successful at containing the numbers oflapsed donors. If the trend of a falling rate ofconversions from enrolment to donation continues,however, the Service will need to ensure that a balanceis struck so that its use of existing donors does notdiminish the altruism that prompts new individuals toexpress an interest in donation.
Reported performance against collection targets
Aspect of Collection Target for Performance1998-99 1998-99 1999-2000
Percentage of donors bled to target (that is, the extent to which the collection target is achieved) 100% 96.29% 97.06%
New donors enrolled 318,750 408,043 442,550
New donors attending 285,000 279,409 268,739
Lapsed donors 297,189 218,116 196,863
Source: National Blood Service
17
THE NATIONAL BLOOD SERVICE

3.7 The National Blood Service has regularly commissionedresearch into donor attitudes to campaigns: beforehandto gain assurance that the campaign will be effective,and afterwards to assess its impact. We identified21 surveys since 1989. Most of that research wasqualitative - based on a small number of in-depthinterviews and group discussions. Three researchsurveys were quantitative - using samples of a sufficientsize to enable firm conclusions to be drawn about thenational population as a whole. Two of the threequantitative surveys were about specific issues and onlyone, carried out in 1989, attempted to establish theattitude of the whole adult population towards blooddonation in general.
3.8 As there had not been a full quantitative survey ofdonors for 10 years, we commissioned a survey ofbehaviour and attitudes among adults towards givingblood to identify strengths in the present system andopportunities for planning further development. Thatsurvey confirmed findings from the Service's qualitativesurveys, and provided some new insights. We havesupplied the detailed results to the National BloodService. A summary of those results is set out opposite.Our research methodology is set out at Appendix 8.
Donor Care
3.9 The Service recognises that it is important that theexperience of giving blood is a good one, as the qualityof that experience can have a material effect on donors'future willingness to give blood. For that reason, itmeasures and monitors donors' satisfaction with theirtreatment by the Service, through continuing surveys ofdonors attending sessions. The National Blood Servicehas set performance targets for waiting times and donorsatisfaction. In 1998-99, performance against each ofthe three targets was better than the standards(Figure 18). The patient satisfaction indicator recordedan improvement in 1999-2000. There was, however,some deterioration in the proportion of donors waitinglonger than the target times.
3.10 In 1999, the National Blood Service launched a project"Donor 2000". This had two elements: analysing itsdatabase to understand better the attributes of donors;and implementing initiatives to recruit and retaindonors. The main outcomes of the research were that itidentified the groups from which the most reliabledonors come and confirmed that it is more efficient toretain existing donors than to recruit new ones. TheService is introducing initiatives that aim to improve theexperience of giving blood and attitudes towards it, byfor example ensuring that reception staff at donorsessions are sympathetic and informative. The keyimprovement promised in the 1995 Plans for the Futureof the National Blood Service was to develop its presentrange and pattern of collection sessions to make blooddonation easier and more convenient for donors. TheNational Blood Service is introducing area based teams,particularly in the Midlands and South West Zone, toencourage recruitment and retention of donors (Case Study 4).
3.11 Since 1996, the National Blood Service has had anational complaints policy that is in line with the rest ofthe NHS. The three zones deal with complaints fromdonors in accordance with zonal operating policies.These policies contain some minor differences from thenational policy; and the newly appointed Director ofServices to Donors and Director of Public and CustomerServices propose to revisit the way they operate.
3.12 The Board retains oversight of complaints from donors.Each zone submits a quarterly return showing thenumber of complaints received and the number clearedwithin specified timescales. They do not, however,report on how long it has taken to respond to thesubstantial proportion of complaints that were notcleared within 20 days.
26
part
thre
e
THE NATIONAL BLOOD SERVICE
Reported performance against targets for donor care, 1998-99
Aspect of care 1998-99 PerformanceTarget 1998-99 1999-2000
Per cent Per cent Per cent
Donors waiting longer than 30 minutes before registration and screening 7.3 6.0 9.1
Donors taking longer than 40 minutes to reach the bleed bed 9.8 8.7 10.3
Donors satisfied (as derived from satisfaction surveys) 90 93.5 99.7
Source: National Blood Service
18Case Study 4: Area-based blood collection teams
In the past, blood collection teams were mainly based on blood centres,with individual teams working on a rotational basis at a number ofcollection venues, thus dealing with different panels of donors.
Area-based teams are, as their title implies, based at locations remotefrom the blood centre to which they are attached. For example, thereare teams attached to Plymouth Blood Centre that are based atDorchester, Exeter, North Devon, Taunton and Truro. Those teams alonecollect blood from within their designated areas.
The National Blood Service considers that giving area managers and theirteams responsibility for particular geographic areas enhances customerservice by developing a sense of identity between teams and theirspecific areas and groups of donors. The Service expects theintroduction of area-based teams to encourage recruitment and retentionof donors, and to strengthen links with general practitioners and localhospitals.

THE NATIONAL BLOOD SERVICE
27
part
thre
e
Summarised results of the National Audit Office survey of attitudes to blood donation
The most important positive finding was that almost everyone (96 per cent of the population) accepted that there was acontinuing need to give blood. The National Blood Service therefore does not have to put a lot of effort into selling themerit of giving blood. Other important positive points were:
� the population is highly responsive to prompts to donate blood, 10 per cent of donors responding to various formsof advertising and 19 per cent to direct requests from the National Blood Service;
� a third of those who had ever been donors said they faced no obstacle when they last gave blood. And the result wasbetter for recent donors: 40 per cent said they faced no obstacle;
� only nine per cent of non-donors said they simply did not wish to give blood and only one per cent of lapsed andnon donors said they would be motivated by payment;
� there was little regional variation in the proportion of the population that said they donated, which indicates that theNational Blood Service is, geographically, providing reasonably equal opportunity to give blood;
Other findings indicate that there may be potential for increasing the pool of donors, and donations:
� a quarter of non-donors said they would probably or definitely give blood. Ten per cent of lapsed and non-donorssaid they did not know how to give. This indicates scope for increasing donation through informing people how togive. Twelve per cent of people said that if they were to give blood they would ask their GP or local hospital;
� compared with the general population, recent donors were more likely to be Londoners than people in other regions.And Londoners were most likely to say that they would arrange to give blood at their place of work. These resultsmay indicate the strength of industrial sessions in London, and that there is an opportunity for organising moreindustrial sessions.
� three per cent of the population said that they would find out how to give blood by using the Blood Service national0345 telephone number. When prompted, 18 per cent said they were aware that there was a number;
� recent donors are more likely to be aged 25-44. This suggests that donors in that group are likely to give more often thanother groups;
� younger donors (aged 17-34) are considerably more influenced to give blood as a result of advertising than any otherage group, providing the potential for cost-effective, targeted advertising;
� one in five donors suggest that the most influential prompt to giving blood is direct contact with the Blood Service,yet only one in ten 17-24 year olds are influenced in this way. This indicates that there may be scope for more directactivity with this age group;
� there are significant differences between the regions among those adults who claim they will probably or definitelygive blood in the future: London, the South East, the South West and the West Midlands are well above the nationalaverage;
� "ineligibility" is given by one third of adults as the main reason for not donating, although fewer than half of those hadbeen specifically advised by a doctor, or the Blood Service, not to donate;
� time constraints were cited as an obstacle to giving blood by a third of adults. This suggests that time saving measuressuch as work place sessions and reduced waiting times could prove effective.
Some of the findings were, however, less reassuring:
� a third of non-donors said they would definitely not give blood. This is worse than in 1989 when a fifth woulddefinitely not give. In terms of age groups, this response was most prevalent among 55 to 69 year olds, mostcommonly for medical reasons (which may well be insuperable);
� five per cent of lapsed donors - seven per cent of lapsed donors with no intention to give again - cited bad experiencesat the hands of the National Blood Service;
� twenty-two per cent of non-donors fear giving blood, with 20 per cent fearing needles;
� older donors are more likely to lapse. A third of lapsed donors attribute their lapsing to illness.
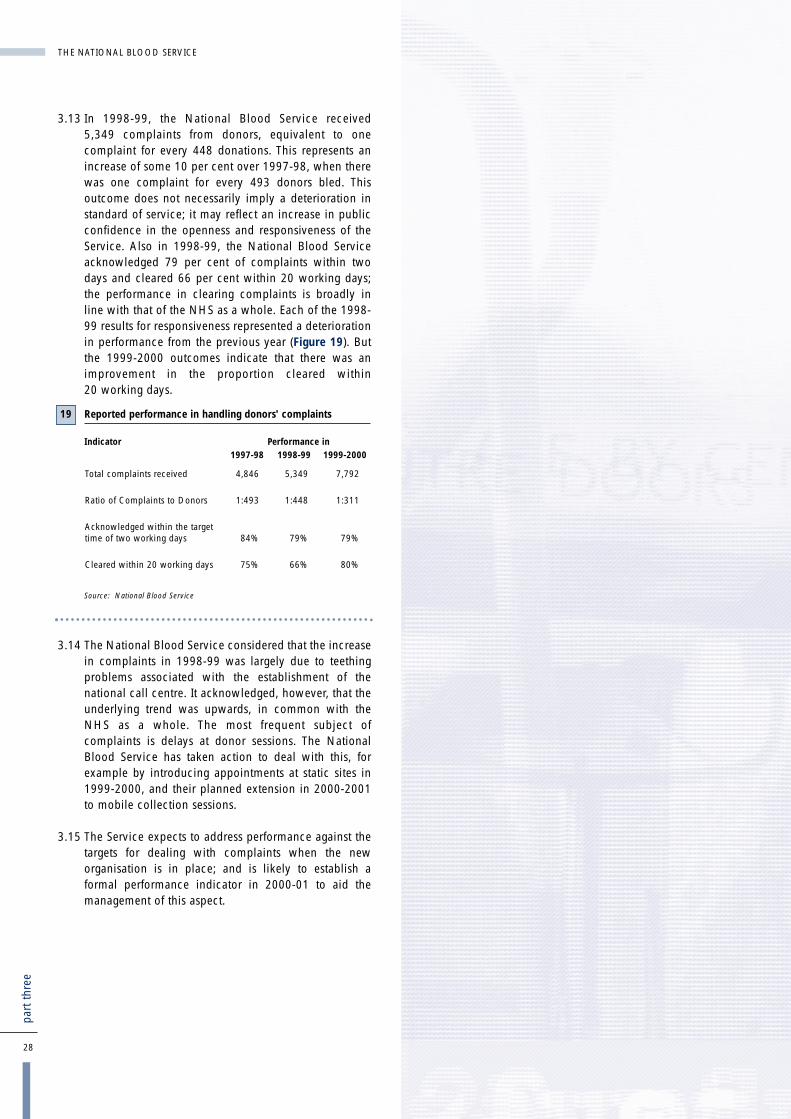
3.13 In 1998-99, the National Blood Service received5,349 complaints from donors, equivalent to onecomplaint for every 448 donations. This represents anincrease of some 10 per cent over 1997-98, when therewas one complaint for every 493 donors bled. Thisoutcome does not necessarily imply a deterioration instandard of service; it may reflect an increase in publicconfidence in the openness and responsiveness of theService. Also in 1998-99, the National Blood Serviceacknowledged 79 per cent of complaints within twodays and cleared 66 per cent within 20 working days;the performance in clearing complaints is broadly inline with that of the NHS as a whole. Each of the 1998-99 results for responsiveness represented a deteriorationin performance from the previous year (Figure 19). Butthe 1999-2000 outcomes indicate that there was animprovement in the proportion cleared within20 working days.
3.14 The National Blood Service considered that the increasein complaints in 1998-99 was largely due to teethingproblems associated with the establishment of thenational call centre. It acknowledged, however, that theunderlying trend was upwards, in common with theNHS as a whole. The most frequent subject ofcomplaints is delays at donor sessions. The NationalBlood Service has taken action to deal with this, forexample by introducing appointments at static sites in1999-2000, and their planned extension in 2000-2001to mobile collection sessions.
3.15 The Service expects to address performance against thetargets for dealing with complaints when the neworganisation is in place; and is likely to establish aformal performance indicator in 2000-01 to aid themanagement of this aspect.
28
part
thre
e
THE NATIONAL BLOOD SERVICE
Reported performance in handling donors' complaints
Indicator Performance in1997-98 1998-99 1999-2000
Total complaints received 4,846 5,349 7,792
Ratio of Complaints to Donors 1:493 1:448 1:311
Acknowledged within the target time of two working days 84% 79% 79%
Cleared within 20 working days 75% 66% 80%
Source: National Blood Service
19

THE NATIONAL BLOOD SERVICE
29
part
thre
e
30
part
four
Are National Blood Servicecomponents safe?Part 4
Conclusions� The number of verifiable deaths linked to unsafe blood
components is very low in relation to the number oftransfusions made, although any fatality is regrettable.With minor exceptions, there are comprehensivearrangements for securing the safety of bloodcomponents, and the Medicines Control Agency hasconfirmed their efficacy. As safety is of such greatimportance, we consider that the Service shouldestablish a high level indicator to allow monitoring ofsafety performance.
� Hospital users reported a high level of satisfactionwith the quality of National Blood Servicecomponents and services, though there were problemswith the packaging and labelling of blood componentswhich the Service is tackling. It has recently adopted anational quality strategy, which represents animportant move forward.

31
part
four
4.1 This part of our report examines how well the NationalBlood Service performs in terms of the safety of bloodcomponents.
Deaths caused by unsafe blood4.2 Receiving blood can be hazardous. The National Blood
Service has, however, no high level indicator of safetyperformance. In our census, blood bank heads reporteda total of seven verifiable fatal incidents to recipients inthe six years 1993 to 1998 caused by unsafe bloodcomponents supplied by the National Blood Service.During that time, some five million transfusions weremade. The Service is not aware of any donation-relateddeaths in that period.
4.3 The Serious Hazards of Transfusion Scheme is aconfidential voluntary reporting system for majortransfusion events in the UK and the Republic of Ireland.Although independent, it is funded by UK bloodservices. The Scheme has been running for three yearsand, by 1998-99, participation had grown to 78 per centof hospitals transfusing blood. The December 1998health circular "Better Blood Transfusion" (Appendix 3)recommended that, from March 1999, all NHS Trustswhere blood is transfused should participate in theScheme. The two main reporting categories are "non-infectious" (for example, wrong blood transfused) and"infectious" (for example viral or bacterialcontamination). In their 1998-99 Annual Report,published in April 2000, the Serious Hazards ofTransfusion Steering Group reported seven deathsdefinitely attributable to transfusion and nine possibly soattributable. Two of the definitely attributable deathswere due to bacterial infection and one from viralcontamination (Hepatitis B). The other deaths wereunrelated to blood component processes outside thehospital. The Steering Group's report concluded thatblood transfusion is now extremely safe, but vigilance isneeded to ensure correct identification of blood andpatient; and recommended the evaluation ofcomputerised identification systems.
Action taken by the National BloodService to secure safety4.4 The National Blood Service takes a wide range of
measures to secure safety.
4.5 The European Select Committee of Experts on QualityAssurance in Blood Transfusion Services produce andpublish the "Guide to the preparation, use and qualityassurance of blood components, 5th edition" (Council ofEurope Publishing, January 1999). The United KingdomBlood Transfusion Service and the National Institute forBiological Standards and Control prepare more detailedprofessional guidelines for the UK entitled "Guidelinesfor the blood transfusion services in the UnitedKingdom".
4.6 All blood centres maintain copies of the guidelines, andtreat them as the authoritative source of rules on safety.The guidelines are not, however, detailed in the sensethat they prescribe the precise action to be taken at eachsite. They set out to provide a framework on whichblood centres should assemble standard operatingprocedures. The guidelines require blood centres to:
� Screen donors in accordance with the NationalBlood Service's guidance on Medical Assessment ofDonors. The screening consists of a haemoglobintest, completing a tick-box questionnaire and, fornew and lapsed donors, an in-depth interview witha nurse or, on occasion, a doctor. The purpose of thisscreening is to ensure that the potential donor is ingood health, to protect the recipient from any illeffect through transmission of diseases or drugs byblood transfusion and to protect the donor from anyharm. One in five new donors and one in nineregular donors are deferred;
� Test donated blood for HIV, hepatitis B and C andsyphilis; and
THE NATIONAL BLOOD SERVICE

� pursue "good manufacturing practice" - thestandards of the pharmaceutical industry - in allprocessing and storage.
4.7 Good manufacturing practice is specified in the "Guideto the preparation, use and quality assurance of bloodcomponents". It requires assurance systems, including:
� the ability to trace all donations to the donor and tothe recipient. Using its computer system, PULSE, theNational Blood Service identifies the donor's namewith the blood given. That link is maintainedthroughout the collection, testing and processingstages. Should any problems with the blood donatedarise, either at the hospital where the blood istransfused, or through further information comingavailable to the National Blood Service, the bloodtransfused can be traced back to the donor, and theblood donated can be traced through to therecipient.
� the operation of quality control procedures. TheNational Blood Service subjects the operation of itsprocedures for collecting, testing and processingblood to internal quality audit. The procedures arederived from the guidance described at paragraph4.5, but are not in all cases identical throughout theNational Blood Service. They may be national,zonal, or centre procedures. Zonally led auditscheck performance against those procedures and thezones follow them up to ensure that centres takeremedial action to deal with the weaknesses theyfound. There are variations between centres andzones in procedures and in the frequency of internalquality reporting: some reports are monthly, somequarterly.
4.8 The Service has adopted a national quality strategy thatrecognises the importance of key inputs such as stafftraining (Figure 20). The quality strategy does notseparately provide for external assessment. TheCommission for Health Improvement will, however,review the Service's implementation of clinicalgovernance as part of its rolling programme. TheMedicines Control Agency makes an assessment ofaspects that are covered by good manufacturingpractice. And the NHS's corporate governanceframework requires the National Blood Service to assessother aspects of quality and produce plans forimprovement. Although the basis of the corporategovernance framework is self-assessment, there is arequirement for verification by the external auditors. Theprocess should therefore deliver independent scrutiny ofthe effectiveness of the quality strategy.
Medicines Control Agencyinspections 4.9 The National Blood Service's activities must comply with
the Medicines Act 1968. The Medicines Control Agencyis responsible for safeguarding public health by ensuringthat all medicines on the UK market meet appropriatestandards of safety, quality and efficacy, which itachieves through a system of licensing, inspection,enforcement and post-marketing surveillance. TheAgency inspects National Blood Service sites to ensurethat blood centres are operating in compliance with thelaw, and with the principles of good manufacturingpractice. All of the Blood Service's collection,processing, testing and storage activities are licensed.
4.10 The Medicines Control Agency focuses on individualblood centres on a rolling programme, and produces areport to the National Blood Service following eachinspection. It does not carry out an overall review of theService. The Agency told us that standards at blood
32
part
four
THE NATIONAL BLOOD SERVICE
The National Blood Service's quality strategy
1 The National Blood Service has a quality policy that states:
"The purpose of the National Blood Service is to help save andimprove patients' lives with components derived through thegenerosity of volunteer, unpaid donors, and the provision ofassociated services.
We will:
� Identify and meet the needs of our customers, especially donorsand patients.
� Continually review and improve all of our activities.
� Meet, or exceed the requirements of legislation and agreedstandards.
� Train and involve all staff to help us achieve our purpose."
2 The aim of the quality strategy is to enable the Service to meet itsstated quality policy.
3 The quality strategy requires:
� the Service's senior management to accept that qualitycompliance and improvement is essential to the Service,thereby bringing about a cultural change;
� the service to ensure that the guidance following the WhitePaper, "The New NHS", and the consultation paper, "A FirstClass Service: Quality in the New NHS" on quality and clinicalgovernance is put into effect. Clinical governance is to providethe driving force for the organisation's measurable qualityimprovement;
� a sufficient trained and dedicated workforce, and sufficientother resources to delivery quality;
� that the structure of the organisation ensures that it takes fulladvantage of advice from quality professionals.
4 The requirements of clinical governance are reinforced by aStatutory Duty of Quality introduced in the Health Act 1999.The Duty was extended to the National Blood Authority in April2000. The Authority's work in implementing clinical governance(as a practical manifestation of its Duty of Quality) will besubject to external review by the Commission for HealthImprovement.
Source: National Blood Service
20
THE NATIONAL BLOOD SERVICE
33
part
four
centres had improved greatly since the establishment ofthe National Blood Service. The Agency reports to theService where there are failures to maintain bestpractices. The most common weaknesses it found atblood centres in 1998 and 1999 related to poor recordkeeping; and centres have taken action in response tothose findings (Case Study 5).
Case Study 5: Action taken by the National BloodService to rectify failures to comply with goodmanufacturing practice at a blood centre
The Medicines Control Agency has a rolling programme of inspection ofblood centres. Where it finds weaknesses that are "critical", that is of anunacceptable standard, it requires remedial action within a specifiedtime. If such action is not taken, the Agency may remove the centre fromthe National Blood Service's licence.
The Problem
When the Agency inspected a centre in April 1998, it found six practicesand procedures it classified as critical. For example:
� records of recall requests and despatch of recalled blood componentswere missing
� there had been no investigation of a missing unit of blood
� There were no written standard operating practices for many of theoperations and procedures carried out in the hospital servicesdepartment.
In addition, it found one "major" and 11 "other" weaknesses.
Action Taken
Following the report, the quality manager for the blood centre prepared acorrective action plan, setting out the action planned to deal with, orrectify, each of the failings. The action in respect of the examples abovewas:
� In the case of recalled blood components, a review of recent recallswas carried out. This revealed that the recall procedure was not alwaysfollowed correctly. Quality staff prepared additional standard operatingprocedures, and trained staff on their operation. In addition, theyidentified a problem with the IT system, and arranged for the supplierto provide modified software.
� Quality staff prepared and implemented a standard operatingprocedure for the investigation of discrepancies.
� Quality staff undertook a review of hospital services standardoperating procedures at the Centre. They identified the need for 34additional standard operating procedures, and for modifications to theexisting 16. They set a timetable for production and implementation ofthe additional procedures, and for training staff in their operation; andbrought in expertise to help with the process. They also set outprocedures for monitoring progress against the timetable, whichinvolved senior staff at the zonal HQ.
The Medicines Control Agency inspected the centre again in November1998. On that occasion, it reported no critical or major failures.
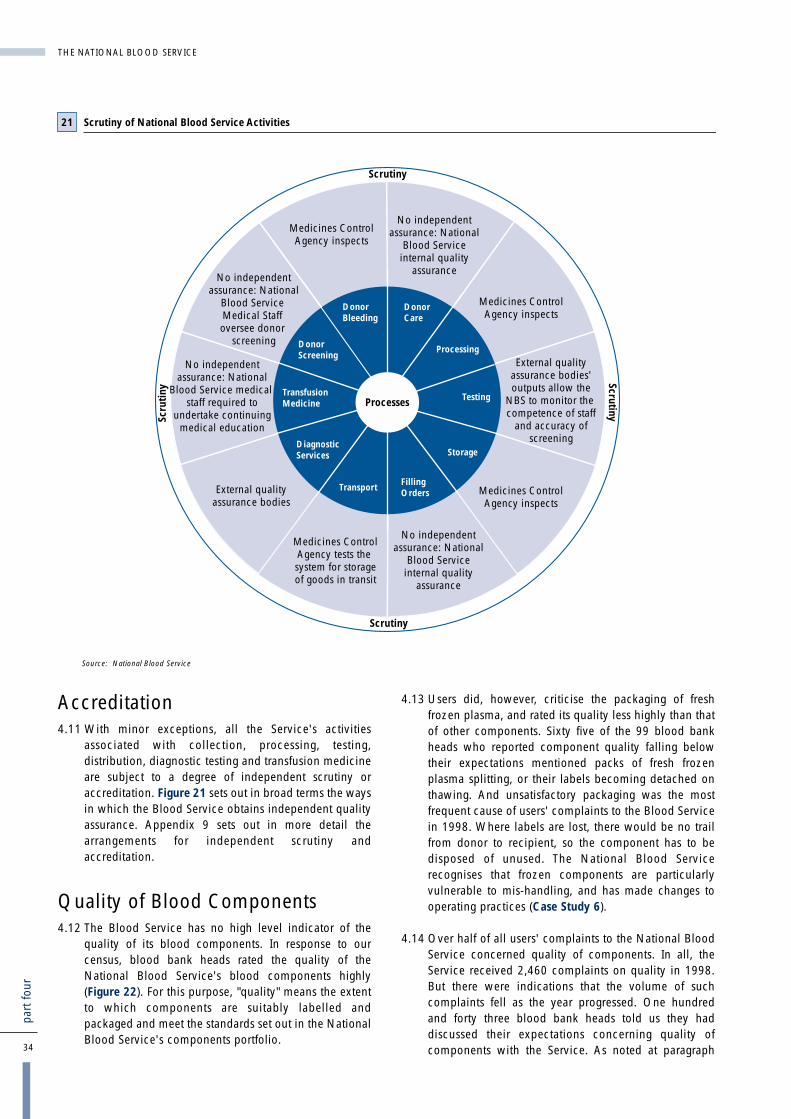
Accreditation4.11 With minor exceptions, all the Service's activities
associated with collection, processing, testing,distribution, diagnostic testing and transfusion medicineare subject to a degree of independent scrutiny oraccreditation. Figure 21 sets out in broad terms the waysin which the Blood Service obtains independent qualityassurance. Appendix 9 sets out in more detail thearrangements for independent scrutiny andaccreditation.
Quality of Blood Components4.12 The Blood Service has no high level indicator of the
quality of its blood components. In response to ourcensus, blood bank heads rated the quality of theNational Blood Service's blood components highly(Figure 22). For this purpose, "quality" means the extentto which components are suitably labelled andpackaged and meet the standards set out in the NationalBlood Service's components portfolio.
4.13 Users did, however, criticise the packaging of freshfrozen plasma, and rated its quality less highly than thatof other components. Sixty five of the 99 blood bankheads who reported component quality falling belowtheir expectations mentioned packs of fresh frozenplasma splitting, or their labels becoming detached onthawing. And unsatisfactory packaging was the mostfrequent cause of users' complaints to the Blood Servicein 1998. Where labels are lost, there would be no trailfrom donor to recipient, so the component has to bedisposed of unused. The National Blood Servicerecognises that frozen components are particularlyvulnerable to mis-handling, and has made changes tooperating practices (Case Study 6).
4.14 Over half of all users' complaints to the National BloodService concerned quality of components. In all, theService received 2,460 complaints on quality in 1998.But there were indications that the volume of suchcomplaints fell as the year progressed. One hundredand forty three blood bank heads told us they haddiscussed their expectations concerning quality ofcomponents with the Service. As noted at paragraph34
part
four
THE NATIONAL BLOOD SERVICE
DonorScreening
TransfusionMedicine
DonorBleeding
DonorCare
Processing
Testing
Storage
FillingOrders
Transport
DiagnosticServices
Processes
ScrutinyScrutiny
Scrutiny
Scru
tiny
No independentassurance: National
Blood Serviceinternal quality
assurance
Medicines ControlAgency inspects
External qualityassurance bodies'outputs allow the
NBS to monitor the competence of staff
and accuracy ofscreening
Medicines ControlAgency inspects
No independentassurance: National
Blood Serviceinternal quality
assurance
Medicines ControlAgency tests the system for storageof goods in transit
External qualityassurance bodies
No independentassurance: National
Blood Service medical staff required to
undertake continuingmedical education
No independentassurance: National
Blood Service Medical Staff oversee donor
screening
Medicines ControlAgency inspects
Scrutiny of National Blood Service Activities
Source: National Blood Service
21
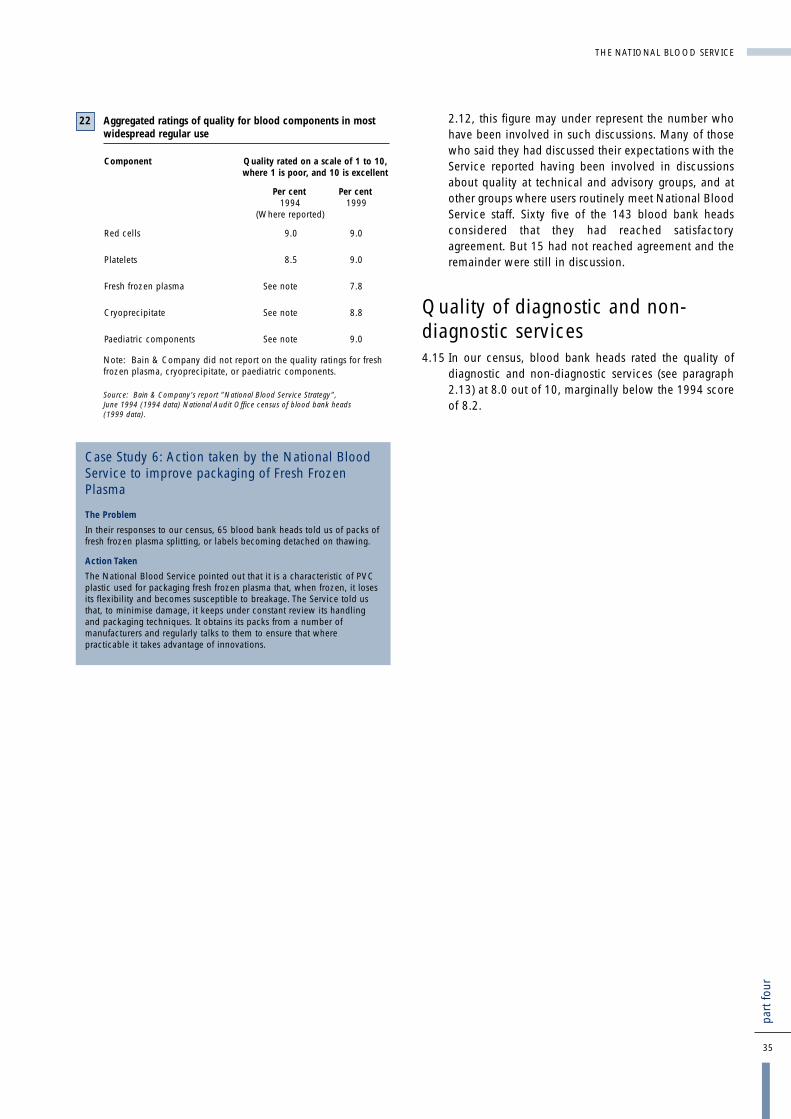
2.12, this figure may under represent the number whohave been involved in such discussions. Many of thosewho said they had discussed their expectations with theService reported having been involved in discussionsabout quality at technical and advisory groups, and atother groups where users routinely meet National BloodService staff. Sixty five of the 143 blood bank headsconsidered that they had reached satisfactoryagreement. But 15 had not reached agreement and theremainder were still in discussion.
Quality of diagnostic and non-diagnostic services4.15 In our census, blood bank heads rated the quality of
diagnostic and non-diagnostic services (see paragraph2.13) at 8.0 out of 10, marginally below the 1994 scoreof 8.2.
THE NATIONAL BLOOD SERVICE
35
part
four
Aggregated ratings of quality for blood components in mostwidespread regular use
Component Quality rated on a scale of 1 to 10, where 1 is poor, and 10 is excellent
Per cent Per cent1994 1999
(Where reported)
Red cells 9.0 9.0
Platelets 8.5 9.0
Fresh frozen plasma See note 7.8
Cryoprecipitate See note 8.8
Paediatric components See note 9.0
Note: Bain & Company did not report on the quality ratings for freshfrozen plasma, cryoprecipitate, or paediatric components.
Source: Bain & Company's report "National Blood Service Strategy",June 1994 (1994 data) National Audit Office census of blood bank heads (1999 data).
22
Case Study 6: Action taken by the National BloodService to improve packaging of Fresh FrozenPlasma
The Problem
In their responses to our census, 65 blood bank heads told us of packs offresh frozen plasma splitting, or labels becoming detached on thawing.
Action Taken
The National Blood Service pointed out that it is a characteristic of PVCplastic used for packaging fresh frozen plasma that, when frozen, it losesits flexibility and becomes susceptible to breakage. The Service told usthat, to minimise damage, it keeps under constant review its handlingand packaging techniques. It obtains its packs from a number ofmanufacturers and regularly talks to them to ensure that wherepracticable it takes advantage of innovations.

36
part
five
How effectively does the NationalBlood Service manage its efficiencyand performance?Part 5
Conclusions� The National Blood Service forecast that a
£10 million (at 1995-96 prices) reduction in itsbudget between 1995-96 and 1998-99 would followreorganisation. The Service provided material thatindicates that it has made combined cash andefficiency savings of £8.3 million, equivalent tocutting its costs by 5.4 per cent over three years. Butthere is insufficient detail in the National BloodAuthority's audited accounts to ascertain theaccuracy of the figures.
� The National Blood Service has found thatdifferences in staff terms and conditions, whichpredate the establishment of the National BloodAuthority, have inhibited its ability to adopt bestpractice throughout the Service. Negotiations tostandardise those terms and conditions have beenunsuccessful to date.
� The three zones inherited variations in practice fromthe 14 regional health authorities that ran the bloodcentres until 1994. And, although there has beenmuch harmonisation since then, some regionalvariations in practice have persisted, for example inapproaches to collecting blood. The recentreorganisation should provide an opportunity for theService to identify best practice and adopt itnationally.
� The Service has made good progress in introducingsystematic procedures for purchasing goods andservices that are yielding savings it estimates at over£3 million a year. Implementing those changes is acontinuing process.
� The National Blood Service has developed, and iscontinuing to refine, unit costs for key activities andcomponents. The Service used these forcomparisons within zones, but there was littleevidence of comparisons between zones. Althoughthere are differences in the zones' cost bases,internal cost comparisons and further examinationof variances have the potential to identify bestpractice and thus help keep costs down.
� The Service has not compared operational practiceswith other blood suppliers or with otherorganisations involved in similar collection, testing,or distribution activities. Although such comparisonsmust be made with due care, they are a potentialsource for identifying good practice.
� The National Blood Service's current performanceindicators do not form an adequate basis foraccountability to the NHS Executive, or for thedirection and management of the Service's business.To do so they need to concentrate on the coreactivities of the organisation. The Service intends toaddress those indicators relating to donor services aspart of its restructuring. There is, also, scope forimproving or developing high level performanceindicators for overall efficiency and for other areas ofits work, such as meeting hospital demand, wastage,safety and promotion of the optimal use of blood inhospitals. These high level indicators could in turnbe supported by indicators and targets for subsets ofthe work and for different localities.

37
part
five
THE NATIONAL BLOOD SERVICE
5.1 Parts 2, 3 and 4 of our report looked at the NationalBlood Service's performance in meeting hospitals'demands for sufficient safe blood and associatedservices. This part examines what action the Service hastaken to ensure that it manages its activities efficiently.
5.2 The National Blood Service uses 28 performanceindicators for measuring achievement against targets;two of them relate to this part of the report. A detailedlist is at Appendix 7.
How efficient is the National BloodService?
Reducing overall costs
5.3 About three-quarters of the Service's expenditure on itscore service is made up of salaries and wages(£81.5 million in 1998-99) and consumable supplies(£51.5 million). Appendix 10 sets out these and othercomponents in detail. Figure 23 sets out the maincomponents of expenditure from 1995-96 to 1999-2000.The increase in expenditure in 1999-2000 is largelyaccounted for by the greater use of leucodepletion,which cost an additional £44.1 million in that year.
Savings achieved from reorganisation
5.4 In their 1995 document "Plans for the future of theNational Blood Service", the Department of Healthforecast that reorganisation of the Service would bringabout a reduction of £10 million in the annual budgetby 1998-99 (Figure 24).
5.5 Information that the National Blood Service hasprovided indicates that the Service has cut its costs by£8.3 million, although that sum cannot beindependently verified. The National Blood Service'sassessment of core expenditure in 1998-99 was
Main components of National Blood Service Expenditure(excluding the Bio Products Laboratory and the InternationalBlood Group Reference Laboratory), 1995-96 to 1999-00
Component 1995- 1996- 1997- 1998- 1999-96 97 98 99 2000
£ million £ million £ million £ million £ million
Salaries and Wages 70.6 77.7 76.9 81.5 95.0
Consumable supplies 42.8 44.8 44.5 51.5 65.0
Other 40.3 40.1 46.6 51.0 75.0
TOTAL 153.7 162.6 168.0 184.0 235.0
TOTAL at 1995-96 prices 153.7 157.5 158.4 169.1 209.7
Source: National Blood Service data
23
Forecast savings expected to arise from reorganisation
1995- 1996- 1997- 1998-96 97 98 99
£000 £000 £000 £000
Blood collection and issuing including two new blood banks 150 320 (1,670) (2,840)
Development of R&D 0 80 100 45
Improved clinical support to hospitals 0 250 390 390
New IT System 0 940 770 (670)
Consolidation of administration 860 990 (3,150) (3,470)
Specialist services 0 0 (460) (1,020)
Processing and testing 190 460 (1,330) (2,450)
Total change from 1,200 3,040 (5,350) (10,015)previous year
Forecast National Blood £154m £157m £148.6m £144mService Budget2
Actual National Blood £153.7m £157.5m £158.4m £169.1mService expenditure2
Notes: 1. All costs are expressed at 1995-96 prices.2. Excluding Bio Products Laboratory and International
Blood Group Reference Laboratory.
Source: Plans for the future of the National Blood Service, Department of Health,1995
24
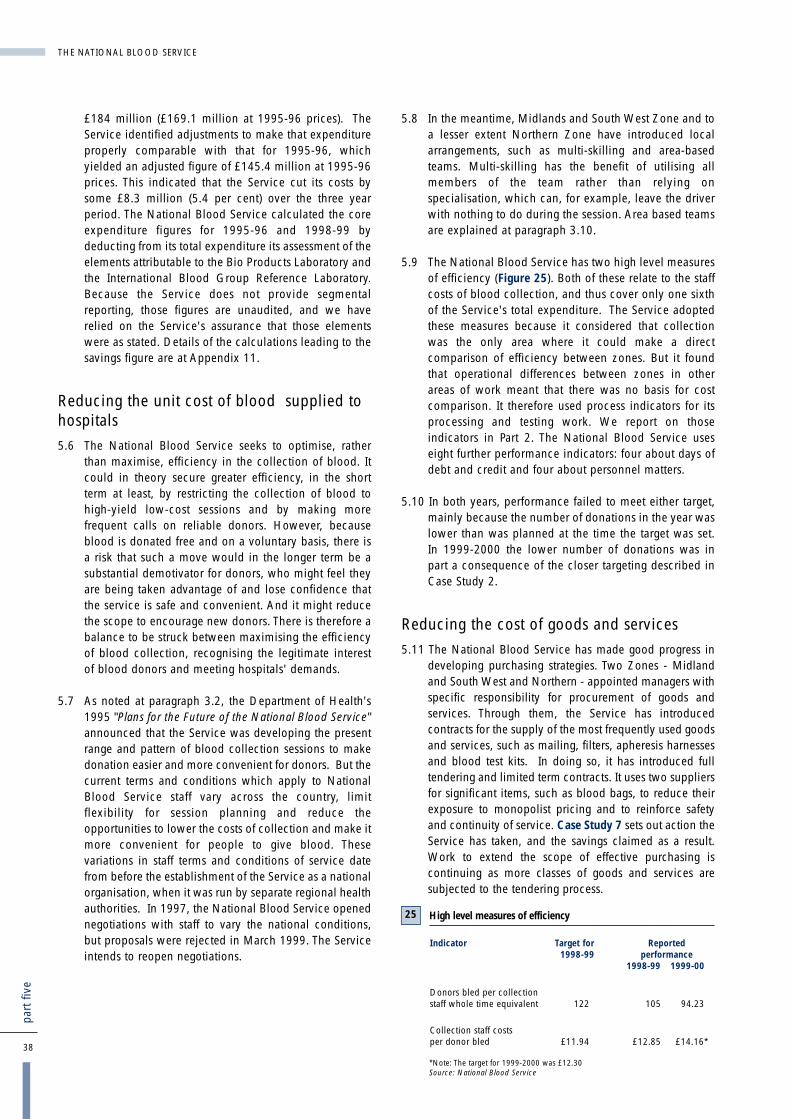
38
part
five
THE NATIONAL BLOOD SERVICE
£184 million (£169.1 million at 1995-96 prices). TheService identified adjustments to make that expenditureproperly comparable with that for 1995-96, whichyielded an adjusted figure of £145.4 million at 1995-96prices. This indicated that the Service cut its costs bysome £8.3 million (5.4 per cent) over the three yearperiod. The National Blood Service calculated the coreexpenditure figures for 1995-96 and 1998-99 bydeducting from its total expenditure its assessment of theelements attributable to the Bio Products Laboratory andthe International Blood Group Reference Laboratory.Because the Service does not provide segmentalreporting, those figures are unaudited, and we haverelied on the Service's assurance that those elementswere as stated. Details of the calculations leading to thesavings figure are at Appendix 11.
Reducing the unit cost of blood supplied tohospitals
5.6 The National Blood Service seeks to optimise, ratherthan maximise, efficiency in the collection of blood. Itcould in theory secure greater efficiency, in the shortterm at least, by restricting the collection of blood tohigh-yield low-cost sessions and by making morefrequent calls on reliable donors. However, becauseblood is donated free and on a voluntary basis, there isa risk that such a move would in the longer term be asubstantial demotivator for donors, who might feel theyare being taken advantage of and lose confidence thatthe service is safe and convenient. And it might reducethe scope to encourage new donors. There is therefore abalance to be struck between maximising the efficiencyof blood collection, recognising the legitimate interestof blood donors and meeting hospitals' demands.
5.7 As noted at paragraph 3.2, the Department of Health's1995 "Plans for the Future of the National Blood Service"announced that the Service was developing the presentrange and pattern of blood collection sessions to makedonation easier and more convenient for donors. But thecurrent terms and conditions which apply to NationalBlood Service staff vary across the country, limitflexibility for session planning and reduce theopportunities to lower the costs of collection and make itmore convenient for people to give blood. Thesevariations in staff terms and conditions of service datefrom before the establishment of the Service as a nationalorganisation, when it was run by separate regional healthauthorities. In 1997, the National Blood Service openednegotiations with staff to vary the national conditions,but proposals were rejected in March 1999. The Serviceintends to reopen negotiations.
5.8 In the meantime, Midlands and South West Zone and toa lesser extent Northern Zone have introduced localarrangements, such as multi-skilling and area-basedteams. Multi-skilling has the benefit of utilising allmembers of the team rather than relying onspecialisation, which can, for example, leave the driverwith nothing to do during the session. Area based teamsare explained at paragraph 3.10.
5.9 The National Blood Service has two high level measuresof efficiency (Figure 25). Both of these relate to the staffcosts of blood collection, and thus cover only one sixthof the Service's total expenditure. The Service adoptedthese measures because it considered that collectionwas the only area where it could make a directcomparison of efficiency between zones. But it foundthat operational differences between zones in otherareas of work meant that there was no basis for costcomparison. It therefore used process indicators for itsprocessing and testing work. We report on thoseindicators in Part 2. The National Blood Service useseight further performance indicators: four about days ofdebt and credit and four about personnel matters.
5.10 In both years, performance failed to meet either target,mainly because the number of donations in the year waslower than was planned at the time the target was set.In 1999-2000 the lower number of donations was inpart a consequence of the closer targeting described inCase Study 2.
Reducing the cost of goods and services
5.11 The National Blood Service has made good progress indeveloping purchasing strategies. Two Zones - Midlandand South West and Northern - appointed managers withspecific responsibility for procurement of goods andservices. Through them, the Service has introducedcontracts for the supply of the most frequently used goodsand services, such as mailing, filters, apheresis harnessesand blood test kits. In doing so, it has introduced fulltendering and limited term contracts. It uses two suppliersfor significant items, such as blood bags, to reduce theirexposure to monopolist pricing and to reinforce safetyand continuity of service. Case Study 7 sets out action theService has taken, and the savings claimed as a result.Work to extend the scope of effective purchasing iscontinuing as more classes of goods and services aresubjected to the tendering process.
High level measures of efficiency
Indicator Target for Reported 1998-99 performance
1998-99 1999-00
Donors bled per collectionstaff whole time equivalent 122 105 94.23
Collection staff costsper donor bled £11.94 £12.85 £14.16*
*Note: The target for 1999-2000 was £12.30Source: National Blood Service
25

THE NATIONAL BLOOD SERVICE
39
part
five
Reducing national prices
5.12 The NHS Executive set up the National CommissioningGroup for Blood in 1998, when they had taken thedecision to move to national pricing for blood. TheGroup's initial role in relation to prices was torecommend the prices to be applied nationally in 1999-2000. In subsequent years, it was to review annually, byearly autumn, the pricing of blood components. It was todo so by carrying out a recosting exercise taking accountof the provision for inflation, new developments andstrategic changes in service provision.
5.13 Figure 26 summarises the recosting exercise for the 2000-01 national price for red cells, showing how the increasefrom 1999-2000 to 2000-01 was arrived at. Negotiatingprices for blood components provides a mechanism forputting pressure on the National Blood Service toimprove its efficiency. Negotiations over the Service'sprices for 2000-2001 provided the forum for agreeing afour per cent cash releasing efficiency saving. TheNational Blood Service was to achieve that savingthrough improvements in procurement practice (see alsoparagraph 5.11). The saving is shown at line 2 of the"savings" section of Figure 25.
Does the National Blood Servicemake use of internal and externalbenchmarking?
Internal cost comparisons
5.14 The Service's three zones calculate unit costs for acommon list of main activities. Although these costs arecompared within zones, there was little evidence ofcomparisons between zones. Our review of their unitcosts for a quarter during 1998-99 showed considerablevariations in the unit costs calculated by the three zonesfor the Service's key components (Figure 27). Forexample, recovered platelets cost over 80 per cent moreto produce in the Northern Zone than in the London andSouth East Zone. However, unit costs for the highestvolume component, red cells in additive solution, arequite similar in each zone.
Movement in prices for red cells between 1999-2000 and 2000-01
Per cent £ £
1999-2000 Baseline 100.00 78.88National Price
Savings
Research and 0.6 -0.47Development Reduction
Cash releasing efficiency saving: 4.4 -3.50National Procurement Savings
Waiting List Initiatives: 2.4 -1.90Non-Recurring Costs
-5.87
Approved Developments
Employers Pension Costs 0.5 0.45Universal Leucodepletion: 7.2 5.67
Full Year EffectNational Call Centre 1.2 0.93Demand Reduction for Red Cells 0.6 0.48GDP Deflator (Inflation) 2.5 1.96
9.49
2000-01 Baseline National Price 104.6 82.50
Source: National Blood Service
26
Case Study 7: Purchasing
When the National Blood Service was established, major items,such as blood packs, were procured through the NHS SuppliesAuthority. Blood centres undertook most other purchasing.
Action takenIn 1996, Midlands and South West Zone appointed a ZonalPurchasing and Supplies Manager. She focused initially oninviting tenders and awarding contracts for supplying goods andservices that had formerly been purchased by the blood centres.The centres now undertake very little direct purchasing. Thechange from local to zonal purchasing led to some teethingproblems, but these have now been largely overcome.
In addition to setting up new contracts for supply, the Zone:
� reduced its stock holdings;� improved its invoice processing to ensure that it can take
advantage of prompt payment discounts.
Importantly, the acquisition of purchasing expertise here and in theNorthern Zone enabled the Service to use its national scale toadvantage. And, in some cases where goods and services hadbeen obtained through the NHS Supplies Authority or nationalcontracts, one of those zones, with the agreement of the othertwo, negotiated new national contracts.
SavingsThe Service has identified the following annual savings as havingbeen achieved through its focus on effective purchasing:
Blood packs £3,000,000
Wafers £130,000
Sample tubes £67,000
Disposable tips for £51,000Nucleic Acid Testing
Source: National Blood Service

5.15 There is sufficient range of unit costs to supportcomparisons between zones; and the National BloodService has been working towards common definitionsfor costs. However, there remain some difficulties ininterpreting such comparisons, largely arising fromdifferences in overheads such as accommodation costs.For example the Northern Zone (where the estate ofbuildings, installations and fittings is valued at£25.5 million) generally has higher capital costs thanthe Midlands and South West (£10.5 million).
Comparisons with other blood suppliers
5.16 The 1994 Bain report made international comparisonsof the total blood transfusion service cost per donation.Those comparisons indicated that the National BloodService was among the cheapest blood services in theworld, but Bain & Co were unable to make accurateinternational comparisons of processing, distributionand overall costs. The Service has not undertaken anyfurther international comparisons, nor has it madecomparisons with other organisations involved insimilar collection, testing and distribution activities.
5.17 Cost comparisons are difficult to make, and the resultsare not necessarily informative. Complications arisefrom differences in blood transfusion services’accounting structures; the nature and scope of thecollection, processing and testing they undertake,including whether they leucodeplete bloodcomponents; and the mix of components and servicesthey supply. And there are wider complications, such asdifferences in the cost of living.
5.18 Comparisons of practice are, however, possible; andhave the potential to yield useful results. We made somecomparisons and found, for example, that some bloodtransfusion services used incentives, such as lotteries, toattract donors; and that one made considerable use oftrained volunteers.
Do the National Blood Service'sperformance indicators provide anadequate basis for managing thebusiness?5.19 The National Blood Service uses 28 performance indicators
for measuring achievement against targets (Appendix 7).
5.20 As senior managers in the Service acknowledge, theindicators have a number of weaknesses:
� The most important measure of meeting hospitaldemand - the ratio of orders met to orders placed -has been confounded by an element of doublecounting during times of shortage (paragraphs 2.5and 2.6).
� There are no indicators for important aspects of theService's work, such as accuracy and timeliness ofnon-emergency deliveries (paragraphs 2.15 and2.16), safety (paragraph 4.2), the quality ofcomponents and services (paragraphs 4.12 and4.15), or for responsiveness to donors or users'complaints (paragraphs 3.15 and 2.41).
� The measures of efficiency cover only the staff costsof collection of blood from donors (paragraph 5.9).
� Some of the high level indicators, although essentialfor operational managers, are more detailed than isrequired for the purposes of the NHS Executive andthe National Blood Service's Board. For example,there are four indicators relating to process losses,one of which measures all process losses andwastage within the National Blood Service, whilethe others focus on losses at interim stages.
� There are very few client-focused indicators.Although the National Blood Service is anorganisation providing a service to hospitals, itsperformance indicators are not, and were notintended to be, client-orientated. Our census ofhospitals listed the main indicators and asked whichwere useful to users. Only half of the hospitals wereaware of the indicators, and eighty per cent thoughtthe demand met indicator was useful. The only otherindicators that attracted strong support were deliveryof emergency blood within two hours (72 per cent)and National Blood Service involvement intransfusion committees (40 per cent).
40
part
five
THE NATIONAL BLOOD SERVICE
Zonal unit costs of main components, for the quarter ending 31 December 1998
Component London & Midlands & Northern Ratio ofSouth East South West unit costs highest unitunit costs unit costs (£) cost to
(£) (£) lowest unitcost
Red cells in additive solution 49.76 42.36 46.86 1 to 1.17
Platelets (recovered pooled) 31.75 32.50 57.38 1 to 1.81
Platelets (by apheresis, Haemonetics*) 210.81 177.72 223.39 1 to 1.26
Platelets 190.62 127.64 155.21 1 to 1.49(by apheresis,Cobe*)
Fresh Frozen Plasma 15.58 10.61 10.88 1 to 1.47
Key to highlights Lowest Middle Highest
Source: National Audit Office analysis of National Blood Service data
* Haemonetics and Cobe are brands of apheresis machine. The National Blood Machine has a policy of not relying on the products of a single manaufacturer.
27
5.21 The National Blood Service acknowledges that there isscope to improve its performance measurement system.In early 1999, an internal working party proposed newperformance indicators for donor services. Butrecommendations were overtaken by proposals forfurther reorganisation and the Service therefore decidedto continue with existing performance indicators untilthe new structure was in place.
THE NATIONAL BLOOD SERVICE
41
part
five

42
appe
ndix
one
THE NATIONAL BLOOD SERVICE
� Red cells in additive solution, buffy coat removed
� Red cells in additive solution, leucocyte depleted
� Red cells in additive solution, leucocyte depleted, neonatal split
� Red cells for intra-uterine transfusion
� Red cells for exchange transfusion
� Red cells washed
� Whole blood
� Platelets apheresed, leucocyte depleted
� Platelets apheresed, HLA matched
� Platelets apheresed, HPA matched
� Platelets pooled, leucocyte depleted
� Platelets, leucocyte depleted, washed
� Platelets apheresed, leucocyte depleted, neonatal split
� Platelets apheresed for intra-uterine transfusion
� Leucocytes apheresed
� Fresh Frozen Plasma
� Fresh Frozen Plasma, neonatal split
� Cryoprecipitate
� Plasma, cryoprecipitate depleted
Appendix 1 Major forms of blood components suppliedby the National Blood Service

THE NATIONAL BLOOD SERVICE
43
appe
ndix
two
1 In August 1997, the Secretary of State for Healthappointed Professor John Cash to lead a review of theclinical concerns raised about proposals for the transferof bulk processing and testing of blood from Liverpoolto Manchester. In particular he was to examine whetherthe proposals:
� guaranteed the safety and reliability of bloodcomponents to hospitals on Merseyside and inNorth Wales;
� satisfied legitimate concerns raised by localclinicians; and
� provided adequate support for the provision anddevelopment of high quality clinical services inthose areas.
2 In his final report, Professor Cash:
� summarised the background to the National BloodService's policy of reducing the overall number ofblood processing and testing centres;
� assessed the National Blood Service's specific plansfor the Merseyside and North Wales Centre againstthe three headings in the terms of reference, makinga number of recommendations designed to enhancethe Centre's continuing contribution to local healthcare;
� highlighted some wider issues raised by the review.
3 The main recommendations specific to the plannedmerger were:
� the transfer should go ahead for reasons of patientsafety, but should be closely monitored, bothoperationally and financially, for a year beforefurther review;
� the National Blood Service, NHS Executive andother local stakeholders should work together todevelop an action plan to improve substantially thephysical state, and the medical and technicalfunctions, of the Liverpool Blood Centre, includingits future management arrangements;
� the National Blood Service should set out andpublicise the arrangements for ensuring that there isan appropriate clinical consultation service for localclinicians;
� the National Blood Service should urgently reviewwhat further action might be needed to encouragenew donor registrations and renew the confidenceof people in the work of the Service locally.
4 The review included visits to other zones of the NBS thathad completed similar mergers, and Professor Cashconsidered that these threw up issues of wider concernabout the overall management of the Service, inparticular:
� the relationship of the service to the wider NHS hadbecome more distant with the creation of a nationalservice, a process reinforced by the contractualaspects of the internal market;
� the National Blood Service's functionalmanagement structure needed urgent review andmanagement at all levels was showing signs ofoverload arising from internal re-organisation, to thedetriment of relationships with users and donors;
� overall savings from the merger policy would bemodest, and not without risk of damage to services.Proposals to merge operations at Bristol andPlymouth should be looked at in this light. Andsavings claimed need to be backed up by goodrelevant performance information;
� there was scope for improving communicationsbetween the National Blood Service and the NHSExecutive and tightening accountabilityarrangements;
� the generally disappointing contribution tomanagement effectiveness made by the NBA Board,and the management style of some seniormanagement, was a cause for concern;
� there was a need to strengthen the effectiveness ofthe National Blood Service Users Group;
� following devolution, there was a case for strongerliaison, particularly with the Welsh Blood Service,but also with the Scottish Blood Service.
5 In September 1997, the Secretary of State for Healthappointed Professor Alastair Bellingham as TransitionDirector in Liverpool. Professor Bellingham was askedto make recommendations for the blood service inMerseyside based on both his findings and therecommendations in the Cash Report. His report,published in February 1999, made a number ofrecommendations to improve services locally andconcluded that:
� there was a need for a blood centre in Liverpool;
Appendix 2 Independent review of proposals for thetransfer of bulk blood processing and testingfrom Liverpool to Manchester
� new and developing technologies and expertise nowrequired at the Liverpool Blood Centre wouldprovide an increasing workload and an adequatestaff base, and offered the chance for the Centre tobe in the forefront of developments in bloodtransfusion practice;
� the transfer of testing and bulk processing toManchester had not been detrimental to routineblood supplies as measured by either quality ortimeliness.
6 In publishing the report, the Secretary of State:
� asked the National Blood Service to ensure thatProfessor Bellingham's recommendations were putinto effect;
� promised significant investment in structuralimprovement for the Liverpool Blood Centre;
� accepted that testing and bulk processing of bloodshould not return to Liverpool;
� concluded that the concerns raised in the CashReport had now been addressed.
44
appe
ndix
two
THE NATIONAL BLOOD SERVICE
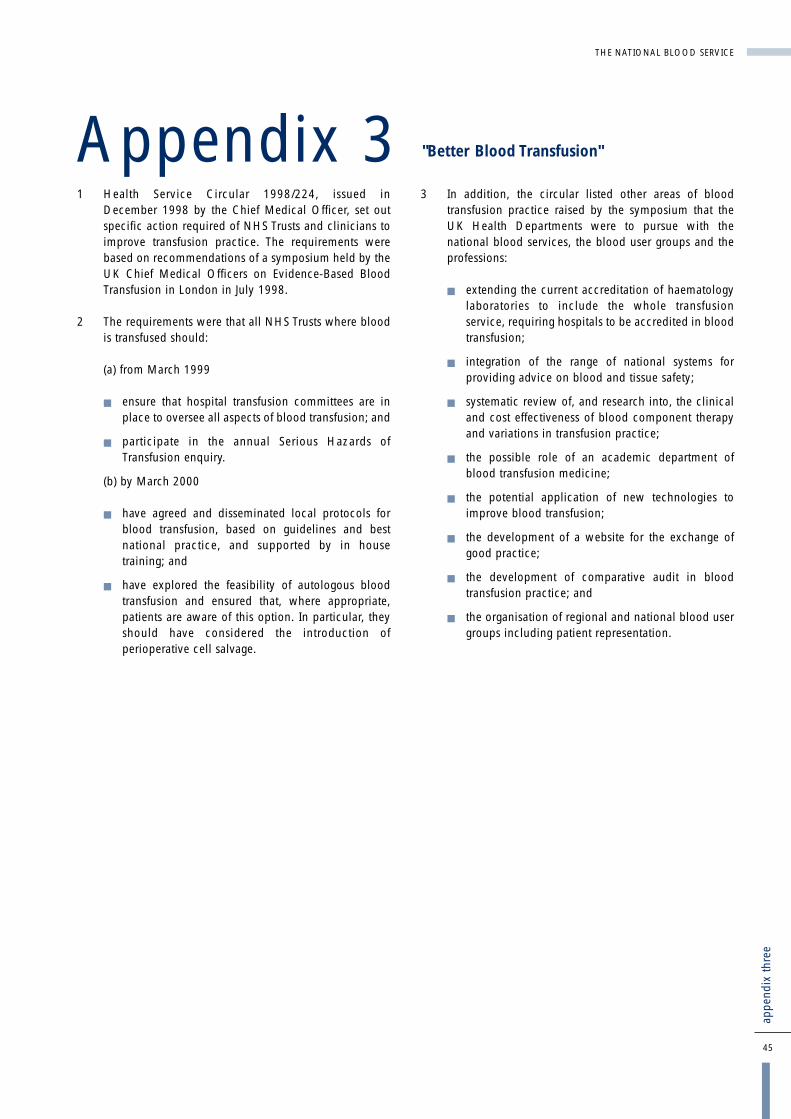
THE NATIONAL BLOOD SERVICE
45
appe
ndix
thre
e
1 Health Service Circular 1998/224, issued inDecember 1998 by the Chief Medical Officer, set outspecific action required of NHS Trusts and clinicians toimprove transfusion practice. The requirements werebased on recommendations of a symposium held by theUK Chief Medical Officers on Evidence-Based BloodTransfusion in London in July 1998.
2 The requirements were that all NHS Trusts where bloodis transfused should:
(a) from March 1999
� ensure that hospital transfusion committees are inplace to oversee all aspects of blood transfusion; and
� participate in the annual Serious Hazards ofTransfusion enquiry.
(b) by March 2000
� have agreed and disseminated local protocols forblood transfusion, based on guidelines and bestnational practice, and supported by in housetraining; and
� have explored the feasibility of autologous bloodtransfusion and ensured that, where appropriate,patients are aware of this option. In particular, theyshould have considered the introduction ofperioperative cell salvage.
3 In addition, the circular listed other areas of bloodtransfusion practice raised by the symposium that theUK Health Departments were to pursue with thenational blood services, the blood user groups and theprofessions:
� extending the current accreditation of haematologylaboratories to include the whole transfusionservice, requiring hospitals to be accredited in bloodtransfusion;
� integration of the range of national systems forproviding advice on blood and tissue safety;
� systematic review of, and research into, the clinicaland cost effectiveness of blood component therapyand variations in transfusion practice;
� the possible role of an academic department ofblood transfusion medicine;
� the potential application of new technologies toimprove blood transfusion;
� the development of a website for the exchange ofgood practice;
� the development of comparative audit in bloodtransfusion practice; and
� the organisation of regional and national blood usergroups including patient representation.
Appendix 3 "Better Blood Transfusion"

46
appe
ndix
four
THE NATIONAL BLOOD SERVICE
March 1993 Publication of Statutory Instrument 587 of 1993 (The National Blood Authority (Establishment andConstitution) Order 1993), enabling the establishment of the National Blood Authority
April 1993 National Blood Authority established as a special health authority
July 1993 The National Blood Service commissioned Bain & Company to create the blueprint to carry the NationalBlood Service forward for the next 20 years
March 1994 Publication of Statutory Instrument 589 of 1994 (The National Blood Authority (Establishment andConstitution) Amendment Order 1994), enabling the transfer of blood centres from regional healthauthorities to the National Blood Authority on 1 April 1994
June 1994 Bain & Company reported their findings to the National Blood Service
November 1995 The Department of Health published "Plans for the future of the National Blood Service"
The Department of Health established the National Blood Service Users Group
August 1997 The Secretary of State for Health appointed Professor John Cash to review proposals to transfer theprocessing and testing of blood from Liverpool to Manchester
March 1998 The Department of Health published Professor Cash's report
March 1998 The Secretary of State for Health appointed the current Chairman of National Blood Authority
July 1998 The government announced that it would extend the use of leucodepletion for all blood destined fortransfusion
Autumn 1998 The Treasury, the Scottish Office and the Department of Health established a joint review of UK bloodproduct manufacturing
October 1998 The current chief executive of the National Blood Authority took up post
December 1998 The Department of Health issued their health service circular “Better Blood Transfusion”
April 1999 Implementation of national pricing and the national service level agreement
October 1999 Target date for leucodepletion of all blood destined for transfusion
Appendix 4 Chronology of main events referred to inthis report

THE NATIONAL BLOOD SERVICE
47
appe
ndix
five
1 The bulk of the evidence used in this report wascollected in 1999 through:
� a census of blood bank heads at NHS Trusts;
� a survey of the public to determine attitudes towardsblood donation;
� interviews and examination of documentation at theNHS Executive, the National Blood Serviceheadquarters and at its zones and blood centres;
� a review of existing donor research;
� a comparison of the Service's cost-effectiveness in1994-95 and 1998-99;
� reliance on the work of the Medicines ControlAgency.
Census of blood bank heads at NHS Trusts
2 We obtained information from a postal census of bloodbank heads, using a questionnaire. We piloted thequestionnaire with 20 blood bank heads. We sent thequestionnaires for the census to blood bank heads on29 January 1999. All of the heads of the 223 bloodbanks we identified responded. The number of bloodbanks differs from the number of hospitals transfusingblood, because a blood bank may serve more than onehospital. A blood bank head is the person in charge ofthe management of a hospital blood bank. That personmay be either a consultant haematologist or a seniormedical laboratory officer, depending on the hospital'sorganisational structure.
3 The questionnaire asked for data about supply of bloodcomponents, safety, diagnostic and other transfusion-related services, advice and expertise and theresponsiveness of the National Blood Service. Withinthose heads the questionnaire repeated a number of thequestions the Blood Service's consultants, Bain & Co,asked in 1994. And it replicated their approach toobtaining respondent's rating of the Blood Service'sperformance (a scale of one to 10, where one representspoor, and 10 excellent) to enable us to make directcomparisons.
Survey of the public to determine attitudestowards blood donation
4 We commissioned a survey of the public, from Ipsos-RSL. Appendix 8 sets out the sampling methodology.The purpose of the survey was to identify attitudes ofdonors, lapsed donors and non-donors towardsdonation.
5 The questions asked were:
� To all aged 17 to 69:
� Have you ever given blood?
� How likely are you to give blood in the futu
� Is there a continuing need for blood donors?
� How would you arrange to give blood?
� Are you aware of the national (0345) numberyou can call?
� To all who have ever given blood:
� Where do/have you usually given blood?
� When did you last give blood?
� When did you first give blood?
� How often do/did you give blood?
� What was the main obstacle you overcame inorder to give blood?
� To all who have never given blood, or have notgiven it recently
� What would make you more likely to giveblood?
� Why have you not given blood recently?
Interviews and examination of documentationat the NHS Executive, the National BloodService headquarters and at its zones andblood centres
6. We interviewed a total of more than 70 key staff at theNHS Executive, at the National Blood Serviceheadquarters at Watford; at each of the three zonalheadquarters; at each of the 15 blood centres; and at theInternational Blood Group Reference Laboratory,Bristol.
7. We examined documentation at those sites relating toblood collection and demand, distribution, quality,safety, performance indicators, costing, research anddevelopment, accountability and responsiveness.
Appendix 5 Study Methodology
48
appe
ndix
five
THE NATIONAL BLOOD SERVICE
Review of existing donor research
8. We reviewed the reports of all major donor researchwork commissioned for the Blood Service andconducted since 1989.
Cost-effectiveness of the National BloodService
9. We compared the Service's expenditure on its corebusiness in 1994-95 and 1998-99. The detailedcalculation is set out in Appendix 11.
Reliance on the work of the MedicinesControl Agency
10. The Agency's role is to safeguard public health byensuring that all medicines on the UK market meetappropriate standards of safety, quality and efficacy. Itachieves this through a system of licensing, inspection,enforcement and post-marketing surveillance. TheNational Blood Service's activities have to comply withthe Medicines Act 1968. The Agency's purpose ininspecting National Blood Service sites is to ensure thatblood centres are operating in compliance with that Actand with the principles of good manufacturing practice.It inspects and licenses the National Blood Service'scollection, processing, testing and storage activities. Allof the Blood Service's blood centres are approved forincluding in the National Blood Service'smanufacturer's "specials" licence.
11. We examined the Agency's 1998 reports on bloodcentres, as held by the Blood Service; and discussedwith the Agency our interpretation of those reports andthe methodology they used.
12. We used other evidence to establish how the BloodService ensured that it was operating safely, and to findthe number of deaths related to unsafe blood. But werelied on the work of the Medicines Control Agency forassurance that the safety procedures were sufficient andwere operated properly.
THE NATIONAL BLOOD SERVICE
49
appe
ndix
six
We are grateful to the following people, who advised us either on the study as a whole or on specific aspects.
Dr Paula Bolton-Maggs Chairman of the Paediatric Haematology Forum, Royal College of Paediatrics andChild Health
Professor John Cash President of the British Blood Transfusion Society
Dr Hannah Cohen Chairman of Serious Hazards of Transfusion working party, and ConsultantHaematologist at University College London
Mr Michael Farley Woodstock Marketing (nominated by the Chartered Institute of MarketingConsultancy Services)
Professor Ian Gilmour Registrar, Royal College of Physicians of London
Professor Edward Gordon Smith Chairman of the National Transfusion User Group (and formerly Chairman of theNational Blood Service Users Group)
Dr L A Kay Consultant Haematologist, HCA/Hospitals Central London (private sector)
Dr Paul Kelsey Chairman of the Blood Transfusion Task Force of the British Committee forStandards in Haematology
Professor J S Lilleyman President, The Royal College of Pathologists
Professor J S P Lumley Professor of Surgery, Vascular Unit, St Bartholomew's Hospital (nominated by theRoyal College of Surgeons)
Dr Isobel Walker British Society for Haematology
Appendix 6 Expert advice

50
appe
ndix
sev
en
THE NATIONAL BLOOD SERVICE
Performance indicators relating to Part 2 of this reportIndicator 1998-99 1998-99 1999-2000
Target Reported Reportedperformance performance
The Service's success in meeting hospital demand
Meet hospital demand 99.51% 93.78% 99.76%
Emergency deliveries within two hours 100% 99.82% 99.81%
Wastage/loss of blood between bleeding donors and issuing blood components to hospitals
Percentage of red cells outdated at centres 0.76% 0.36% 0.56%
Percentage of completed donations to donors bled 98.02% 98% 98.16%
Percentage of units banked to donors bled 94.94% 93.74% 95.03%
Percentage of clinical issues to donors bled 94.34% 92.32% 93.25%
Promotion of optimal use of blood in hospitals
Percentage of NHS hospitals with a hospital 64% 81% 90.98%Transfusion Committee
Percentage of hospital transfusion committees with 92% 93% 93.97%National Blood Service consultant representation
Attendance at hospital transfusion committees 160 371 470
Number of audits undertaken at NHS hospitals 96 67 56
Number of NHS hospitals involved with 160 210 239at least one audit
Teaching activities - hours No target 958 902
Performance indicators relating to Part 3 of this reportIndicator 1998-99 1998-99 1999-2000
Target Reported Reportedperformance performance
Collection
Percentage of donors bled to target 100% 96.29% 97.06%
New donors enrolled 318,750 408,043 442,550
New donors attending (bled) 285,000 279,409 268,739
Lapsed donors 297,189 218,116 196,863
Donor care
Percentage of donors waiting longer than30 minutes before registration and screening 7.3% 6% 9.14%
Percentage of donors taking more than 40 minutes to reach bleed bed 9.8% 8.7% 10.29%
Percentage of donors satisfied (measured through satisfaction survey) 90% 93.5% 99.68%
Appendix 7 Performance indicators used by theNational Blood Service
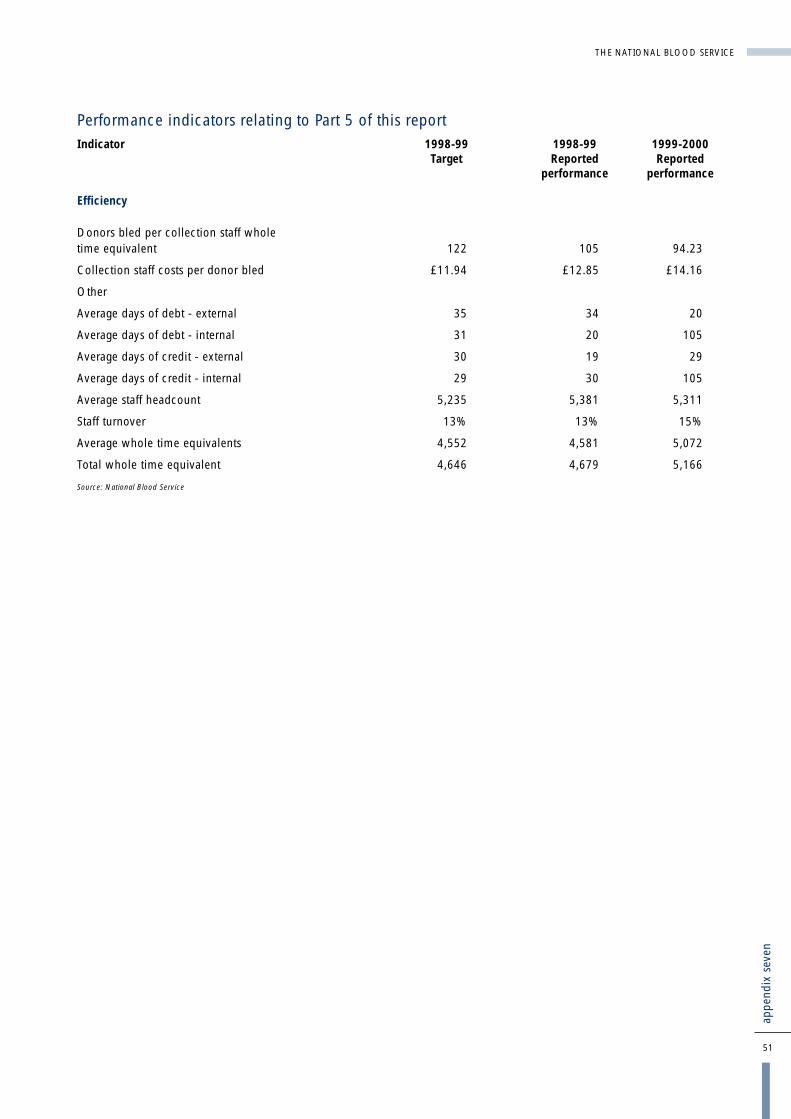
THE NATIONAL BLOOD SERVICE
51
appe
ndix
sev
en
Performance indicators relating to Part 5 of this reportIndicator 1998-99 1998-99 1999-2000
Target Reported Reportedperformance performance
Efficiency
Donors bled per collection staff whole time equivalent 122 105 94.23
Collection staff costs per donor bled £11.94 £12.85 £14.16
Other
Average days of debt - external 35 34 20
Average days of debt - internal 31 20 105
Average days of credit - external 30 19 29
Average days of credit - internal 29 30 105
Average staff headcount 5,235 5,381 5,311
Staff turnover 13% 13% 15%
Average whole time equivalents 4,552 4,581 5,072
Total whole time equivalent 4,646 4,679 5,166
Source: National Blood Service
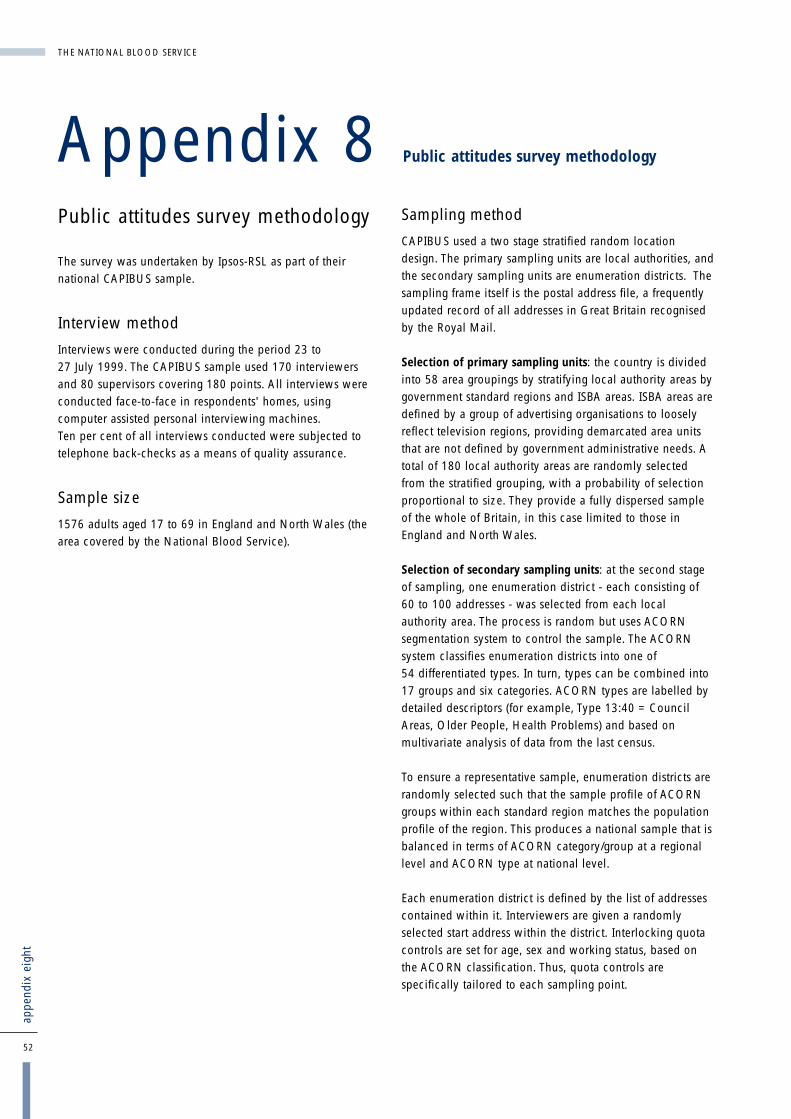
52
THE NATIONAL BLOOD SERVICE
Public attitudes survey methodology
The survey was undertaken by Ipsos-RSL as part of theirnational CAPIBUS sample.
Interview method
Interviews were conducted during the period 23 to27 July 1999. The CAPIBUS sample used 170 interviewersand 80 supervisors covering 180 points. All interviews wereconducted face-to-face in respondents' homes, usingcomputer assisted personal interviewing machines.Ten per cent of all interviews conducted were subjected totelephone back-checks as a means of quality assurance.
Sample size
1576 adults aged 17 to 69 in England and North Wales (thearea covered by the National Blood Service).
Sampling method
CAPIBUS used a two stage stratified random locationdesign. The primary sampling units are local authorities, andthe secondary sampling units are enumeration districts. Thesampling frame itself is the postal address file, a frequentlyupdated record of all addresses in Great Britain recognisedby the Royal Mail.
Selection of primary sampling units: the country is dividedinto 58 area groupings by stratifying local authority areas bygovernment standard regions and ISBA areas. ISBA areas aredefined by a group of advertising organisations to looselyreflect television regions, providing demarcated area unitsthat are not defined by government administrative needs. Atotal of 180 local authority areas are randomly selectedfrom the stratified grouping, with a probability of selectionproportional to size. They provide a fully dispersed sampleof the whole of Britain, in this case limited to those inEngland and North Wales.
Selection of secondary sampling units: at the second stageof sampling, one enumeration district - each consisting of60 to 100 addresses - was selected from each localauthority area. The process is random but uses ACORNsegmentation system to control the sample. The ACORNsystem classifies enumeration districts into one of54 differentiated types. In turn, types can be combined into17 groups and six categories. ACORN types are labelled bydetailed descriptors (for example, Type 13:40 = CouncilAreas, Older People, Health Problems) and based onmultivariate analysis of data from the last census.
To ensure a representative sample, enumeration districts arerandomly selected such that the sample profile of ACORNgroups within each standard region matches the populationprofile of the region. This produces a national sample that isbalanced in terms of ACORN category/group at a regionallevel and ACORN type at national level.
Each enumeration district is defined by the list of addressescontained within it. Interviewers are given a randomlyselected start address within the district. Interlocking quotacontrols are set for age, sex and working status, based onthe ACORN classification. Thus, quota controls arespecifically tailored to each sampling point.
Appendix 8 Public attitudes survey methodology
appe
ndix
eig
ht

THE NATIONAL BLOOD SERVICE
53
appe
ndix
nin
e
Area of business
Collection
Processing
Testing
Key processes
Donor screening foreligibility
Bleeding of donors andtransport of blood to centres
General handling of donors(customer care)
Manufacturing procedures
Blood grouping, extendedphenotyping, screening forinfection
Independent qualityassurance provided by:
National Blood Servicemedical staff are responsiblefor overseeing the applicationof the Medical Assessment ofDonors guidelines. TheNational Blood Service'sDirector of Medical Servicesproposes to develop a systemof clinical audit that willprovide improved assuranceon the operation of theMedical Assessment ofDonors guidelines. MedicinesControl Agency tests whethersession documentation isproperly handled.
The Medicines ControlAgency carries outinspections to confirm thatthese processes meetacceptable standards of GoodManufacturing Practice
None. National Blood Servicecomplaints procedures andquality assurancequestionnaires provideinternal assurance
The Medicines ControlAgency carries outinspections to confirm thatthese processes meetacceptable standards of GoodManufacturing Practice
Use of the National Institutefor Biological Standards andControl’s defined referencematerials and expertise atanalysing test data allows theNational Blood Service tomonitor the performance oflaboratory testing equipment,personnel and overallaccuracy of virologyscreening
The National Blood Serviceparticipates in NationalExternal Quality AssuranceSchemes that test thecompetence of laboratorytesting equipment, personneland accuracy of bloodgrouping, screening andphenotyping.
The Medicines ControlAgency takes account of theuse of the National Institutefor Biological Standards andControl’s reference materialsand NIBSC’s data analysis inthe Agency’s assessment oftesting with respect toconformance with GoodManufacturing Practice
Main Findings in 1999
Donor ID cards were foundto have the correct eyereadable information, butincorrect bar codes.
Instances occurred whereblood bags had too little, ortoo much, anticoagulant.
No incidents requiringnational remedial action
No incidents requiringnational remedial action
A problem with software ledto incorrect recording of theresults of virology tests.
Remedial action taken byNational Blood Service1
The Blood Service notified itsstaff to ensure that theycorrectly identified donors.Subsequently the supplierwas able to identify andcorrect the problem. Thiscorrective action was subjectto National Blood Servicesupplier audit to confirm itseffectiveness. No patientswere put at risk as a result ofthis incident.
On each occasion, the BloodService notified its staff andthe manufacturers, who inturn checked bags in stock.And the manufacturers tookcorrective action to prevent arecurrence of the problem.No patients were identifiedas being harmed by theseincidents.
All blood centres werenotified on the day theproblem was found. The firmthat maintains the systeminvestigated and correctedthe problem.
Appendix 9 Ways in which the Blood Service obtainsindependent quality assurance
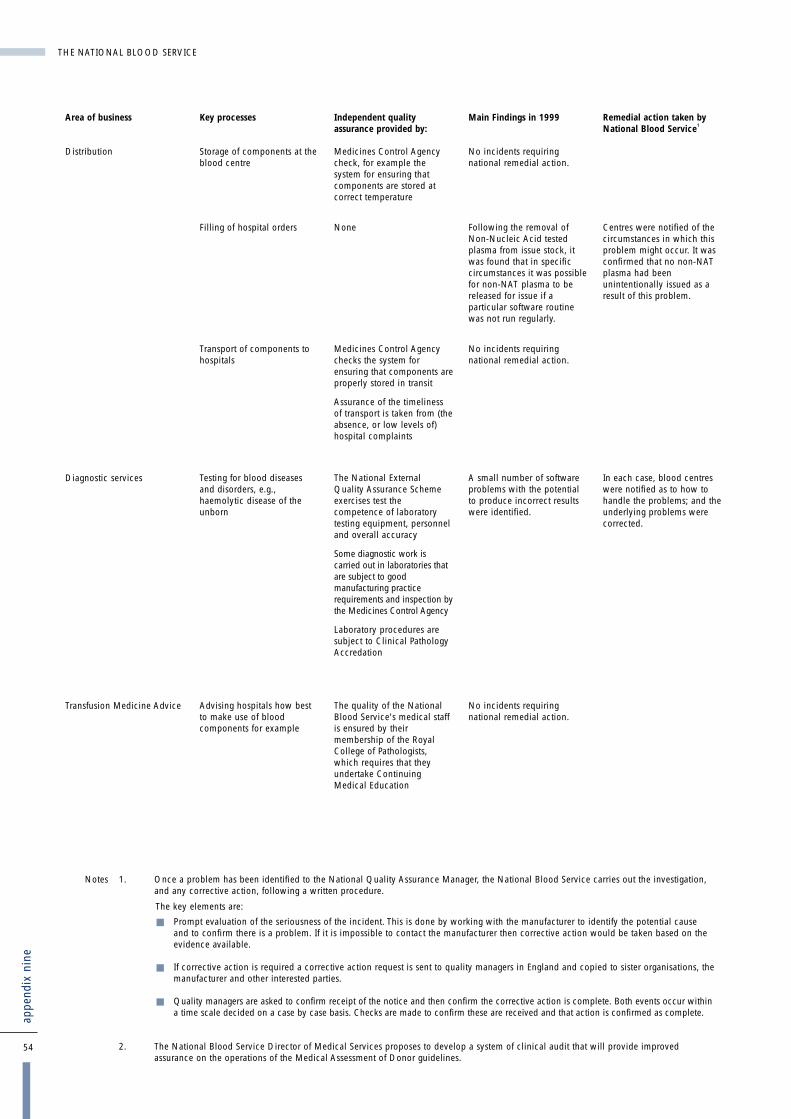
54
THE NATIONAL BLOOD SERVICE
Area of business
Distribution
Diagnostic services
Transfusion Medicine Advice
Key processes
Storage of components at theblood centre
Filling of hospital orders
Transport of components tohospitals
Testing for blood diseasesand disorders, e.g.,haemolytic disease of theunborn
Advising hospitals how bestto make use of bloodcomponents for example
Independent qualityassurance provided by:
Medicines Control Agencycheck, for example thesystem for ensuring thatcomponents are stored atcorrect temperature
None
Medicines Control Agencychecks the system forensuring that components areproperly stored in transit
Assurance of the timelinessof transport is taken from (theabsence, or low levels of)hospital complaints
The National ExternalQuality Assurance Schemeexercises test thecompetence of laboratorytesting equipment, personneland overall accuracy
Some diagnostic work iscarried out in laboratories thatare subject to goodmanufacturing practicerequirements and inspection bythe Medicines Control Agency
Laboratory procedures aresubject to Clinical PathologyAccredation
The quality of the NationalBlood Service's medical staffis ensured by theirmembership of the RoyalCollege of Pathologists,which requires that theyundertake ContinuingMedical Education
Main Findings in 1999
No incidents requiringnational remedial action.
Following the removal ofNon-Nucleic Acid testedplasma from issue stock, itwas found that in specificcircumstances it was possiblefor non-NAT plasma to bereleased for issue if aparticular software routinewas not run regularly.
No incidents requiringnational remedial action.
A small number of softwareproblems with the potentialto produce incorrect resultswere identified.
No incidents requiringnational remedial action.
Remedial action taken byNational Blood Service1
Centres were notified of thecircumstances in which thisproblem might occur. It wasconfirmed that no non-NATplasma had beenunintentionally issued as aresult of this problem.
In each case, blood centreswere notified as to how tohandle the problems; and theunderlying problems werecorrected.
appe
ndix
nin
e
Notes 1. Once a problem has been identified to the National Quality Assurance Manager, the National Blood Service carries out the investigation, and any corrective action, following a written procedure.
2. The National Blood Service Director of Medical Services proposes to develop a system of clinical audit that will provide improved assurance on the operations of the Medical Assessment of Donor guidelines.
The key elements are:
� Prompt evaluation of the seriousness of the incident. This is done by working with the manufacturer to identify the potential cause and to confirm there is a problem. If it is impossible to contact the manufacturer then corrective action would be taken based on the evidence available.
� If corrective action is required a corrective action request is sent to quality managers in England and copied to sister organisations, the manufacturer and other interested parties.
� Quality managers are asked to confirm receipt of the notice and then confirm the corrective action is complete. Both events occur within a time scale decided on a case by case basis. Checks are made to confirm these are received and that action is confirmed as complete.

THE NATIONAL BLOOD SERVICE
55
appe
ndix
ten
Appendix 10 The main components of the NationalBlood Service's Expenditure, 1998-99
Figure 28 sets out the main components of the Service's expenditure in 1998-99. It excludes expenditure on the Bio ProductsLaboratory.
Components of National Blood Service Expenditure, 1998-99
Component Expenditure1998-99£ million
Salaries and Wages 81.5
Consumable Supplies 51.5
Capital Charges 14.0
Staff non-pay costs 6.1
External Contractors 4.5
Maintenance of Buildings 4.0
Rent & Rates 4.0
Transport 3.5
Clinical Negligence 1.9
Telecommunications 1.7
Postage 1.7
Reorganisation costs 1.5
Utilities 1.4
Equipment purchases 1.3
Printing - donor call up 1.1
Advertising 1.0
Hire of halls 1.0
IT 0.6
Other1 1.7
TOTAL 184.0
Note 1. The 'other' figure of £1.7 million includes:
Administrative and office expensesCatering and donor provisionsDonor awards and ceremoniesLegal feesProfessional feesLosses and compensationCleaning and waste disposal
Source: National Blood Service
28

56
THE NATIONAL BLOOD SERVICE
1998-99 1995-96 Noteprices prices
(Note 1)£ million £ million
1995-96 Expenditure 153.700 2
1998-99 Expenditure 184.000 169.142 2
Adjustments to make 1998-99 expenditure properly comparable with that for 1995-96 (new or increased activities). Deduct:
Leucodepletion 9.700 8.917 3
Waiting list initiative/Donor 2000 4.157 3.821 3
Nucleic acid testing 1.657 1.523 3
Tissue and bone banking 1.767 1.624 3
Cord blood banking 0.721 0.663 3
Marginal cost of additional volume of Blood and Components 2.459 2.260 4
Marginal cost of additional volume of Specialist services and other 0.097 4
Additional (locality based) teams to deal with additional workload 2.000 1.839 4
Implementation of Medical Assessment of Donors guidelines 1.372 1.261 4
Clinical negligence provision 1.900 1.747 5
Total adjustments 23.752
Adjusted 1998-99 expenditure (to compare like with like) 145.390
NBS Efficiency savings 1995-96 to 1998-99 (1995-96 expenditure minus adjusted 1998-99 expenditure) 8.310
Notes: 1. We have used the GDP deflator - in this case 91.925 per cent - to convert 1998-99 expenditure to 1995-96 prices.
2. The National Blood Service calculated the expenditure figures for both 1995-96 and 1998-99 by deducting the cost of the Bio Products Laboratory and the International Blood Group Reference Laboratory from the total National Blood Service expenditure. Because the Service does not provide segmental reporting, we are relying on its management assurance that the Bio Products Laboratory and International Blood Group Reference Laboratory elements are as stated.
3. These items represent new activities that were not undertaken in 1995-96.
4. These items represent increases in activity in 1998-99 compared with 1995-96.
5. This item represents an expenditure for which there was no equivalent in 1995-96.
Appendix 11Methodology used to compare the NationalBlood Service's expenditures for 1995-96and 1998-99
appe
ndix
ele
ven
THE NATIONAL BLOOD SERVICE
57
glos
sary
GlossaryA departmental committee chaired by the Deputy Chief Medical Officer that advises thehealth departments of the UK on measures to ensure the microbiological safety of bloodand tissues for transplantation.
Apheresis A donor is connected to a machine that removes the desired component (plasma,platelets, red cells, or combinations of these) from the blood and returns the remainderof the blood to the donor. It can be performed more frequently than whole bloodcollection.
Blood bank A blood bank is the part of the hospital where blood delivered by the National BloodService is held in appropriate conditions pending use within that hospital.
Blood bank head For the purpose of this study, a blood bank head is the person in charge of themanagement of a hospital blood bank. This person may be either a consultanthaematologist or a senior medical laboratory officer, depending on the hospital'sorganisational structure.
Cryoprecipitate A concentrated fraction of plasma containing the major portion of Factor VIII and someother factors.
Cytomegalo Virus (CMV) A virus that is prevalent in the population. Once they are infected, people are carriersfor life. The incidence of carriers increases with age. The infection in healthy people isusually subclinical - they are not apparently ill. The virus is transmitted by transfusion ofblood components and can be lethal if the recipient is immuno-suppressed. New anduntested donors are tested for the presence of the virus to provide a stock of CytomegaloVirus negative blood components for transfusion to patients at risk of infection. The virusis carried in white cells and leucodepletion may reduce the risk of transmission of thevirus.
Hospital transfusion committees Some hospitals have long-established hospital transfusion committees. But the 1998health service circular "Better Blood Transfusion" stated that every hospital where bloodis transfused should have one. It stated that such committees should promote bestpractice; have a key role in clinical practice, clinical audit and feedback and ineducation and training relating to blood transfusion matters; and communicate withblood user groups and patient representatives.
National Blood Stocks Project The aim of this project, in which the National Blood Service is working alongside 22hospitals, is to enable blood stocks to be managed with hospitals in an increasinglycollaborative way. The project started in January 1998 and the Blood Service expects itto become a part of its mainstream activity in 2000-01.
Nucleic acid testing Testing for viral contamination by assessing whether viral DNA is present, rather thantesting for the presence of anti-bodies (which has been standard hitherto). This advancedform of testing eliminates the "window period", that is, the risk of false negative resultscaused by antibodies not having had the time to develop in response to a viral infection.
Paediatric components Components suitable for new-born babies and those under one year old. They requireparticular testing and are in smaller volumes than "normal" components.
Phenotyping A process that tests red blood cells or platelets of donors for the absence of antigens toblood group anti-bodies other than anti-A or anti-B. This allows blood to be selected thatwill be compatible with the recipient.
Plasma The fluid in which blood cells are suspended. It acts as a carrier for the blood cells andcontains factors such as immunoglobin (anti-bodies), albumin and clotting factors.
Advisory Committee on theMicrobiological Safety of bloodand tissues for Transplantation

58
THE NATIONAL BLOOD SERVICE
Platelets Blood cells that are important in the blood clotting process. They are needed wherebone-marrow suppression has occurred as a result of anti-cancer treatment (forexample, treatment against leukaemia) and in cases of massive transfusion to controlbleeding due to surgery or trauma.
Red cells Red cells carry oxygen and make up nearly half the blood volume. Most transfusions areof red cells only.
Stem cell harvesting Stem cells continually grow and develop to produce red and white blood cells andplatelets. They are used for example to treat leukaemia where, following treatment todestroy the recipient's bone marrow, the transfused stem cells establish themselves andreplenish the red and white cells and platelets. They can be collected from peripheralblood, bone marrow and cord blood.
glos
sary

THE NATIONAL BLOOD SERVICE
59
bibl
iogr
aphy
(A) Research into donor attitudes Public survey into experiences of, and attitudes toward, blood donation, Research International RBL, November 1989
A Review of Previous Research on Blood Donation, Heather Wild, April 1996. This research covered:
� Research to develop a communications strategy towards donors, Research International, 1990
� Blood Donation Poster Campaign, COI/Field Management Ltd, 1991
� NBTS Creative Development Research, Andrew Irving, 1992
� UKBTS Information Leaflet, Cragg Ross Dawson, 1992
� Motivations and Attitudes towards Donating Blood The Research Quorum, 1993
� Blood Donation Publicity Monitor - Baseline Survey, RSGB, 1993
� Blood Doning Advertising Creative Development, Andrew Irving, 1993
� UKBTS Safe Blood Leaflet, Cragg Ross Dawson, 1995
� The 18-24 File Byrne and Blunden, 1995
� Magazine Advertising for 18-24s Reflexions, 1995
� The Blood Line. Leaflet Communication Check BJM, 1995
� Europeans and Blood Eurobarometer, 1995
Blood Products: Communication Strategy, BJM Research and Consultancy Ltd, June 1996
Department of Health Blood Donation Publicity Campaign Strategy, Cragg Ross and Dawson Ltd, 30 July 1996
Donors' Charter Qualitative Research, Andrew Irving Associates, August 1996
Blood Donors and Exports, BJM Research and Consultancy Ltd, December 1996
Department of Health Blood Donor Campaign Advertising and Booklet Research, Andrew Irving Associates, 29 May 1997
Altruism and Blood Donation, Sharpe Research Ltd, November 1998
Youth Agenda Wave 1 Research, NOP, January 1999
(B) Other publications referred to, or quoted from, in the reportThe National Blood Authority (Establishment and Constitution) Order 1993, Statutory Instrument 585 of 1993
The National Blood Authority (Establishment and Constitution) Amendment Order 1994, Statutory Instrument 589 of 1994
Independent review of proposals for the transfer of bulk blood processing and testing from Liverpool to Manchester, John Cash,March 1998
Health Service Circular 1998/224, Better Blood Transfusion, Department of Health, December 1998
Plans for the future of the National Blood Service, Department of Health, November 1995
Guide to the preparation, use and quality assurance of blood components, Council of Europe, 1999
Guidelines for the Blood Transfusion Services in the United Kingdom, The United Kingdom Blood Transfusion Services and theNational Institute for Biological Standards and Control, November 1996
Bibliography