the - nasa estimate that our relative systematic error is about equal to our random error, or about...
TRANSCRIPT
Ugh-DSspersion Spectroscopic Observations o f Venus Duricg 1968 and 1969 11. The Carbon-Dioxide Band a t 8689'A
R. A. J. Schorn Physics Department
Texas A&M Univers i ty College S t a t i o n , Texas 77843
A. Woszczyk Astronomical Observatory
Nicolaus Copernicus Univers i ty Torun, Poland
L. 6. ~ r a ~ Young Physics Department
Texas A&M Univers i ty College S t a t i o n , Texas 77843
Report No. 10
The r e s e a r c h descr ibed i n t h i s r e p o r t was funded by t h e
Nat ional Aeronautics and Space Adminis t ra t ion
Contract No. NGR 44-001-117
Department of Physics kxas A&M Univers i ty
College S t a t i o n , Texas 77843
%. . ~ G r w m June 28, 1974 - - I ~ 4 ~ 6 4e' 3
tnuaa* 4vaaz
. i z a c m a v -. ,A paper based on t h e rcaterial i n t h i s r e p o r t has been submitted t o , - r n - m X \
\. --- -- - Ica rus
https://ntrs.nasa.gov/search.jsp?R=19740026171 2018-06-25T12:27:20+00:00Z
Ugh-Dispersion Spectroscopic Observations of Venus During 1968 and 1969 11. The Carbon-Dioxide Band a t 8689R
R. A. J. Schorn Physics Department
Texas ALY Universi ty College S ta t ion , Texas 77843
A. Woszczyk Astronomical Observatory
Nicoiaus Copernicus Univers i t l Torun, Poland
L. D. Gray Young Physics Department
Texas A W Universi ty College S ta t ion , Texas 77843 -
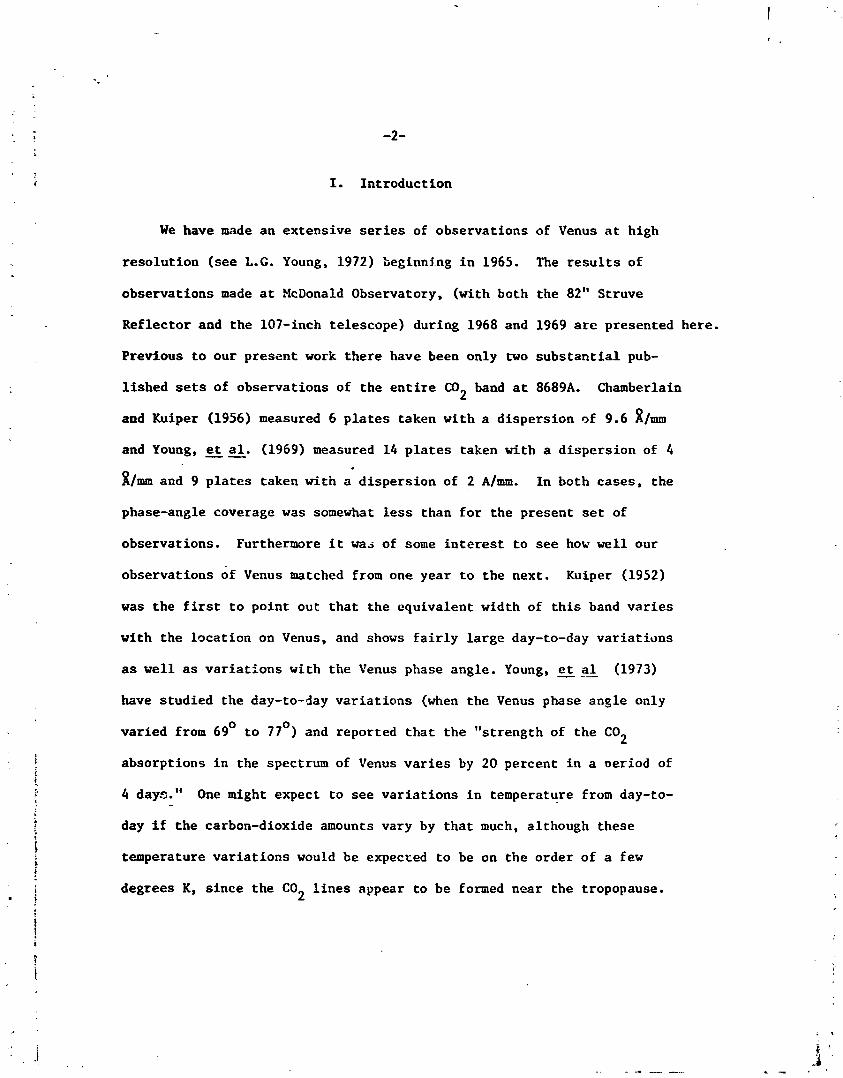
Thi r ty well-exposed photographic p l a t e s showing t h e spectrum of the
carbon d ioxide band a t 8689A i n t h e atmosphere of Venus were obtained
during 1968 and 1969. A l l s pec t r a ve re obtained a t a d ispers ion of 2
0 X/mm f o r Venus phase angles varying from 1 0 t o 126O. W e f ind rota-
t i o n a l temperatures ranging f ro= 236O~ t o 274'~. f h e average va lue of
t he r o t a t i o n a l temperature i s 246 f 1°IC (one standard devia t ion) ; f o r
our 1967 observat ions, t he r o t a t i o n a l t enpera tures ranged from 222 t o
0 248'i, wi th a n average va lue of 238 k 4 4. The v a r i a t i o n of t h e equiv-
aler.' widtb of t h e 8689A band, wi th Venus phase angle, was very s imi l a r
f o r t h e two sets of observat ions (53 p l a t e s ) . The temporal va r i a t i ons ,
of approximately 30 percent , were comparable with t he phase v a r i a t i o n s
over t h i s l imi ted range of phase angle.
I. Introduct ion
We have made an extensive s e r i e s of observat ions of Venus a t high
r e so lu t ion (see L.G. Young, 1972) Leginning i n 1965. The r e s u l t s of
observat ions made a t McDonald Observatory, (with both the 82" Struve
Reflector and t h e 107-inch te lescope) during 1968 and 1969 are presented here.
Previous t o our present work the re have been only two s u b s t a n t i a l pub-
l i shed sets of observat ions of t h e e n t i r e C02 band a t 8689A. Chamberlain
and Kuiper (1956) measured 6 p l a t e s taken wi th a d i spers ion s f 9.6 ?i/mm
and Young, et a l . (1969) measured 14 p l a t e s taken with a d i spers ion of 4
x/mm and 9 p l a t e s taken with a d i spe r s ion of 2 ~ / m m . I n both cases , t he
phase-angle coverage was somewhat l e s s than f o r t he present set of
observations. Furthermore i t was of some i n t e r e s t t o see how w e l l our
observat ions of Venus matched from one year t o the next. Kuiper (1952)
was t he f i r s t t o point out t h a t t h e equivalent width of t h i s band v a r i e s
with t he loca t ion on Venus, and shows f a i r l y l a r g e day-to-day va r i a t i ons
as wel l a s v a r i a t i o n s with t h e Venus phase angle. Young, et _al (1973)
have s tud ied the day-to-day v a r i a t i o n s (when the Venus phase angle only
var ied from 6g0 t o 77') and reported t h a t t he "s t rength of t h e C02
absorpt ions i n the spectrum of Venus v a r i e s by 20 percent i n a ~ e r i o d of
4 days." One might expect t o s ee v a r i a t i o n s i n temperature from day-to-
day if t h e carbon-dioxide amounts vary by t h a t much, although these
temperature v a r i a t i o n s would be expecxed t o be on the order of a few
degrees K, s ince t he CO l i n e s appear t o be formed near the tropopause. 2
-3-
11. Observations
The spectrograms used i n t h i s study are l i s t e d i n Table 1. P l a t e s
i n column 1 pref ixed wi th a C were taken with t h e 160-cm f o c a l length
coudg spectrograph of t he 82" Struve Reflector using g ra t i ng I. This
gra t ing , used in t h e t h i r d order , gives a d ispers ion on t h e p l a t e of 2
R/mm. P l a t e s pref ixed with an H were taken a t t he coudi focus of t he
107-inch te lescope with t he 425-cm focal-length spectrograph and g ra t i ng
B used i n t he f i r s t order , r e s u l t i n g i n a d i spers ion of 2 glaan on the
p l a t e . Thus a l l of our spec t r a were obtained with t he same dispers ion.
A l l exposures were made on ammonia-hypersensitized IV-N p l a t e s . Higher
order spec t r a were blocked out using e i t h e r an RG-10, RG-8 o r RG-5
f i l t e r . The choice of f i l t e r d e p e n d e d upon the con t r a s t of Venus aga ins t
t he sky background. The spectroscopic p l a t e s were developed i n D-76 f o r
anyvhere from 12 t o 1 8 minutes, using continuous a g i t a t i o n i n a rocker
t ray .
These observat ions were mads over a period of a year and the l o c a l
t e r r e s t r i a l weather var ied considerably f ron p l a t e t o p l a t e : 70 percent
of t h e observing days were c l e a r , 20 percent were hazy and 1 0 percent
were p a r t l y cloudy; t he ambient temperature ranged from 44 t o
0 9 0 O ~ , with an average temperature of 66 , t h e r e l a - i v e humidity var ied
from 9 t o 91 percent , with an average humidity of 36 percent ; the seeing
var ied from 1" t o 10" with average see ing of 3"-4". Only the 30 bes t ,
we l l exposed p l a t e s were included i n t h e following ana lys i s . Table 1
gives t h e d a t e (column 2), the time of t he observat ion (column 3) and
the phase angle of Venus (column 4). Column 5 g ives the Doppler s h i f t
of t h e Venus l i n e s a t 8700A (Niehaus and P e t r i e , 1961). Column 6 g ives
t he pos i t i on ot' t h e spectrograph slit on the image of t h e d i sk of Venus.
An image r o t a t o r was used t o posi.tion the slit a t one of t h e f i v e standard
pos i t i ons we Lave used i n our e a r l i e r s t u d i e s of Venus. For t h i s set of
observat ions we have i n f a c t used only t h r ee d i f f e r e n t pos i t i ons on
1 the image of t he disk. In order t o maintain a cons i s t en t notat ion with L
our e a r l i e r s e r i e s of papers, we w i l l r e t a i n t h e same nunbering system
as before. Pos i t ion 1 is pole-to-pole near the terminator; pos i t ion 2
is pole-to-pole near the limb; pos i t i on 4 is p a r a l l e l t o the equator
near the sub-Earth point.
111. Measurement of Equivalent Widths
A l l of t he p l a t e s l i s t e d i n TaSle 1 were traced i n t he density-versus-
wavelength mode on the recording microdensitometer a t the Cal i forn ia
I n s t i t u t e of Technology. In a l l cases t he microphotometer slit covered
the c e n t r a l 80 percent of the width of the spectrum. I n some cases a
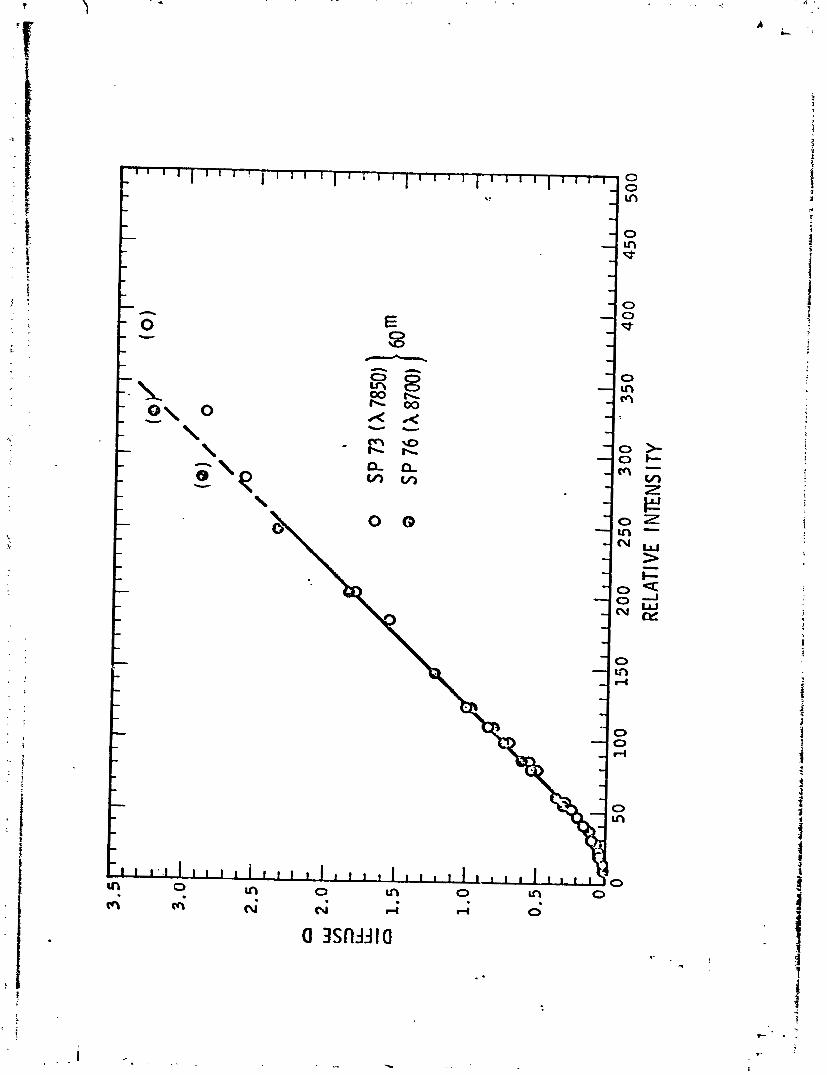
p l a t e was traced more than once. - Previous work (A.T. Young, 1972) has shovn t h a t t he dens i ty of hyper-
sens i t ized IV-N p l a t e s i s a l i n e a r funct ion of exposure, a p a r t from the
toe of t he c h a r a c t e r i s t i c curve (see Fig. I.). Thus a dens i ty t r ac ing
is equivalent t o an i n t e n s i t y t racing, a p a r t from a zero-point s h i f t .
A s our s t ronges t l i n e s have r e s idua l i n t e n s i t i e s on the order of 80% a
readable i n t e n s i t y t r ac ing would have the zero off-scale . Equivalent-
width ca l ib ra t ions were based on the f o l l o ~ 3 n g 22 s o l a r l i n e s
and t h e i r equivalent widths a s reported by Moore, Minnacrt and Houtgast
(1966) : 8668.456 (9 a), 8671.879 (13 &), 8674.756 (113 a), 8679.646
(41 &) , 8680.405 (25 a), 8686.368 (54 &) , 8693.958 (17 a), 8694. 641
(34 a&, 8698.717 (20 d), 8699.461 (73 a), 8710.398 (82 a), 8712.701
(57 &) , 8713.208 (58 d) , 8717.833 (105 &) , 8728.024 (107 a). 8736.040
(289 a), 8742.466 (97 d), 8751.198 (14 a), 8752.025 (94 d), 8757.199
(91 a)., 8763.978 (99 a), 8770.681 (11 a). A s many of these s o l a r l i n e s
a s appeared i n a t rac ing of t he spectrum of Venus were measured and used
t o c a l i b r a t e t h a t t racing. Unfortunately, a l l t r ac ings d id not begin and
end a t t h e same wavelengths. The major i ty of t h e t r a c i n g s conta ined 20
s o l a r l i n e s . Af te r f i n d i n g t h e conversion from squares on t h e c h a r t
paper t o a& we then found t h e percentage e r r o r i n our s o l a r l i n e c a l i b r a t i o n .
Previously w e had used t h i s e r r o r a s an e s t i m a t e of t h e sys temat ic
e r r o r i n our measurements of t h e equ iva len t widths of t h e CO l i n e s . We 2
now b e l i e v e t h a t t h i s overes t imates our sys temat ic e r r o r , s i n c e t h e
equ iva len t widths of t h e s o l a r l i n e s repor ted by Moore, et al . r e f e r t o
d i r e c t l i g h t from rhe c e n t e r of t h e s o l a r d i s k and a o t t o i n t e g r a t e d
s u n l i g h t which is what w e measure on our Venus p l a t e s . The d i f f e r e n c e s
i n t h e e q u i v a l e n t widths measured f o r d i r e c t and i n t e g r a t e d s u n l i g h t
have, i n some cases , been as l a r g e as 50 percen t , o r much l a r g e r than
- - t h e s t a n h r d d e v i a t i o n s w e r e p o r t f o r t h e s e t of s o l a r c a l i b r a t i o n l i r
(where w e found a minimum standard d e v i a t i o n of 3.7 pe rcen t and an
average s tandard d e v i a t i o n of 6.7 pe rcen t ) . We estimate t h a t our r e l a t i v e
sys temat ic e r r o r is about equa l t o our random e r r o r , o r about 2 percent .
(Pho toe lec t r i c scanner r e s u l t s should improve t h i s s i t u a t i o n cons iderab ly
i n t h e f u t u r e ) .
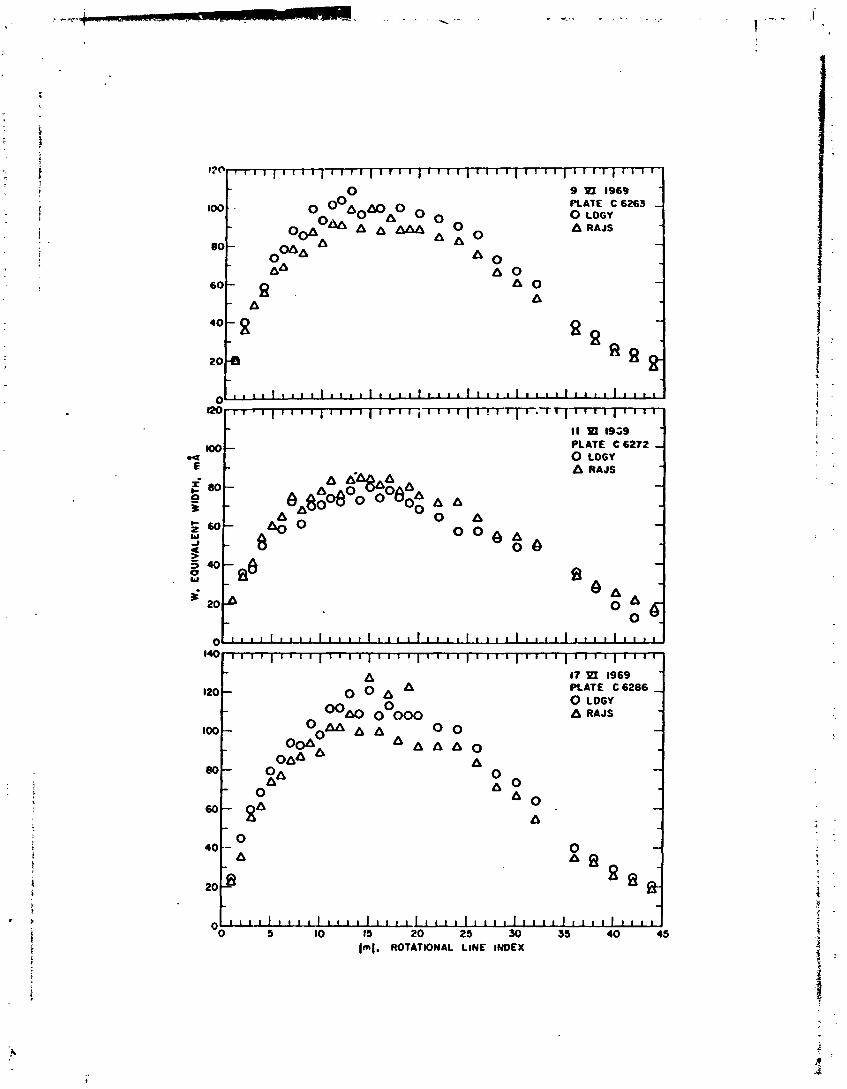
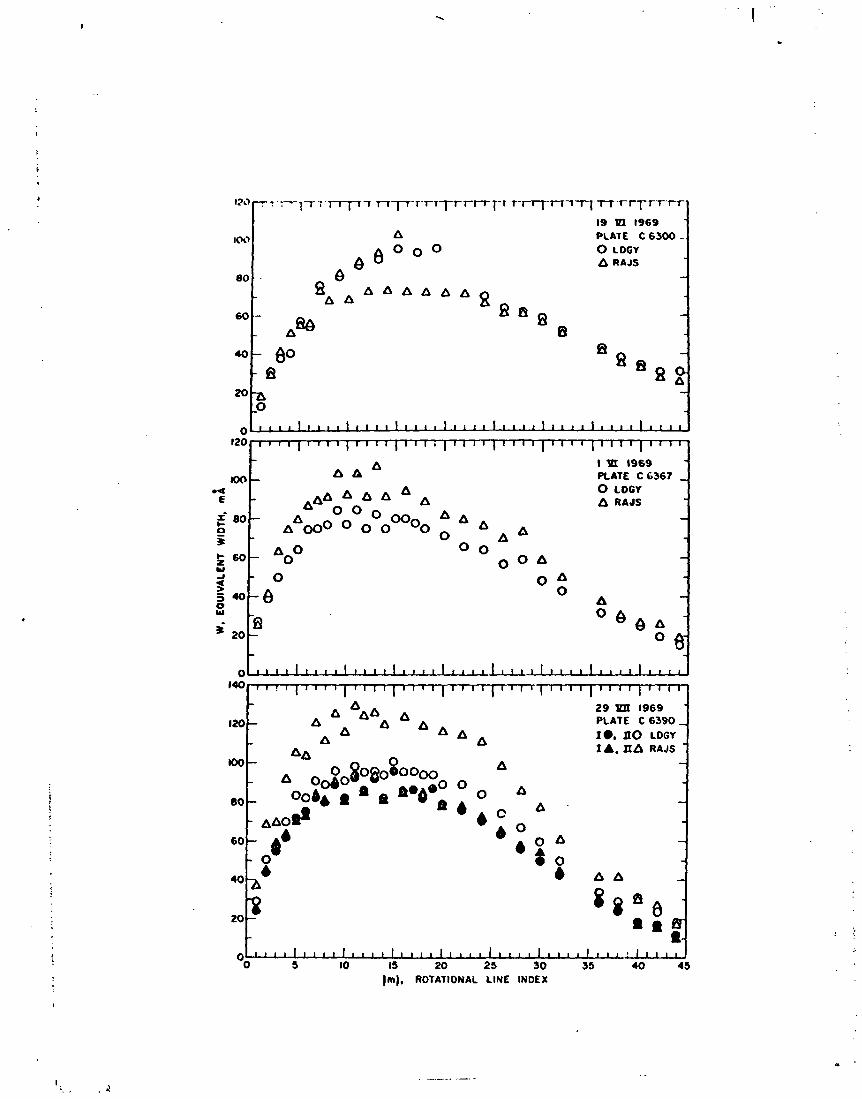
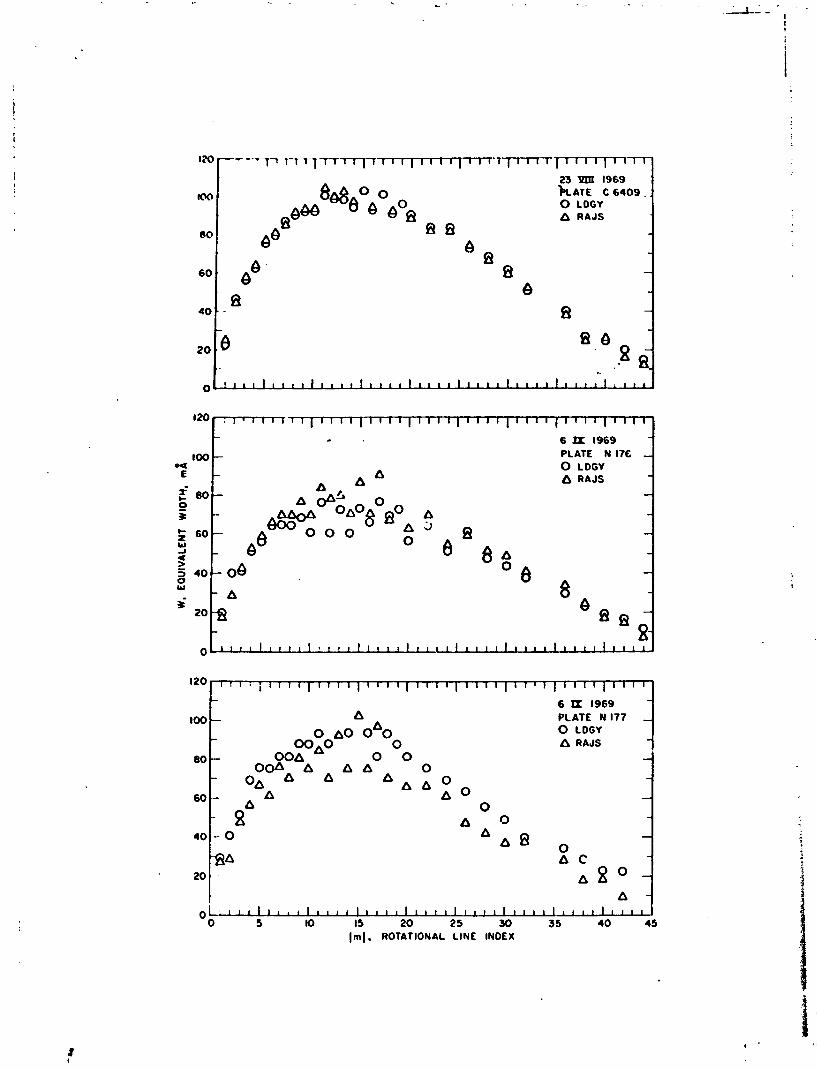
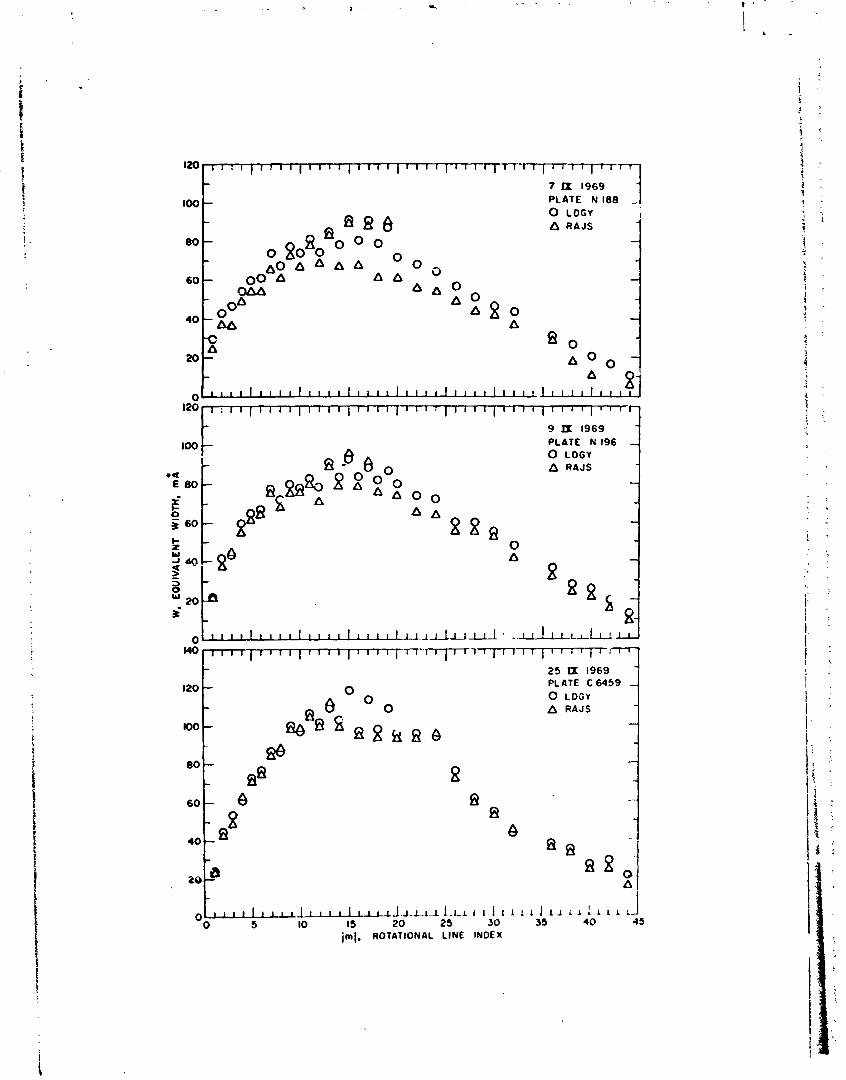
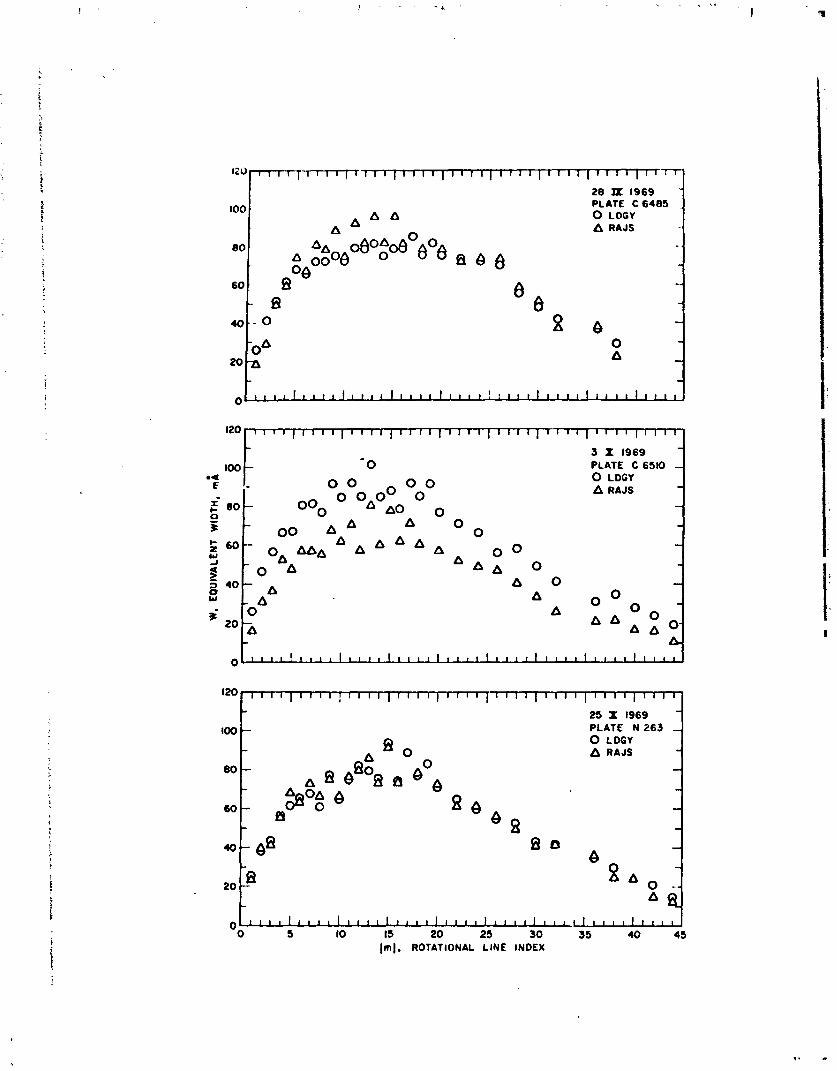
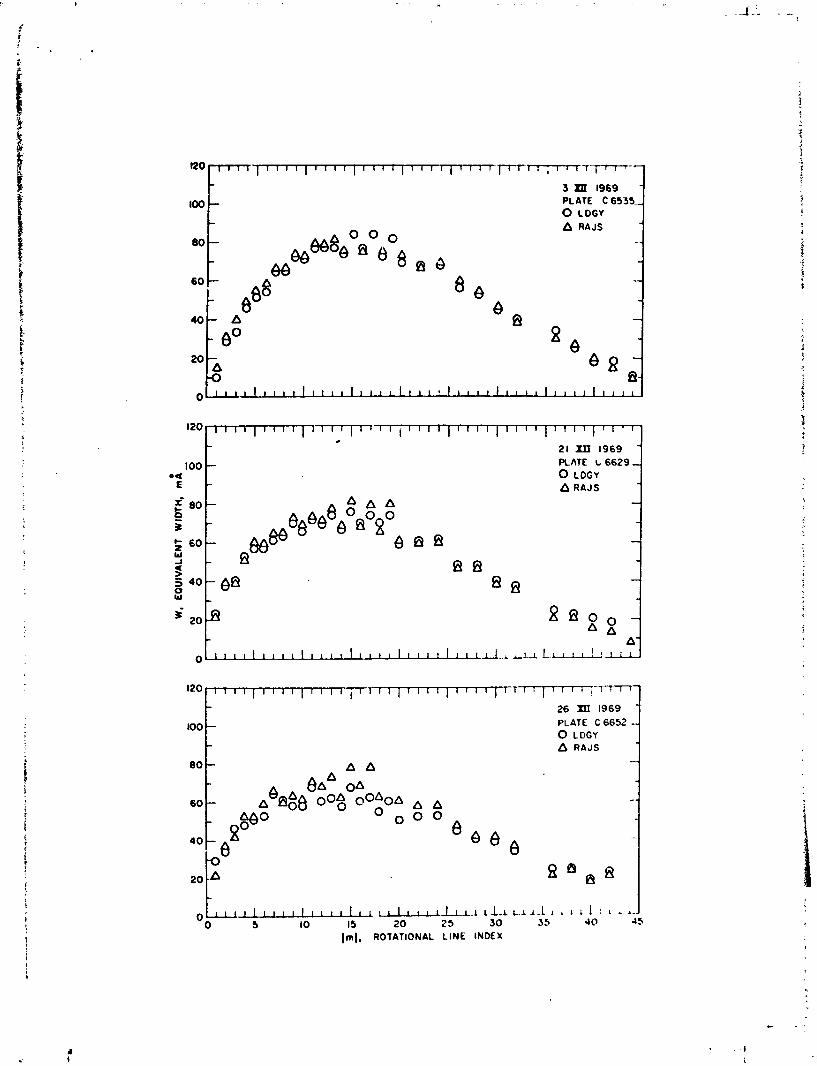
The r e s u l t s of our measurements of t h e Venus carbon-dioxide l i n e s
are shown i n Figures 2 t o 11. I n each f i g u r e w e have p l o t t e d t h e equiva-
l e n t width of t h e i n d i v i d u a l r o t a t i o n a l l i n c s a g a i n s t (ml, where m is
r e l a t e d t o t h e r o t a t i o n a l quantum number J by m = -J" f o r t h e P branch
and m = J" + 1 f o r t h e R branch. Here t h e double prime r e f e r s t o t h e
lower r o t a t i o n a l energy s t a t e . The measurers a r e i d e n t i f i e d by tne
fol lowing symbols: c i r c l e s , LDGY, and t r i a n g l e s , RAJS, a s ind ica ted on
t h e f i g u r e s . The measurements of t h e s e two people a r e u s u a l l y i n good
agreement al though each i n d i v i d u a l found h i s own i n t e n s i t y c a l i b r a t i o n
from h i s measurements of t h e s o l a r l i n e s . About a q u a r t e r of t h e measurements
show a sys temat ic d i f f e r e n c e of appro-imately 1 0 percen t between t h e
two i n d i v i d u a l measurements. This d i ~ ~ e r e n c e is comparable to t h e d i f f e r e n c e
found by one person i n making measurements of the same p l a t e from two
t rac ings . Thus, our systematic e r r o r i n determining the abso lu te value
of equivalent widths is estimated to be about 10 percent. The r o t a t i o n a l
temperatures found from our measurements of equivalent widths a r e un-
a f f ec t ed by the abso lu te value of measurements; they a r e only a f f ec t ed
by t h e r e l a t i v e systematic e r r o r s (- 2 percent) which a r i s e from pos-
s i b l e e r r o r s i n judging where t o draw the continuum.
IV. Determination of t h e Rotat ional Te-sperature a d Other Parameters
A s i n our previous papers, we assume t h e curve of growth can l o c a l l y
be approximated by a s t r a i g h t l i n e of s lope b, i.e.
A (m) . - S (m) b
(I-)
where W is the equivalent width, S is the l i n e i n t e n s i t y and m is the
r o t a t i o n a l l i n e index mentioned before. .Chamberlain and Kuiper's (1356)
paper suggested that lines formed i n a s c a t t e r i n g atmosphere should
follow a square roo t absorpt ion law (b = 0.5). I n t a b l e 2 w e give the
r e s u l t s obtained both fo r a square roo t absorpt ion law and f o r a curve
of growth; i n the l a t t e r case, l i n e i n t e n s i t i e s a r e ca lcu la ted f o r
var ious temperatures an2 the s lope of t he curve of growth correspond-
i ng t o each temperature i s computed. temperature T corresponds 0
t o t he curve of growth which bes t f i t s t he measurements (has t he
smal les t standard devia t ion) . Thus, t he temperature T is the value 0 .
of the r o t a t i o n a l temperature which g ives t he bes t o v e r a l l f i t t c
t h e d i s t r i b u t i o n of equivalent widths, W, a s a func t ion of l i n e i n t e n s i t y ,
S. Using the s lope, b, found from t h a t f i t , we then seek the r o t a t i o n a l
temperature which gives the bes t f i t t o t he d i s t r i b u t i o n of equivalent
widths, W, wi th r o t a t i o n a l l i n e index, m, from the expression
w (m) I n - 0.5614 m!m-1)b b = I n Wo - -
m T ( 2 1 r o t
If ou: .nasurenents had no systtnatic errors, then we should find
To Trot . The quantity Wo would be the same as the equivalent width measured for the R(0) line, if there were no scatter in our data. In
the past, we found that the former was more generally true than the
latter. Table 2 gives both To and T(b) as well as Wo(b). The difference
between W (0.5) and Wo(b) is due to the fact that, generally, b # 0.5. 0
Table 3 gives a sunnary of the rotational temperatures found for each
plate. The average temperature found assuming a square root absorption
law is T(0.5) = 215 ' 1°K. For the curve of growth analysis, the average
0 value of To = 236 2 2 11 and the average value of the rotational temperature
is Trot = 246 t 1'~.
V. Comparison Kith Other ?leasurements in 1968-1969.
Young -- et al. (1971) reported on a series of measurements of the
carbon dioxide Sands at 7820 8 and 7883 8 in the spectrum of Venus
during this .?&me period. The average temperatures they found were
0 T(0.5) = 232 f 3 K, To = 2440~~ and Trot = 244 f ~OK. These temperatures
did not vary significantly with time, while our measurements of the CO 2
band at 8689 8 indicate slight temporal variations (0 > G ) If ext int
we average all of the curve-of-growt4 temperatures found for the 1968-
0 1969 observations of Venus, we obtain a temperature of T = 241 5 1 K,
avg
assuming the widths of the C02 lines are independent of rotational
quantum number. If the rotational line widths are allowed to vary, we
found (Young, 1971) the rotational temperature should be increased 4
percent, or T = 251 2 1°K. avg
VI. .Comparison With Measurements of the 8689 Band of C02
Made During 1967.
Young et al. (1969) made an extensive series of measurements of
t h i s band the previous year. The average temperatures they found were
0 T(0.5) = 229 5 6 K, TO = 240°K and Trot = 238 * 4'~. The present re-
s u l t s i nd i ca t e a not icably 1 0 w e i va lue f o r the average temperature found
assuming a square-root absorp t ion law, T(0.5) = 215 2 1'~. The value
of T = 239 + 2OK f o r 1967 does not d i f f e r s i g n i f i c a n t l y from the value avg
o f T = 241 5 ~ O K found f o r 1968-1969. avg
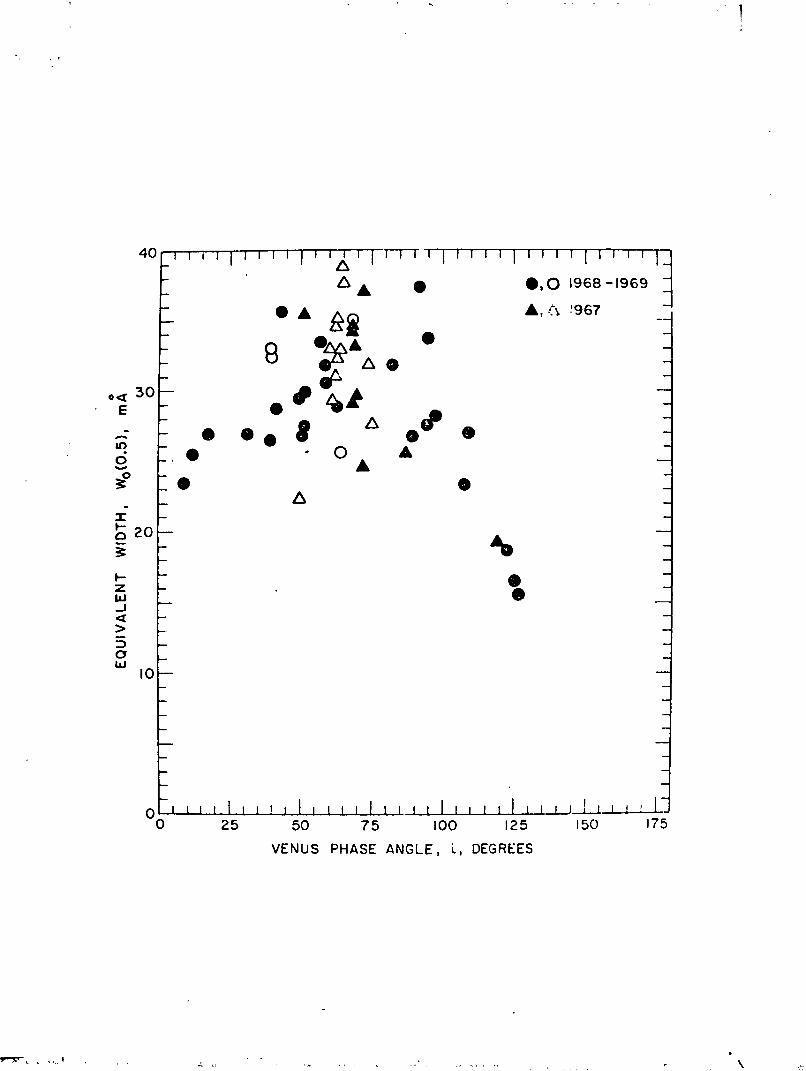
Since t h e same carbon-dioxide band was measured i n both sets of
observat ions, w e can compare t he va lues of W (b) found f o r each s e t . 0
Tbis is done i n Figure 1 2 where t h e present observat ions a r e ind ica ted
by c i r c l e s . a n d the 1967 obzervations by t r i ang le s . The s e t s of measure-
ments are v i r t u a l l y ind is t inguishable and both i nd i ca t e about the same
amount of day-to-day v a r i a t i o n i n t he equivalent widths (or CO abundance 2
above t h e Venus cloud tops) . There does not appear t o be much d i f fe rence
i n t h e observat ions made two years a p a r t ; the major e f f e c t i s i n the
day-to-day va r i a t i ons .
V I I . Apparent Amount of Carbon Dioxide i n the Absorption Path
I n s p i t e of t he l a r g e day-to-day v a r i a t i o n s i n t he carbon-dioxide
abundance, we can s t i l l compute t he average amount observed above the
clouds i n 1968-1969. The i n t e n s i t y of t he R ( 0 ) l i n e is given by
(9 1-I S(l) = 'band r o t
where Sband = 0.72 cm-l/km a t s f o r t he 86892 band of C02 and sot StP
(241°K) = 214.7 (Gray and Young, 1969) . Hence
For both t he 1967 and the present observat ions, we
of WO(b) = 21 5 1 & = 28 t 1 m cm-l. The minimum
(where 1.1 i s the e f f e c t i v e a i r mass) i s found i f we
absorpt ion law, v i z . law, v i z .
have an average value
CO abundance, nw, 2
assume a l i n e a r
Heme Ilw 2 8.4 km atm . On the o ther hand, i f the absorpt ion is assumed StP
t o fol low a square-root law (desp i te our f ind ings t o the cont ra ry i n the
a n a l y s i s of r o t a t i o n a l temperatures) w e have
0 f o r a pressure broadened l i n e of halfwidth y := y peff . For C02
1' = 0.1 em-'/bar; f o r Venus p = 0.09 w barlkm atm, s i n c e t he e f f
c o n s i s t s of 95 percent carbon dioxide. Equation (5) app l i e s
when the parameter
otherwise equation (4) i s the appropr ia te r e l a t i o n . Subs t i t u t i ng
y = 9 v m ~ m - ~ l k m atm and S(1) from (3a), we see t h a t the square-root
absorpt ion law ( i n t he absence of s c a t t e r i n g ) holds only i f q > 26.5 a i r
masses. It is poss ib le t ha t mul t ip le s c a t t e r i n g could increase the
e f f e c t i v e a i r mass t o t h i s l a r g e a value. However, even f i r a value of
0 = 20, equation (4) i s s t i l l reasonably accurate . It would then ind i ca t e ,
f o r example, t h a t only w = 0.42 km atmos of C02 a r e above the "cloud
topst t which a r e a t a pressure of 37 mb, and t h e R(0) l i n e s t i l l follows
a near ly l i n e a r absorpt ion law. Smaller va lues of 11 would have the
e f f e c t of pu t t i ng the "cloud tops" deeper i n the atmosphere, but would
still have t h e R(0) l i n e fol low a l i n e a r absorpt ion law.
-10-
I n order t o show how l a r g e a day-to-day v a r i a t i o n does occur i n the
CO abundance above the cloud tops, we note t h a t W (b) v a r i e s between 2 0
21.5 and 27.1 mA f o r the phase angle range 62O < i < 64O. This amounts
t o a 12 percent change i n abundance f o r a neg l ig ib l e change i n t k Venus
phase angle .
Table 4 gives a comparison of the C02 abundance over var ious a r e a s
on Venus. This c l e a r l y demonstrates t he necess i ty of making many ob-
se rva t ions before a t tempting t o draw any conclusions about the d i s t r i -
bution of carbon dioxide over t ha t planet . To i l l u s t r a t e t h i s , we have
made averages of the abundance over var ious regions f o r 45 degree incre-
ments i n t h e phase angle (probably a much longer t i m e i n t e r v a l than t h a t
of most observat ions) . From these averages on: could conclude; a ) t he
CO abundance is maximum a t t he limb and minimum a t t he equator; b) the 2
CO abundance is maximum a t t he terminator and minimum a t the equator; 2
c ) the C02 abundance is g rea t e r a t the limb than a t the terminator; o r
d ) t he CO abundance is g rea t e r a t the equator than a t the terminator. We 2
chose only t o conclude t h a t t he CO abundance v a r j e s over the planet and 2
t h a t i t s d i s t r i b u t i o n does not remain constant with t i m e .
V I I I Conclusicns
We have found good agreement between the present set of observa-
t i ons and the previous observat ions of the carbon dioxide band a t
86898, both a s t o t he average abundance of C02 and the r o t a t i o n a l
temperatures. S imi la r ly t he re i s good agreement between the average
temperatures found f o r t h i s band and the carbon dioxide bands a t 78202
and 7883g observed over t he same time period. There i s a s l i g h t ind i -
ca t i on t h a t w e a r e seeing s w A v a r i a t i o n i n the r o t a t i o n a l temperatures
with time, but t h i s is a weak e f f e c t compared to the comparatively l a rge
day-to-day v a r i a t i o n s i n the C02 abundance. The d i s t r i b u t i o n of C02
over the planet v a r i e s with time and there i s no conclusive evfdencc
t h a t one a rea of Venus cons is ten t ly has more CO above i t than any o ther 2
area.
I X . Acknowledgement
This research was supported by XASA Grants NGR 44-001-117, NCR 44-
012-152, a McDonald Observatory Fellowship, and grant from the Texas A&??
University O f f i c e of University Research, administered by the College of
Science.
L REFERENCES
2 I Chamberlain, J. W. and Kuiper, G. P. (1956). Rota t iona l t e m p e n t u r e and
phase v a r i a t i o n of t h e carbon d iox ide bands of Venus. A s t r o p h y ~ f -- J. 124, 399-405.
Kuiper, G. P. (1952). "The Atnospheres ,i t h e Ear th and P lane t s" p. 370. Univ. of Chicago Press .
Moore, C. E., Minnaert, M. G. J. and Houtgast, J. (1966). "The So la r S p e ~ t r m 29358 t o 8770% Second Revision of Rowland's Prel iminary
. . Table of So la r Spectrum Wavelengths" 17. S. Kat ional Bureau of Standards Monograph 61, Washington D. C.
Niehaus, W. C. and P e t r i e , T. W. (1961) "Tables of S t e l l a r and Planetar,. Doppler S h i f t s from 1962 t o 1982" Standard O i l Co. of Ohio.
Young, A. T., (1972) Photometric p r o p e r t i e s of amonis-hypersensicJ.zed IV-N photographic p l a t e s . J. Opt. Soc. h e r . 62, 1385.
Young, L. D. G. (1972). High r e s o l u t i o n s p e c t r a of Venus - a review, I c a r u s , 17, 632-658.
Young, L. D; G., Schorn, R. A., Barker, E. S., and MacFlrlanc, M. (1969). Eigh-dispersio- spec t roscop ic observa t ions of Venus. V. The carbon d iox ide bands a t 8689%. I c a r u s 11, 390-407.
Young, L. D. G., Schorn, R. A. J., B a ~ e r , ". S. and Noszczyk, A. (1971). High-dispersion spec t roscop ic observat;.cns of Vznus dur ing 1968 and 1969. I. The carbon d iox ide bands a t 78208. Acta Astronomica 21, 329-363. -
Young, L. G . , Young, A. T., Young, J. W., and Bergs t rah l , J. T. (1973). The p l a n e t Venus: a new p e r i o d i c spectrum v a r i a b l e , Astrophys. -- J. 181, L5-L8.
-13-
LIST OF FIGURES
Fig, 1. Density - vs. - exposure curve f o r two typ ica l hypersensitized IV-N p l a t e s (spot-sensitometer da ta ) . Density is a l i n e a r
: function ~f exposure, i n the normal range of dens i t i e s .
Fig , 2. Equivalent widths of l i n e s i n t'le 86894 carbon dioxide band I as measured by-two people f o r Venus p l a t e s taken on the 1 dates indicated,
Pigs. Ell (same f i gu re capcions as Fig. 2.)
i j Pig. 12. In te rcept of t he least-squares f i t t o a square-rc-~t absorpt ion
l a w as a funct ion of Venus phase angle. %e quantity W (0.5) is a convenient measure of thc carbon diaxide abun- 0
dance. It would be equal t o the equivalent width of the R(0) l i n e i f t he square-root absorption law were v a l i d end the da t a were completely f r e e from both noise and e r r o r s i n measurement. The s o l i d symbols r e f e r t o spec t ra when the Doppler s h i f t of the Venus l i n e s was t o the red; the open symbols reLer t o a Doppler s h i f t t o the blue.
DIFFUSE 0
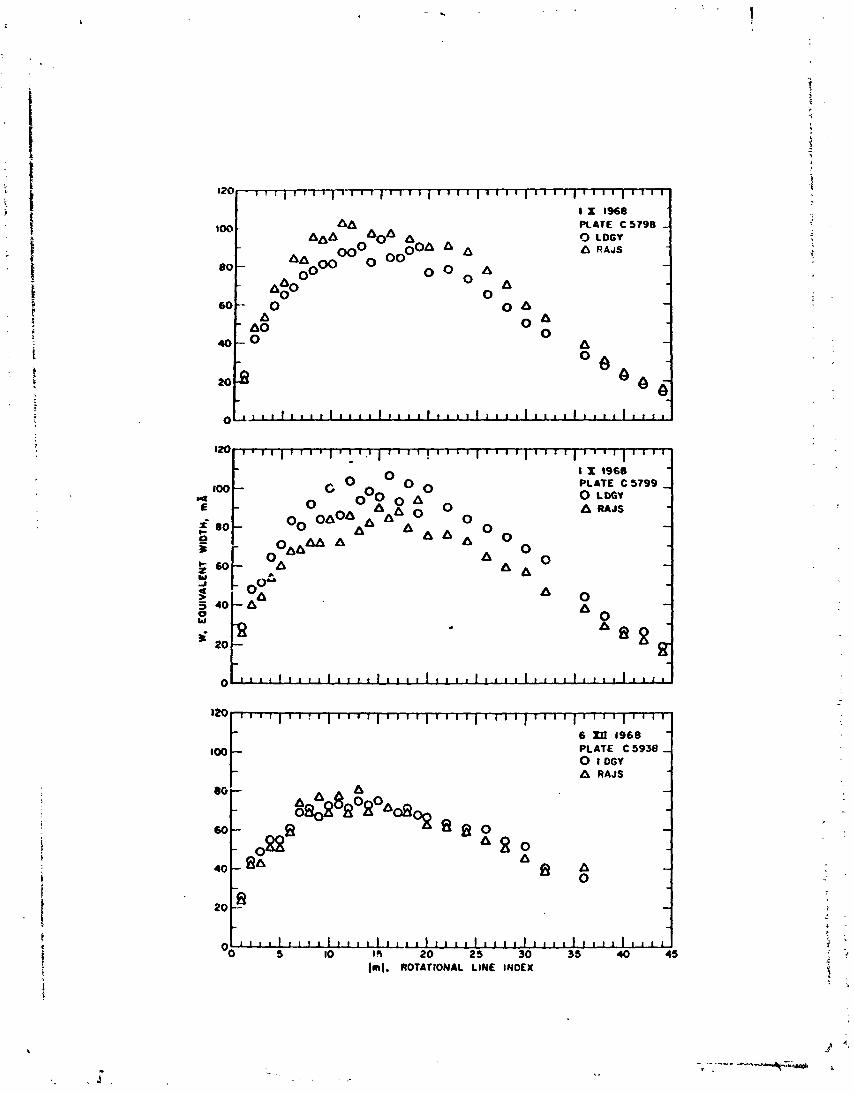
PLATE C 5 9 3 8 0 t DGY A RAJS
I 2 0
IOC,
80
60-
(ml. ROTATIONAL LINE INDEX
- , , 1 , , 1 1 , , 1 1 1 1 [ 1 1 , 1 ~ 1 , , 1 ~ 1 1 1 1 ~ 1 1 1 1 ~ 1 1 1 1 ( 1 1 1 1
t x I S 8 - 5A PLATE C 5 7 9 8 -
&oh 5 O LOGY 0o0 ooa A A A RAJS
- AA 0 O0 A
- ~ $ 0
O o o a 0
0 - A
0 a - a0 0 a
40-0 0
a - -
20 -B

8 P 1 9 6 9 PLATE C 6182
A RAJS
9 Y 1969 PLATE C6186 10. Ira LOGY I&, nA IUJS
ll Y 1 9 6 9 PLATE C 6 2 0 0 0 LOGY A RAJS 1
Iml, ROTATIONAL LINE INDEX
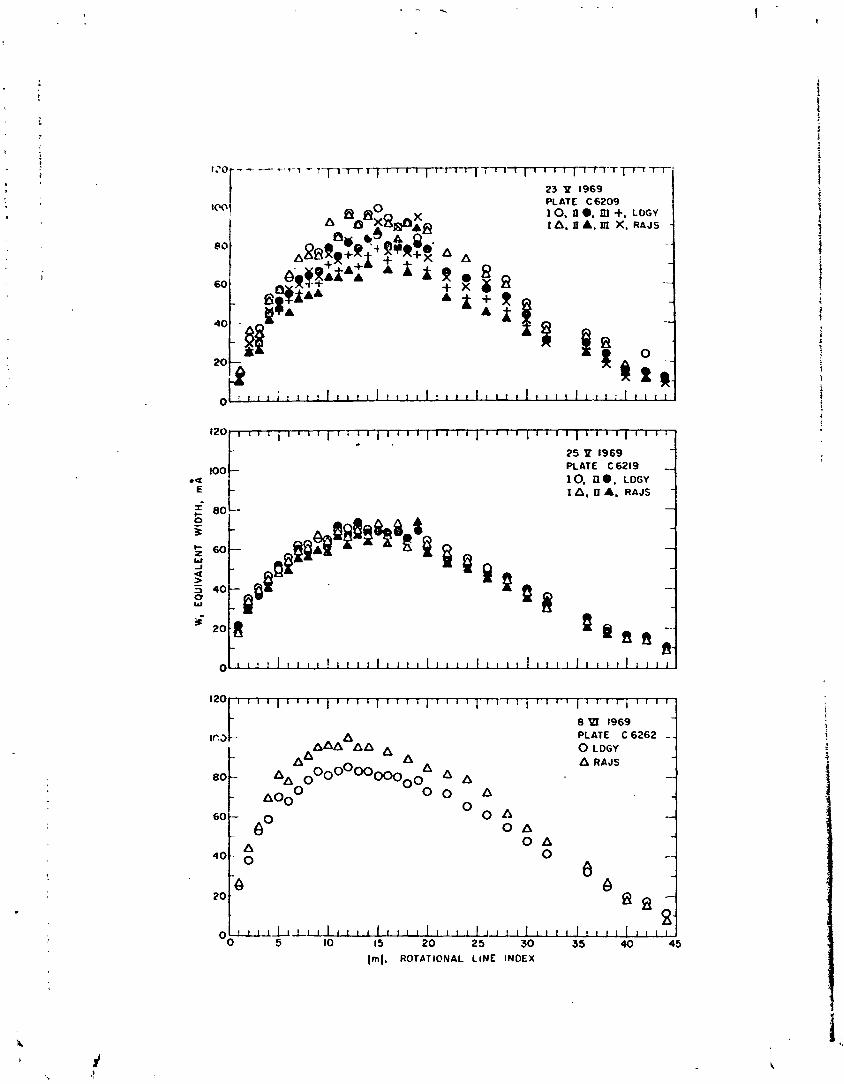
PLATE C6209 I 0. n a, m +. LOGY [A. n A. m x, RAJS
0 ; I
8 I1I 1969 -
1r.3 a PLATE c 6262 -- 0 LOGY
a A A RAJS
A A - 0 0 A -
O O A - 0 P 0 a - 0 -
8 - 2 0
8 8 8 -
L 1 I I I 1 I I 1 l I 1 I I 1 1 1 1 I I 1 I ! I ! I I I I I I l I I I I I 1 I S-
5 10 15 20 2 5 3 0 3 5 40 4 5 (ml, ROTATIONAL LINE INDEX
9 YI 1969 PLATE C 6 2 6 3 0 LDGY A RAJS
II PI 1 9 3 9 PLATE C 6 2 7 2 0 LDGY A RAJS
9 4~
0 A 0
29 DI 1969 PLATE C 6390 I*, no LOGY 1 A, XA RAJS
100
eo
60
19 P1 1969 A PLATE C 6 3 0 0 -
& 6 O o 0 0 A LOGY RAJS
, - 8 B a ~ a a a a
A A - ,- a ee B I
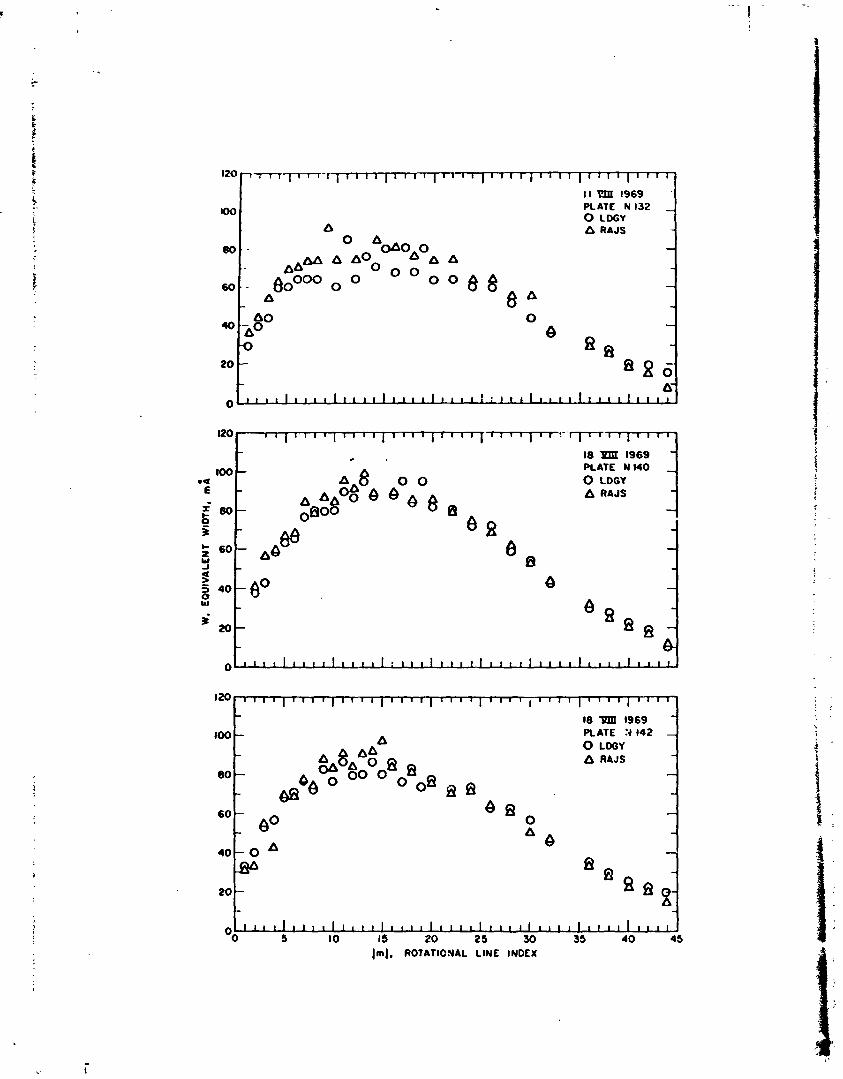
PLATE N132 0 LOGY A RAJS
PLATE N 142 0 LOGY a RAJS
5 10 15 20 2 5 30 35 40 4 5 Iml. ROlATlONAL LINE INDEX
23 HII 1969
m 0 0 0 LOGY A RAJS
80 e4 8 8
60 44- @
B 6
4 0 . - B
23 HII 1969 ATE C 6 4 0 9 - 0 LOGY 1
PLATE N 177 0 LOGY A RAJS
28 X 1969
I00 PLATE C 6485
A A A 0 L O G Y
A A RAJS
80
60
- B 4 0 . - 0 1
PLATE C 6 5 0 0 L D G Y A RAJS
0 0
25 X I969
loo PLATE N 263 0 L D G Y A RAJS
eP 2 e
0 PLATE LOGY 6535-i
21 XII 1 9 6 9 PLATE L 6 6 2 9 0 LDGY A RAJS
2 6 X 1969 PLATE C 6 6 5 2 0 LDGY
RAJS
L- ~ ~ L ' . ~ L L L, 1.L 1 ; , ' 1 i L . *.J O 0 5 10 I 5 2 0 2 5 3 0 35 4 0 45
[mi. ROTATIONAL L INE INDEX