the nairobi water fund in the upper tana basin of kenya nairobi water fund in the upper tana ......
TRANSCRIPT

The Nairobi Water Fund in the Upper Tana Basin of Kenya
Fred Kizito
25 July 2015 Cali, Colombia APR 2015

The Upper Tana: Nairobi Water Fund Kenya
Donors- WLE,
UNDP- GEF, SIDA- ACT!,
IFAD, UNEP, GIZ, TNC
PRIVATE ENTITIES
Corporates- EABL, Coca- Cola, Nairobi
Water Round Table
Research- Research- Future Water,
Natural Capital Project,
WLE and CIAT
Partners

The Upper Tana Basin of Kenya

The Upper Tana Basin of Kenya

From Ecosystems to Value
Biophysical Social
Supply
Service
Benefit
Ecosystem
Structure
Human locations &
Activities
Social
preferences
Production
Function
Ecosystem services as a pillar

IMPACT - ECOSYSTEM SERVICES, LIVELIHOOD NEEDS
Good quality water, adequate supply of clean water, lowering the costs to treat and distribute water through
protection of valuable farmland upstream
2011/12:Scoping, Feasibility Scoping survey across Africa, feasibility study and
stakeholder surveys
2012: Networking (Partnerships) - Private sector
-Farming communities - Government buy-in
-- Research entities (CIAT, NatCap & Future Water)
2012/13: Proof of Concept - Designing of demonstration projects
-Work Plan implementation – 5 year plan -Continued outreach and fundraising
Milestones towards impact
2014/15: Registration, Launch, Research - As charitable trust: launched 03/2015 -Mapping prioritization and Modeling
2013:Targeting -Identified priority landscape areas with an ecosystem
based approach -Incentive mechanisms identified
The 5 year span

City of Nairobi
N’gethu Treatment Works
Nairobi Water Supply Catchment
Ndakaini Dam
7
0
500
1,000
1,500
2,000
2,500
3,000
3,500
4,000
4,500
Jan
-09
Ap
r-0
9
Jul-
09
Oct
-09
Jan
-10
Ap
r-1
0
Jul-
10
Oct
-10
Jan
-11
Ap
r-1
1
Jul-
11
Oct
-11
Jan
-12
Ap
r-1
2
Jul-
12
Oct
-12
Jan
-13
Ap
r-1
3
Jul-
13
Oct
-13
Jan
-14
Ap
r-1
4
Turb
idit
y (N
TU)
Daily Maximum Turbidity
30 Day Moving Average Max. Turbidity
Inflow Water Turbidity at Ng’ethu Treatment Works (Water Fund Interventions aimed at reducing turbidity to below 500NTU)
Development Challenge
Erosion and sedimentation Poor water quality Very low flows during the dry season Costly hydro-power generation
Development challenge

PRIMARY: Sediment retention
for Water quality
CO-BENEFITS: Baseflow
for Water availability
Water Fund Objectives

The Water Fund will establish a revolving fund to support land-conservation measures upstream
The Nairobi Water Fund Business Case
Analysis of the benefits from a US$10 million investment in sustainable land management interventions through the Water Fund over 30-years
Average sediment concentration by month at the intake area for Nairobi’s water (mg/kg) showing a sediment concentration reduced by 50–60%
Source: TNC, 2015. Upper Tana-Nairobi Water Fund Business Case. Version 2. The Nature Conservancy: Nairobi, Kenya.
Reproduced from TNC, 2015
How the fund envisions success

Monitoring the performance of sustainable land management strategies and so deliver proof of concept
Monitoring subwatersheds (with partners)- detects system wide changes
Monitoring microwatersheds – to test the efficiency of practices in reducing sedimentation; but also: the feasibility of interventions for people; the impact of interventions on other ES; trade-offs involved in implementing interventions.
Will impact be achieved?

Research for impact Field monitoring and capacity building

Sub-watershed monitoring Subwatersheds – measuring river height on all major rivers and turbidity probes on three major rivers (hourly), one installed by CIAT
Turbidity (NTU) of river water measured over the period of one month at hourly intervals in Kamakia river
Measured with a Greenspan Turbidity Meter
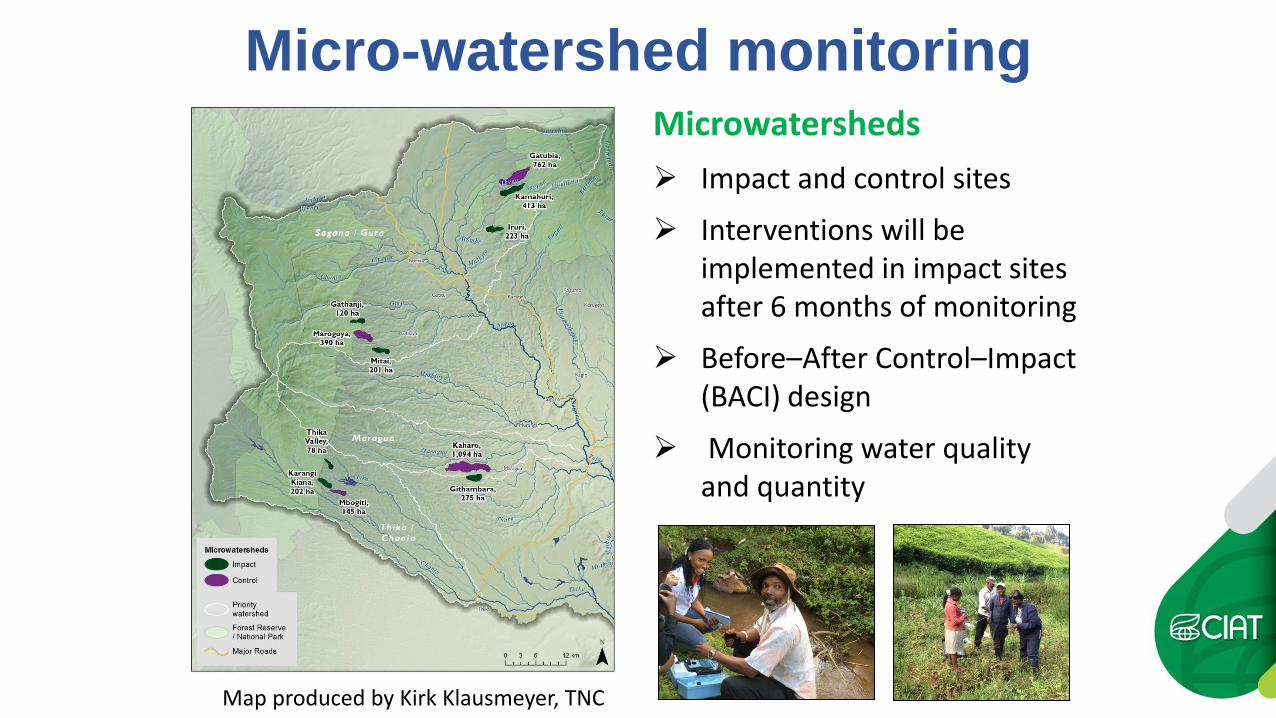
Micro-watershed monitoring Microwatersheds
Impact and control sites
Interventions will be implemented in impact sites after 6 months of monitoring
Before–After Control–Impact (BACI) design
Monitoring water quality and quantity
Map produced by Kirk Klausmeyer, TNC

Mapping microwatersheds to ensure they fulfill certain criteria; originally chosen from partner recommendations
Bimonthly monitoring of turbidity and other properties
Turbidity (NTU) of river water at microwatershed site Thika valley before and after a rainstorm and of runoff entering the river
0
200
400
600
800
1000
1200
0 1 2 3
Turb
idit
y N
TU
Normal After rain
Runoff
Based only on one sample from one day! Runoff entering clear water
Micro-watershed monitoring
172.7 2.9
1056

Fundamental Model for Water Fund in Kenya
Water Users Watershed keepers $$
Use and growth Quality Watershed CLEAN &
AVAILABLE
WATER
Strong
Governance &
Endowment
Funding
Private Sector-farmer linkages
Raw materials

tea, vegetables and grassland to cereals
cereals and forest to tea and coffee
agriculture to forest
Land use changes

Stakeholder Engagement
Sorghum assessments
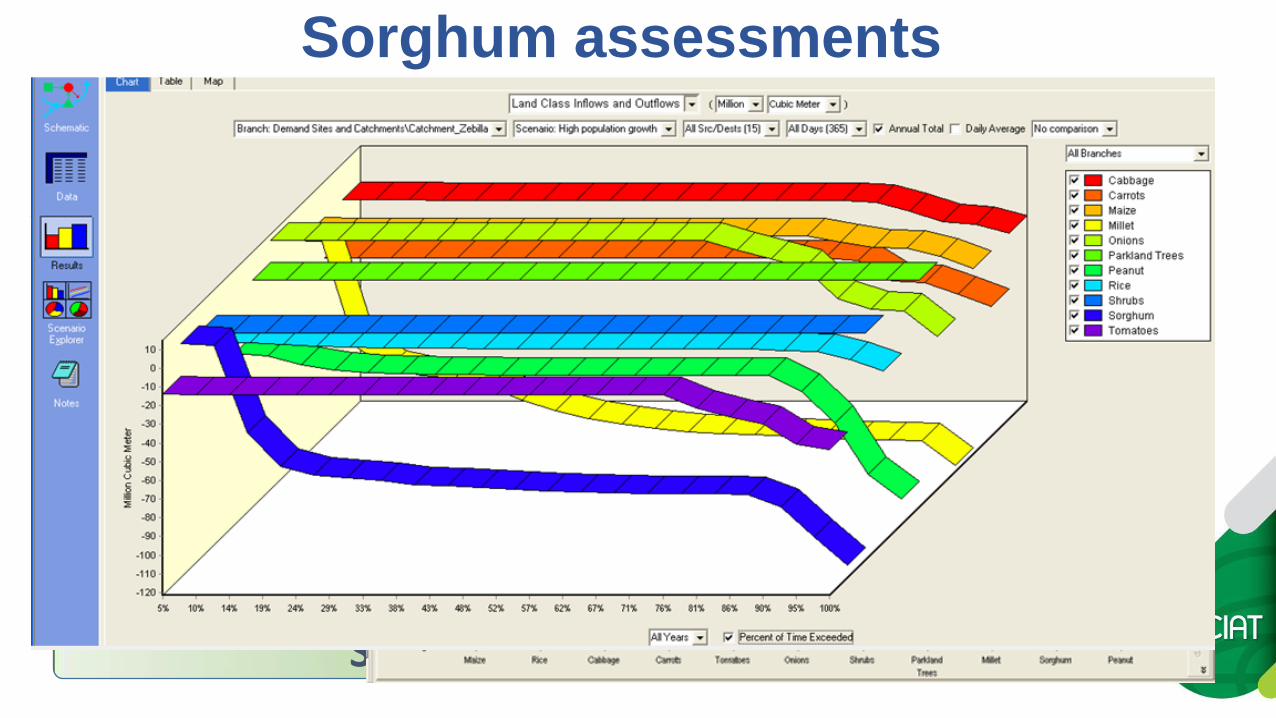
Stakeholder Engagement
Sorghum assessments
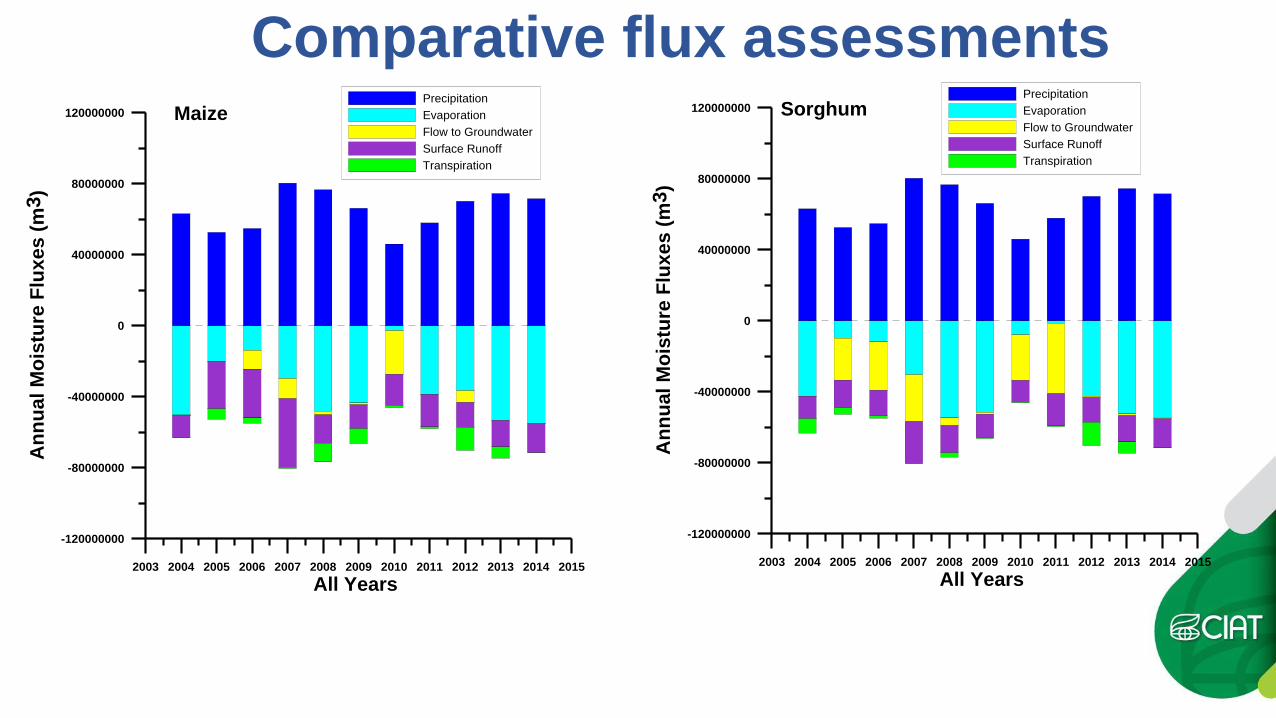
Comparative flux assessments
2003 2004 2005 2006 2007 2008 2009 2010 2011 2012 2013 2014 2015
All Years
-120000000
-80000000
-40000000
0
40000000
80000000
120000000
An
nu
al
Mo
istu
re F
luxe
s (
m3)
Precipitation
Evaporation
Flow to Groundwater
Surface Runoff
Transpiration
2003 2004 2005 2006 2007 2008 2009 2010 2011 2012 2013 2014 2015
All Years
-120000000
-80000000
-40000000
0
40000000
80000000
120000000
An
nu
al
Mo
istu
re F
luxe
s (
m3)
Precipitation
Evaporation
Flow to Groundwater
Surface Runoff
Transpiration
Maize Sorghum

0
10
20
30
40
Ce
rea
l p
ric
es
(K
sh
s/k
g)
Maize
Sorghum
2013 2014 2015
Vegetables Maize Sorghum
Cropping regimes
0
400
800
1200
1600
2000
Se
aso
nal
cro
p y
ield
(k
g h
a-1
)Cereals assessments
Sorghum yields are masked by other Considerations of pests and diseases, drought years

Engagements for uptake
Moving forwards Need for stakeholder engagement through participatory
processes: preferences, tradeoffs and feasibility Incorporate results into stakeholder platforms which will examine
how investments and incentives into SLM can be designed. Motivation of investors, active engagement of resource stewards,
environmental considerations Uptake and policy Results will be given to the WRMAs, Water Fund monitoring team,
Steering committee and NGOs implementing Water Fund activities so that Water Fund investment strategies can be adapted if necessary.

The Nature conservancy, Water Management Resources Authority (WRMA), Sustainable Agricultural Community Development Programme (SACDEP), Green Belt Movement and Kenya National Farmers Program

Thanks for your attention
Donors- WLE,
UNDP- GEF, SIDA- ACT!,
IFAD, UNEP, GIZ, TNC
PRIVATE ENTITIES
Corporates-EABL,
Coca- Cola, Nairobi Water
Round Table
Research- Future
Water, Natural Capital
Project, and CIAT
Courtesy of Fred Kihara (TNC)