the multiple measures assessment project re-envisioned...
TRANSCRIPT

The Multiple Measures Assessment Project
Re-Envisioned: Supporting the system’s
leap forward under AB 705
Craig Hayward, RP Group/Bakersfield College
Terrence Willett, RP Group/Cabrillo College
Mallory Newell, RP Group/De Anza College
John Hetts, Educational Results Partnership
April 11, 2018
The RP Conference
Long Beach, CA
http://bit.ly/MMAPRP2018

Agenda
• Requirements of AB 705
• Review of MMAP and results to date
• Adapting MMAP to AB 705
• Examination of success in statistics
• Update on variability among colleges
• Addressing “double placement”
• Placement and support recommendations for English,
Statistics and Gateway STEM Math
• Discussion

AB 705 (Irwin) requirements
• Use of high school performance data
• Use of “highly unlikely” standard
• Maximize student’s probability of completing
transfer-level English and math in their first year
• Optimize student’s probability of completing ESL
sequence in three years

Brief Overview of the Multiple Measures Assessment Project (MMAP)

Data Set for the Models
• CCC students enrolled in an English, Math, Reading or ESL class with
matching high school data in Cal-PASS Plus
• ≈1 M cases for Math & English; ≈200k for Reading & ESL
• Bulk of data from 2008 through 2014
• Rules built from students with 4 years of high school data (≈25% of
sample)
– 70% probability of success or higher required for transfer placement
• MMAP code (http://bit.ly/MMAP_code)
• R Tutorial (http://bit.ly/R_Tutorial)

Variables Explored in the Models
• High school unweighted cumulative GPA
• Grades in high school courses
• CST scores
• Advanced Placement (AP) course taking
• Taking higher level courses
• Delay between high school and community college
• HS English types (expository, remedial, ESL)
• HS math level (Elem Algebra, Integrated Algebra, Pre-
Calculus)

Transfer Level Course Direct Matriculant Non-Direct Matriculant
College Algebra (STEM)
Passed Algebra II (or better)
HS 11 GPA >=3.2 OR
HS 11 GPA >=2.9 AND Pre-
Calculus C (or better)
HS 12 GPA >=3.2 OR
HS 12 GPA >=3.0 AND Pre-
Calculus or Statistics (C or
better)
Statistics (General
Education/Liberal Arts)
Passed Algebra I (or better)
HS 11 GPA >=3.0 OR
HS 11 GPA >=2.3 AND Pre-
Calculus C (or better)
HS 12 GPA >=3.0 OR
HS 12 GPA >=2.6 AND Pre-
Calculus (C or better)
English HS 11 GPA >=2.6 HS 12 GPA >=2.6
Transfer-Level Placement Recommendations
http://bit.ly/RulesMMAP
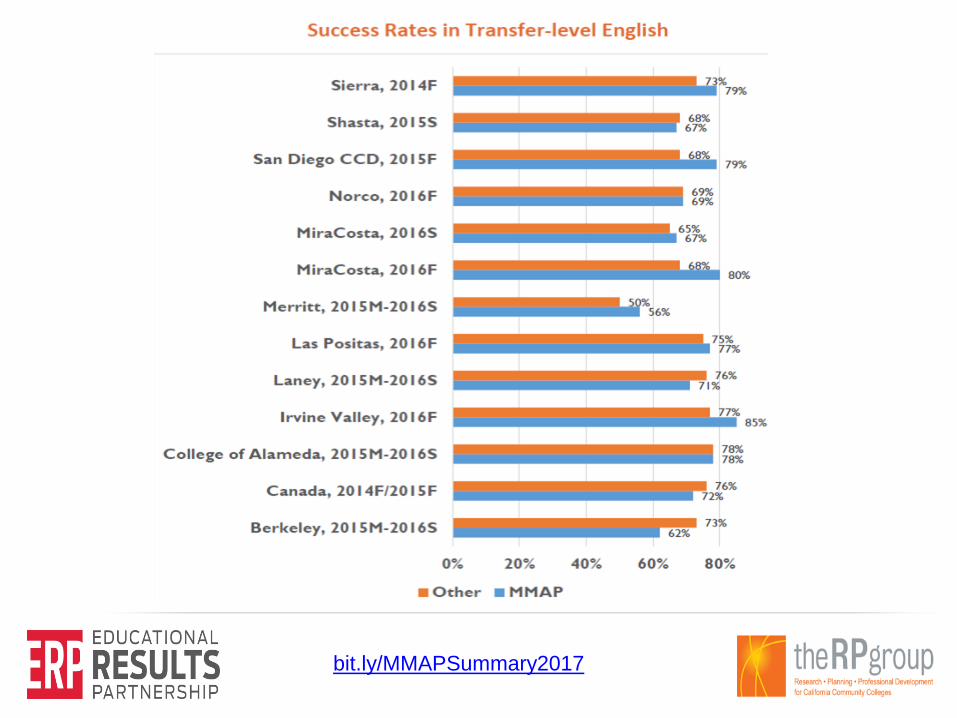


Summary of Differences Between MMAP and
Students Placed Traditionally - English
Comparison Group Metric Difference
Students in transfer-level courses in same term
Success ratesMMAP success rates 2percentage points (pp) higher
Students placed 1 level below in previous year
Completion of transfer-level English in 2 years
MMAP throughput 26 pphigher
Students placed 2 levels below in previous year
Completion of transfer-level English in 2 years
MMAP throughput 40 pphigher
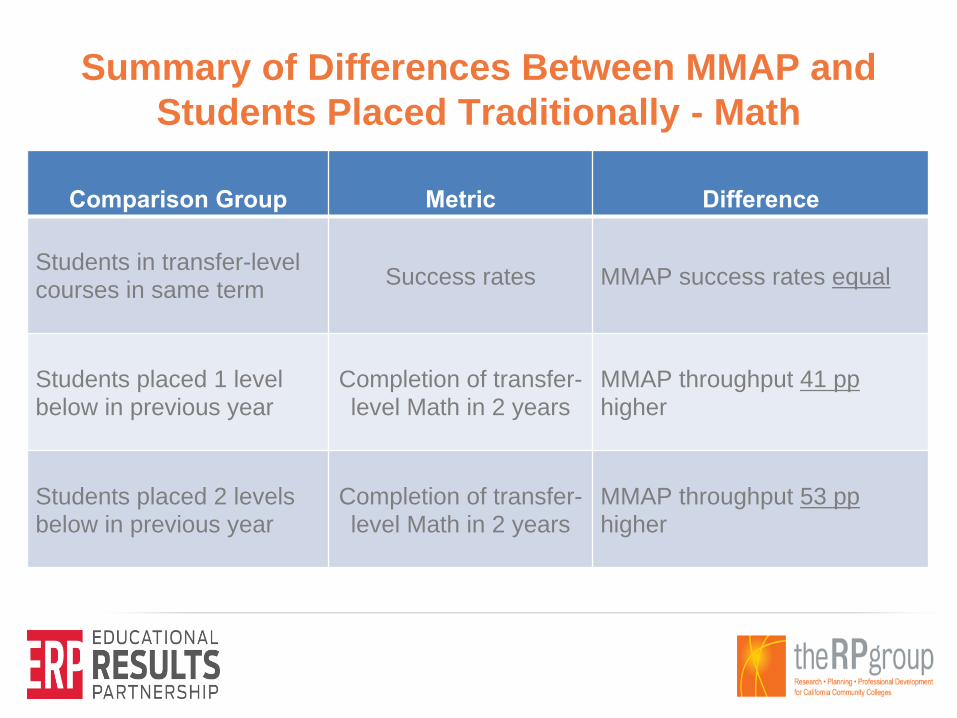
Summary of Differences Between MMAP and
Students Placed Traditionally - Math
Comparison Group Metric Difference
Students in transfer-level courses in same term
Success rates MMAP success rates equal
Students placed 1 level below in previous year
Completion of transfer-level Math in 2 years
MMAP throughput 41 pphigher
Students placed 2 levels below in previous year
Completion of transfer-level Math in 2 years
MMAP throughput 53 pphigher

Summary of MMAP Classic
– Success rates of students placed by MMAP are ≥ students placed
directly into transfer-level using the institutions traditional placement
method
• even though MMAP placement 2-5X increase into transfer level courses
– Successful completion of transfer level course (throughput) is 20
(English) to 40 (Math) percentage points higher than for students
placed even just one level below.
– Implementation of MMAP rules can be nuanced
• Don’t use statistics rules to place into trigonometry or precalculus
• Placement messaging should be done once with single recommendation and
specifically state recommended course(s)
– Collaboration between high schools and colleges has increased

Adapting MMAP to AB 705
It’s all about throughput. #MaximizeThroughput

Adapting MMAP to AB 705
• MMAP decision trees were based on identifying students
who were highly likely to be successful
– At least 70% probability of success in transfer-level
• Now, students can only be assigned to remediation if:
– They are highly unlikely to succeed at the transfer-level class
– AND
– Remediation maximizes their probability of throughput


What is a “Throughput Rate”?
• The probability of getting to and through a gateway
course within a specified period of time.
• Throughput rate (AB 705): The proportion of a cohort of
students who complete the transferable or gateway
math or English course within two primary semesters
or three primary quarters of entering their first course in
the sequence.

Transfer-Level English Throughput
Rates
Source: MMAP English Decision Rules, page 8:
http://bit.ly/MMAPEnglishTrees
English students with < 1.90 high school GPA
Starting at transfer-level: 7,294
Starting one-level below: 13,241

Maximizing Throughput: English
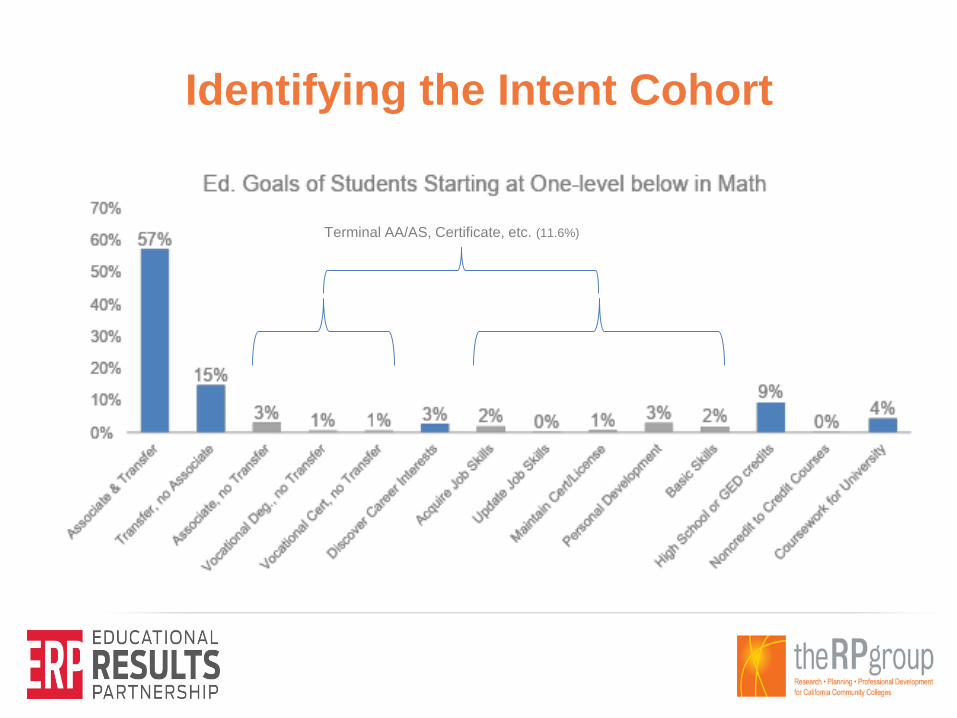
Identifying the Intent Cohort
Terminal AA/AS, Certificate, etc. (11.6%)

Statistics
Decision Tree

Statistics Throughput Rates
Source: MMAP Math Decision Rules, page 23:
http://bit.ly/MMAPMathTrees
Statistics students with < 2.30 high school GPA
Starting at transfer-level: 1,485
Starting at one-level below: 11,309

Maximizing Throughput: Statistics

Variability by College for Statistics
• Variability in success and throughput rates exists among colleges
• Interest in determining if there are colleges where below transfer level
remediation results in throughput rates that exceed direct placement
• We examined college variability for statistics comparing direct placement into
statistics vs. throughput from one level below for students with HS GPA < 2.3
• Throughput rates adjusted upward to factor out those not
seeking transfer and not on a statistics/liberal arts math (SLAM) path
• Matched these throughput rates with success rates of similar students placed
directly into transfer-level statistics to create a direct placement delta statistic
– I.e., the success rate when placed directly in stats minus the throughput rate from
one level below.
– Values > 0 mean students are more likely to complete statistics when placed directly
– Colleges with fewer than 20 cases excluded
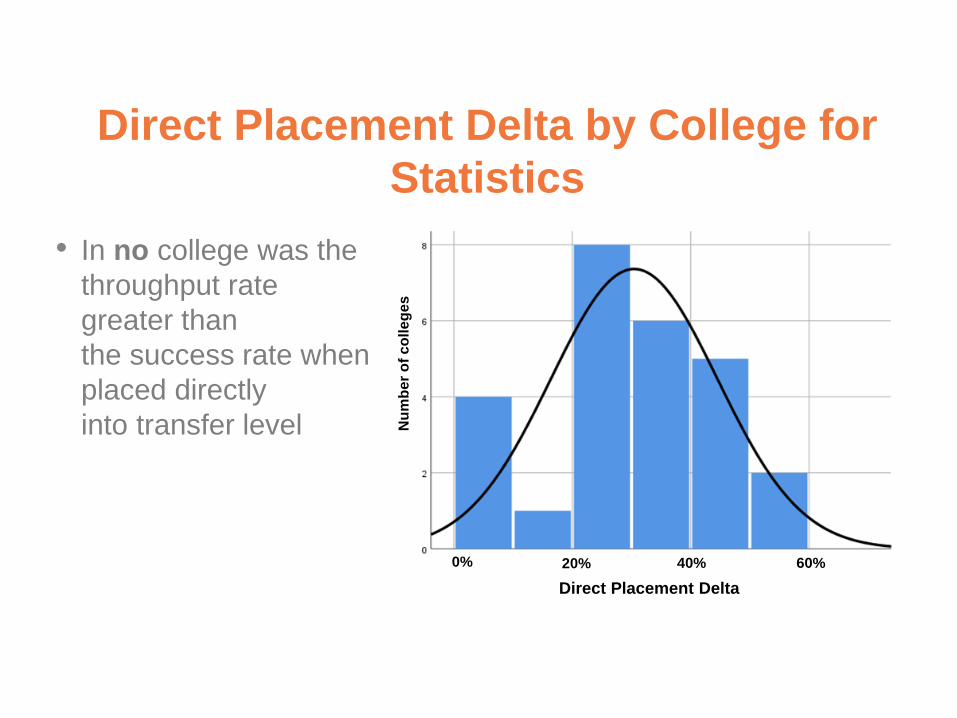
Direct Placement Delta by College for
Statistics
• In no college was the
throughput rate
greater than
the success rate when
placed directly
into transfer level Nu
mb
er
of
co
lle
ge
s
Direct Placement Delta
0% 20% 40% 60%

The BSTEM ‘Intent Cohort’
• Which students intend to pursue a calculus-oriented
Business-STEM math pathway from one-level below?
• Some students have a goal of a terminal associate’s
degree and one-level below satisfies their requirement
• Some students intend to pursue a Statistics or Liberal
Arts Math pathway
• How to distinguish intent?

The BSTEM ‘Intent Cohort’
• Remove those with a non-transfer educational goal
(11.6%)
• Remove those on the SLAM path
– Of those who progress to transfer-level math, 75% take
SLAM vs. Precalculus, Calculus, Trig., or Business Calculus
– Reduce remaining one-level below starting cohort by 75%
• Product of this process is the BSTEM intent cohort
– This will be the denominator for BSTEM throughput rates
– The denominator is reduced to 3,200 from 14,478

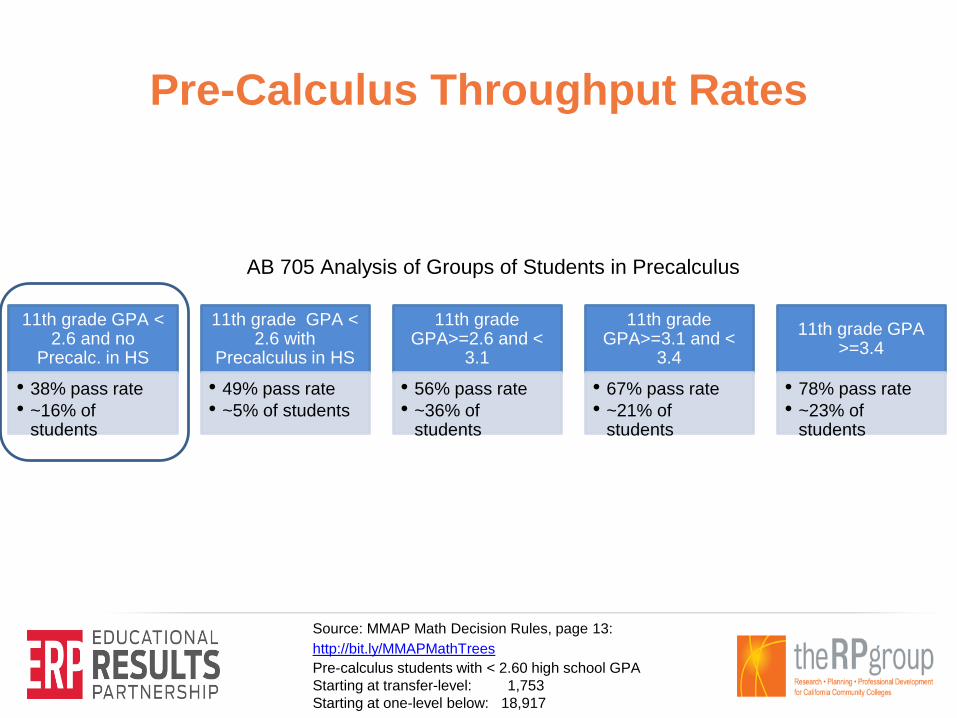
Pre-Calculus Throughput Rates
AB 705 Analysis of Groups of Students in Precalculus
11th grade GPA < 2.6 and no
Precalc. in HS
• 38% pass rate
• ~16% of students
11th grade GPA < 2.6 with
Precalculus in HS
• 49% pass rate
• ~5% of students
11th grade GPA>=2.6 and <
3.1
• 56% pass rate
• ~36% of students
11th grade GPA>=3.1 and <
3.4
• 67% pass rate
• ~21% of students
11th grade GPA >=3.4
• 78% pass rate
• ~23% of students
Source: MMAP Math Decision Rules, page 13:
http://bit.ly/MMAPMathTrees
Pre-calculus students with < 2.60 high school GPA
Starting at transfer-level: 1,753
Starting at one-level below: 18,917

Pre-Calculus Lowest Node
• 3,200 students with < 2.6 HSGPA and no precalculus
in high school by grade 11 began at one-level below
transfer math with intent to pursue a BSTEM path
– 1,035 attempt a BSTEM class within one year
(32.3%)*
– 453 are successful in any BSTEM class, including
College Algebra (14.2%)
• Throughput from one-level below into BSTEM is 14.2%
• If placed directly into Precalculus, throughput is 38%

Maximizing Throughput: Pre-Calculus

Exploring the “Double Placement” Bias
• Differences in HS GPA, test scores, and other factors exist among
students at different placement levels
• If a low HS GPA student who would have previously been placed into
below transfer level is allowed direct access to transfer level course,
what are the expected success rates compared to throughput rates
from remedial sequences?
• Using success rate predictions from the MMAP decision-tree
analyses may not fully account for letting “weaker” students into
transfer level
• We examine this issue for college composition, statistics, and
precalculus focusing on the lowest node of each decision tree

Adjusting Projected Success Rates
• Difference in GPA and placement test score can be
statistically accounted for and the projected success rates
of students from lower placement levels can be adjusted
(lowered)
• The magnitude of the adjustment depends on:
– the extent of the differences in test scores and GPA between those
in the MMAP models and those who would potentially be entering
via the decision rules, and;
– the strength of the association between the test scores/GPA and
success in the target class


Technical Details of Adjustment
Process
• Use multivariate regression to predict success rate in target transfer-level using GPA and test scores
• Gaps in predicted success rates among five placement levels are fitted to observed success rates to preserve proportionality
• Relative gaps are applied to the original PPV and predicted success rates for students from each level are derived
• A weighted average based on number of students at each level who would be affected is calculated to yield overall adjusted predicted success rate
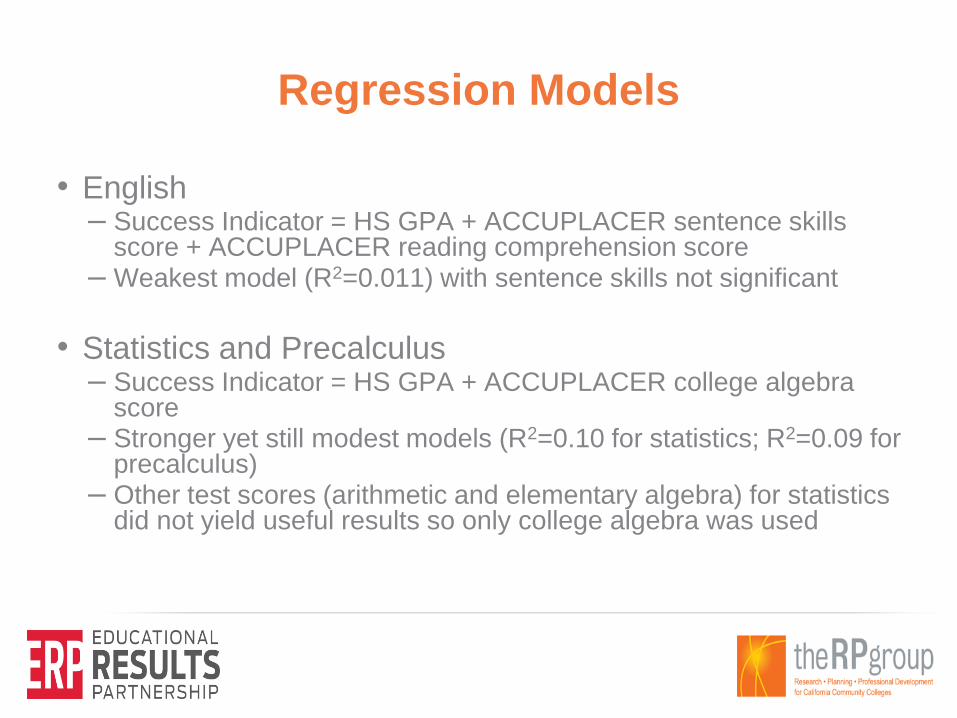
Regression Models
• English– Success Indicator = HS GPA + ACCUPLACER sentence skills
score + ACCUPLACER reading comprehension score– Weakest model (R2=0.011) with sentence skills not significant
• Statistics and Precalculus– Success Indicator = HS GPA + ACCUPLACER college algebra
score – Stronger yet still modest models (R2=0.10 for statistics; R2=0.09 for
precalculus)– Other test scores (arithmetic and elementary algebra) for statistics
did not yield useful results so only college algebra was used

Regression Adjusted Success Rates(error bars represent ±1 se)

Putting it all together:Multiple Measures and Corequisite Support
Mathematics at Cuyamaca College English at Skyline College
• Disjunctive placement (higher of test-
based or MM-based placement –
adapted f/Phase 1 MMAP
– Algebra I with C or better plus
HSGPA ≥ 2.8: Statistics with
corequisite support
– Algebra II with C or better and
HSGPA ≥ 2.8: College algebra or
higher w/corequisite support
– Other MMAP placement
recommendations for higher
placement without support
• Phased transition over three years
– Accelerated developmental
education at one level below
– Then, MMAP implementation of
English placement recommendations
and corequisite developmental
education courses
Adapted from MMAP Webinar: Implementing and Improving
Your MMAP Process - Examples from Pilot Colleges,
available at http://bit.ly/WebinarsMMAP
For more, please see recent publications by the California Acceleration Project:
Leading the Way: http://bit.ly/CAPCuyamaca and Up to the Challenge:
http://bit.ly/CAPChallenge
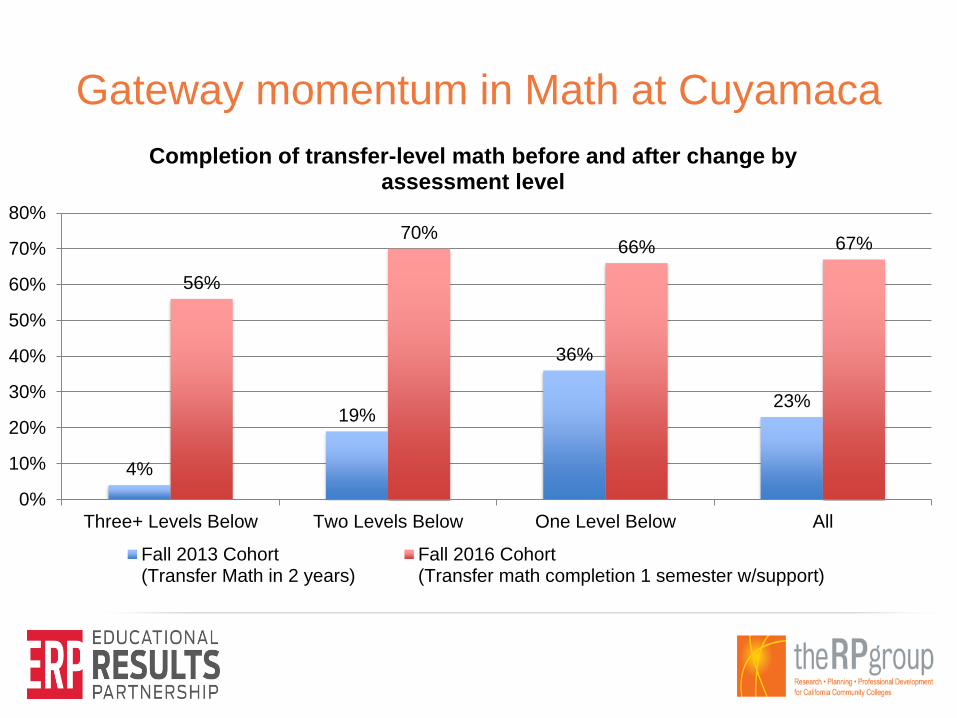
4%
19%
36%
23%
56%
70%66% 67%
0%
10%
20%
30%
40%
50%
60%
70%
80%
Three+ Levels Below Two Levels Below One Level Below All
Completion of transfer-level math before and after change by assessment level
Fall 2013 Cohort(Transfer Math in 2 years)
Fall 2016 Cohort(Transfer math completion 1 semester w/support)
Gateway momentum in Math at Cuyamaca

Gateway momentum in English at Skyline
47%
40%
14%
80%
17%
3%
0%
10%
20%
30%
40%
50%
60%
70%
80%
90%
Transfer-Level One Level Below Two Levels Below
English placement by level and cohort
Fall 2013 Fall 2016
67% 65%69%
0%
10%
20%
30%
40%
50%
60%
70%
80%
Successful rate by cohort and course type
Fall 2013Transfer Level(f/Datamart)
F2015-S2017(traditional)
F2015-2017(w/support)

http://bit.ly/CCABridgeBuilders
(In two years for prerequisite models, in first year for corequisites)

Successful completion within 1 year vs. corequisite
results by testing level - TN
http://bit.ly/TNCoreq

What should the standard of comparison be?
Mathematics English
10%
29%
56%
33%
0%
10%
20%
30%
40%
50%
60%
70%
80%
Throughput(f/1 levelbelow)
DirectPlacement(adjusted)
CuyamacaCoreq
>3 levelsbelow
TennesseeCoreq
<13 ACT
12%
39%
69%
54%
0%
10%
20%
30%
40%
50%
60%
70%
80%
Throughput(f/1 levelbelow)
DirectPlacement(adjusted)
CuyamacaCoreq
>3 levelsbelow
TennesseeCoreq
<13 ACT

Summary for AB 705
• Moderate to high performing high school students must be
placed directly into transfer-level courses by law.
• Evidence to date suggests that even lowest performing HS
students are more likely to complete transfer-level English &
math (Statistics for SLAM, PreCalculus for STEM students with
HS intermediate algebra) if placed there directly
– compared to if placed in a developmental education sequence
– especially if provided concurrent support
• To use alternative, colleges must show that students will be
more likely to complete transfer-level courses within one year

High School
Performance AB 705-Compliant Placement
HSGPA ≥ 2.6Transfer-Level English Composition
No additional academic or corequisite support required
HSGPA 1.9 - 2.6Transfer-Level English Composition
Additional academic and corequisite support recommended
HSGPA < 1.9
Transfer-Level English Composition
Additional academic and corequisite support strongly
recommended
For students with high school transcripts within 10
years of enrollment at CC, excluding students who
are locally advised to take the ESL test.
Placement/Support Recommendations for
English
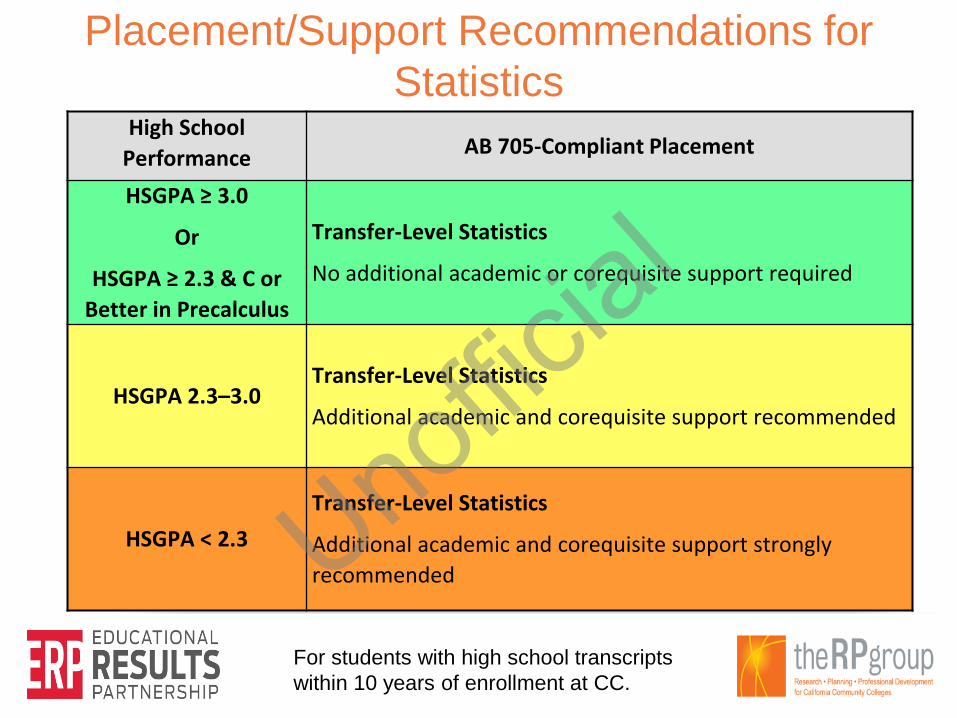
High School
Performance AB 705-Compliant Placement
HSGPA ≥ 3.0
Or
HSGPA ≥ 2.3 & C or
Better in Precalculus
Transfer-Level Statistics
No additional academic or corequisite support required
HSGPA 2.3–3.0Transfer-Level Statistics
Additional academic and corequisite support recommended
HSGPA < 2.3
Transfer-Level Statistics
Additional academic and corequisite support strongly
recommended
For students with high school transcripts
within 10 years of enrollment at CC.
Placement/Support Recommendations for
Statistics

Discussion

MMAP Research Team
Terrence Willett
The RP Group
Mallory Newell
The RP Group
Craig Hayward
The RP Group
Kristen Fong
The RP Group
John Hetts
Educational Results Partnership
Ken Sorey
Educational Results Partnership
Daniel Lamoree
Educational Results Partnership
Rachel Baker
UC Irvine
Nathan Pellegrin
The RP Group
Peter Bahr
University of Michigan
Loris Fagioli (Phase II researcher)
The Rp Group