the monthly - hardman & co · furthermore, bt – the originator of widespread privatisation...
TRANSCRIPT

THE MONTHLY
March 2020

FMarch 201
March 2020 2
Table of contents Feature article ........................................................................................................................3
Privatisation: Whose flame has burnt the brightest? .............................................................3
Major privatisations ..............................................................................................................................5
Privatisation winners ...........................................................................................................................7
Privatisation losers ............................................................................................................................. 12
Conclusion ............................................................................................................................................. 13
Company research ............................................................................................................. 15
Advanced Oncotherapy ................................................................................................................... 16
Allergy Therapeutics ......................................................................................................................... 17
Arbuthnot Banking Group .............................................................................................................. 18
Arix Bioscience ..................................................................................................................................... 19
B-North ................................................................................................................................................... 20
Burford Capital .................................................................................................................................... 21
City of London Investment Group .............................................................................................. 22
Diurnal Group ...................................................................................................................................... 23
Filta Group ............................................................................................................................................. 24
genedrive plc ......................................................................................................................................... 25
Non-Standard Finance ..................................................................................................................... 26
Palace Capital ....................................................................................................................................... 27
Pantheon International .................................................................................................................... 28
Phoenix Copper Ltd ........................................................................................................................... 29
Primary Health Properties.............................................................................................................. 30
R.E.A. Holdings ..................................................................................................................................... 31
Real Estate Credit Investments .................................................................................................... 32
RM Secured Direct Lending ........................................................................................................... 33
Shield Therapeutics ........................................................................................................................... 34
Surface Transforms............................................................................................................................ 35
The 600 Group..................................................................................................................................... 36
Tissue Regenix...................................................................................................................................... 37
Urban Logistics .................................................................................................................................... 38
Volta Finance ........................................................................................................................................ 39
Notes .................................................................................................................................... 40
Disclaimer ............................................................................................................................ 41
The prices used in this publication were those as at 21 February 2020 (unless otherwise stated). Clearly in some cases there has been a material change in market sentiment since then.
Privatisation: Whose flame has burnt the brightest?
March 2020 3
Feature article Privatisation: Whose flame has burnt the brightest?
► Much of the UK’s privatisation programme took place between the early 1980s and the mid-1990s: subsequent sales have been few. Undoubtedly, privatisation attracted many private investors to the market, many for the first time.
► Following the 50.2% sale of British Telecom (BT) shares in 1984, which was the first mass privatisation, other utility stocks were sold off, notably British Gas (BG), the English and Welsh water companies and virtually all the electricity supply sector.
► The transport sector saw several sales, notably in aviation with British Airways (BA) and British Airports Authority (BAA), along with various railway, ports and bus companies.
► Many privatisation stocks have materially outperformed the FTSE-100 since their flotation ‒ the 12 Regional Electricity Companies (RECs), all of which were bought out during the bidding frenzy in the late 1990s, being examples. In addition, quoted water companies, such as Pennon, the owner of South West, and Severn Trent have seen share price rises of between 10x and 15x.
► National Grid, which was privatised via the RECs, is now valued at a formidable £36.5bn; it is one of the EU’s most valuable utilities. The various components of the dismembered British Gas have generally prospered, despite Centrica’s recent plunge. Among the transport stocks, BAA has been the star performer; it was taken over for £10.3bn in 2006.
► However, there have been serial underperformers. Railtrack, most controversially, was re-nationalised with compensation at ca.15% of its peak value. British Energy became a virtual dotcom stock and collapsed when power prices fell sharply. Welsh Water’s owner, Hyder, also failed, despite the very favourable financial settlement put in place for its core business at flotation.
► Furthermore, BT – the originator of widespread privatisation – has seen its share price perform dreadfully. The current price is little changed from its fully paid flotation price in 1984. More recently, shares in Royal Mail, privatised in 2013, have plunged as letter volumes decline.

Privatisation: Whose flame has burnt the brightest?
March 2020 4
During the period of Conservative Government in the 1980s and early 1990s, an extensive privatisation programme was undertaken, with a raft of publicly owned companies being sold to the private sector.
Many of these companies prospered; there was also considerable takeover activity, especially in the energy sector, while a few privatised companies failed.
A key driver of the privatisation programme was to deliver greater efficiencies – and to reduce prices, especially for utility customers.
Funding large investment programmes was also regarded as a priority since, under state ownership, securing capital expenditure funding had always been a challenge. The Water Authorities and British Rail, Railtrack’s predecessor, had been particularly affected by serious levels of under-investment.
Allied to these financial factors was the political determination to create a share-owning democracy – on a similar basis to the property-owning democracy of previous years.
Part privatisation of British Telcom (BT) in 1984 and, subsequently, of other utilities attracted the interest of millions of new investors – the innovative ‘tell Sid’ campaign devised to sell shares in British Gas (BG) was peculiarly effective.
In recent years, various spectacular failings, especially of much of the banking sector in 2008/09, have driven away many private investors from the market, but they may return. This issue was discussed in two previous leading articles for the Hardman and Co Monthly in January and February 2020.
1980s and early 1990s were prime years
for privatisation
Investment was the driver
The quest for a share-owning democracy
Millions of new shareholders attracted

Privatisation: Whose flame has burnt the brightest?
March 2020 5
Major privatisations Prior to the part sale of BT shares in 1984, there were various low-profile disposals of government-owned stakes predominantly to institutional shareholders; they included shares in Cable and Wireless and the now BAE Systems, inter alia.
In subsequent years, the sale of stakes in BP and Enterprise Oil – the latter was eventually acquired by Shell – also took place.
The table below lists the largest privatisations – all of which were directed towards private investors.
Major privatisations Company Year of flotation British Telecom 1984 British Gas 1986 British Airports Authority 1986 British Airways 1987 British Steel 1988 10 English/Welsh water companies 1989 12 English/Welsh regional electricity companies 1990 2 English/Welsh electricity generators 1991 2 Scottish electricity companies 1991 Northern Ireland Electricity 1993 British Energy 1996 Railtrack 1996 Royal Mail 2013
Source: Hardman & Co Research
The unprecedented 50.2% initial sale of BT in 1984 set trends in several respects that were copied by many overseas governments. First, private investors were heavily incentivised to apply for shares. Secondly, a price regulation system was imposed on BT, to prevent its customers being exploited. At that time, BT was an effective monopolist (outside Hull, which had its own network), despite the participation at the fringes of Cable and Wireless’ Mercury subsidiary, while mobile telephony was still in its infancy.
In 1986, it was BG that was privatised – on the back of a very high-profile advertising campaign. Controversially, BG remained a gas monopoly for many years, thereby requiring a complex – and much debated – price regulatory system revolving around its Transco subsidiary.
Thereafter, the privatisation focus moved to the transport sector, with British Airports Authority (BAA), the owner of the UK’s key airports, being floated, followed by its major customer, British Airways (BA), in 1987.
Following the re-election of the Conservative Government in 1987, the water sector in England and Wales was next to be sold, led by Thames. It was the first regionally based privatisation and it proved very popular.
The complex disaggregation of the electricity supply industry enabled its almost total privatisation from 1990 onwards, led by the 12 Regional Electricity Companies (RECs). The £5.2bn sector valuation figure was widely seen as being desperately generous to investors – and so it proved. And, like water investors, they applied in very large numbers.
The BT part sale in 1984 launched mass
privatisation
Then came British Gas – sold like soap
powder
Then transport
In 1989, water…
… followed by electricity
Privatisation: Whose flame has burnt the brightest?
March 2020 6
Subsequently, the first tranche of shares in both leading generators, National Power and PowerGen, were sold; this process was followed by the two integrated Scottish companies, ScottishPower and Scottish Hydro-Electric. North Ireland Electricity’s privatisation followed in 1993.
Significantly, the three major privatisations since 1993 have all been far less successful. British Energy collapsed on the back of low electricity prices; it was essentially – and dangerously – a price-taker. Railtrack was controversially re-nationalised in 2001, while the share price of Royal Mail is currently languishing at almost 50% below its 2013 flotation price.
Looking forward, the privatisation cupboard is quite bare. Network Rail, with net debt of over £54bn, is a possible – if somewhat theoretical – candidate, along with NATS, the air traffic control business. Scottish Water and Northern Ireland Water, too, could be floated, despite political opposition locally.
The three post-1993 privatisations were
less successful
Bar Network Rail and NATs, the cupboard
looks bare

Privatisation: Whose flame has burnt the brightest?
March 2020 7
Privatisation winners Virtually all the utilities privatised in the 1980s and in the early 1990s have delivered decent returns – and, in some cases, mightily impressive ones.
The four stand-out investments are two of the quoted water companies, namely Pennon and Severn Trent, National Grid and British Gas; all have delivered quite remarkable value for many for their investors.
Leaving aside Hyder, the holding company of Welsh Water, which failed in 1997, the remaining nine privatised water companies have delivered good shareholder returns. However, of the nine, only three remain publicly quoted.
Pennon, with its successful – if volatile – Viridor waste business has truly prospered, with a current share price, after adjustment for a 3/1 scrip issue in 2006, of ca.£35, compared with the 240p flotation price in 1989; this is equivalent to a staggering ca.14.5x increase since 1989.
Pennon’s very impressive share price graph, based on the post-scrip issue price, is reproduced below.
Pennon – share price performance since flotation
Source: Hardman & Co Research
Severn Trent, which – apart from the integration of Dee Valley and Hafren Dyfrdwy, two small water companies – effectively remains the same business as at flotation. Its share price at £26 is now more than 10x its 1989 flotation price, once some minor adjustments are made.
The share price of United Utilities, the third quoted water company, has also risen appreciably over the same period.
Daily PNN.L 28/06/1989 - 17/06/2021 (LON)Line, PNN.L, Trade Price(Last), 19/02/2020, 1,195.5, +19.5, (+1.66%) Price
GBp
Auto100
200
300
400
500
600
700
800
900
1,000
1,100
1,195.5
1990 1992 1994 1996 1998 2000 2002 2004 2006 2008 2010 2012 2014 2016 2018 20201990 2000 2010 2020
Four of the best performers
Pennon prospers

Privatisation: Whose flame has burnt the brightest?
March 2020 8
National Grid was indirectly privatised through the flotation of the 12 RECs in 1990, each of whom held a share in the business, as listed below. An implicit value has also been ascribed to each stake, based on National Grid’s current £36.5bn market value; it should be noted that National Grid has undertaken various fundraising initiatives, in part to finance its burgeoning US investments, since it was demerged in 1995.
REC National Grid shareholdings REC NG share (1990) NG value (£bn) (2/2020) Eastern 12.5% 4.6 East Midlands 8.4% 3.1 London 10.5% 3.8 Manweb 5.5% 2.0 Midlands 9.2% 3.4 Northern 6.5% 2.4 Norweb 8.2% 3.0 Seeboard 7.3% 2.7 Southern 11.0% 4.1 South Western 6.3% 2.3 Swalec 5.4% 2.0 Yorkshire 9.2% 3.4
Source: Hardman & Co Research
From comparatively modest beginnings, National Grid, with its £36.5bn capitalisation, is now one of the most valuable utilities in the EU after Italy’s ENEL (£69bn) and Spain’s Iberdrola (£61bn). Its current £62bn Enterprise Value (EV) figure should be compared with the £5.2bn value placed initially on the REC sector in 1990. Even if a 20% National Grid value were accorded to the latter figure, this would amount to an imputed flotation value of just £1.04bn.
Significantly, too, National Grid’s share price has rallied of late, as the graph below shows, following the decisive General Election result last December, which removed any real threat of some form of re-nationalisation undertaken by an incoming Labour Government.
National Grid – share price performance since flotation
Source: Hardman & Co Research
Daily [.FTSE List 61 of 102] NG.L 11/12/1995 - 24/05/2021 (LON)Line, NG.L, Trade Price(Last), 21/02/2020, 1,065.6, +8.6, (+0.81%) Price
GBp
Auto1502002503003504004505005506006507007508008509009501,0001,0501,100
1,065.6
1996 1998 2000 2002 2004 2006 2008 2010 2012 2014 2016 2018 20201990 2000 2010 2020
National Grid’s shareholder returns have
been impressive
Now one of the EU’s biggest utility beasts

Privatisation: Whose flame has burnt the brightest?
March 2020 9
Since its privatisation in 1986, British Gas has been demerged into three major entities. The key E and P division was sold to Shell in 2016 for ca.£47bn – at a time when oil and gas prices were high.
To that figure, the value of the gas transportation business should be added; after demerger, it became the core business of Lattice, which merged with National Grid in 2002. The assets of the struggling Centrica, whose very poor share price performance in recent years is illustrated below, should also be included.
Centrica – 5-year share price performance
Source: Hardman & Co Research
The 12 RECs, all of whom were taken over during a frenzy of corporate activity in the mid/late 1990s, also provided highly impressive returns for most investors. All the take-out prices were far in excess of the very modest £5.2bn value ‒ including the National Grid shareholdings ‒ placed on the sector at flotation.
Elsewhere in the electricity sector, shareholder returns from the two UK generators, National Power and PowerGen, were also impressive, although they were less than those of most RECs.
While Drax Group remains quoted, encompassing the eponymous – and legendary – 3,960MW coal-fired/biomass plant acquired indirectly from National Power, it is Scotland’s integrated SSE that provides a more valid comparison.
Having acquired Southern Electric in 1998, SSE has continued to invest in renewable energy – an undoubted boost to its share price rating, as the graph below shows.
Daily [.FTSE List 24 of 102] CNA.L 20/02/2015 - 26/05/2020 (LON)Line, CNA.L, Trade Price(Last), 19/02/2020, 75.100, +1.440, (+1.95%) Price
GBp
Auto
80
100
120
140
160
180
200
220
240
260
280
75.100
Q2 Q3 Q4 Q1 Q2 Q3 Q4 Q1 Q2 Q3 Q4 Q1 Q2 Q3 Q4 Q1 Q2 Q3 Q4 Q1 Q22015 2016 2017 2018 2019 2020
Split into three entities
12 RECs disappeared in a takeover frenzy
SSE is now a top renewables player

Privatisation: Whose flame has burnt the brightest?
March 2020 10
SSE – 10-year share price performance
Source: Hardman & Co Research
The issue of SSE’s renewable generation valuation, along with those of other renewable energy infrastructure funds (REIFs), was addressed in Hardman and Co’s recent sector publication, UK Renewable Energy Infrastructure Funds – A 20/20 Vision.
On the privatised transport front, there have been some obvious winners led by the BAA, which has been disaggregated in recent years; Heathrow and Gatwick airports are now in different ownership.
Nonetheless, starting out in 1987 with a flotation value of £1.3bn, BAA was bought in 2006 by a consortium led by Spain’s Ferrovial for £10.3bn.
Its major client, BA, was privatised in 1987 at 125p per share; it has performed well – until the recent coronavirus concerns. Its share price, now quoted within International Airlines Group, is robust currently: volatile oil prices have been a key factor in recent years as they have a heavy impact on the annual fuel bill and, consequently, on the share price rating.
Reproduced below is a 5-year graph for IAG, which also incorporates leading Spanish airlines, including both Iberia and Vuelig. It does not include the very adverse risks implied by the spread of coronavirus.
Daily [.FTSE List 92 of 102] SSE.L 22/02/2010 - 26/08/2020 (LON)Line, SSE.L, Trade Price(Last), 19/02/2020, 1,689.5, +5.0, (+0.30%) Price
GBp
Auto1,000
1,050
1,100
1,150
1,200
1,250
1,300
1,350
1,400
1,450
1,500
1,550
1,600
1,650
1,689.5
2011 2012 2013 2014 2015 2016 2017 2018 2019 20202010 2020
Heavy profits on BAA privatisation

Privatisation: Whose flame has burnt the brightest?
March 2020 11
IAG – 5-year share price performance
Source: Hardman & Co Research
There have been other transport privatisations that have materially benefited shareholders, especially where acquisitions have been involved, such as the privatised Associated British Ports, which was sold for £2.8bn to a Goldman Sachs-led consortium in 2006.
In assessing any degree of share price outperformance, it is necessary to recognise that the market has performed strongly – despite the 2008/09 banking crisis ‒ since the early 1990s as the FTSE-100 data in the table below, dating back to 1985, illustrates.
5-year FTSE-100 performances Year Value 1985 1,232 1990 2,423 1995 3,066 2000 6,930 2005 4,814 2010 5,413 2015 6,556 2020 7,542
Source: Hardman & Co Research
Any outperformance of the market, therefore, needs to have seen at least a trebling of the underlying share price, after any material adjustments, from the late 1980s/early 1990s period.
Daily [.FTSE List 41 of 102] ICAG.L 20/02/2015 - 26/05/2020 (LON)Line, ICAG.L, Trade Price(Last), 19/02/2020, 640.8, +8.8, (+1.39%) Price
GBp
Auto
360
390
420
450
480
510
540
570
600
630
660
690
720
640.8
Q2 Q3 Q4 Q1 Q2 Q3 Q4 Q1 Q2 Q3 Q4 Q1 Q2 Q3 Q4 Q1 Q2 Q3 Q4 Q1 Q22015 2016 2017 2018 2019 2020
ABP sold for a good premium
Strong performance from the FTSE-100

Privatisation: Whose flame has burnt the brightest?
March 2020 12
Privatisation losers Within the privatised portfolio, it is perhaps inevitable that there would be some failures. Ironically, it was the performance of the first major privatisation stock, BT, which has been particularly dire.
For more than 20 years, its underlying annual EBITDA ‒ once a raft of adjustments has been made, especially for the £12.5bn EE mobile telecoms acquisition ‒ has been becalmed at ca.£6bn.
Furthermore, BT’s current share price – more than 35 years after its market debut – is almost identical to its fully paid flotation price back in 1984. The surge in its share price around the turn of the century – driven by the TMT (Telecoms, Media, Technology) bubble ‒ proved to be illusory; indeed, in 2001, it launched a massive £5.9bn rights issue.
The graph below, which goes back to 1985 – shortly after the first tranche of BT shares was floated – illustrates this very poor performance, during a period when the FTSE-100 has more than trebled.
BT – share price performance since 1985
Source: Hardman & Co Research
Prior to the first BT share offering in 1984, the Government sold a minority stake in Cable and Wireless, which had flourished under the banner of the British Empire. Having sold its pivotal Hong Kong Telecom business, Cable and Wireless’ demise was rapid. As a result of some dreadfully ill-advised – and extremely expensive ‒ acquisitions, it was finally split up, with much of its UK fixed line network going to Vodafone.
The British Steel story is also depressing. Having been privatised in 1988, it was eventually bought – under Corus, its new name – by India’s Tata conglomerate in 2007. Subsequently, it has been progressively wound down.
Daily [.FTSE List 21 of 102] BT.L 07/03/1985 - 09/12/2021 (LON)Line, BT.L, Trade Price(Last), 19/02/2020, 154.740, -1.080, (-0.69%) Price
GBp
Auto1001502002503003504004505005506006507007508008509009501,0001,050
154.740
1986 1988 1990 1992 1994 1996 1998 2000 2002 2004 2006 2008 2010 2012 2014 2016 2018 20201980 1990 2000 2010 2020
Dire BT performance
Flat adjusted EBITDA for a generation
Flat share price too

Privatisation: Whose flame has burnt the brightest?
March 2020 13
Welsh Water and British Energy are two privatised utilities that failed to prosper: eventually, both effectively folded and many shareholders lost out. The collapse of the Hyder-owned Welsh Water took place within a decade of the latter being privatised with a large and guaranteed customer base, a real 6.5% annual price increase for its first five years in the private sector and a healthy cash balance at flotation.
British Energy, which owned all the major UK nuclear plants, including the Pressurised Water Reactor (PWR) at Sizewell, was always very vulnerable to low power prices. When they did indeed plunge, British Energy was caught short – leaving many shareholders nursing heavy losses.
Another high-profile casualty was Railtrack, which was suddenly nationalised in 2001, ostensibly due to a massive capital expenditure liability. Eventually, after prolonged legal hearings, shareholders received compensation of ca.260p per share – Railtrack’s share price had peaked at over £17.
Another loser, to date at least, has been Royal Mail. It was privatised in 2013 and, after initial enthusiasm, has struggled. Letter volumes are falling fast, industrial unrest remains a real risk and issues related to its pension fund liabilities endure. The graph of Royal Mail’s sorry share price performance reflects these serious challenges.
Royal Mail – 5-year share price performance
Source: Hardman & Co Research
Conclusion Clearly, stock selection of privatised companies has been key. Some companies were very severely under-priced at flotation and their share prices boomed subsequently; others have stumbled badly.
The energy sector provides a good comparison. Both National Grid and British Energy were privatised in the early 1990s; the former is now one of the EU’s most valuable utilities, while the latter collapsed within a few years of being brought to market.
Caveat emptor.
Daily RMG.L 20/02/2015 - 26/05/2020 (LON)Line, RMG.L, Trade Price(Last), 19/02/2020, 172.70, -6.70, (-3.74%) Price
GBp
Auto
200
240
280
320
360
400
440
480
520
560
600
172.70
Q2 Q3 Q4 Q1 Q2 Q3 Q4 Q1 Q2 Q3 Q4 Q1 Q2 Q3 Q4 Q1 Q2 Q3 Q4 Q1 Q22015 2016 2017 2018 2019 2020
Two utility casualties
British Energy – dotcom stock
Railtrack also went down
Nor is Royal Mail too clever
National Grid vs. British Energy – which
prevailed for investors?

Privatisation: Whose flame has burnt the brightest?
March 2020 14
About the author
Nigel Hawkins is the Utilities sector analyst at Hardman & Co.
Nigel is responsible for analysing the UK Utility companies, including those privatised in the 1980s and 1990s, as well as newer arrivals in the sector. He has been involved in the Utilities sector since the late 1980s, as a feature writer at Utility Week magazine and as an analyst at Libertas Capital. Prior to that, he was the Telecoms analyst at Williams de Broë. Between 1989 and 1995, he worked at Hoare Govett as the Water and Electricity analyst.
Between 1984 and 1987, Nigel was the Political Correspondence Secretary to Lady Thatcher at 10 Downing Street.
Nigel joined Hardman & Co in February 2016. He holds a BA (Hons) in Law, Economics and Politics from the University of Buckingham. He is an associate of the Institute of Chartered Secretaries and Administration and a senior fellow of the Adam Smith Institute.

The Monthly
March 2020 15
Company research Priced at 21 February 2020 (unless otherwise stated).

The Monthly
March 2020 16
ADVANCED ONCOTHERAPY
Purchase order and partnerships
AVO’s goal is to deliver an affordable and novel proton beam therapy (PBT) system, based on state-of-the-art technology developed originally at the world-renowned CERN. 2019 was characterised by the achievement of a number of technical milestones and validation of the technical advantages of the accelerator over conventional machines. As anticipated, 2020 will see a number of key milestones being reached. Crucially, AVO has announced the first purchase order for a LIGHT system by the Mediterranean Hospital of Cyprus (MHC), valued at €50m, as well as partnerships with the London Clinic and Birmingham.
► Strategy: AVO is developing a compact and modular PBT system at an affordable price for the payor, financially attractive to the operator, and generating superior patient outcomes. AVO benefits from technology know-how developed by ADAM, a spin-off from CERN, and relies on a base of world-class suppliers.
► Purchase order: AVO has announced a purchase order by MHC, valued at €50m/£41.7m, for the installation of a LIGHT accelerator system, which will support three treatment rooms. AVO will also receive a share of the profit generated from this PBT service. Installation is to commence before end-2023.
► The London Clinic: AVO has announced a new partnership with The London Clinic (TLC), which will run the day-to-day operational activities for the LIGHT machine at its Harley Street site. Although financial terms were not disclosed, it will have a profit share arrangement, highlighting AVO’s innovative business and financing strategy.
► NHS Birmingham: AVO has also announced a partnership with University Hospitals Birmingham NHS Foundation Trust (UHB), for the installation of a LIGHT system on the trust campus (subject to planning permission) for the provision of specialist PBT treatment in Birmingham and surrounding areas.
► Investment summary: AVO’s ca.£98m market capitalisation equates only to the amount invested into LIGHT to date, reflecting neither the huge technical challenges already overcome nor the market potential. A DCF analysis of LIGHT’s prospects generates an NPV of at least 239p per share (fully-diluted). The disconnect between fundamental and market valuations offers an investment opportunity, which will reduce as AVO nears first patient treatments and completes its financing plan.
Financial summary and valuation Year-end Dec (£m) 2017 2018 2019E 2020E 2021E 2022E Sales 0.0 0.0 0.0 Gross profit 0.0 -1.9 0.0 Administration costs -12.9 -15.7 -15.0 EBITDA -14.1 -21.4 -18.9 Underlying EBIT -14.5 -21.8 -20.6 Following recent significant
commercial announcements, forecasts are under review
Statutory EBIT -14.5 -21.8 -20.6 Underlying PTP -16.5 -21.9 -21.7 Statutory PTP -16.5 -21.9 -21.7 Underlying EPS (p) -17.6 -14.0 -8.9 Statutory EPS (p) -18.9 -13.4 -8.9 Net (debt)/cash -9.2 -2.0 -13.9 EV/EBITDA (x) - - -
Source: Hardman & Co Life Sciences Research
Healthcare Equipment & Services
Source: Refinitiv
Market data EPIC/TKR AVO Price (p) 40.0 12m High (p) 52.0 12m Low (p) 32.5 Shares (m) 243.8 Mkt Cap (£m) 97.5 EV (£m) 111.4 Free Float* 72% Market AIM
*As defined by AIM Rule 26
Description Advanced Oncotherapy (AVO) is developing next-generation proton therapy systems for use in cancer radiotherapy. The first system is expected to undergo CE marking during 2020. Standard radiation procedures have evolved over many years. PBT delivers radiation via a beam of proton particles, rather than a beam of photons used in conventional radiotherapy (X-rays).
Company information Exec. Chairman Michael Sinclair CEO Nicolas Serandour
+44 203 617 8728 www.avoplc.com
Key shareholders Liquid Harmony (Board) 18.5% Other Board 9.6% P. Glatz 6.4% DNCA Investments 4.9% Lombard Odier 4.1% Brahma AG 3.2% Barrymore Inv. 3.2%
Diary
Daily AVO.L 28/02/2018 - 21/02/2020 (LON)Line, AVO.L, Trade Price(Last), 27/02/2020, 36.9, -0.5, (-1.37%) Price
GBp
Auto
34
36
38
40
42
44
46
48
50
52
54
56
58
36.9
M A M J J A S O N D J F M A M J J A S O N D J FQ2 2018 Q3 2018 Q4 2018 Q1 2019 Q2 2019 Q3 2019 Q4 2019 Q1 2020
Analysts Martin Hall 020 7194 7631
[email protected] Dorothea Hill 020 7194 7626
[email protected] Grégoire Pavé 020 7194 7628

The Monthly
March 2020 17
ALLERGY THERAPEUTICS
Peanut allergy vaccine market heating up AGY is a long-established specialist in the prevention, diagnosis and treatment of allergies. Pollinex Quattro (PQ) is an ultra-short course subcutaneous allergy immunotherapy (SCIT) platform, which continues to make strong market share gains in a competitive environment. Several products using the PQ platform are in late-stage development in order to move them to full registration under new EU and US regulations. In addition, AGY’s early pipeline includes a Peanut SCIT, which is Phase I ready. Published pre-clinical data indicate there to be competitive advantages for its SCIT, which is based on traditional vaccination approaches.
► Strategy: AGY is a fully-integrated pharmaceutical company focused on the treatment of allergies. There are three parts to its strategy: continued development of its European business via investment or opportunistic acquisitions; the US PQ opportunity; and further development of its pipeline.
► Peanut SCIT: AGY’s vaccine candidate will enter Phase I trials this summer, with excellent pre-clinical data now published. A single immunisation protected against local and systemic allergic reactions on challenge in mouse models. Manufacturing scale-up is under way for a trial to test for sustained immunity in humans.
► Peanut market: Currently estimated at $8bn, the food allergy market is growing due to demand and new technology. Aimmune (NASDAQ: AIMT) achieved FDA approval for its peanut immunotherapy based on oral desensitisation in February, but this requires multiple doses and carries risk of dangerous allergic reactions.
► Risks: The risks inherent in subjective clinical trial outcomes were clear in the Phase III Birch trial. However, AGY does include objective secondary endpoints to test for protective immunity; the design of the Phase I trial is already agreed with regulatory authorities – it is likely to include measurement of IgG antibodies.
► Investment summary: Over the past 12 months, we have highlighted consistently that AGY is at an exciting juncture. While continuing to invest in its profitable European SCIT business, it is leading the race to have its SCIT products fully approved and regulated as biologicals in the US. Despite this, the current EV/sales appears too low for a company with a long and profitable product history, and well below the multiples commanded by direct competitors, including AIMT.
Financial summary and valuation Year-end Jun (£m) 2017 2018 2019 2020E 2021E 2022E Sales 64.1 68.3 73.7 80.0 86.0 92.0 R&D investment -9.3 -16.0 -13.0 -16.0 -28.0 -15.0 Underlying EBIT -3.6 -7.4 -2.2 -4.7 -16.2 -2.9 Reported EBIT -2.6 -7.4 3.8 -1.4 -16.2 -2.9 Underlying PBT -3.7 -7.5 -2.3 -4.8 -16.3 -3.1 Statutory PBT -2.7 -7.5 3.7 -1.5 -16.3 -3.1 Underlying EPS (p) -0.6 -1.3 -0.4 -0.9 -2.7 -0.6 Statutory EPS (p) -0.4 -1.3 0.5 -0.2 -2.5 -0.5 Net (debt)/cash 18.8 12.5 25.0 20.6 1.7 -4.1 Equity issues 0.0 0.0 10.2 0.3 0.3 0.3 P/E (x) -20.2 -9.4 -29.3 -13.6 -4.4 -19.0 EV/sales (x) 0.60 0.56 0.52 0.48 0.45 0.42
Source: Hardman & Co Life Sciences Research
Pharmaceuticals & Biotechnology
Source: Refinitiv
Market data EPIC/TKR AGY Price (p) 11.9 12m High (p) 15.8 12m Low (p) 7.3 Shares (m) 636.2 Mkt Cap (£m) 75.7 EV (£m) 38.4 Free Float* 39% Market AIM
*As defined by AIM Rule 26
Description Allergy Therapeutics (AGY) provides information to professionals related to prevention, diagnosis and treatment of allergic conditions, with a special focus on allergy vaccination. The emphasis is on treating the underlying cause and not just the symptoms.
Company information CEO Manuel Llobet CFO Nick Wykeman Chairman Peter Jensen
+44 1903 845 820 www.allergytherapeutics.com
Key shareholders Directors 0.7% Abbott Labs 37.8% Southern Fox 22.7% SkyGem 15.6% Invesco 4.5%
Diary Mar’20 Interim 2020 results 1H’21 Ph. I peanut vaccine trial
Daily AGY.L 28/02/2018 - 21/02/2020 (LON)Line, AGY.L, Trade Price(Last), 27/02/2020, 11.00, 0.00, (0.00%) Price
GBp
Auto
910111213141516171819202122232425262728
11.00
Mar Apr May Jun Jul Aug Sep Oct Nov Dec Jan Feb Mar Apr May Jun Jul Aug Sep Oct Nov Dec Jan FebQ2 2018 Q3 2018 Q4 2018 Q1 2019 Q2 2019 Q3 2019 Q4 2019 Q1 2020
Analysts Martin Hall 020 7194 7631
[email protected] Dorothea Hill 020 7194 7626
[email protected] Grégoire Pavé 020 7194 7628

The Monthly
March 2020 18
ARBUTHNOT BANKING GROUP
“Towards upper end of market expectations”
The key message from the 12 February trading statement was that ABG expects to announce full-year pre-tax profits “towards the upper end of the range of market expectations”. It increased its period-end customer loan balances by 31% and deposits by 22% on 2018. Planned diversification of the group's loan book and income streams continued, with Arbuthnot Commercial Asset Based Lending and Arbuthnot Specialist Finance both making good progress in the quarter and year. Early February share price weakness was on light volumes vs. the mid/late February recovery. A profitable, growing bank, trading at 0.8x NAV, appears anomalous.
► Outlook: In addition to delivering FY’19 profits at the upper end of expectations, the outlook comment was positive, particularly noting that “following the decisive election result, the Group has noticed an increase in the level of confidence in its markets and the pipeline across all business divisions has begun to improve.”
► Peer news: Rathbone Brothers’ FY results on 20 February were well received (s/p +2%). Brewin Dolphin’s CEO retired and will be replaced internallly. In the broader wealth management space, Harwood Capital decided not to make an offer for Frenkel Topping while Interactive Investor’s bid for Shae plc was recommended.
► Valuation: The average of our approaches is now £16.51, 1.3x 2020E NAV (from £16.55 – with a small decline in the STB stake value). Two of our models use 2020 estimates, which include accelerated investment, as detailed in our 18 October note, but not the payback for it. The share price is 0.8x the 1H’19 NAV (1,321p).
► Risks: As with any bank, the key risk is credit. ABG’s existing business should see below-market volatility, and so the main risk lies in new lending. We believe management is cognizant of the risk and, historically, has been very conservative. Other risks include reputation, regulation and compliance.
► Investment summary: ABG offers strong-franchise and continuing-business (normalised) profit growth. Its balance sheet strength gives it wide-ranging options to develop organic and inorganic opportunities. The latter are likely to increase in uncertain times. Management has been innovative, but also very conservative, in managing risk. Having a profitable, well-funded, well-capitalised and strongly growing bank priced at around book value appears anomalous.
Financial summary and valuation Year-end Dec (£000) 2015 2016 2017 2018 2019E* 2020E* Operating income 34,604 41,450 54,616 67,905 77,471 89,588 Total costs -35,926 -46,111 -54,721 -64,982 -71,595 -80,157 Cost:income ratio 104% 111% 100% 96% 92% 89% Total impairments -1,284 -474 -394 -2,731 -2,877 -2,965 Reported PBT -2,606 -1,966 2,534 6,780 6,799 9,831 Adjusted PBT 2,982 1,864 3,186 7,416 8,799 11,831 Statutory EPS (p) 86.3 1,127.3 43.9 -134.5 37.5 54.0 Adjusted EPS (p) 13.5 17.1 47.5 40.3 48.2 64.6 Loans/deposits 82% 76% 75% 71% 79% 80% Equity/assets 5.5% 18.5% 12.8% 9.0% 7.6% 7.1% P/adjusted earnings (x) 75.6 59.6 21.5 25.3 21.2 15.8 P/BV (x) 1.27 0.67 0.67 0.80 0.80 0.79
*IFRS9 basis; Source: Hardman & Co Research
Financials
Source: Refinitiv
Market data EPIC/TKR ARBB/ARBN Price (p) 1,020/1,100 12m High (p) 1,428 12m Low (p) 970 Shares (m) 15.4 Mkt Cap (£m) 157 Loans to deposits 2020E 80% Free Float* 42% Market AIM/NEX
*As defined by AIM Rule 26
Description Arbuthnot Banking Group (ABG) has a well-funded and capitalised private bank, and has been growing commercial banking very strongly. It holds a 9.85% stake in Secure Trust Bank (STB).
Company information Chair/CEO Sir Henry Angest COO/CEO Arb. Latham
Andrew Salmon
Group FD, Deputy CEO Arb. Latham
James Cobb
+44 20 7012 2400 www.arbuthnotgroup.com
Key shareholders Sir Henry Angest 56.1% Liontrust 7.0% Slater Investments 3.9% Miton Asset Mgt. 3.6% R Paston 3.6% M&G IM 3.5%
Diary 26 Mar FY’19 results
Daily ARBB.L 27/02/2018 - 21/02/2020 (LON)Line, ARBB.L, Trade Price(Last), 27/02/2020, 1,040, -20, (-1.90%) Price
GBp
Auto
1,000
1,050
1,100
1,150
1,200
1,250
1,300
1,350
1,400
1,450
1,500
1,550
1,600
1,040
M A M J J A S O N D J F M A M J J A S O N D J FQ2 2018 Q3 2018 Q4 2018 Q1 2019 Q2 2019 Q3 2019 Q4 2019 Q1 2020
Analyst Mark Thomas 020 7194 7622

The Monthly
March 2020 19
ARIX BIOSCIENCE
Full-year 2019 results due 10 March
Arix is a listed global venture capital (VC) company that presents an opportunity for institutional and retail investors to participate in the high risk-return profile of early-stage biotech investing. Arix minimises risk through its expert investment team and with portfolio diversification. Arix’s latest published NAV of £232m (1H’19) includes 17 portfolio companies (PCs) into which Arix has invested ca.£135m since launch. FY’19 results, due 10 March, will provide visibility on the contribution of both core and discovery portfolio companies to FY’19 NAV, forecast at £208m, or 154p/share.
► Business model: Arix provides capital, operational expertise and network access to entrepreneurs and companies from the seed stage through to undervalued public companies. As a listed company itself, and unlike traditional VC models, Arix is not constrained by exit timelines, and its investors can trade shares at will.
► Strategy: Sourcing benefits from an established network and a strong scientific reputation. The portfolio is diversified by therapeutic area, treatment modality, stage of discovery/development and geography to balance the risk-reward inherent to biotech investments. Value is realised when Arix exits its investments.
► Performance: Arix’s performance cannot yet be assessed by exits, although more visibility may be expected on 10 March. Since IPO in 2017, its NAV/share increased from 150p to 170p at 1H’19, and is forecast at 154p on 31 December 2019. Value-accretive events in 2019 include NASDAQ IPO of two PCs.
► Risks: Value inflection points include PC progression through clinical, regulatory, partnering and financial milestones. Given that 29% of the portfolio value is pre-clinical, much of the risk lies in the investment team’s skill in identifying innovation with clear commercial potential – allowing it successful exits.
► Investment summary: Arix stock is currently suffering from a market overhang and some negative sentiment towards biotech that is affecting its share price, and the share prices of some of its PCs have fallen following IPO. Although the portfolio’s fundamentals are unchanged, investors should ensure that they understand the basis of the NAV and its discount before seizing the opportunity to participate in the basket of well-chosen biotech.
Financial summary and valuation Year-end Dec (£m) *2016 2017 2018 2019E 2020E 2021E Operating income 2.0 7.4 52.5 -57.8 1.1 0.0 Admin. expenses -10.3 -11.0 -11.7 -10.0 -8.9 -8.9 Operating profit/(loss) -13.0 -7.2 37.5 -71.1 -11.2 -12.3 Profit/(loss) before tax -13.0 -7.2 37.5 -71.1 -11.2 -12.3 Underlying EPS (p) -38.4 -9.5 27.2 -47.7 -7.0 -7.8 Net cash/(debt) 28.9 74.9 91.2 48.0 13.5 -9.1 Capital increase 50.0 105.1 83.5 0.0 0.0 0.0 NAV/share (p) 201.4 152.3 200.4 153.6 146.6 138.8
*15-month period (30 September 2015 to 31 December 2016) Source: Hardman & Co Life Sciences Research
Pharmaceuticals & Biotechnology
Source: Refinitiv
Market data EPIC/TKR ARIX Price (p) 88.5 12m High (p) 163 12m Low (p) 86 Shares (m) 135.6 Mkt Cap (£m) 120.0 Free Float 69% NAV/share (p) 146 Premium/discount to NAV -39.6% Market LSE
Description Arix is a publicly listed biotechnology venture capital (VC) company. It provides an opportunity for all investors to participate in a balanced portfolio of diverse biotech innovation via a single stock. With a global portfolio of 17 companies and four IPOs achieved since launch in 2016, Arix is a dynamic and modern approach to life sciences VC investing.
Company information Chairman Jonathan Peacock CEO Joe Anderson COO Robert Lyne Finance Director Marcus Karia
+44 20 7290 1050 www.arixbioscience.com
Key shareholders Directors 9% Link Fund Solutions 19.8% Fosun 8.2% Ruffer 6.1% Takeda Ventures 5.5%
Diary 10 Mar FY’19 results
Daily ARIX.L 28/02/2018 - 21/02/2020 (LON)Line, ARIX.L, Trade Price(Last), 27/02/2020, 80.6, +1.0, (+1.23%) Price
GBp
Auto
90
100
110
120
130
140
150
160
170
180
190
200
210
80.6Mar Apr May Jun Jul Aug Sep Oct Nov Dec Jan Feb Mar Apr May Jun Jul Aug Sep Oct Nov Dec Jan Feb
Q2 2018 Q3 2018 Q4 2018 Q1 2019 Q2 2019 Q3 2019 Q4 2019 Q1 2020
Analysts Martin Hall 020 7194 7631
[email protected] Dorothea Hill 020 7194 7626
[email protected] Grégoire Pavé 020 7194 7628

The Monthly
March 2020 20
B-NORTH
4Q’19 overview
For us, the key takeaways of B-North’s 4Q overview on 30 January are i) super-seed capital raise oversubscribed at 135% of the original target; ii) B-North says its Series A funding to raise £20m “is progressing well with B-North engaged in a positive dialogue with a number of potential institutional investors”; iii) no change to previous guidance that overall build-the-bank cost expected to be >20% lower than original expectations; iv) infrastructure build with key control hires and outsource partner for deposit-taking appointed; v) management outlook statement: “We look forward with great confidence to 2020 being a year of further significant progress.”
► News: B-North continues to build controls and infrastructure (three hires announced on 13 January), and has selected Newcastle Strategic Solutions Limited to provide its deposit-taking solution, as it moves towards scheduled launch in the first half of 2020.
► “Reality Check”: In our 16 December note, we reviewed the company assumptions and believe them to be ambitious but credible. We considered the level of lending that peers have achieved and the absolute performance. Importantly, B-North has multiple options to address any volume shortfall – most at a modest cost.
► Valuation: Given the growth profile of the company and associated uncertainties, any valuation must be treated with extreme caution. In our initiation, we gave a range of approaches that, on average, indicate that B-North’s value in 2027 could be treble the amount of equity raised, and provided a range of sensitivities.
► Risks: Credit risk is key for any bank. B-North will establish independent credit functions, and its technology brings it close to customers interfacing with their internal information. It has multiple options to address any loan growth shortfall. The economic cycle is important. The model is yet to be tested and capital raised.
► Investment summary: B-North is still at the pre-revenue stage. Its model should be low-cost and deliver a superior service to customers and intermediaries. It has a conservative credit culture and uses state-of-the-art technology, written from scratch, to originate, service and manage its business. Funding will be via the deep best-buy retail deposit comparison sites. The potential market is huge, profitable and under-served, and major incumbents have selectively become uncompetitive.
Financial summary and valuation – eight-pod scenario Year-end Sep (£m) 2019 2020E 2021E 2022E 2023E 2024E 2025E 2026E 2027E Net interest income 0.0 0.5 3.9 14.5 37.4 72.7 116.2 160.7 203.6 Costs -2.9 -7.0 -18.0 -28.3 -36.0 -41.3 -45.5 -47.8 -52.0 Impairments 0.0 0.0 -0.2 -1.0 -3.1 -7.4 -8.9 -10.1 -10.7 Pre-tax profit -2.9 -6.5 -14.2 -14.3 -0.6 25.9 64.7 106.5 145.4 Net interest margin n/m 1.4% 4.0% 4.3% 4.1% 4.2% 4.2% 4.3% 4.3% Cost:income ratio n/m n/m n/m n/m -93% -55% -38% -29% -25% RoE n/m -14% -15% -12% 0% 11% 20% 23% 24% Loans 0 15 100 470 1,100 1,925 2,850 3,700 4,550 Deposits 0 0 12 329 770 1,424 2,098 2,745 3,393 Equity 1 72 86 102 154 217 298 393 502 Value at 12x P/E* n/m n/m n/m n/m n/m 252 629 962 1,303 Value vs. cum. equity issued n/m n/m n/m n/m n/m 1.1 2.3 2.9 3.4
*IFRS9 basis; Source: Hardman & Co Research
Market data EPIC/TKR Private Price (p) n/a
Description B-North is being developed to serve the sizeable UK SME lending market. It has state-of-the-art technology, a regional hub model and experienced managers to deliver a best-in-class service to SMEs and commercial brokers. It will be funded through best-buy retail deposit comparison websites. The model should have a material cost advantage over competitors, and credit risk is being tightly managed.
Company information Chairman Ron Emerson CBE CEO Jonathan Thompson CFO David Broadbent
[email protected] b-north.co.uk
Key shareholders Directors/management £1m+ Greater Manchester Combined Authority
Six-figure sum
HNWI Balance
Diary 1Q’20 Banking licence (tbc) 1Q’20 £20m capital raise 2Q’20 Start lending 4Q’20 Start retail deposit-taking The target seed round top-up capital raise of £2m was over-subscribed (£2.7m raised). Investors with £50k+ to invest can do so directly through contact with David Broadbent, Founder & CFO, Suite 20A, Manchester One, 53 Portland Street. The group targets raising £20m from institutional investors, conditional on getting its banking licence.
Analyst Mark Thomas 020 7194 7622

The Monthly
March 2020 21
BURFORD CAPITAL
Mixture of strong and weak activity in 2019 Burford recently released its first-ever trading statement, covering cash activity in 2019. Group-wide commitments set a new record of $1.57bn, a 24% increase. Overall deployments were almost flat compared with 2018, at £1.07bn. In both, the Sovereign Wealth Fund (SWF) and fund arrangements increased their share. It was, however, a quiet second half for realisations on-balance sheet in the core litigation finance business. 2019 profits will be lower than in 2018, with Burford indicating that net realised gains will be ca.$20m-$30m lower than in 2018 and net unrealised gains ca.$50m-$70m lower.
► Returns: While on-balance sheet net realised gains were lower in 2019 than in 2018, the cumulative RoIC since inception ticked up slightly to 93% on $1.2bn of realisations (85% on $1bn in 2018). The aggregate IRR also increased from 30% to 31%.
► Cash: Group-wide cash generation increased 23% over 2019 to $997m. The majority of this increase was driven by post-settlement finance, which is shorter duration. The year-end cash balance of $192m was slightly up from $171m at the half year, but down on the $277m a year ago.
► Risks: The investment portfolio is highly diversified, with exposure to more than 1,100 claims. However, it retains some very large investments, which means revenue could be volatile, particularly in the smaller divisions. The Petersen case shows that this volatility is not simply a negative.
► Investment summary: Burford has already demonstrated an impressive ability to deliver good returns in a growing market, while investing its capital base. As the invested capital continues to grow, we would anticipate the litigation investment business continuing to produce strong earnings growth.
Financial summary and valuation Year-end Dec ($m) 2013 2014 2015 2016 2017 2018 Revenue 60.7 82.0 103.0 163.4 341.2 420.7 Operating profit 42.5 60.7 77.2 124.4 285.1 353.0 Reported net income 2.6 45.4 64.5 108.3 249.3 317.4 Underlying net income 40.1 53.0 64.5 114.2 264.8 327.8 Underlying RoE 11.7% 12.1% 16.0% 22.1% 35.9% 30.1% Underlying EPS ($) 0.20 0.26 0.32 0.55 1.27 1.50 Statutory EPS ($) 0.01 0.22 0.32 0.53 1.20 1.51 DPS ($) 0.05 0.07 0.08 0.09 0.11 0.13 Dividend yield 0.2% 0.3% 0.4% 0.4% 0.5% 0.6% NAV per share ($) 1.72 1.87 2.12 2.22 3.19 5.50 P/E (underlying, x) 44.0 33.3 27.4 15.7 6.8 5.8 Price/NAV (x) 5.0 4.6 4.1 3.9 2.7 1.6
Source: Hardman & Co Research
Financials
Source: Refinitiv
Market data EPIC/TKR BUR Price (p) 616.5 12m High (p) 1,870.0 12m Low (p) 585.0 Shares (m) 218.6 Mkt Cap (£m) 1,348 Total Assets ($m) 2,249 Free Float* 90% Market AIM
*As defined by AIM Rule 26
Description Burford Capital is a leading global finance and professional services firm focusing on law. Its businesses include litigation finance and risk management, asset recovery, and a wide range of legal finance and advisory activities.
Company information CEO Christopher Bogart CIO Jonathan Molot CFO Jim Kilman Chairman Sir Peter Middleton
+1 212 235 6820 www.burfordcapital.com
Key shareholders Directors 8.7% Invesco 9.5% Morgan Stanley 6.1% Coltrane Asset Mgt. 5.2% Mithaq Capital 5.1%
Diary 24 Mar Full-year results 13 May AGM
Daily BURF.L 28/02/2018 - 21/02/2020 (LON)Line, BURF.L, Trade Price(Last), 27/02/2020, 547.0, -49.0, (-8.22%) Price
GBp
Auto600
700
800
900
1,000
1,100
1,200
1,300
1,400
1,500
1,600
1,700
1,800
1,900
2,000
547.0Mar Apr May Jun Jul Aug Sep Oct Nov Dec Jan Feb Mar Apr May Jun Jul Aug Sep Oct Nov Dec Jan Feb
Q2 2018 Q3 2018 Q4 2018 Q1 2019 Q2 2019 Q3 2019 Q4 2019 Q1 2020
Analyst Brian Moretta 020 7194 7622
The Monthly
March 2020 22
CITY OF LONDON INVESTMENT GROUP
Interim results validate good first-half performance CLIG has announced its interim results for 1H’20. Several of the key figures were announced in the January trading statement, so the main interest is in the underlying figures. With FUM growth supported by positive markets and net inflows, revenue growth was good at 11% compared with the same period last year. Despite the helpful conditions, CLIG maintained its excellent cost control and the net result was a 23% increase in profit after tax to $5.06m. Cash conversion, as always, was excellent, with operating cashflow at 107% of earnings.
► Performance: Further detail was provided on fund performance over the period. The Developed strategy outperformed by an average of 3.5% and Opportunistic Value by an average of 2.2%. EM averaged 0.75% as well and all have strong quartile placings over multiple timescales.
► Earnings estimates: As the main figures were given in January, there are only small adjustments to the Hardman & Co earnings estimates. We have introduced a 2022E EPS of 54.5p. A further dividend increase is also assumed, but strong markets may see another one before then.
► Valuation: The 2021E P/E of 9.1x is at a significant discount to the peer group. The underlying 2020E yield of 6.6% is attractive, in our view, and should, at the very least, provide support for the shares in the current markets.
► Risks: Although emerging markets can be volatile, CLIG has proved to be more robust than some other EM fund managers, aided by its good performance and strong client servicing. Further EM volatility could increase the risk of such outflows, although increased diversification is also mitigating this.
► Investment summary: Having shown robust performance in challenging market conditions, CLIG is now reaping the benefits in a more supportive environment. The valuation remains reasonable. FY’17 and FY’18 both saw dividend increases and, unless there is significant market disruption, more should follow in the next few years.
Financial summary and valuation Year-end Jun (£m) 2017 2018 2019* 2020E 2021E 2022E FUM ($bn) 4.66 5.11 5.39 6.27 6.79 6.92 Revenue 31.29 33.93 31.93 35.13 38.56 41.43 Statutory PTP 11.59 12.79 11.40 13.56 15.59 17.04 Statutory EPS (p) 36.9 39.5 34.9 43.4 49.8 54.5 DPS (p) 25.0 27.0 40.5 30.0 30.0 33.0 Special dividend 13.5 P/E (x) 12.3 11.5 13.0 10.4 9.1 8.3 Dividend yield 5.5% 6.0% 9.0% 6.6% 6.6% 7.3%
*2019 figures include a special dividend of 13.5p; Source: Hardman & Co Research
Financials
Source: Refinitiv
Market data EPIC/TKR CLIG Price (p) 452.5 12m High (p) 474.0 12m Low (p) 379.1 Shares (m) 26.6 Mkt Cap (£m) 120.2 EV (£m) 107.7 Market LSE
Description City of London (CLIG) is an investment manager specialising in using closed- ended funds to invest in emerging and other markets.
Company information CEO Tom Griffith CFO Tracy Rodrigues Chairman Barry Aling
+44 207 860 8346 www.citlon.com
Key shareholders Directors & staff 18.6% Blackrock 10.1% APQ Capital 5.5% Cannacord Genuity 5.0% Eschaton Opportunities Fund Management
4.8%
Polar Capital 3.7%
Diary 21 Apr 3Q FUM announcement 14 Jul Pre-close update 14 Sep Preliminary results 7 Oct 1Q FUM announcement
Daily CLIG.L 28/02/2018 - 21/02/2020 (LON)Line, CLIG.L, Trade Price(Last), 27/02/2020, 411, -15, (-3.48%) Price
GBp
Auto360
370
380
390
400
410
420
430
440
450
460
470
411
M A M J J A S O N D J F M A M J J A S O N D J FQ2 2018 Q3 2018 Q4 2018 Q1 2019 Q2 2019 Q3 2019 Q4 2019 Q1 2020
Analyst Brian Moretta 020 7194 7622

The Monthly
March 2020 23
DIURNAL GROUP
Interim results and revised forecasts DNL is a commercial-stage specialty pharmaceutical company focused on diseases of the endocrine system. Its two lead products target rare conditions where medical needs are currently unmet, with the aim of building a long-term “Adrenal Franchise”. In 2020, DNL is expecting five market authorisations. We expect it to announce a US partnership(s) to support Alkindi and the upcoming clinical studies with Chronocort. Sales for Alkindi at the interim stage were £1.1m and cash was £4.6m (before receipt of a £2.1m R&D tax credit). In line with a new strategy, we have revised our forecasts and anticipate DNL to be profitable in 2022.
► Strategy: DNL aims to create a valuable “Adrenal Franchise” that can treat patients with chronic cortisol deficiency diseases from birth through to old age. Once Alkindi and Chronocort are established in the EU and the US, the long-term vision is to expand DNL’s product offering to other related conditions.
► Interims: At its interim results, DNL indicated that sales of Alkindi were £1.1m (£0.2m), ahead of our forecast at £0.8m. Further launches are due with Italy and the Netherlands in calendar 1H’20, followed by Spain in 2H’20. Cash in the bank of £4.6m was also higher than our £3.6m forecast.
► US partner(s): DNL is progressing discussions in its search for a US partner for the sale and distribution of Alkindi, as well as clinical support for the Phase III Chronocort trials in CAH. The final outcome might be with more than one company, and an announcement is expected during 1H calendar 2020.
► Revised forecasts: With the new strategy taking place, which will share trial costs with a US partner for Chronocort, we have revised our forecasts, with a reduced R&D investment. We anticipate DNL to raise £10m new capital in the short term, allowing the company to become profitable by 2022.
► Investment summary: Alkindi, a cortisol replacement therapy designed for children under 18 years of age, is DNL’s first product on the market. It is expected to be followed by Chronocort for adults – a larger market – which now has a clear pathway for regulatory approval in both Europe and the US. Despite this, the share price is still languishing well below valuations determined by peer group and DCF (344p) analyses, due possibly to the need for more capital during 2020.
Financial summary and valuation Year-end Jun (£m) 2017 2018 2019 2020E 2021E 2022E Sales 0.00 0.07 1.04 2.41 5.76 16.16 SG&A -3.23 -6.21 -5.83 -5.75 -6.46 -7.81 R&D -8.34 -10.02 -8.69 -4.80 -5.04 -5.29 EBITDA -12.07 -16.97 -14.50 -9.42 -7.33 0.60 Underlying EBIT -12.08 -16.98 -14.53 -9.45 -7.35 0.58 Statutory EBIT -12.08 -16.98 -14.53 -9.45 -7.35 0.58 Underlying PBT -12.16 -17.11 -14.40 -9.40 -7.29 0.59 Statutory PBT -12.16 -16.91 -14.40 -9.40 -7.29 0.59 Underlying EPS (p) -18.04 -27.16 -14.54 -9.27 -5.05 1.32 Statutory EPS (p) -18.04 -26.78 -19.70 -9.27 -5.05 1.32 Net (debt)/cash 16.37 17.28 9.15 10.65 1.77 1.21 Equity issues 0.05 13.40 5.53 9.40 0.00 0.00
Source: Hardman & Co Life Sciences Research
Pharmaceuticals & Biotechnology
Source: Refinitiv
Market data EPIC/TKR DNL Price (p) 34.4 12m High (p) 47.0 12m Low (p) 23.0 Shares (m) 86.7 Mkt Cap (£m) 29.8 EV (£m) 25.2 Free Float* 40% Market AIM
*As defined by AIM Rule 26
Description Diurnal (DNL) is a UK-based specialty pharma company targeting patient needs in chronic, potentially life-threatening, endocrine (hormonal) diseases. Alkindi is approved in Europe, and has been filed in the US. Chronocort completed the largest and only Phase III trial in CAH, and is awaiting EMA approval.
Company information CEO Martin Whitaker CFO Richard Bungay Chairman Peter Allen
+44 29 2068 2069 www.diurnal.co.uk
Key shareholders Directors 4.0% IP Group 39.7% Finance Wales 13.3% Polar Capital 7.6% Richard Griffiths 7.2% Oceanwood Capital 3.6%
Diary 27-31 Mar DITEST details pres. 1H’20 US partner 4Q’20 Chrono. CHMP opinion
Daily DNL.L 28/02/2018 - 21/02/2020 (LON)Line, DNL.L, Trade Price(Last), 27/02/2020, 35.0, 0.0, (0.00%) Price
GBp
Auto
304050
607080
90100110
120130140
150160170
180190200210
35.0
M A M J J A S O N D J F M A M J J A S O N D J FQ2 2018 Q3 2018 Q4 2018 Q1 2019 Q2 2019 Q3 2019 Q4 2019 Q1 2020
Analysts Martin Hall 020 7194 7631
[email protected] Dorothea Hill 020 7194 7626
[email protected] Grégoire Pavé 020 7194 7628

The Monthly
March 2020 24
FILTA GROUP
Back on track Filta announced in February that it expects to report revenue of ca.£25m and EBITDA of ca.£3.2m for FY19, largely in line with our revised forecasts. The Watbio business is responding to new management and investment and cost savings of £100,000 per month should be achieved in 2020. The US and Europe continue to perform well. After this brief hiatus, Filta appears to be back on track.
► Strategy: Filta provides a professional service, via franchisees, to kitchens to filter their cooking oil – improving taste and saving money. Grease emanating from commercial kitchens also causes problems, and needs managing. There is scope for Filta to become the major player in the UK grease management business.
► Outlook: In November last year, we cut our FY19E EBITDA from £4.2m to £3.3m, and left FY20E unchanged. The update is reassuring that problems related to initial integration only and nothing more substantive. We still think the prospects for the business are very attractive.
► Valuation: Filta has no directly comparable companies. We have used a DCF to derive a value range of 217p to 283p per share, using a 10% discount rate and a mid-term (2021-25) growth rate of between 6% and 12%. Our central estimate is 260p. No account is taken of future added-value acquisitions.
► Risks: As well as normal commercial risks, Filta is dependent on its franchisee behaviour, which it can influence via training. The Watbio acquisition risks are now fully understood, but any future deals will inevitably involve managing some unknowns. It is exposed to FX risk, too, although most costs are local.
► Investment summary: Filta is an attractive business, in our view, combining the capital-light franchise model in North America and Europe with company-owned operations in the UK. With only a tiny proportion of the market currently served and with little or no competition, we see potential for years of profitable growth ahead. Please see our initiation report here, published on 3 April 2019.
Financial summary and valuation Year-end Dec (£000) 2015 2016 2017 2018 2019E 2020E Revenue 7,925 8,469 11,547 14,213 25,100 27,500 EBITDA 594 1,193 2,116 2,642 3,200 5,250 Underlying EBIT 450 1,011 2,059 1,941 1,230 3,300 Reported EBIT 450 (249) 1,699 1,782 880 3,300 Underlying PTP 376 932 1,968 1,900 930 3,100 Statutory PTP 376 (329) 1,608 1,742 580 3,100 Underlying EPS (p) 1.39 3.66 5.05 5.39 0.98 8.11 Statutory EPS (p) 1.39 -1.51 3.85 4.88 -0.20 8.11 Net (debt)/cash -619 3,271 2,992 2,040 400 2,748 Shares issued (m) 22 23 27 29 29 29 P/E (x) 114.5 43.4 31.5 29.5 162.5 19.6 EV/EBITDA (x) 59.3 27.5 19.1 16.6 14.3 8.3
Source: Hardman & Co Research
Support Services
Source: Refinitiv
Market data EPIC/TKR FLTA Price (p) 159 12m High (p) 245 12m Low (p) 127 Shares (m) 29 Mkt Cap (£m) 46 EV (£m) 46 Free Float* 33% Market AIM
*As defined by AIM Rule 26
Description Filta Group (Filta) provides cooking oil filtration, fryer and drain management services in North America and Europe to commercial kitchens.
Company information CEO Jason Sayers CFO Brian Hogan Chairman Tim Worlledge
+44 1788 550100 www.filtaplc.com
Key shareholders Directors 67% Gresham House 12.5% Blackrock 5.6% Ennismore FM 5.0% Cannacord Genuity 3.7%
Diary Apr’20 Preliminary results Sep’20 Interim results
Daily FLTA.L 21/02/2019 - 21/02/2020 (LON)Line, FLTA.L, Trade Price(Last), 26/02/2020, 150, 0, (0.00%) Price
GBp
Auto140145150155160165170175180185190195200205210215220225230235
150
01 18 01 16 01 16 03 17 01 16 01 16 02 16 01 16 01 18 02 16 02 16 03 17Mar 19 Apr 19 May 19 Jun 19 Jul 19 Aug 19 Sep 19 Oct 19 Nov 19 Dec 19 Jan 20 Feb 20
Analyst Jason Streets 020 7194 7622

The Monthly
March 2020 25
GENEDRIVE PLC
Western market progress, but developing markets difficult
Genedrive plc (GDR) is a commercial-stage biotech focused on point-of-care molecular diagnostics. Its Genedrive® molecular diagnostic platform offers low-cost, simple-to-use devices for highly sensitive and specific testing. The rapid analysis of samples aids real-time decision-making, whether in clinical, public health or biothreat applications. GDR is developing a portfolio of assays for the Genedrive device, with its hepatitis C virus (HCV) and biothreat assays already on the market. The HCV diagnostics market is proving challenging due to a lack of access to HCV drugs, but biothreat revenue should support GDR in fiscal 2020.
► Strategy: Now that the Genedrive technology platform has received CE marking, management has completely re-focused the company onto the commercialisation pathway for gene-based diagnostics in hepatitis C, TB, biothreat pathogen detection and Antibiotic-Induced Hearing Loss (AIHL).
► Interims: Ongoing challenges with commercialisation of the HCV-ID kit and delays in delivering orders to the Department of Defense (DoD) have combined with expiry of grant-funded programmes to deliver group sales of £0.6m (£1.5m) in 1H’20. Product sales were ca.£0.33m (£0.78m), the majority from the DoD.
► Operational progress: Regulatory approval for HCV-ID was achieved in India at the end of 1H’20; however, although the WHO pre-qualification assessment is still ongoing, expected completion is now further delayed. Crucially, the DoD increased its framework contract for pathogen detection by $2.0m/£1.5m.
► Risks: The Genedrive platform has been validated by CE marking of the HCV-ID and RNR1 kits, repeat orders from the US DoD, and funding from Innovate UK and the NIHR. The key risks are commercialisation in undeveloped global health markets and funding for anti-viral or anti-microbial drugs.
► Investment summary: Genedrive technology ticks all the boxes of an “ideal” in vitro diagnostic that satisfies the need for powerful molecular diagnostics at the point of care/need. The hepatitis C market is a large, global opportunity – should market factors improve, the HCV-ID test has excellent potential. The next 12 months will be indicative of GDR’s ability to deliver traction across two assays.
Financial summary and valuation Year-end Jun (£000) 2017 2018 2019 2020E 2021E 2022E Group sales 5,785 1,938 2,362 2,741 4,455 8,346 Underlying EBIT -4,913 -5,264 -4,449 -3,172 -1,783 216 Reported EBIT -7,292 -7,375 -4,010 -3,172 -1,783 216 Underlying PBT -5,417 -5,782 -5,002 -4,958 -2,830 -605 Statutory PBT -7,487 -7,788 -4,518 -4,677 -2,830 -605 Underlying EPS (p) -23.6 -26.9 -15.8 -12.0 -6.2 -0.2 Statutory EPS (p) -34.9 -31.9 -14.0 -11.2 -6.2 -0.2 DPS (p) 0.0 0.0 0.0 0.0 0.0 0.0 Net (debt)/cash -70 -2,096 -3,334 -5,834 -6,931 -5,479 Capital increases 6,023 0 3,243 78 45 0 P/E (x) -0.4 -0.3 -0.6 -0.8 -1.5 -56.8 EV/sales (x) 1.5 4.6 3.8 3.3 2.0 1.1
Source: Hardman & Co Life Sciences Research
Pharmaceuticals & Biotechnology
Source: Refinitiv
Market data EPIC/TKR GDR Price (p) 9.0 12m High (p) 26.0 12m Low (p) 6.3 Shares (m) 34.9 Mkt Cap (£m) 3.1 EV (£m) 8.9 Free Float* 54% Market AIM
*As defined by AIM Rule 26
Description Genedrive is a disruptive platform designed to bring the power of central laboratory molecular diagnostics to point-of-care/near-patient settings with a low-cost device offering fast and accurate results. It focuses on diagnostics for acute hospital settings and for serious infectious diseases, such as hepatitis C and tuberculosis.
Company information CEO David Budd CFO Matthew Fowler Chairman Ian Gilham
+44 161 989 0245 www.genedriveplc.com
Key shareholders Directors 1.8% Calculus 18.9% Spreadex 12.6% BGF 12.5% Odey 5.4% River & Merc. 5.2%
Diary (calendar year) 2H’20 WHO decision on HCV-ID
pre-qualification
Daily GDRG.L 28/02/2018 - 21/02/2020 (LON)Line, GDRG.L, Trade Price(Last), 27/02/2020, 9.50, 0.00, (0.00%) Price
GBp
Auto8
10
12
14
16
18
20
22
24
26
28
30
32
34
36
38
40
9.50
M A M J J A S O N D J F M A M J J A S O N D J FQ2 2018 Q3 2018 Q4 2018 Q1 2019 Q2 2019 Q3 2019 Q4 2019 Q1 2020
Analysts Martin Hall 020 7194 7631
[email protected] Dorothea Hill 020 7194 7626
[email protected] Grégoire Pavé 020 7194 7628

The Monthly
March 2020 26
NON-STANDARD FINANCE
Results due in April In our 17 January note, Sunshine after the rain, we noted: “The focus for the next few years is on relatively modest investment and on driving return on assets towards our medium-term target of 20% for each division.” So said John van Kuffeler at the capital markets day. The accompanying trading statement indicated 2019 results would be in line with market expectations. Following Amigo’s 27 January statement, effectively putting itself up for sale, there was a slight weakness in the NSF share price (as for Provident Financial), as we believe investors looked to them both as possible buyers. The shares have subsequently recovered this loss. The 5.0x 2020E P/E looks anomalous with the consensus growth forecasts.
► Trading update: The branch-based lending business’s (ELL) net loan book grew 17% and the guarantor loan division’s (GLD) book by 29% vs. end-2018. Home Collect Credit (HCC) saw a small decline. Impairments were 22.4% of revenue in ELL, 22.6% in GLD and 27% in HCC. Progress has been made on cheaper funding.
► Peer news: On 18 February, Amigo announced it had several interested parties with whom it had entered discussions. Amigo’s 27 February results will be reviewed in our April Monthly. There has been no news from MCL this month. The FCA, as expected, fined PFG’s Moneybarn (redress was completed in 3Q’19).
► Valuation: Our absolute approaches now indicate a range of 79p-85p. On the current price, the 2020E P/E is 5.0x, for a business whose provisioning already reflects a significant downside scenario. The covered yield is double-digit. Our EPS forecast is slightly above consensus (2020 consensus P/E 5.5x).
► Risks: Credit risk remains the biggest threat to profitability (although this is mitigated through high risk-adjusted margins), and NSF’s model accepts higher credit risk where a higher yield justifies it. Regulation is a market issue; management is taking appropriate action to mitigate this risk.
► Investment summary: Substantial value should be created as i) competitors have withdrawn; ii) NSF has committed debt funding until 2023 and expects to secure a new multi-year securitisation facility shortly; iii) macro drivers are positive; and iv) NSF has a highly experienced management team, delivering operational efficiency without compromising the key F2F model. Investors are paying 5.0x current-year estimated earnings and getting a dividend yield of 10.1%, driven, we believe, by the sentiment issues above.
Financial summary and valuation Year-end Dec (£000) 2017 2018 2019E* 2020E* 2021E* Reported revenue 121,682 168,128 184,249 205,651 227,785 Total impairments -28,795 -42,688 -45,658 -52,408 -56,400 Total costs -69,203 -89,564 -95,000 -99,726 -107,743 EBITDA 23,684 35,876 43,590 53,516 63,642 Adjusted PBT 13,203 14,769 15,878 23,391 29,941 Statutory PBT -13,021 -1,590 -19,779 20,262 28,410 Pro-forma EPS (p) 3.44 3.70 4.12 6.18 7.95 DPS (p) 2.20 2.60 3.00 3.10 3.95 P/E (adjusted, x) 9.0 8.3 7.5 5.0 3.9 P/BV (x) 0.4 0.5 0.5 0.5 0.5 P/tangible book (x) 1.3 1.7 2.1 1.7 1.3 Dividend yield 7.1% 8.4% 9.7% 10.1% 12.8%
* IFRS9 basis; Source: Hardman & Co Research
Financials
Source: Refinitiv
Market data EPIC/TKR NSF Price (p) 30.8 12m High (p) 65.0 12m Low (p) 16.9 Shares (m) 312.0 Mkt Cap (£m) 96 EV (£m) 348 Free Float 99% Market Main
Description In the UK non-standard lending market, Non-Standard Finance (NSF) has the market-leading network in unsecured branch-based lending, is number two in guarantor loans and number three in home credit.
Company information CEO John van Kuffeler CFO Nick Teunon Non-Exec. Chair Charles Gregson
+44 20 386 99026 www.nonstandardfinance.com
Key shareholders Alchemy 29.95% Aberforth Partners 17.64% Marathon Asset Mgt. 11.24%
N
Diary Apr’20 FY’19 results
Daily NSF.L 27/02/2018 - 21/02/2020 (LON)Line, NSF.L, Trade Price(Last), 27/02/2020, 23.6600, -1.8000, (-6.95%) Price
GBp
Auto
20
24
28
32
36
40
44
48
52
56
60
64
68
23.6600
Mar Apr May Jun Jul Aug Sep Oct Nov Dec Jan Feb Mar Apr May Jun Jul Aug Sep Oct Nov Dec Jan FebQ2 2018 Q3 2018 Q4 2018 Q1 2019 Q2 2019 Q3 2019 Q4 2019 Q1 2020
Analyst Mark Thomas 020 7194 7622
The Monthly
March 2020 27
PALACE CAPITAL
Palace Capital’s successful regional and sector bias Palace Capital has announced a pre-let agreement with solicitors’ firm Knights LLP at the prestigious mixed-use development underway at Hudson Quarter, York setting a record office rent for the city of York. The sales launch was in the summer, and apartment sales are ahead of budget. Trading in a number of the REITs assets is going well. Most of Palace Capital’s top-10 investment assets are located in the north of England, with office developments in central Newcastle, Manchester and Liverpool. With or without external market assistance, all these are strongly placed in the short and medium term, as is the very large majority of the REIT’s assets.
► The north of England: Palace Capital is a REIT that excludes central London from its investment universe and has a bias – not exclusively – towards the north of England. This is not a short-term cyclical play; it is the result of management seeking prospective fundamental revaluations, on a strategic basis.
► More good positioning: Strategically, Palace Capital also holds ca.50% of its assets in (non-London) city-centre offices. Exposure to pure retail is virtually nil. It is noteworthy that the REIT is undertaking a measured amount of development work, designed to underpin NAV growth.
► Non-executive director: Paula Dillion was appointed on 3 February. The Chairman highlights her “close understanding of the regional economy and issues across transport, planning policy, skills and technology will complement the existing Board and we look forward to working with her.”
► A track record of outperformance: Portfolio occupancy is 86%, with the voids predominantly being “tactical vacancies as we progress our value enhancing capex strategy.” This is important: some income is sacrificed to optimise overall NAV returns.
► Risks: The normal risks of real estate apply. The weighted average length of unexpired lease to break is 5.2 years. EPRA profits grow significantly further in FY22E, with the completion of Hudson Quarter, central York. Retail exposure (bar Wickes and Booker) is minimal. Hudson Quarter selling well means earlier reduction in development capital debt exposure. We have upgraded here.
Financial summary and valuation Year-end Mar (£m) FY17 FY18 FY19 FY20E FY21E Net income 12.2 14.9 16.4 19.0 16.4 Finance cost -3.0 -3.4 -4.6 -4.0 -4.0 Declared profit 12.6 13.3 6.4 3.6 20.2 EPRA PBT 6.4 7.5 8.6 11.0 8.2 EPS reported (diluted, p) 36.5 35.8 11.3 25.4 33.3 EPRA EPS (p) 21.2 18.7 16.5 7.1 44.1 DPS (p) 18.5 19.0 19.0 19.0 19.0 Net cash/debt -68.6 -82.4 -96.5 -108.6 -84.8 Dividend yield 5.4% 5.5% 5.5% 5.5% 5.5% Price/EPRA NAV 72.2% 77.1% 78.7% 80.6% 75.6% EPRA NAV (p) 443.0 414.8 406.6 396.8 423.0 LTV 37.3% 29.9% 33.8% 37.2% 30.2%
Source: Hardman & Co Research
Real Estate
Source: Refinitiv
Market data EPIC/TKR PCA Price (p) 320 12m High (p) 350 12m Low (p) 270 Shares (m) 45.9 Mkt Cap (£m) 147 EV (£m) 244 Market Main, LSE
Description Palace Capital is a real estate investor, diversified by sector (office, industrial predominate) and location, but not present in London, and with minimal exposure to retail. There is an emphasis on city-centre locations. The York development site comprises 6% of assets.
Company information Chairman Stanley Davis CEO Neil Sinclair CFO Stephen Silvester Executive director Richard Starr
+44 20 3301 8330 www.palacecapitalplc.com
Key shareholders AXA 7.7% Miton 7.4% J.O. Hambro 7.3% Stanley Davis (Chairman) 3.6%
Diary Jun’20 Final results Aug’20 AGM
Daily PCA.L 27/02/2018 - 21/02/2020 (LON)Line, PCA.L, Trade Price(Last), 27/02/2020, 297, -3, (-1.00%) Price
GBp
Auto265270275280285290295300305310315320325330335340345350355360
297
Mar Apr May Jun Jul Aug Sep Oct Nov Dec Jan Feb Mar Apr May Jun Jul Aug Sep Oct Nov Dec Jan FebQ2 2018 Q3 2018 Q4 2018 Q1 2019 Q2 2019 Q3 2019 Q4 2019 Q1 2020
Analyst Mike Foster 020 7194 7633

The Monthly
March 2020 28
PANTHEON INTERNATIONAL
THE INFORMATION CONTAINED ON THIS WEBSITE IS INTENDED FOR PERSONS IN THE UNITED KINGDOM AND FOR PROFESSIONAL INVESTORS IN DENMARK, FINLAND, GERMANY, SPAIN AND SWEDEN ONLY AND IN PARTICULAR IS NOT FOR RELEASE, PUBLICATION OR DISTRIBUTION, DIRECTLY OR INDIRECTLY, IN WHOLE OR IN PART, IN OR INTO ANY MEMBER STATE OF THE EUROPEAN ECONOMIC AREA ("EEA") (OTHER THAN THE UNITED KINGDOM, OR TO PROFESSIONAL INVESTORS IN DENMARK, FINLAND, GERMANY, SPAIN OR SWEDEN), THE UNITED STATES, CANADA, AUSTRALIA (OTHER THAN TO PERSONS WHO ARE BOTH WHOLESALE CLIENTS AND PROFESSIONAL OR SOPHISTICATED INVESTORS IN AUSTRALIA), THE REPUBLIC OF SOUTH AFRICA OR JAPAN OR ANY OTHER JURISIDICTION WHERE ITS RELEASE, PUBLICATION OR DISTRIBUTION IS OR MAY BE UNLAWFUL.
PIP is an investment trust that invests in a diversified portfolio of PE assets managed by third-party managers across the world. PIP is the longest-established PE fund-of-funds on the London Stock Exchange and has outperformed the FTSE All-Share and MSCI World indices since its inception in 1987.
PIP is managed by Pantheon, one of the world’s foremost PE specialists. Founded in 1982, with assets under management (AUM) of $47.1bn (as at 30 September 2019), and a team of 96 investment professionals globally (total staff 315 as at January 2020), Pantheon is a recognised investment leader, with a strong track record of investing in PE funds over various market cycles in both the primary and secondary markets, as well as a track record of co-investments.
PIP actively manages risk by the careful selection and purchase of high-quality PE assets in a diversified and balanced portfolio, across different investment stages and vintages, by investing in carefully selected funds operating in different regions of the world.
Given the regulatory restrictions on distributing research on this company, the monthly book entry for Pantheon can be accessed through our website, Hardman and Co Research. Our initiation report, published on 6 September 2019, and our report, History of value added to portfolio by holding Pantheon, published on 26 November 2019, can be found on the same site.
Analyst Mark Thomas 020 7194 7622
Closed-Ended Investments Funds
Source: Refinitiv
Market data EPIC/TKR PIN Price (p) 2,280 12m High (p) 2,620 12m Low (p) 1,975 Shares (m) 54,089 Mkt Cap (£m) 1,333 NAV p/sh. (p) 2,768.7 Discount to NAV 18% Market Premium equity closed-
ended investment funds
Description The investment objective of Pantheon International Plc (PIP) is to maximise capital growth by investing in a diversified portfolio of private equity (PE) assets and directly in private companies.
Company information Chairman Sir Laurie Magnus Aud. Cte. Chr. Ian Barby Sen. Ind. Dir. Susannah Nicklin Inv. Mgr. Pantheon Managers Helen Steers Contact Vicki Bradley +44 20 3356 1800
www.piplc.com
Key shareholders (31 May’19) USS 8.2% Merian 7.0% Esperides SA SICAV- SIF 5.7% East Riding of Yorkshire 4.7% APG Asset Mgt. 4.4% Investec Wealth 4.4% Private Syndicate pty. 3.8% Brewin Dolphin 3.4%
Diary Mid-Mar Feb performance report
Daily PANI.L 27/02/2018 - 21/02/2020 (LON)Line, PANI.L, Trade Price(Last), 27/02/2020, 2,270, -20, (-0.88%) Price
GBp
Auto1,850
1,900
1,950
2,000
2,050
2,100
2,150
2,200
2,250
2,300
2,350
2,400
2,450
2,500
2,550
2,600
2,270
Mar Apr May Jun Jul Aug Sep Oct Nov Dec Jan Feb Mar Apr May Jun Jul Aug Sep Oct Nov Dec Jan FebQ2 2018 Q3 2018 Q4 2018 Q1 2019 Q2 2019 Q3 2019 Q4 2019 Q1 2020
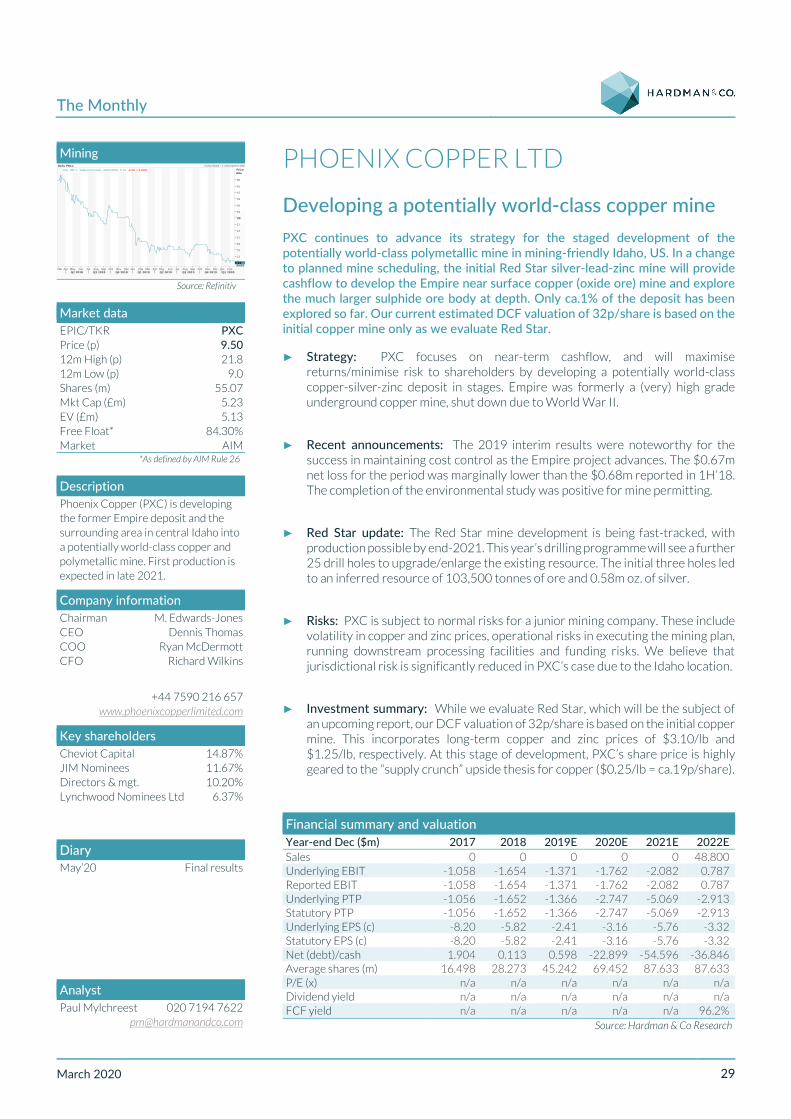
The Monthly
March 2020 29
PHOENIX COPPER LTD
Developing a potentially world-class copper mine PXC continues to advance its strategy for the staged development of the potentially world-class polymetallic mine in mining-friendly Idaho, US. In a change to planned mine scheduling, the initial Red Star silver-lead-zinc mine will provide cashflow to develop the Empire near surface copper (oxide ore) mine and explore the much larger sulphide ore body at depth. Only ca.1% of the deposit has been explored so far. Our current estimated DCF valuation of 32p/share is based on the initial copper mine only as we evaluate Red Star.
► Strategy: PXC focuses on near-term cashflow, and will maximise returns/minimise risk to shareholders by developing a potentially world-class copper-silver-zinc deposit in stages. Empire was formerly a (very) high grade underground copper mine, shut down due to World War II.
► Recent announcements: The 2019 interim results were noteworthy for the success in maintaining cost control as the Empire project advances. The $0.67m net loss for the period was marginally lower than the $0.68m reported in 1H’18. The completion of the environmental study was positive for mine permitting.
► Red Star update: The Red Star mine development is being fast-tracked, with production possible by end-2021. This year’s drilling programme will see a further 25 drill holes to upgrade/enlarge the existing resource. The initial three holes led to an inferred resource of 103,500 tonnes of ore and 0.58m oz. of silver.
► Risks: PXC is subject to normal risks for a junior mining company. These include volatility in copper and zinc prices, operational risks in executing the mining plan, running downstream processing facilities and funding risks. We believe that jurisdictional risk is significantly reduced in PXC’s case due to the Idaho location.
► Investment summary: While we evaluate Red Star, which will be the subject of an upcoming report, our DCF valuation of 32p/share is based on the initial copper mine. This incorporates long-term copper and zinc prices of $3.10/lb and $1.25/lb, respectively. At this stage of development, PXC’s share price is highly geared to the “supply crunch” upside thesis for copper ($0.25/lb = ca.19p/share).
Financial summary and valuation Year-end Dec ($m) 2017 2018 2019E 2020E 2021E 2022E Sales 0 0 0 0 0 48,800 Underlying EBIT -1.058 -1.654 -1.371 -1.762 -2.082 0.787 Reported EBIT -1.058 -1.654 -1.371 -1.762 -2.082 0.787 Underlying PTP -1.056 -1.652 -1.366 -2.747 -5.069 -2.913 Statutory PTP -1.056 -1.652 -1.366 -2.747 -5.069 -2.913 Underlying EPS (c) -8.20 -5.82 -2.41 -3.16 -5.76 -3.32 Statutory EPS (c) -8.20 -5.82 -2.41 -3.16 -5.76 -3.32 Net (debt)/cash 1.904 0.113 0.598 -22.899 -54.596 -36.846 Average shares (m) 16.498 28.273 45.242 69.452 87.633 87.633 P/E (x) n/a n/a n/a n/a n/a n/a Dividend yield n/a n/a n/a n/a n/a n/a FCF yield n/a n/a n/a n/a n/a 96.2%
Source: Hardman & Co Research
Mining
Source: Refinitiv
Market data EPIC/TKR PXC Price (p) 9.50 12m High (p) 21.8 12m Low (p) 9.0 Shares (m) 55.07 Mkt Cap (£m) 5.23 EV (£m) 5.13 Free Float* 84.30% Market AIM
*As defined by AIM Rule 26
Description Phoenix Copper (PXC) is developing the former Empire deposit and the surrounding area in central Idaho into a potentially world-class copper and polymetallic mine. First production is expected in late 2021.
Company information Chairman M. Edwards-Jones CEO COO CFO
Dennis Thomas Ryan McDermott
Richard Wilkins
+44 7590 216 657 www.phoenixcopperlimited.com
Key shareholders Cheviot Capital 14.87% JIM Nominees 11.67% Directors & mgt. 10.20% Lynchwood Nominees Ltd 6.37%
Diary May’20 Final results
Daily PXC.L 27/02/2018 - 21/02/2020 (LON)Line, PXC.L, Trade Price(Last), 28/02/2020, 9.10, -0.50, (-5.00%) Price
GBp
Auto9
12
15
18
21
24
27
30
33
36
39
42
45
48
9.10
Mar Apr May Jun Jul Aug Sep Oct Nov Dec Jan Feb Mar Apr May Jun Jul Aug Sep Oct Nov Dec Jan FebQ2 2018 Q3 2018 Q4 2018 Q1 2019 Q2 2019 Q3 2019 Q4 2019 Q1 2020
Analyst Paul Mylchreest 020 7194 7622

The Monthly
March 2020 30
PRIMARY HEALTH PROPERTIES
Final results show accelerating rental growth 2019 results were announced on 12 February. 90% of PHP’s income is backed by the UK or RoI governments. Occupancy consistently exceeds 99%. We are confident investors will still seek out REITs with a strong focus on categories that provide security of rising income. PHP’s DPS growth rate is accelerating, in contrast to the wider real estate market. 2019’s complementary MedicX merger was transformational, driving improvements that continue strongly in the short term, as well as being strategically beneficial. PHP has reduced costs of borrowing and overhead ratios, benefiting 2019, but also affecting 2020 and 2021 onwards.
► 2019 sees step jump expansion: There is a strong acquisition pipeline of £160m, including £44m in legals, with £356m undrawn bank facilities plus cash. Rental growth, which accelerated to 1.9% from 1.4%, and PHP’s 24 years of unbroken dividend growth, highlight the REIT bears some similarity to index-linked gilts.
► 2019’s good financial results: The 3.7% dividend rise was above the prior year's 2.8%. 1Q'20 rose 5.4%. This was driven by the MedicX merger in 1Q'19, rental growth and lower cost of finance. Cost ratios are highly efficient. Administrative costs are captured in the EPRA cost ratio, which, at 12.0%, is the lowest in the UK.
► Valuation: The rating has risen, with a positive reaction to strategy execution. The MedicX merger was one of several factors driving raised DPS growth visibility. We note rent inflation and successful treasury management (blended new debt cost is 2.5%). Strong expansion in RoI raises blended returns.
► Risks: No development risk is taken. Investment is focused tightly on this one sector. Assets are rented to top-quality covenant tenants on long leases. Interest cover is 2.7x, and the average unexpired lease length is 12.8 years. We estimate a 46.8% end-2020 loan to value (LTV).
► Investment summary: the rental trend is important. Rents have seen modest growth in recent years, but are now set to move significantly ahead of UK real estate average rent inflation. Rental growth in the year drove the majority of the NAV uplift of £50m. There was a modest yield compression in RoI, which comprises 7% of the portfolio, and is growing. 1Q’20 dividends are fully covered.
2019 sees step jump expansion: There is a strong acquisition pipeline of £160 i l di £44 i l l i h £356 d b k f ili i l
Financial summary and valuation Year-end Dec (£m) 2017 2018 2019 2020E 2021E Income 71.3 76.4 115.7 134.0 143.0 Finance costs -31.6 -29.7 -43.7 -46.5 -48.8 Declared profit 91.9 74.3 -70.2 112.4 133.7 EPRA PBT 31.0 36.8 59.7 72.4 78.7 EPS reported (p) 15.3 10.5 -6.4 9.2 10.9 EPRA EPS (diluted, p) 5.1 5.2 5.4 5.9 6.4 DPS (p) 5.25 5.40 5.60 5.90 6.12 Net debt -726.6 -670.2 -1,120.8 -1,249.3 -1,382.9 Dividend yield 3.3% 3.4% 3.5% 3.7% 3.8% Price/EPRA NAV (x) 1.59 1.52 1.48 1.45 1.39 IFRS NAV per share (p) 94.7 102.6 101.0 103.7 108.7 EPRA NAV per share (p) 100.7 105.1 107.9 110.3 115.3
EPRA EPS and EPRA NAV adjusted as per PHP definition Source: Hardman & Co Research
Real Estate
Source: Refinitiv
Market data EPIC/TKR PHP Price (p) 160 12m High (p) 161 12m Low (p) 115 Shares (m) 1,220 Mkt Cap (£m) 1,950 EV (£m) 3,042 Market Premium, LSE
Description Primary Health Properties (PHP) is a REIT acquiring and owning modern primary medical properties in the UK, and is expanding into the Republic of Ireland (RoI).
Company information CEO Harry Hyman CFO Richard Howell Chairman Steven Owen
+44 20 7451 7050 www.phpgroup.co.uk
Key shareholders Directors 1.0% Blackrock 6.7% CCLA 5.3% Investec Wealth 5.0% Vanguard Group 2.7% Troy Asset 2.3%
Diary Apr’20 AGM Jul’20 Interim results
Daily PHP.L 27/02/2018 - 21/02/2020 (LON)Line, PHP.L, Trade Price(Last), 27/02/2020, 149.8000, -6.6000, (-4.22%) Price
GBp
Auto
110
115
120
125
130
135
140
145
150
155
160
149.8000
M A M J J A S O N D J F M A M J J A S O N D J FQ2 2018 Q3 2018 Q4 2018 Q1 2019 Q2 2019 Q3 2019 Q4 2019 Q1 2020
Analyst Mike Foster 020 7194 7633
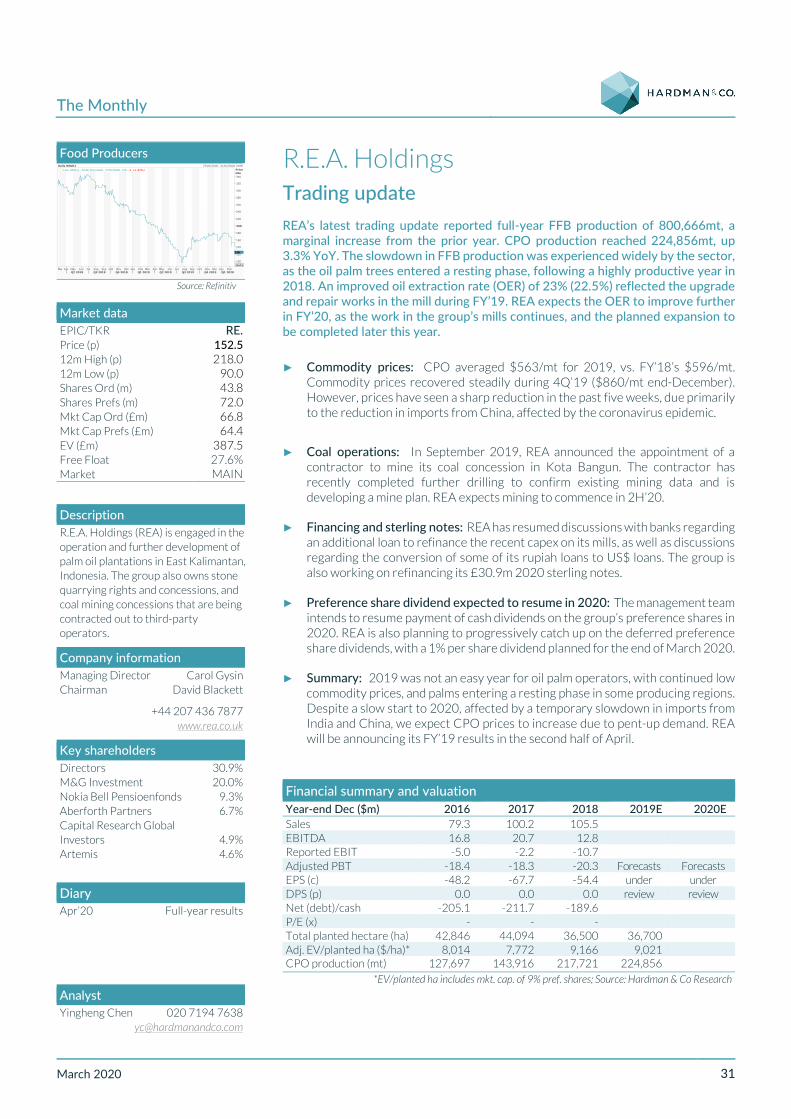
The Monthly
March 2020 31
R.E.A. Holdings Trading update REA’s latest trading update reported full-year FFB production of 800,666mt, a marginal increase from the prior year. CPO production reached 224,856mt, up 3.3% YoY. The slowdown in FFB production was experienced widely by the sector, as the oil palm trees entered a resting phase, following a highly productive year in 2018. An improved oil extraction rate (OER) of 23% (22.5%) reflected the upgrade and repair works in the mill during FY’19. REA expects the OER to improve further in FY’20, as the work in the group’s mills continues, and the planned expansion to be completed later this year.
► Commodity prices: CPO averaged $563/mt for 2019, vs. FY’18’s $596/mt. Commodity prices recovered steadily during 4Q’19 ($860/mt end-December). However, prices have seen a sharp reduction in the past five weeks, due primarily to the reduction in imports from China, affected by the coronavirus epidemic.
► Coal operations: In September 2019, REA announced the appointment of a contractor to mine its coal concession in Kota Bangun. The contractor has recently completed further drilling to confirm existing mining data and is developing a mine plan. REA expects mining to commence in 2H’20.
► Financing and sterling notes: REA has resumed discussions with banks regarding an additional loan to refinance the recent capex on its mills, as well as discussions regarding the conversion of some of its rupiah loans to US$ loans. The group is also working on refinancing its £30.9m 2020 sterling notes.
► Preference share dividend expected to resume in 2020: The management team intends to resume payment of cash dividends on the group’s preference shares in 2020. REA is also planning to progressively catch up on the deferred preference share dividends, with a 1% per share dividend planned for the end of March 2020.
► Summary: 2019 was not an easy year for oil palm operators, with continued low commodity prices, and palms entering a resting phase in some producing regions. Despite a slow start to 2020, affected by a temporary slowdown in imports from India and China, we expect CPO prices to increase due to pent-up demand. REA will be announcing its FY’19 results in the second half of April.
Financial summary and valuation Year-end Dec ($m) 2016 2017 2018 2019E 2020E Sales 79.3 100.2 105.5 EBITDA 16.8 20.7 12.8 Reported EBIT -5.0 -2.2 -10.7 Adjusted PBT -18.4 -18.3 -20.3 Forecasts Forecasts EPS (c) -48.2 -67.7 -54.4 under under DPS (p) 0.0 0.0 0.0 review review Net (debt)/cash -205.1 -211.7 -189.6 P/E (x) - - - Total planted hectare (ha) 42,846 44,094 36,500 36,700 Adj. EV/planted ha ($/ha)* 8,014 7,772 9,166 9,021 CPO production (mt) 127,697 143,916 217,721 224,856
*EV/planted ha includes mkt. cap. of 9% pref. shares; Source: Hardman & Co Research
Food Producers
Source: Refinitiv
Market data EPIC/TKR RE. Price (p) 152.5 12m High (p) 218.0 12m Low (p) 90.0 Shares Ord (m) 43.8 Shares Prefs (m) 72.0 Mkt Cap Ord (£m) 66.8 Mkt Cap Prefs (£m) 64.4 EV (£m) 387.5 Free Float 27.6% Market MAIN
Description R.E.A. Holdings (REA) is engaged in the operation and further development of palm oil plantations in East Kalimantan, Indonesia. The group also owns stone quarrying rights and concessions, and coal mining concessions that are being contracted out to third-party operators.
Company information Managing Director Carol Gysin Chairman David Blackett
+44 207 436 7877 www.rea.co.uk
Key shareholders Directors 30.9% M&G Investment 20.0% Nokia Bell Pensioenfonds 9.3% Aberforth Partners 6.7% Capital Research Global Investors 4.9% Artemis 4.6%
Diary
Apr’20 Full-year results
Daily REAH.L 27/02/2018 - 21/02/2020 (LON)Line, REAH.L, Trade Price(Last), 27/02/2020, 126, -3, (-1.82%) Price
GBp
Auto100
120
140
160
180
200
220
240
260
280
300
320
340
126
Mar Apr May Jun Jul Aug Sep Oct Nov Dec Jan Feb Mar Apr May Jun Jul Aug Sep Oct Nov Dec Jan FebQ2 2018 Q3 2018 Q4 2018 Q1 2019 Q2 2019 Q3 2019 Q4 2019 Q1 2020
Analyst Yingheng Chen 020 7194 7638

The Monthly
March 2020 32
REAL ESTATE CREDIT INVESTMENTS THE MATERIALS CONTAINED HEREIN MAY NOT BE DISTRIBUTED, FORWARDED, TRANSMITTED OR OTHERWISE MADE AVAILABLE, AND THEIR CONTENTS MAY NOT BE DISCLOSED, TO ANY US PERSON OR IN, INTO OR FROM THE UNITED STATES, AUSTRALIA, CANADA, JAPAN, SOUTH AFRICA OR IN, INTO OR FROM ANY OTHER JURISDICTION WHERE TO DO SO WOULD CONSTITUTE A VIOLATION OF THE RELEVANT LAWS OR REGULATIONS OF SUCH JURISDICTION. RECI is a closed-ended investment company. To achieve the investment objective, the company invests, and will continue to invest, in real estate credit secured by commercial or residential properties in Western Europe, focusing primarily in the UK, France and Germany.
Investments may take different forms, but are likely to be:
► Secured real estate loans, debentures or any other forms of debt instruments (together “Secured Debt”). Secured real estate loans are typically secured by mortgages over the property or charges over the shares of the property-owning vehicle. Individual secured debt investments will have a weighted average life profile ranging from six months to 15 years. Investments in secured debt will also be directly or indirectly secured by one or more commercial or residential properties, and will not exceed a loan to value (“LTV”) of 85% at the time of investment.
► Listed debt securities and securitised tranches of real estate-related debt securities – for example, residential mortgage-backed securities and commercial mortgage-backed securities (together “MBS”). For the avoidance of doubt, this does not include equity residual positions in MBS.
► Other direct or indirect opportunities, including equity participations in real estate, save that no more than 20% of the total assets will be invested in positions with an LTV in excess of 85% or in equity positions that are uncollateralised. On specific transactions, the company may be granted equity positions as part of its loan terms. These positions will come as part of the company’s overall return on its investments, and may or may not provide extra profit to the company, depending on market conditions and the performance of the loan. These positions are deemed collateralised equity positions. All other equity positions in which the company may invest are deemed uncollateralised equity positions.
RECI is externally managed by Cheyne Capital Management (UK) LLP, a UK investment manager authorised and regulated by the FCA. As at 31 July 2019, Cheyne had 153 employees, of which 30 were in the Real Estate Team, and AUM of $7.1bn, of which $3.2bn was managed by the Real Estate Team. It has offices in London, New York, Bermuda and Zurich. Cheyne invests across the capital structure – from the senior debt to the equity positions. It has expertise in the structuring, execution and management of securitisation transactions, involving a broad range of assets, including portfolios comprised of traditional asset classes, such as commercial and residential mortgages, as well as mortgage-backed securities and the management of commercial real estate portfolios, focused on Europe and the UK.
Given the regulatory restrictions on distributing research on this company, the monthly book entry for RECI can be accessed through our website, Hardman and Co Research. Our initiation report, published on 28 August, and our note, Delivering on its promises, published on 17 December, can be found on the same site.
[[
Analysts Mark Thomas 020 7194 7622
[email protected] Mike Foster 020 7194 7622
Diversified Financial Services
Source: Refinitiv
Market data EPIC/TKR RECI Price (p) 168.5 12m High (p) 175.5 12m Low (p) 163.5 Shares (m) 229.3 Mkt Cap (£m) 393 NAV p/sh. (p) 166.0 Prem. to NAV 3.3% Market Premium Equity Closed-
Ended Inv. Funds
Description Real Estate Credit Investments (RECI) is a closed-ended investment company that aims to deliver a stable quarterly dividend via a levered exposure to real estate credit investments, primarily in the UK, France and Germany.
Company information Chairman Bob Cowdell NED Susie Farnon NED John Hallam NED Graham Harrison Inv. Mgr. Cheyne Capital Head of Team Ravi Stickney Main contact Richard Lang
+44 207 968 7328 www.recreditinvest.com
Key shareholders Bank Leumi 8.6% AXA SA 8.4% Close Bros 8.2% Premier AM 8.2% Fidelity 8.0% Canaccord Genuity Group 7.7% Smith and Williamson 6.7%
Diary Early Mar’20 Feb factsheet Jun’20 Year-end Mar results
Daily RECIV.L 27/02/2018 - 21/02/2020 (LON)Line, RECIV.L, Trade Price(Last), 27/02/2020, 169.0, -1.5, (-0.88%) Price
GBp
Auto159160
161
162
163
164
165
166
167
168
169
170
171
172
173
174
175
169.0
M A M J J A S O N D J F M A M J J A S O N D J FQ2 2018 Q3 2018 Q4 2018 Q1 2019 Q2 2019 Q3 2019 Q4 2019 Q1 2020

The Monthly
March 2020 33
RM SECURED DIRECT LENDING
THIS DOCUMENT IS NOT AVAILABLE TO ‘U.S. PERSONS’, NOR RESIDENTS OF AUSTRALIA, CANADA, JAPAN OR THE REPUBLIC OF SOUTH AFRICA. NOR SHOULD IT BE TAKEN, TRANSMITTED OR DISTRIBUTED, DIRECTLY OR INDIRECTLY, TO ANY OF THESE CATEGORIES. IN THE UNITED KINGDOM IT IS SUITABLE ONLY TO AN INSTITUTIONAL INVESTOR OR A PROFESSIONALLY ADVISED PRIVATE INVESTOR WHO UNDERSTANDS AND IS CAPABLE OF EVALUATING THE MERITS AND RISKS OF AN INVESTMENT IN THE SECURITIES.
RMDL will seek to meet its investment objective by making investments in a diversified portfolio of loans to UK SMEs and mid-market corporates, and/or to individuals. These loans will generally be, but are not limited to, senior, subordinated, unitranche and mezzanine debt instruments, documented as loans, notes, leases, bonds or convertible bonds. Such loans will typically have a life of two to 10 years. In certain limited cases, loans in which the company invests may have equity instruments attached; ordinarily, any such equity interests would come in the form of warrants or options attached to a loan. Typically, the loans will have coupons that may be fixed, index-linked or LIBOR-linked. For the purposes of this investment policy, UK SMEs include entities incorporated outside of the UK, provided their assets and/or principal operations are within the UK. RMDL is permitted to make investments outside of the UK to mid-market corporates.
The investment manager for RMDL’s assets is RM Funds. RM Funds is a specialist in fixed income, being part of RM Capital, a diversified fixed-income firm. Headquartered in Edinburgh, with offices in London, RM Funds has a team of analysts focused on bottom-up, bespoke credit and lending work, with a focus on secured lending over physical assets or contracted cashflows. RM Funds provides both public and private strategies to allow investors to participate in secure debt investments, aiming to provide above-average returns on a risk-adjusted basis.
Given the regulatory restrictions on distributing research on this company, the monthly book entry for RMDL can be accessed through our website, Hardman and Co Research. Our initiation report: Predictable revenue streams generating high yield, published on 5 June 2019, and our reports, Defensive qualities in uncertain times (26 September 2019) and Social Infrastructure: RMDL an alternative alternative (6 January 2020), can be found on the same site.
[[
Premium Equity Closed-Ended Investment Funds
Source: Refinitiv
Market data EPIC/TKR RMDL/RMDZ Price (p) 97.5/105.5 12m RMDL (ord.) High (p) 103.0 12m RMDL (ord.) Low (p) 97.5 Shares Ord. (m) 122.24 Mkt Cap (£m) 131 NAV per share (p) 98.3 Free Float 100% Market LSE Equity Inv. Instr.
Description RM Secured Direct Lending (RMDL) aims to generate attractive and regular dividends through investment in debt instruments that are backed by real assets, led by exceptional management teams, and that usually demonstrate high cashflow visibility.
Company information Chairman Norman Crighton NED Guy Heald NED Marlene Wood Inv. Mgr. RM Funds CIO James Robson Co. Manager Pietro Nicholls AIFM IFM
(RM) +44 131 603 7060 rmdl.co.uk
Key shareholders CCLA 17% Quilter 16% MerianGlobal 13% Brooks MacDonald & Hawksmoor 5% CG AM & Jupiter 4% Sarasin, Charles Taylor, PAM, Seneca & Blankstone Sington
3%
RM (Inv. Mgr.) 1%
Diary
Daily RMDL.L 27/02/2018 - 21/02/2020 (LON)Line, RMDL.L, Trade Price(Last), 27/02/2020, 95.45, -1.00, (-1.03%) Price
GBp
Auto97.5
98
98.5
99
99.5
100
100.5
101
101.5
102
102.5
103
103.5
M A M J J A S O N D J F M A M J J A S O N D J FQ2 2018 Q3 2018 Q4 2018 Q1 2019 Q2 2019 Q3 2019 Q4 2019 Q1 2020
Analyst Mark Thomas 020 7194 7622

The Monthly
March 2020 34
SHIELD THERAPEUTICS
Good demand for Feraccru in Europe STX is a commercial-stage company delivering specialty products that address patients’ unmet medical needs, with an initial focus on treating iron deficiency (ID) with ferric maltol. Recent news that the FDA had approved this drug for a broad indication opened up a market in the US currently worth over $1bn p.a. – a US partnership deal is expected in 2020. A 2019 trading update showed STX’s performance to be in line with expectations, with £0.6m in sales-related revenue from Norgine’s sales of Feraccru in Europe and £2.3m in milestones. STX’s cash runway extends into 2021, in the absence of a US deal.
► Strategy: STX’s strategy is to out-license the commercial rights to its products to partners with marketing and distribution expertise in target markets. These deals allow STX to retain its intellectual property (IP) and to keep investing in its R&D pipeline, while benefiting from immediate and long-term value.
► Trading update: Partner sales of Feraccru in European markets were in line with expectations, giving gross revenues of £2.9m. 2H’19 sales volumes were 28% higher than in 1H. The gross cash position, at £4.1m, was lower than forecast, due to a combination of working capital, lower tax rebates and capitalised R&D.
► China deal: The novel iron replacement therapy, Feraccru/Accrufer, has been exclusively licensed to ASK Pharm for development and commercialisation in China. This paves the way to a large and growing market for iron replacement products, and strengthens STX’s hand in ongoing negotiations with potential US partners.
► Risks: All drug companies carry development risk. However, the clinical risk with STX is limited because of Feraccru/Accrufer’s clinical profile and existing marketing approvals. The main risks are achieving an appropriate partnering deal in the US and executing on commercialisation strategy to capture market share.
► Investment summary: The FDA approval and pending launch of Accrufer reinforce our view that STX is at an exciting juncture. It has delivered on all the goals set at the time of its IPO in 2016. Feraccru/Accrufer has been validated by EU and US regulatory approvals, and the commercial deal in Europe looks set to be repeated in the US. Announcement of its commercial partner, together with the terms of any deal, represents the next valuation inflection point.
Financial summary and valuation Year-end Dec (£m) 2017 2018 2019E 2020E 2021E Gross revenues 0.64 11.88 2.93 11.07 3.14 Sales 0.64 0.86 0.63 2.15 3.14 R&D -4.71 -4.30 -3.31 -4.64 -3.89 Other income 0.00 11.03 2.30 8.92 0.00 EBITDA -18.48 -2.47 -5.45 -0.28 -8.68 Underlying EBIT -18.90 -3.26 -6.25 -1.07 -9.47 Reported EBIT -20.95 -5.17 -8.15 -2.97 -11.38 Underlying PBT -18.91 -3.26 -6.24 -1.10 -9.52 Statutory PBT -20.99 -5.16 -8.14 -3.00 -11.42 Underlying EPS (p) -15.58 0.09 -4.49 -0.34 -7.62 Statutory EPS (p) -17.43 -1.55 -6.12 -1.97 -9.25 Net (debt)/cash 13.30 9.63 3.96 5.35 -1.92
Source: Hardman & Co Life Sciences Research
Pharmaceuticals & Biotechnology
Source: Refinitiv
Market data EPIC/TKR STX Price (p) 153.0 12m High (p) 202.0 12m Low (p) 54.0 Shares (m) 117.2 Mkt Cap (£m) 179.3 EV (£m) 175.3 Free Float* 33% Market AIM
*As defined by AIM Rule 26
Description Shield Therapeutics (STX) is a commercial-stage pharmaceutical company delivering innovative specialty pharmaceuticals that address patients’ unmet medical needs, with an initial focus on anaemia associated with renal and gastrointestinal disorders.
Company information CEO Carl Sterritt CFO (Interim) Tim Watts Chairman James Karis
+44 207 186 8500 www.shieldtherapeutics.com
Key shareholders Directors 8.9% W. Health 47.8% MaRu AG 10.7% C. Schweiger 4.8% USS 4.4% R. Griffiths 4.0%
Diary 1H’20 US Accrufer deal 2Q’20 Paediatric study to start Apr’20 FY’19 results Mid-2020 Accrufer launch
Daily STXS.L 27/02/2018 - 21/02/2020 (LON)Line, STXS.L, Trade Price(Last), 27/02/2020, 135.2001, -6.0000, (-4.22%) Price
GBp
Auto20
30
40
50
60
70
80
90
100
110
120
130
140
150
160
170
180
190
135.2001
M A M J J A S O N D J F M A M J J A S O N D J FQ2 2018 Q3 2018 Q4 2018 Q1 2019 Q2 2019 Q3 2019 Q4 2019 Q1 2020
Analysts Martin Hall 020 7194 7632
[email protected] Dorothea Hill 020 7194 7626
[email protected] Grégoire Pavé 020 7194 7628

The Monthly
March 2020 35
SURFACE TRANSFORMS
Results anticipated with interest ST’s trading base is secured by several orders, typically of three or so years’ duration. These are with European-based, global original equipment manufacturers (OEMs). There is also a retrofit baseload. Orders won in summer 2019 were transformational in ST’s development, taking it to cashflow generation. More importantly, though, the OEMs have strong scope to place much larger orders within our forecasting timeframes. Order book building has been good in 2019 and we see this as just the start of the journey. Note the recent year-end change, hence two sets of results in the coming month.
► Major orders achieved and more to come: As per the 10 January update: “the Company still expects to be able to make significant contract announcements during the new 2020 financial year.” The market is £100m and set to grow ca.20-fold, with ST one of only two manufacturers.
► Major orders won last year: OEM 6 contract award on 28 June 2019 – two contracts, ca.£8m, over the next five years; OEM 5 award on 16 July 2019 – lifetime revenue contracted at ca. €11.8m, commencing in October 2021. Note that other, ‘near OEM’ orders were secured in 2019.
► Capacity allocation model: ST’s capacity-in-place is £17m sales p.a. The production process, while extremely complex, is entirely repeatable; expansion would consist of adding more of exactly the same bespoke kit as that being used already. There will be ongoing scope to adjust efficiencies.
► Evolution of risks: ST is set to be cashflow-positive by 2021. It is the right side of high barriers to new competition in a high-growth market with only one competitor. The product requires a delicate marriage of manufacturing and chemical engineering skills. ST’s high R&D spend has secured this.
► Investment case: This is a large, growing market, 99%-supplied by one, highly profitable player. This single supply was a most anomalous position for an auto OEM market – now ST also supplies. Last year’s June/July contract wins de-risk the business, and both open and expand the target market. The path to ST’s discs being designed into many more models is clear.
Financial summary and valuation Year-end May*/ Dec**(£m)
FY19* 7-month 19E**
FY20E** FY21E** FY22E**
Sales 1.00 1.50 3.30 4.10 5.80 EBITDA -2.63 -1.00 -0.55 -0.10 1.00 EBITA -2.97 -1.20 -1.25 -0.80 0.30 PBT -2.98 -1.20 -1.25 -0.80 0.30 PAT -2.06 -0.90 -0.70 -0.25 0.85 EPS (adjusted, p) -1.64 -0.66 -0.51 -0.18 0.62 Shareholders’ funds 6.96 6.05 5.35 5.10 5.95 Net (debt)/cash 1.60 0.77 1.40 1.90 3.20 P/E (x) loss n/a loss loss 45.2 EV/sales (x) 37.2 n/a 11.0 8.8 6.0 EV/EBITDA (x) loss n/a loss loss 35.0 DPS (p) nil nil nil nil nil
*May year-end; **the company has announced its change of year-end to December Source: Hardman & Co Research
Automotive
Source: Refinitiv
Market data EPIC/TKR SCE Price (p) 28 12m High (p) 28 12m Low (p) 12 Shares (m) 136 Mkt Cap (£m) 38.0 EV (£m) 37.2 Free Float* 86% Market AIM
*As defined by AIM Rule 26
Description Surface Transforms (ST) is 100% focused on the manufacture and sales of carbon ceramic brake discs. It has recently announced a number of OEM contracts.
Company information Non-Exec. Chair. David Bundred CEO Dr Kevin Johnson Finance Director Michael
Cunningham
+ 44 151 356 2141 www.surfacetransforms.com
Key shareholders Directors 14.0% Canaccord 14.8% Unicorn 12.3% Richard Gledhill esq. (director) 9.9% Richard Sneller esq. 8.2% Hargreaves Lansdown 4.5%
Diary 28 Feb Report for seven
months to Nov’19 30 Mar Year-end Dec’19 Jun’20 AGM
Daily SCEU.L 27/02/2018 - 21/02/2020 (LON)Line, SCEU.L, Trade Price(Last), 27/02/2020, 25.15, -0.50, (-1.92%) Price
GBp
Auto1011
12
13
14
15
16
17
18
19
20
21
22
23
24
25
26
27
25.15
M A M J J A S O N D J F M A M J J A S O N D J FQ2 2018 Q3 2018 Q4 2018 Q1 2019 Q2 2019 Q3 2019 Q4 2019 Q1 2020
Analyst Mike Foster 020 7194 7633

The Monthly
March 2020 36
THE 600 GROUP
Continued near-term trading difficulties Trading difficulties continue in the near term with 4Q order intake significantly below previously predicted levels. The 600 Group remains well placed fundamentally and competitively, with a world-class reputation and its financial position recently strengthened. The shares, however, are likely to tread water in the near term, despite standing at a discount to the peer group and to a DCF valuation.
► Trading update: The latest trading update reveals further weakening in activity with volatile order intake across both business areas and projects being delayed into the next financial year. The group has also faced shipping disruption in the Far East pushing sales into the next financial year. UK trading is seeing good progress.
► Financial forecasts: Consequently, earnings forecasts for 2019/20 and 2020/21 have been reduced by a further ca.50% and ca.30%, respectively, with increased net debt level expectations offset by proceeds ($0.5m) from the forthcoming sale of the Gamet site in the UK, part of the group’s UK rationalisation programme.
► Strategy: The strategic objective is to grow the business into a global industrial concern. The recent US acquisition of CMS significantly strengthens the competitive position of the group’s TYKMA industrial laser systems subsidiary, being complementary and adding significant engineering expertise.
► Competitive position: The 600 Group is regarded as well positioned within highly competitive industries. The group has undertaken a UK restructuring programme to reduce capex requirements and further improve margins. Opportunities are also available for operational and distribution synergy benefits.
► Investment summary: The shares offer the opportunity to invest in a de-risked cyclical stock with good operational leverage, enhanced by new product launches and new market entry. Cyclicality has been de-risked through further development of high-margin repeat/recurring business. The risk/reward profile is favourable, but the shares are likely to tread water until improvements in the weak markets become visible.
Financial summary and valuation Year-end Mar ($m) 2018 2019 2020E 2021E Sales 63.9 65.2 63.3 67.1 Gross profit 21.6 23.6 24.4 27.5 Underlying EBIT 1.8 5.2 2.6 3.5 Underlying PTP 0.6 4.0 1.2 2.3 Underlying EPS (c) 1.0 3.5 0.9 1.8 Statutory EPS (c) 1.5 3.5 0.9 1.8 Net (debt)/cash -15.6 -14.5 -17.9 -16.4 DPS (p) 0.50 1.00 1.00 1.00 P/E (x) 25.1 7.2 15.2 8.0 Yield 2.5% 5.0% 9.1% 9.1%
Source: Hardman & Co Research
Industrial Engineering
Source: Refinitiv
Market data EPIC/TKR SIXH Price (p) 11.0 12m High (p) 21.9 12m Low (p) 10.2 Shares (m) 117.1 Mkt Cap (£m) 12.9 EV (£m) 24.1 Free Float* 72.1% Market AIM
*As defined by AIM Rule 26
Description The 600 Group is a designer and manufacturer of industrial products active in machine tools, components and industrial laser systems. The US represents around 65% of group sales.
Company information Executive Chairman Paul Dupee CFO Neil Carrick
+44 1922 707110 www.600group.com
Key shareholders Haddeo Partners 20.0% Mr A Perloff and Maland 9.0% Mr T Miller 3.8% Miton Group 3.3% Others 63.9%
Diary Apr’20 Final results
Daily SIXH.L 28/02/2018 - 03/04/2020 (LON)Line, SIXH.L, Trade Price(Last), 27/02/2020, 10.6-0.1, (-0.44%) Price
GBp
Auto
11
12
13
14
15
16
17
18
19
20
21
10.6
M A M J J A S O N D J F M A M J J A S O N D J F M AQ2 2018 Q3 2018 Q4 2018 Q1 2019 Q2 2019 Q3 2019 Q4 2019 Q1 2020
Analyst Paul Singer 020 7194 7622

The Monthly
March 2020 37
TISSUE REGENIX
Restructured to satisfy product demand TRX has a broad portfolio of regenerative medicine products for the biosurgery, orthopaedics, dental and cardiac markets. It has two proprietary decellularisation technology platforms for repair of soft tissue (dCELL) and bone (BioRinse). Following the acquisition of CellRight in 2017, TRX revised its commercial strategy, to service the strong demand for its products. However, this necessitated capacity expansion and realignment of its supply chain, which affected 2019 trading and forced renegotiation of its MidCap loan arrangement. In our view, the current share price reflects TRX’s need for a capital injection.
► Strategy: TRX is building an international regenerative medicine business with a product portfolio using proprietary dCELL and BioRinse technology platforms, underpinned by compelling clinical outcomes. It aims to expand its global distribution network, via strategic partnerships, to drive sales momentum.
► Forecasts: Sales forecasts have been revised to reflect the investment in new manufacturing capacity to satisfy demand. However, refinements in the commercial model, coupled with some cost savings, have limited the impact on operating losses. Gross cash at 31 December 2019 was £2.4m.
► Expansion: Extra staff were employed to enable two-shift manufacturing. However, training time, coupled with the natural business cycle, meant the tangible benefit of this only became apparent towards the year-end. Investment in an adjacent building in San Antonio will free up space for further clean rooms.
► Risks: Although demand for its products is very positive, the above has caused some challenges, notably reorganisation of the manufacturing facility – to the short-term detriment of BioSurgery sales. The current share price, in our opinion, is reflecting the urgent need for more capital.
► Investment summary: The strategy to focus on maximising sales potential has paid off through increased demand for products. However, this has resulted in the need for an expansion of capital. Two major shareholders have sold down their holdings recently, and the ex-Woodford holding has been temporarily transferred to Link Fund Solutions. The shares are trading at a discount of 87% to the £95.8m (8.2p per share) that has been invested in the company to date.
Financial summary and valuation Year-end Dec (£m) *2016 2017 2018 2019E 2020E 2021E Sales 1.44 5.23 11.62 12.50 15.75 21.25 EBITDA -11.14 -9.01 -7.09 -7.82 -3.90 0.01 Underlying EBIT -11.44 -9.72 -8.27 -9.00 -5.11 -1.23 Reported EBIT -11.44 -10.82 -8.69 -9.00 -5.11 -1.23 Underlying PBT -11.33 -9.67 -8.46 -9.29 -5.96 -2.14 Statutory PBT -11.33 -10.77 -8.88 -9.29 -5.96 -2.14 Underlying EPS (p) -1.35 -0.90 -0.67 -0.76 -0.29 -0.08 Statutory EPS (p) -1.35 -1.02 -0.70 -0.76 -0.29 -0.08 Net (debt)/cash 8.17 16.42 7.82 -0.72 -0.07 -6.73 Equity issues 0.00 37.99 0.00 0.00 9.00 0.00 P/E (x) - - - - - - EV/sales (x) - 2.3 1.1 1.0 0.8 0.6
*11 months to December; Source: Hardman & Co Life Sciences Research
Pharmaceuticals & Biotechnology
Source: Refinitiv
Market data EPIC/TKR TRX Price (p) 0.98 12m High (p) 7.25 12m Low (p) 0.45 Shares (m) 1,172.0 Mkt Cap (£m) 11.5 EV (£m) 12.2 Free Float* 52% Market AIM
*As defined by AIM Rule 26
Description Tissue Regenix (TRX) is a medical device company focused on regenerative medicine. Patented decellularisation technologies remove DNA, cells and other material from animal/human tissue and bone, leaving scaffolds that can be used to repair diseased or worn-out body parts. Its products have multiple applications.
Company information CEO (Interim) Gareth Jones Group Finance Director Kirsten Lund Chairman John Samuel
+44 330 430 3052 www.tissueregenix.com
Key shareholders Directors 4.3% Link Fund Solutions 20.0% IP Group 13.7% Jupiter AM 8.5%
Diary 1Q’20 Potential EU approval of
OrthoPure XT Mar’20 Final results
Daily TRX.L 27/02/2018 - 21/02/2020 (LON)Line, TRX.L, Trade Price(Last), 27/02/2020, 0.900, -0.050, (-5.41%) Price
GBp
Auto
1
2
3
4
5
6
7
8
9
10
11
0.900
M A M J J A S O N D J F M A M J J A S O N D J FQ2 2018 Q3 2018 Q4 2018 Q1 2019 Q2 2019 Q3 2019 Q4 2019 Q1 2020
Analysts Martin Hall 020 7194 7631
[email protected] Dorothea Hill 020 7194 7626
[email protected] Grégoire Pavé 020 7194 7628

The Monthly
March 2020 38
URBAN LOGISTICS
Transformational expansion, with strong track record Urban Logistics invests in “mid-box”, “last-stage” distribution warehouses. A fund raise was announced in February, aiming to raise £100m minimum. On 14 February, it was announced that £130m had been raised at 137.5p per share: 109.7m shares. Directors participated in the placing. A significant pipeline has been assembled, and investment of the new equity should be complete in under 12 months. The company has also declared a special dividend for the financial year ending 31 March 2020 (3.85p ex dividend 6 March). Even excluding this, the dividend increase at the interims was well ahead of most UK REITs – all very encouraging, and more to come.
► Acquisition pipeline: The pipeline update, provided on 6 January 2020, indicates £146m assets in advanced stages of negotiation, with a similar amount for the medium term. The former comprises three portfolios, plus 12 individual assets, on a 6.8% net initial yield and average 7.8 year leases.
► Growth strategy: The management team has deep specialist knowledge, and has delivered strong, consistent returns as a result. To fund a potential pipeline, an equity fund raise is being considered. Liquidity (percentage of shares traded over a given period of time) tends to be enhanced by greater market capitalisation.
► Valuation: On a 5.7% dividend yield (2H’19 plus 1H’20), and with momentum behind earnings and NAV, and compared with other yields in the peer group, we consider the rating attractive. We contend there is insufficient appreciation of the investor benefits of this last-step logistics supply chain into growing conurbations.
► Risks: A 6.1-year (5.4 to tenant break option) WAULT (weighted average unexpired lease term) means reversionary rent rises are set to come, but also that new leases must be secured. In the past ca.20 years, aggregate rent rises have been minimal. Physical reduction in supply and strong demand mitigate risk.
► Investment track record: Urban Logistics owns a £195m warehouse portfolio. Since listing on the AIM in April 2016, it has generated annual NAV and dividend returns of 16.0%. The experienced management team has bought well. Market rents are ca.9% above the REIT’s current levels, as evidenced by two recent reviews. Market vacancies are only ca.5%, and Urban Logistics’ vacancy is nil.
Financial summary and valuation Year-end Mar (£m) 2017 2018 2019 2020E 2021E 2022E Rental income 2.28 5.56 10.80 12.20 Review Finance costs -0.60 -0.93 -2.20 -2.60 post EPRA operating profit 1.76 3.40 8.18 9.90 growth Declared profit 4.89 9.86 18.88 18.40 equity EPS reported (p) 46.80 19.54 22.12 20.97 raise EPRA EPS (dil., post LTIP, p) 7.82 4.91 7.01 8.32 DPS (p) 6.23 6.32 7.00 11.65* Net debt 16.52 44.39 61.64 66.12 Dividend yield 4.29% 4.36% 4.82% 5.27%** Price/EPRA NAV (x) 1.25 1.18 1.05 0.98 NAV per share (p) 118.26 123.62 137.39 148.47 EPRA NAV per share (p) 116.11 122.49 137.96 148.47
*Includes 3.85p special. **Ordinary dividend yield; Source: Hardman & Co Research
Real Estate
Source: Refinitiv
Market data EPIC/TKR SHED Price (p) 145 12m High (p) 145 12m Low (p) 113 Shares (m) 198 Mkt Cap (£m) 287 EV (£m) 189 Market AIM
Description Urban Logistics focuses on strategically located (e.g. urban “last mile”), smaller (typically ca.70,000 sq. ft.) single-let industrial and logistics properties, servicing high-quality tenants. The market is in strategic under-supply.
Company information CEO Richard Moffitt Chairman Nigel Rich
+44 20 7591 1600 www.urbanlogisticsreit.com
Key shareholders Directors 1.1% Allianz 11.6% Janus Henderson 10.7% Rathbone I M 10.5% Sir John Beckwith 8.0% Premier 7.9%
Diary May’20 Final results Jul’20 AGM
Daily SHED.L 27/02/2018 - 21/02/2020 (LON)Line, SHED.L, Trade Price(Last), 27/02/2020, 145.4, -1.5, (-1.03%) Price
GBp
Auto114
117
120
123
126
129
132
135
138
141
144
147145.4
M A M J J A S O N D J F M A M J J A S O N D J FQ2 2018 Q3 2018 Q4 2018 Q1 2019 Q2 2019 Q3 2019 Q4 2019 Q1 2020
Analyst Mike Foster 020 7194 7633

The Monthly
March 2020 39
VOLTA FINANCE
THIS DOCUMENT IS NOT AVAILABLE TO ‘U.S. PERSONS’, NOR TO PARTIES WHO ARE NOT CONSIDERED ‘RELEVANT PERSONS’ IN THE UNITED KINGDOM, NOR SHOULD IT BE TAKEN, TRANSMITTED OR DISTRIBUTED, DIRECTLY OR INDIRECTLY, TO EITHER OF THESE CATEGORIES.
Volta is a closed-ended, limited liability company registered in Guernsey. Its investment objectives are to seek to preserve capital across the credit cycle and to provide a stable stream of income to its shareholders through dividends that it expects to distribute on a quarterly basis. The rolling 12-month dividend is €0.62 per share (with €0.15/€0.16 per share paid quarterly). The assets in which Volta may invest, either directly or indirectly, include, but are not limited to, corporate credits, sovereign and quasi-sovereign debt, residential mortgage loans, commercial mortgage loans, automobile loans, student loans, credit card receivables, leases, and debt and equity interests in infrastructure projects. The current underlying portfolio risk is virtually all to corporate credits. The investment manager for Volta’s assets is AXA Investment Managers Paris, which has a team of experts concentrating on the structured finance markets.
On 11 December 2018, Volta announced that, after due enquiry, it was the opinion of the board that the company’s shares qualified as an “excluded security” under the rules; the company, therefore, is excluded from the FCA’s restrictions that apply to non-mainstream pooled investments (NMPIs).
Given the regulatory restrictions on distributing research on this company, the monthly book entry for Volta Finance can be accessed through our website, Volta Finance Ltd Research. Our initiation report, published on 5 September 2018, can be found on the same site, as can our note, Investment opportunities at this point of the cycle (14 January 2019), the manager’s March 2019 and June 2019 presentations, our 7 October 2019 report, 9%+ yield in uncertain times, and our note, Follow the money, published on 3 February 2020, as well as links to our Directors Talk interviews on the company.
Financials
Source: Refinitiv
Market data EPIC/TKR VTA .NA,
VTA.LN, VTAS LN Price (€) 6.62/6.56/549p 12m High (€) 6.74/7.04/642p 12m Low (€) 6.04/6.14/515p Shares (m) 36.6 Mkt Cap (€m) 242 Trail. 12-mth. yield 9.4% Free Float 70% Market AEX, LSE
Description Volta Finance (Volta) is a closed-ended, limited liability investment company with a diversified investment strategy across structured finance assets (primarily CLOs). It aims to provide a stable stream of income through quarterly dividends.
Company information Independent Chairman
Paul Meader
Independent Non-Executive Directors
Graham Harrison Stephen Le Page
Atosa Moini Paul Varotsis
Fund Managers AXA IM Paris
Serge Demay A Martin-Min
François Touati Co. sec. /Administrator
BNP Paribas Securities
Services SCA, Guernsey Branch
BNP: +44 1481 750853 www.voltafinance.com
Key shareholders Axa Group 30.4%
Diary Mid-Mar Feb estimated NAV
Daily VTAS.L 03/09/2018 - 21/02/2020 (LON)Line, VTAS.L, Trade Price(Last), 26/02/2020, 540, -4, (-0.74%) Price
GBp
Auto
520
530
540
550
560
570
580
590
600
610
620
630
640
650
540
17 01 16 01 16 03 17 02 16 01 18 01 18 01 16 01 16 03 17 01 16 01 16 02 16 01 16 01 18 02 16 02 16 03 17Q3 18 Q4 2018 Q1 2019 Q2 2019 Q3 2019 Q4 2019 Q1 2020
Analyst Mark Thomas 020 7194 7622

The Monthly
March 2020 40
Notes

The Monthly
March 2020 41
Disclaimer Hardman & Co provides professional independent research services and all information used in the publication of this report has been compiled from publicly available sources that are believed to be reliable. However, no guarantee, warranty or representation, express or implied, can be given by Hardman & Co as to the accuracy, adequacy or completeness of the information contained in this research and they are not responsible for any errors or omissions or results obtained from use of such information. Neither Hardman & Co, nor any affiliates, officers, directors or employees accept any liability or responsibility in respect of the information which is subject to change without notice and may only be correct at the stated date of their issue, except in the case of gross negligence, fraud or wilful misconduct. In no event will Hardman & Co, its affiliates or any such parties be liable to you for any direct, special, indirect, consequential, incidental damages or any other damages of any kind even if Hardman & Co has been advised of the possibility thereof.
This research has been prepared purely for information purposes, and nothing in this report should be construed as an offer, or the solicitation of an offer, to buy or sell any security, product, service or investment. The research reflects the objective views of the analyst(s) named on the front page and does not constitute investment advice. However, the companies or legal entities covered in this research may pay us a fixed fee in order for this research to be made available. A full list of companies or legal entities that have paid us for coverage within the past 12 months can be viewed at http://www.hardmanandco.com/legals/research-disclosures. Hardman may provide other investment banking services to the companies or legal entities mentioned in this report.
Hardman & Co has a personal dealing policy which restricts staff and consultants’ dealing in shares, bonds or other related instruments of companies or legal entities which pay Hardman & Co for any services, including research. No Hardman & Co staff, consultants or officers are employed or engaged by the companies or legal entities covered by this document in any capacity other than through Hardman & Co.
Hardman & Co does not buy or sell shares, either for their own account or for other parties and neither do they undertake investment business. We may provide investment banking services to corporate clients. Hardman & Co does not make recommendations. Accordingly, they do not publish records of their past recommendations. Where a Fair Value price is given in a research note, such as a DCF or peer comparison, this is the theoretical result of a study of a range of possible outcomes, and not a forecast of a likely share price. Hardman & Co may publish further notes on these securities, companies and legal entities but has no scheduled commitment and may cease to follow these securities, companies and legal entities without notice.
The information provided in this document is not intended for distribution to, or use by, any person or entity in any jurisdiction or country where such distribution or use would be contrary to law or regulation or which would subject Hardman & Co or its affiliates to any registration requirement within such jurisdiction or country.
Some or all alternative investments may not be suitable for certain investors. Investments in small and mid-cap corporations and foreign entities are speculative and involve a high degree of risk. An investor could lose all or a substantial amount of his or her investment. Investments may be leveraged and performance may be volatile; they may have high fees and expenses that reduce returns. Securities or legal entities mentioned in this document may not be suitable or appropriate for all investors. Where this document refers to a particular tax treatment, the tax treatment will depend on each investor’s particular circumstances and may be subject to future change. Each investor’s particular needs, investment objectives and financial situation were not taken into account in the preparation of this document and the material contained herein. Each investor must make his or her own independent decisions and obtain their own independent advice regarding any information, projects, securities, tax treatment or financial instruments mentioned herein. The fact that Hardman & Co has made available through this document various information constitutes neither a recommendation to enter into a particular transaction nor a representation that any financial instrument is suitable or appropriate for you. Each investor should consider whether an investment strategy of the purchase or sale of any product or security is appropriate for them in the light of their investment needs, objectives and financial circumstances.
This document constitutes a ‘financial promotion’ for the purposes of section 21 Financial Services and Markets Act 2000 (United Kingdom) (‘FSMA’) and accordingly has been approved by Capital Markets Strategy Ltd which is authorised and regulated by the Financial Conduct Authority (FCA).
No part of this document may be reproduced, stored in a retrieval system or transmitted in any form or by any means, mechanical, photocopying, recording or otherwise, without prior permission from Hardman & Co. By accepting this document, the recipient agrees to be bound by the limitations set out in this notice. This notice shall be governed and construed in accordance with English law. Hardman Research Ltd, trading as Hardman & Co, is an appointed representative of Capital Markets Strategy Ltd and is authorised and regulated by the FCA under registration number 600843. Hardman Research Ltd is registered at Companies House with number 8256259.
(Disclaimer Version 8 – Effective from August 2018)
Status of Hardman & Co’s research under MiFID II Some professional investors, who are subject to the new MiFID II rules from 3rd January, may be unclear about the status of Hardman & Co research and, specifically, whether it can be accepted without a commercial arrangement. Hardman & Co’s research is paid for by the companies, legal entities and issuers about which we write and, as such, falls within the scope of ‘minor non-monetary benefits’, as defined in the Markets in Financial Instruments Directive II.
In particular, Article 12(3) of the Directive states: ‘The following benefits shall qualify as acceptable minor non-monetary benefits only if they are: (b) ‘written material from a third party that is commissioned and paid for by a corporate issuer or potential issuer to promote a new issuance by the company, or where the third party firm is contractually engaged and paid by the issuer to produce such material on an ongoing basis, provided that the relationship is clearly disclosed in the material and that the material is made available at the same time to any investment firms wishing to receive it or to the general public…’
The fact that Hardman & Co is commissioned to write the research is disclosed in the disclaimer, and the research is widely available.
The full detail is on page 26 of the full directive, which can be accessed here: http://ec.europa.eu/finance/docs/level-2-measures/mifid-delegated-regulation-2016-2031.pdf
In addition, it should be noted that MiFID II’s main aim is to ensure transparency in the relationship between fund managers and brokers/suppliers, and eliminate what is termed ‘inducement’, whereby free research is provided to fund managers to encourage them to deal with the broker. Hardman & Co is not inducing the reader of our research to trade through us, since we do not deal in any security or legal entity.
