the money generation model - nps history
TRANSCRIPT

THE MONEY GENERATION MODEL
OFFICE OF SOCIAL SCIENCE
SOCIO-ECONOMIC STUDIES DIVISION
DENVER, CO.
DECEMBER 1990

United States Department of the Interior
NATIONAL PARK SERVICE P.O. BOX 37127
WASHINGTON, D.C. 20013-7127
N4619
Memorandum
To: Park Superintendents
From: Assistant to the Director for Science and Technology, WASO
Subject: ECONOMIC BENEFITS OF PARKS ON LOCAL ECONOMIES
In my Superintendents Memo #17, dated 6/3/90, I indicated that Dr. Ken Hornback of the Denver Statistical Office had developed an economic model that could be used to estimate economic benefits of parks for local economies. This model was called the Money Generation Model, or MGM. The original Money Generation Model focused primarily on the economic benefits associated with park tourism expenditures. In the material that is attached, the MGM is expanded to include the economic effects of two additional types of expenditures, namely expenditures by the Federal Government for National Park Service salaries, park construction projects, and other park-related activities; and expenditures by other outside parties. such as state spending for park access roads, or dollars spent by outside interests for marinas, motels, restaurants, and other park-related capital development projects.
The Money Generation Model presented here enables a superintendent to estimate how tourism expenditures, Federal Government expenditures, and expenditures by other outside parties benefit three important components of the local area economy: (1) new sales. as measured by increased purchases of goods and services; (2) increased sales tax and income tax revenues; and (3) number of new jobs created.
Park managers will find that the Money Generation Model is easy to apply and produces quantifiable measures of park economic benefits that can be used for planning, concessions management, budget justifications, tourism marketing, assessing the contributions of parks to communities, justifying the upgrading of privately owned travel and tourism support facilities, etc. These all are important considerations in dealing with the many diverse publics with whom the NPS interacts on a continuing basis. However, four things need to be emphasized:
1. The Money Generation Model is designed to estimate economic benefits in the local area around the park; it is not designed to be used on a regional or statewide basis.
2. The Money Generation Model is driven by visitor and park expenditure data; it does not consider economic benefits such as enhanced real estate values, improved recreational and cultural opportunities for local residents, improved community services, etc., that derive from the park.
IN REPLY REFER TO:

3. A number of assumptions have been made about taxable income ratios, indirect sales multipliers, etc., in order to simplify the economic benefit calculations. Because the accuracy of the results depends on the quality of the input data, whenever possible, the user of the Money Generation Model should replace these assumed values by values that are representative of the local area being studied. Local Chambers of Commerce or state tourism offices often can be most helpful here should the park not elect to use average values.
4. It is emphasized that the Money Generation Model is intended to provide a fast and virtually zero cost estimate of the economic consequences of a park on the economy of the surrounding local area.
Those superintendents who have questions about the application of the model or the calculation procedures should contact the Denver Statistical Office. Similarly, those superintendents who require more accurate or more detailed data about park economic benefits should contact the Denver Statistical Office or ask the Regional Social Scientist to identify a university resource economist who can provide the needed assistance.
Richard H. Briceland
Attachment

THE MONEY GENERATION MODEL
Contents Page
INTRODUCTION AND DISCUSSION 1
I. THE ECONOMIC BENEFITS OF PARK TOURISM 2
A. SALES BENEFITS FROM TOURISM EXPENDITURES 2 B. TAX REVENUE BENEFITS FROM TOURISM EXPENDITURES 4 C . JOB BENEFITS FROM TOURISM EXPENDITURES 6
II. THE ECONOMIC BENEFITS OF PARK-RELATED FEDERAL GOVERNMENT EXPENDITURES 7
A. SALES BENEFITS FROM FEDERAL GOVERNMENT EXPENDITURES 7 B . TAX BENEFITS FROM FEDERAL GOVERNMENT EXPENDITURES 8 C . JOB BENEFITS FROM FEDERAL GOVERNMENT EXPENDITURES 8
III. THE ECONOMIC BENEFITS OF PARK-RELATED EXPENDITURES BY OTHER NON-LOCAL PARTIES 10
A. SALES BENEFITS FROM OTHER EXPENDITURES 10 B . TAX BENEFITS FROM OTHER EXPENDITURES 10 C . JOB BENEFITS FROM OTHER EXPENDITURES 11
SUMMARY 11
APPENDIX, AAA TRAVEL DATA 12
WORKSHEET CALCULATIONS 13
1. WORKSHEET #1: ECONOMIC BENEFITS RESULTING FROM PARK VISITOR EXPENDITURES 14
2. WORKSHEET #2: ECONOMIC BENEFITS RESULTING FROM FEDERAL GOVERNMENT EXPENDITURES FOR PARK-RELATED ACTIVITIES 15
3. WORKSHEET #3: ECONOMIC BENEFITS RESULTING FROM PARK-RELATED EXPENDITURES BY OTHER NON-LOCAL PARTIES 16
4. WORKSHEET #4: SUMMARY OF ECONOMIC BENEFITS ATTRIBUTABLE TO THE PARK 17
EXAMPLE A. A RURAL AREA NATIONAL PARK IN THE ROCKY MOUNTAIN REGION 18
EXAMPLE B. AN URBAN AREA NATIONAL HISTORIC SITE IN THE MIDWET REGION 22

THE MONEY GENERATION MODEL: INTRODUCTION AND DISCUSSION
The Money Generation Model (MGM) provides a way to estimate economic benefits of parks on gateway communities and adjacent local areas. The model provides for the following:
. . . First, a calculation of the economic benefits to the local area resulting from expenditures by park visitors who live outside the local area (non-local tourists).
. . . Second, a calculation of the economic benefits to the local area resulting from park-related Federal Government expenditures. (for example, NPS expenditures for park employee salaries, supplies, services, construction projects, etc.).
. . . Third, a calculation of the economic benefits to the local area resulting from park-related expenditures by other non-local parties, (for example, State expenditures for park access roads; or capital expenditures to build concessioner facilities, such as a new marina).
In other words, the Money Generation Model estimates the economic benefits to the local economy resulting from monies that come into the local economy from outside sources.
In applying the Money Generation Model, the following three types of economic benefits are considered: SALES BENEFITS; TAX REVENUE BENEFITS; AND JOB BENEFITS.
SALES BENEFITS consist of income to local area businesses or individuals for goods and services that these businesses or individuals provide as a result of expenditures by non-local park visitors, Federal Government expenditures, and park-related expenditures by other non-local parties such as State governments, concessioner capital expenditures, etc.
TAX BENEFITS consist of increases in local area tax revenues that result from expenditures by non-local park visitors, Federal Government expenditures, and park-related expenditures by other non-local parties.
JOB BENEFITS consist of the new jobs that are created in the local area as a result of expenditures by non-local park visitors, Federal Government expenditures, and park-related expenditures by other non-local parties.
The material that follows provides a step-by-step procedure for calculating the economic benefits of parks on the local economy. Section I deals with the economic benefits resulting from expenditures by non-local park visitors.
Section II deals with the economic benefits to the local area resulting from park-related Federal Government expenditures.
Section III deals with the economic benefits to the local area resulting from park-related expenditures by other non-local parties such as State governments or outside developers.
1

A set of Standardized Worksheets is attached at the end of the report to facilitate carrying out the economic benefit calculations. Two examples showing completed sets of worksheets also are included, one set for a rural area national park in the Rocky Mountain Region, and one set for an urban area national historic site in the Midwest Region.
Finally, it is noted that, in most cases, year-to-year expenditures by park visitors will be considerably greater than park-related expenditures by the Federal Government or by other outside parties. Therefore, a preliminary estimate of the economic benefit of the park in the local area economy frequently may be calculated by considering only monies spent by non-local tourists, and by ignoring, at least initially, monies spent in the local area by the Federal Government, or by other outside interests. Such a preliminary estimate will involve only SECTION I: THE ECONOMIC BENEFITS OF PARK TOURISM, and WORKSHEET #1: ECONOMIC BENEFITS RESULTING FROM PARK VISITOR EXPENDITURES. The economic contributions to the local area economy that are attributable to expenditures by the Federal Government or to expenditures by other outside parties can be calculated later utilizing the step-by-step procedures outlined in SECTIONS II and III respectively.
As you proceed to apply the Money Generation Model, two points are noted: First, the MGM is applicable to local areas near the park. The MGM cannot be used for large areas such as Statewide areas without considering very carefully additional factors such as travel time and enroute expenditures.
Secondly, as you use the Money Generation Model, you will be asked to make assumptions about certain economic functions such as tax rates or levels of indirect sales, which will be explained later. If you are uncertain as to what number to select, or if you feel that the average number suggested in the step-by-step calculation process may not be applicable for your park, you may find it helpful to choose reasonably high and low values, and then calculate a range for the variable in question.
2

I. THE ECONOMIC BENEFITS OF PARK TOURISM
A. SALES BENEFITS RESULTING FROM TOURISM EXPENDITURES.
Sales benefits are calculated in two stages. First, DIRECT SALES are calculated. Second, TOTAL SALES are calculated by adding INDIRECT AND INDUCED SALES to DIRECT SALES.
DIRECT SALES include visitor expenditures for accommodations, food, transportation, recreation services, and any other expenditures made in conjunction with a park visit. This is the general formula:
(1) (2) (3) Estimated Annual Average daily
DIRECT SALES = NONLOCAL X RECREATION X EXPENDITURES (4) PERCENT VISITOR DAY per person
of park use volume
1. Estimate the NONLOCAL PERCENT of park use. The DIRECT SALES calculated is based only on spending by nonlocal park users rather than spending by people who live around the park. The park attracts nonlocal people to the area, and their spending is income for local businesses that supply a wide variety of goods and services. The "nonlocal" area may vary depending on the intended audience, but is must be clearly defined. For example, one might choose an area based on political boundaries such as townships or counties. Time and/or distance zones may be used, e.g., "nonlocal" may be defined as a one-hour drive or 50 miles from the park.
The local Chamber of Commerce, travel and tourism agencies, or other large businesses can help define the nonlocal area. With the nonlocal area in mind, the percentage of park recreational visitation from that area is estimated or measured. The basis for measurement may be a license plate observation survey if plates are coded by county of residence. Nonlocal residence data often are collected as part of visitor interview surveys conducted for verification of visitor statistics or other purposes. Local travel and tourism groups also may have information about nonlocal visitation within an area.
2. Look up the annual volume of RECREATION VISITOR DAYS. RECREATION VISITOR DAYS are reported monthly by all parks, and the annual figures are published in the latest National Park Statistical Abstract. Bear in mind the conservative nature of this procedure. The visitor day represents time visitors spend in the park rather than the total time they spend in the local area during their visit to the park.
3. Estimate the average daily dollar EXPENDITURES per person. Actual expenditures usually come from visitor surveys. In the absence of a recent visitor survey, American Automobile Association cost estimates can be used (see the Appendix for lodging and meal averages per person by state) . In addition to lodging and meal costs, visitors spend money on a variety of things such as local driving while visiting the park and miscellaneous items, e.g., clothes, admissions and tolls, snacks, souvenirs, gifts, film, bug spray, sun screen, etc. If the park is high in recreation participation (birding, biking, camping, climbing, fishing, hiking, kayaking, rafting, etc.), associated rentals or retail
3

sales would seem an appropriate addition. Frequently, Chambers of Commerce or state business and tourism groups have compiled relevant expenditure data. If other sources are used, be careful that the information used is reduced to a per person rather than a group figure.
4. Calculate the DIRECT SALES by multiplying the estimated NONLOCAL PERCENT by the RECREATION VISITOR DAYS and average daily dollar EXPENDITURES. The DIRECT SALES figure will be used again in the next step.
Up to this point we have accounted for the direct benefits of the park visitor who gives money to the clerk, waiter, guide, etc., who then turn it over to the business owner. These moneys then circulate within the local economy. Business owners use tourism money to pay utility bills, employee wages, bills of suppliers, leases of equipment, space rental, and other costs of doing business necessary to support park visitors. These dollar exchanges are called INDIRECT AND INDUCED SALES. When INDIRECT AND INDUCED SALES are added to DIRECT SALES they produce TOTAL SALES which account for the entire sales benefits of park tourism. This is the general formula:
TOTAL SALES (4) (5) BENEFITS - DIRECT SALES X INDIRECT & INDUCED SALES MULTIPLIER FROM PARK TOURISM (Range is 1.2 - 2.8, AVG. =2.0)
(6)
5. Estimate the multiplier for INDIRECT AND INDUCED sales. The INDIRECT AND INDUCED SALES multiplier varies with the complexity of the local economy. Smaller and more isolated areas, generally, have lower multipliers because support spending for goods and services usually will be made outside the local trading area, e.g., vendors and suppliers will be nonlocals. The more diverse the activities for visitors and the greater their volume, generally, the higher the multiplier since more people and businesses will be involved. Because of such involvement, people who work in supporting businesses will tend to live locally, making the gateway population a good indicator of how big or small the multiplier will be. The INDIRECT AND INDUCED multiplier ranges from 1.2 to 2.8 and averages 2.0.
6. Calculate the TOTAL SALES by multiplying DIRECT SALES by the INDIRECT AND INDUCED SALES Multiplier. The TOTAL SALES figure is the direct, indirect and induced economic benefits of park tourism.
B. TAX BENEFITS RESULTING FROM TOURISM EXPENDITURES.
TAX BENEFITS refer to the additional local tax revenues that result from dollars that flow into the local economy from outside sources because of the park, i.e., taxes that are attributable to expenditures by nonlocal park visitors. The MGM considers only two of a variety of tax benefits of parks, namely, increased sales tax revenues and increased income tax revenues.
INCREASED (1) (2) SALES TAX TOTAL COMBINED STATE & LOCAL REVENUES - SALES X SALES TAX RATE
(3)
4

1. Enter TOTAL SALES. Use the figure for TOTAL SALES calculated in A. 6 (above).
2. Enter the COMBINED STATE AND LOCAL RETAIL SALES TAX RATE,
3. Calculate the INCREASED SALES TAX REVENUES by multiplying TOTAL SALES times the COMBINED STATE & LOCAL SALES TAX RATE.
INCREASED (4) (5) (6) INCOME TAX = TOTAL X TAXABLE INCOME X COMBINED REVENUES SALES RATIO STATE & LOCAL
(7) (Range is .2-.6, INCOME TAX RATE avg. - .3)
4. Enter TOTAL SALES. Use the figure for TOTAL SALES calculated in A.6 (above).
5. Estimate the TAXABLE INCOME RATIO. The TAXABLE INCOME RATIO is the taxable portion of salaries and business profits. Studies indicate this multiplier has a range of .2 to .6, and averages .3.
6. Enter the COMBINED STATE AND LOCAL INCOME TAX RATE. This can be estimated by looking at your own income tax forms or by checking with local officials.
7. Calculate the INCREASED INCOME TAX REVENUES by multiplying the TOTAL SALES times the TAXABLE INCOME RATIO and the combined STATE AND LOCAL INCOME TAX RATE.
TAX (3) (7) BENEFITS - INCREASED + INCREASED FROM PARK SALES TAX INCOME TAX TOURISM REVENUES REVENUES
(8)
8. Calculate the TAX BENEFITS by adding INCREASED SALES TAX REVENUES (step 3) and INCREASED INCOME TAX REVENUES (step 7).
Additional considerations on tax benefits. Additional tax benefits exist and may be considered. Many areas, for example, have special use taxes that apply to services for accommodations, food and beverages, and certain retail sales. Boat and fishing license fees are taxes. Additional taxes may be applied to marine fuel and sales from certain kinds of establishments such as marinas. In addition, real estate values are usually higher for property near parks and property owners pay correspondingly higher taxes. This model does not consider local taxation in such detail. If studies or expertise are available and these factors are known, they may be added to the calculations made here.
NOTE: It is recognized that all state taxes are not necessarily returned to the local area where they are collected sometimes more and sometimes less state tax monies make their way back to the paying jurisdiction. However, when averaged over time, it is estimated here that an area collecting state taxes receives a level of benefits from the state equivalent to the amount of taxes paid to the state, be they either state sales tax revenues or state income tax revenues.
C. JOB BENEFITS RESULTING FROM TOURISM EXPENDITURES. The job benefits are the number of jobs created in the local area as a result of park visitation and
5

tourism expenditures. Jobs created from tourism can be estimated by the formula:
JOB BENEFITS (1) (2) FROM PARK TOTAL JOBS PER MILLION TOURISM = SALES DOLLARS
(3) (millions) (10-50, avg. = 30)
1. Enter TOTAL SALES. Use the figure for TOTAL SALES calculated in A. 6 (above). This time, express the number in millions, e.g., if the number is $5,300,000, it would be entered as 5.3.
2. Estimate JOBS PER MILLION DOLLARS. Studies indicate jobs vary with the volume of sales. For the tourism industry the number of jobs has been found to range from 10 to 50 with an average of 30 jobs created per million dollars in TOTAL SALES. Rural towns tend to have a larger number of jobs created per million dollars of sales than do larger cities where sales per employee tend to be higher.
3. Calculate the JOB BENEFITS OF PARK TOURISM by multiplying TOTAL SALES times the JOBS PER MILLION DOLLARS.
This completes the estimation of economic benefits in the local area resulting from expenditure by non-local park visitors. The next phase of the process is to determine the economic benefits to the local area that are attributable to park-related Federal Government expenditures.
6

II. THE ECONOMIC BENEFITS OF PARK-RELATED FEDERAL GOVERNMENT EXPENDITURES
Direct Federal Government spending on salaries, equipment, utilities, supplies, and contracts by the park also creates local community benefits in the form of additional sales, tax revenues, and jobs. Moreover, the tangible benefits of park spending occur year-round and, therefore, make a steady contribution compared to seasonal tourism. Park spending also involves people and businesses that otherwise might not benefit from tourism, e.g., office product sales, dry cleaners, landscape, construction, and maintenance contractors.
Although direct park purchases for supplies and equipment, for example, often are exempt from most sales taxes, parks may make a variety of indirect contributions to local governments. Some parks make direct contributions to local governments in the form of payments in lieu of taxes which are intended to offset the effects of services needed by the traveling public or by park employees and provided by local government, but which are difficult to support from the existing tax base. In several cases, NPS employees residing on Federal property are subject to special taxes in lieu of property taxes.
"Payments in kind" should not be forgotten when adding up economic contributions. Many parks engage in some form of informal cooperative agreements with local communities which may include public protection and fire fighting, road patrol, highway maintenance, shared use of facilities, including interpretive services, etc.
The variations of what and how such taxes are levied and the resultant benefits to parks cannot be neatly described in a general formula. They may be significant, however, and worth adding to the basic direct expenditures.
NOTE. Concession operating expenditures for salaries, utilities, local supplies, etc., are derived from park visitor spending and are part of the internal circulation of monies within the local trading area. As such, they are accounted for in the MGM as part of INDIRECT AND INDUCED SALES which have already been accounted for in Section I. Do not include concession expenditures as Federal Government Expenditures. Similarly, do not include the economic activities under license by the park, or cooperating association activity as park spending.
A. SALES BENEFITS RESULTING FROM FEDERAL GOVERNMENT EXPENDITURES.
1. DIRECT SALES are equal to the total amount of park-related Federal Government dollars that flow into the local area as expenditures for park employee salaries, construction projects, planning projects, fire suppression activities, locally purchased supplies and equipment, etc.
2. Estimate the multiplier for INDIRECT AND INDUCED sales. Park expenditures may concentrate more on the local community, which means that the INDIRECT AND INDUCED SALES multiplier may be higher than was estimated for tourism spending.
3. The TOTAL SALES BENEFITS FROM FEDERAL GOVERNMENT EXPENDITURES are calculated as in Step I.A.6 for the case of tourism expenditures.
7

TOTAL SALES BENEFITS FROM FEDERAL GOVERNMENT = EXPENDITURES
(3)
(1) DIRECT SALES FROM FED. GOVT EXPENDITURES
(2) INDIRECT & INDUCED SALES MULTIPLIER (1.2 - 2.8; Avg. - 2.0)
B. TAX BENEFITS RESULTING FROM PARK-RELATED FEDERAL GOVERNMENT EXPENDITURES. It was noted in the earlier comments that calculation of the increased tax revenues attributable to Federal expenditures can be complex, depending on local conditions. As an estimate, however, tax revenue benefits to the local area resulting from park expenditures can be calculated by following exactly the same steps used in Section I.B. for tourism expenditures, but substituting TOTAL SALES BENEFITS FROM FEDERAL GOVERNMENT EXPENDITURES (see II.A.3. above) in place of TOTAL SALES BENEFITS FROM TOURISM EXPENDITURES.
INCREASED SALES TAX REVENUES
(3)
INCREASED INCOME TAX REVENUES
(7)
(1) - TOTAL SALES
FROM FED GOVT EXPENDITURES (from II.A.3)
(4) = TOTAL SALES
FROM FED GOVT EXPENDITURES (from II.A.3)
X
(2) COMBINED STATE & LOCAL SALES TAX RATE (same as I.B.2)
(5) TAXABLE X INCOME RATIO (0.2 - 0.6; avg. 0.3; same as I.B.5)
(6) COMBINED STATE & LOCAL INCOME TAX (same as I.B.6)
TAX BENEFITS FROM FED GOVT EXPENDITURES
(8)
(3) = INCREASED
SALES TAX REVENUES
(7) INCREASED INCOME & TAX REVENUES
C. JOB BENEFITS RESULTING FROM FEDERAL GOVERNMENT EXPENDITURES,
The increased employment opportunities in the local area resulting from Federal Government expenditures are calculated the same as for tourism expenditures in paragraph I.C.3, except that TOTAL SALES FROM FED. GOVT EXPENDITURES are used in place of TOTAL SALES FROM PARK TOURISM:
JOB BENEFITS FROM FED. GOVT. EXPENDITURES
(3)
(1) TOTAL SALES FROM FED. GOVT. EXPENDITURES (from II.A.3, in millions)
(2) X JOBS PER MILLION
DOLLARS (10 - 50; Avg - 30) (same as I.C.2)
This completes the estimation of economic benefits in the local area that result from Federal Government expenditures for park-related activities. The next phase of the process is to determine the economic benefits to the local area that are attributable to expenditures by other outside parties such as State Government, concessioner capital improvement expenditures funded by non-local interests, or
X
X
+
8

major development expenditures stimulated by the park and funded by non-local entities.
9
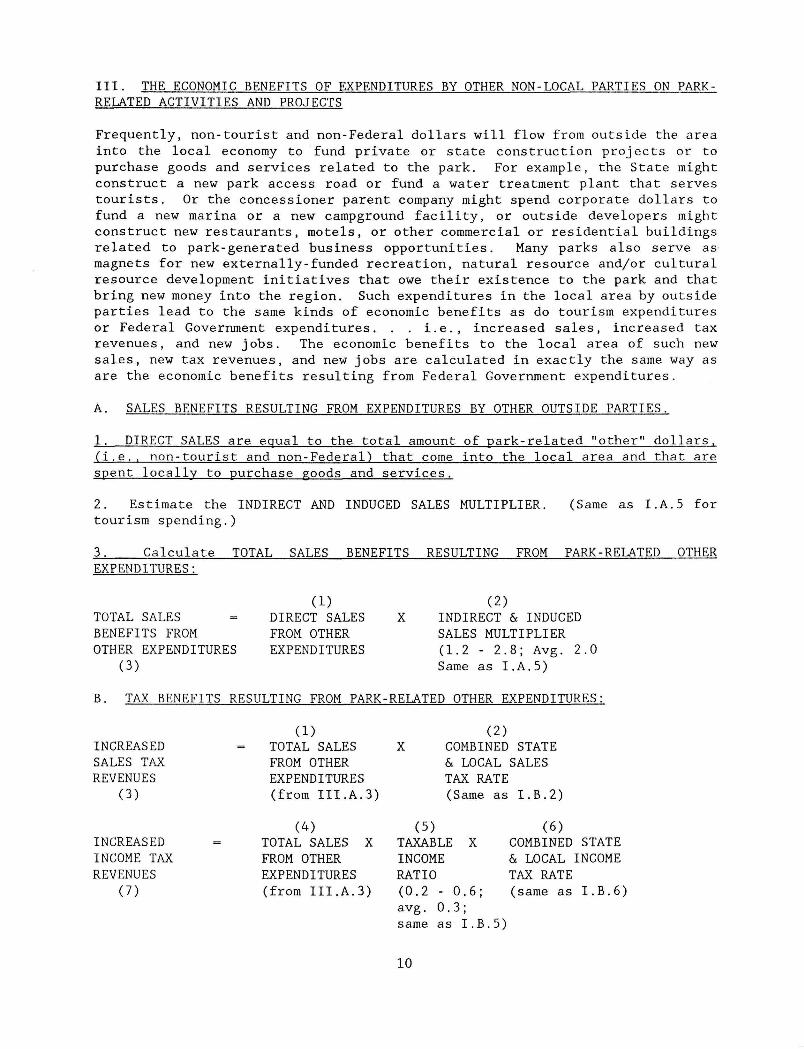
III. THE ECONOMIC BENEFITS OF EXPENDITURES BY OTHER NON-LOCAL PARTIES ON PARK-RELATED ACTIVITIES AND PROJECTS
Frequently, non-tourist and non-Federal dollars will flow from outside the area into the local economy to fund private or state construction projects or to purchase goods and services related to the park. For example, the State might construct a new park access road or fund a water treatment plant that serves tourists. Or the concessioner parent company might spend corporate dollars to fund a new marina or a new campground facility, or outside developers might construct new restaurants, motels, or other commercial or residential buildings related to park-generated business opportunities. Many parks also serve as magnets for new externally-funded recreation, natural resource and/or cultural resource development initiatives that owe their existence to the park and that bring new money into the region. Such expenditures in the local area by outside parties lead to the same kinds of economic benefits as do tourism expenditures or Federal Government expenditures. . . i.e., increased sales, increased tax revenues, and new jobs. The economic benefits to the local area of such new sales, new tax revenues, and new jobs are calculated in exactly the same way as are the economic benefits resulting from Federal Government expenditures.
A. SALES BENEFITS RESULTING FROM EXPENDITURES BY OTHER OUTSIDE PARTIES.
1. DIRECT SALES are equal to the total amount of park-related "other" dollars, (i.e., non-tourist and non-Federal) that come into the local area and that are spent locally to purchase goods and services.
2. Estimate the INDIRECT AND INDUCED SALES MULTIPLIER. (Same as I.A.5 for tourism spending.)
3. Calculate TOTAL SALES BENEFITS RESULTING FROM PARK-RELATED OTHER EXPENDITURES:
TOTAL SALES BENEFITS FROM OTHER EXPENDITURES
(3)
(1) DIRECT SALES FROM OTHER EXPENDITURES
(2) X INDIRECT & INDUCED
SALES MULTIPLIER (1.2 - 2.8; Avg. 2.0 Same as I.A.5)
B. TAX BENEFITS RESULTING FROM PARK-RELATED OTHER EXPENDITURES:
INCREASED SALES TAX REVENUES
(3)
(1) TOTAL SALES FROM OTHER EXPENDITURES (from III.A.3)
(2) X COMBINED STATE
& LOCAL SALES TAX RATE (Same as I.B.2)
INCREASED INCOME TAX REVENUES
(7)
(4) TOTAL SALES X FROM OTHER EXPENDITURES (from III.A.3)
(5) TAXABLE X INCOME RATIO (0.2 - 0.6; avg. 0.3; same as I.B.5)
(6) COMBINED STATE 6c LOCAL INCOME TAX RATE (same as I.B.6)
10

TAX BENEFITS FROM OTHER EXPENDITURES
(8)
(3) INCREASED SALES TAX REVENUES
(7) INCREASED SALES TAX REVENUES
C. JOB BENEFITS RESULTING FROM OTHER OUTSIDE EXPENDITURES:
JOB BENEFITS FROM OTHER OUTSIDE EXPENDITURES
(3)
(1) TOTAL SALES FROM OTHER EXPENDITURES (from III. A.3 in millions)
(2) JOBS PER MILLION DOLLARS (10 - 50; avg.=30) (Same as I.C.2)
SUMMARY: This completes description of the Money Generation Model. The total amount of NEW SALES (or purchases of goods and services) in the local area attributable to the park is calculated by adding the contributions associated with (1) tourist expenditures, (2) park-related Federal Government expenditures, and (3) other park-related outside expenditures. The increase in LOCAL TAX REVENUES and the number of NEW JOBS created locally are calculated in similar fashion.
11
+
X

Appendix: AAA Average Daily Travel Expenses (Per Person)
STATE L
Alabama Alaska Arizona Arkansas California
Colorado Connecticut Delaware Florida Georgia
Hawaii Idaho Illinois Indiana Iowa
Kansas Kentucky Louisiana Maine Maryland
Massachusetts Michigan Minnesota Mississippi Missouri
USA
•edging
25.83 53.76 42.51 24.68 42.14
43.48 43.21 38.40 43.93 29.34
82.71 25.67 35.50 26.24 23.81
20.83 24.44 33.55 41.09 40.95
48.70 31.53 29.28 26.14 27.53
35.21
Meals
21.51 21.98 23.26 17.92 26.33
22.99 28.92 26.78 30.08 22.89
27.90 18.19 24.57 20.09 18.82
17.66 20.99 28.54 21.07 25.28
27.43 20.35 19.52 21.88 19.97
23.25
Total
47.34 75.74 65.77 42.60 68.47
66.47 72.13 65.18 74.01 52.23
100.61 43.86 60.07 46.33 42.63
38.49 45.43 62.09 62.16 66.23
76.13 51.88 48.80 48.02 47.50
58.46
Montana Nebraska Nevada New Hampshire New Jersey
New Mexico New York North Carolina North Dakota Ohio
Oklahoma Oregon Pennsylvania Rhode Island South Carolina
South Dakota Tennessee Texas Utah Vermont
Virginia Washington West Virginia Wisconsin Wyoming
Wash., D.C.
Lodging
24.20 21.10 31.29 41.30 50.03
27.79 47.64 29.68 20.03 29.03
22.70 31.39 35.01 46.70 30.71
23.38 26.98 30.86 28.89 48.17
32.19 30.04 26.54 29.47 26.90
59.44
Meals
16.03 17.05 25.25 22.19 29.28
20.20 34.01 19.77 16.88 19.48
19.12 22.62 22.78 26.47 22.06
16.62 19.91 23.19 20.34 22.71
21.69 21.16 18.49 20.85 18.98
30.08
Total
40.23 38.15 56.54 63.49 79.31
47.99 81.65 49.45 36.91 48.51
41.82 54.01 57.79 73.17 52.77
40.00 46.89 54.05 49.23 70.88
53.88 51.20 45.03 50.32 45.88
89.52
Adapted from AAA press release, "Family Auto Vacation Costs Rise $6 to $198 Daily", dated 6/5/1990.
12

WORKSHEET CALCULATIONS
A worksheet format is included in the following pages to provide a simple, step-by-step calculation procedure for estimating how the park contributes to the local economy in the three areas discussed above: SALES BENEFITS as measured by increased purchases of goods and services in the local area; TAX BENEFITS as measured by increased tax revenues; and JOB BENEFITS as measured by the number of new jobs created locally.
Four separate worksheets are provided:
WORKSHEET #1 is for calculating the benefits to the local economy associated with monies spent by park visitors who come from outside the local area.
WORKSHEET #2 is for calculating the benefits to the local economy attributable to monies spent by the Federal Government on park-related activities.
WORKSHEET #3 is for calculating the benefits to the local economy resulting from monies spent on park-related projects by other non-local parties, such as the State, concessioner parent corporations, or outside developers.
WORKSHEET #4 is for looking at the combined effects of TOURISM EXPENDITURES, FEDERAL GOVERNMENT EXPENDITURES, and EXPENDITURES BY OTHER NON-LOCAL PARTIES, and seeing how these combined expenditures benefit the local area economy in terms of increased sales of goods and services, increased local tax revenues, and increased new jobs created locally.
13

WORKSHEET #1 ECONOMIC BENEFITS RESULTING FROM PARK VISITOR EXPENDITURES
A. SALES BENEFITS FROM TOURISM: Dollar value of goods and services purchased in the local area.
1. Enter the estimated NON-LOCAL PERCENT of park use.
2. Look up the annual RECREATION VISITOR-DAY volume. (From annual NPS Statistical Abstract)
3. Enter the average daily EXPENDITURES PER PERSON. (May use AAA data from Appendix A if other information is not available)
4. Calculate DIRECT SALES. (1) x (2) x (3)
5. Enter the estimated INDIRECT & INDUCED SALES MULTIPLIER.
(Range is 1.2 - 2.8; avg - 2.0)
6. Calculate TOTAL SALES BENEFITS FROM TOURISM. (4) x (5)
B. TAX REVENUE BENEFITS FROM TOURISM
1. Enter TOTAL SALES from A.6 above.
2. Enter COMBINED STATE & LOCAL RETAIL SALES TAX RATE.
3. Calculate INCREASED SALES TAX REVENUES. (1) x (2)
4. Enter TOTAL SALES from A.6 above.
5. Enter the TAXABLE INCOME RATIO (i.e., taxable portion of salaries & business profits: range is 0.2 - 0.6; avg. =0.3)
6. Enter the COMBINED STATE & LOCAL INCOME TAX RATE.
7. Calculate INCREASED INCOME TAX REVENUE. (4) X (5) X (6)
8. TAX REVENUE BENEFITS from tourism. Add (3) + (7)
C. JOB BENEFITS FROM TOURISM
1. Enter TOTAL SALES from A.6, expressed in millions of
dollars. ($5,600,000 of total sales - $5.6)
2. Estimate multiplier for JOBS CREATED PER MILLION DOLLARS of total sales. (Range is 10 - 50; avg. = 30)
3. Calculate new JOBS CREATED by tourism. (1) x (2)
14

WORKSHEET #2 ECONOMIC BENEFITS RESULTING FROM FEDERAL GOVERNMENT EXPENDITURES FOR PARK RELATED ACTIVITIES
A. SALES BENEFITS FROM FED. GOVT. EXPENDITURES: Dollar value of goods & services purchased in local area by Fed. Govt, spending.
1. DIRECT SALES equal to total amount of park-related Fed. Govt. expenditures that are spent in the local area.
2. Estimated INDIRECT & INDUCED SALES MULTIPLIER. (May be higher than number used in Step A.5 in the tourism Worksheet #1. Range is 1.2 - 2.8; avg. =2.0)
3. Calculate TOTAL SALES BENEFITS from federal government expenditures. (1) x (2)
B. TAX REVENUE BENEFITS FROM FED. GOVT. EXPENDITURES: The following steps are discussed in text Section I. B.
1. Enter TOTAL SALES BENEFITS (Fed. Govt) from A.3 above.
2. Enter COMBINED STATE & LOCAL RETAIL SALES TAX RATE. (Same as B.2 for Tourism from Worksheet #1)
3. Calculate INCREASED SALES TAX REVENUES. (1) X (2)
4. Enter TOTAL SALES BENEFITS (Fed. Govt) from A.3 above.
5. Enter the TAXABLE INCOME RATIO (i.e., taxable portion of salaries & business profits: range is 0.2-0.6; avg.=0.3).
6. Enter the COMBINED STATE & LOCAL INCOME TAX RATE. (Same as B.6 from Worksheet #1)
7. Calculate INCREASED INCOME TAX REVENUE. (4) X (5) X (6)
8. TAX REVENUE BENEFITS from Fed. Govt, expenditures. Add (3) + (7)
C. JOB BENEFITS FROM FED. GOVT. EXPENDITURES
1. Enter the TOTAL SALES (Fed. Govt.) from A.3, above, expressed in millions ($5,600,000 = $5.6).
2. Estimate the multiplier for new JOBS CREATED PER MILLION DOLLARS OF total sales. (Same as C.2 from Worksheet #!)_
3. Calculate the new JOBS CREATED by Fed. Govt, expenditures. (1) x (2) _
15

WORKSHEET #3 ECONOMIC BENEFITS RESULTING FROM PARK-RELATED EXPENDITURES BY OTHER NON-LOCAL PARTIES
A. SALES BENEFITS FROM 'OTHER' EXPENDITURES
1. Enter DIRECT SALES which are expenditures by non-local parties to purchase goods & services connected with park related activities, such as construction of State access roads to the park, motel chain construction projects, concessioner capital improvements, etc.; does not include tourism expenditures or Fed. Govt, expenditures.
2. Enter the estimated INDIRECT & INDUCED SALES MULTIPLIER. (Same as A.5 from Tourism Worksheet #1)
3. Calculate the TOTAL SALES BENEFITS from expenditures by "other" non-local parties. (1) x (2)
B. TAX REVENUE BENEFITS FROM 'OTHER' EXPENDITURES The following steps are discussed in text Section I. B.
1. Enter TOTAL SALES ("Other" non-local) from A.3 above.
2. Enter COMBINED STATE & LOCAL RETAIL SALES TAX RATE. (Same as B.2 from Tourism Worksheet #1)
3. Calculate the INCREASED SALES TAX REVENUES. (1) x (2)
4. Enter TOTAL SALES BENEFITS ('other') from A.3 above.
5. Enter the TAXABLE INCOME RATIO. (Same as B.5 from Worksheet #1)
6. Enter the COMBINED STATE & LOCAL INCOME TAX RATE. (Same as B.6 from Worksheet #1)
7. Calculate INCREASED INCOME TAX REVENUE. (4) X (5) X (6)
8. TAX REVENUE BENEFITS from expenditures by "other" non-local parties. Add (3) + (7)
C. JOB BENEFITS FROM "OTHER" EXPENDITURES
1. Enter TOTAL SALES ("Other" non-local) from A.3 above expressed in millions ($5,600,000 = $5.6).
2. Estimate the multiplier for new JOBS CREATED PER MILLION DOLLARS of total sales. (Same as C. 2 from Worksheet #1)_
3. Calculate the new JOBS CREATED by expenditure of "Other" non-local parties. (1) x (2)
16

WORKSHEET #4 SUMMARY OF ECONOMIC BENEFITS ATTRIBUTABLE TO THE PARK FROM THE COMBINED EFFECTS OF VISITOR EXPENDITURES. FEDERAL GOVERNMENT EXPENDITURES, AND OTHER NON-FOCAL PARTIES' EXPENDITURES
A. COMBINED SALES BENEFITS
Worksheet #1, Item A.6, plus Worksheet #2, Item A.3, plus Worksheet #3, Item A.3 equals:
B. COMBINED INCREASED TAX REVENUE BENEFITS Worksheet #1, Item B. 8, plus Worksheet #2, Item B. 8, plus Worksheet #3, Item B. 8 equals:
C. COMBINED NEW JOBS CREATED Worksheet #1, Item C. 3, plus Worksheet #2, Item C. 3, plus Worksheet #3, Item C. 3 equals:
17

EXAMPLE A. A RURAL AREA NATIONAL PARK IN THE ROCKY MOUNTAIN REGION
WORKSHEET #1 ECONOMIC BENEFITS RESULTING FROM PARK VISITOR EXPENDITURES
A. SALES BENEFITS FROM TOURISM: Dollar value of goods and services purchased in the local area.
1. Enter the estimated NON-LOCAL PERCENT of park use. »•/ (^0 A J
2. Look up the annual RECREATION VISITOR-DAY volume. , ur-r, (From annual NPS Statistical Abstract) fjJj^jfJOQ
3. Enter the average daily EXPENDITURES PER PERSON. (May use AAA data from Appendix A if other <$ / / U "7 information is not available) JL~-tl-L (
4. Calculate DIRECT SALES. (1) x (2) x (3) $ 1^)L^2G) 7J1
5. Enter the estimated INDIRECT & INDUCED SALES MULTIPLIER. -> Q (Range is 1.2 - 2.8; avg - 2.0) * *
6. Calculate TOTAL SALES BENEFITS FROM TOURISM. (4) x ( 5 ) ^ l » , ? " '_? '
B. TAX REVENUE BENEFITS FROM TOURISM
1. Enter TOTAL SALES from A. 6 above. $ L^ZZ^Z
2. Enter COMBINED STATE & LOCAL RETAIL SALES TAX RATE. > £ '
3. Calculate INCREASED SALES TAX REVENUES. (1) x (2) P^ >'''} ' ' /
4. Enter TOTAL SALES from A. 6 above. % L~Az£Jiju!
5. Enter the TAXABLE INCOME RATIO (i.e., taxable portion of salaries & business profits: range is 0.2 - 0.6; Z~2 avg. - 0.3) '
n 6. Enter the COMBINED STATE & LOCAL INCOME TAX RATE. '
7. Calculate INCREASED INCOME TAX REVENUES. (4) X (5) X (6Y* > '<*>, t
8. TAX REVENUE BENEFITS from tourism. Add (3) + (7) $ ^) 0 ' * t ^ 2.
C. JOB BENEFITS FROM TOURISM 1. Enter TOTAL SALES from A.6, expressed in millions of Cf / ^
dollars. ($5,600,000 of total sales - $5.6) 1_1 2. Estimate multiplier for JOBS CREATED PER MILLION DOLLARS o ^
of total sales. (Range is 10 - 50; avg. - 30) ^
?°]0'7 3. Ca lcu la te new JOBS CREATED by tourism. (1) x (2) t.^ ' /
18

19
EXAMPLE A. A RURAL AREA NATIONAL PARK IN THE ROCKY MOUNTAIN REGION
WORKSHEET #2 ECONOMIC BENEFITS RESULTING FROM FEDERAL GOVERNMENT EXPENDITURES FOR PARK RELATED ACTIVITIES
A. SALES BENEFITS FROM FED. GOVT. EXPENDITURES: Dollar value of goods & services purchased in local area by Fed. Govt, spending.
1. DIRECT SALES equal to total amount of park related Fed. Govt, expenditures that are spent in the local area. jf 7 ^ , Z-
2. Estimated INDIRECT & INDUCED SALES MULTIPLIER. (May be higher than number used in Step A.5 in the tourism y Q Worksheet #1. Range is 1.2 - 2.8; avg. - 2.0) '__
3. Calculate TOTAL SALES BENEFITS from federal J - -ye . „,,, government expenditures. (1) x (2) <-P O^ g, ^-
B. TAX REVENUE BENEFITS FROM FED. GOVT. EXPENDITURES: The following steps are discussed in text Section I. B.
1. Enter TOTAL SALES BENEFITS (Fed. Govt) from A. 3 above. ^ Ju °, _ "''
2. Enter COMBINED STATE 6. LOCAL RETAIL SALES TAX RATE. Q y (Same as B.2 for Tourism from Worksheet #1) [
3. Calculate INCREASED SALES TAX REVENUES. (1) X (2) *f ̂ " j , ± ~ L'
4. Enter TOTAL SALES BENEFITS (Fed. Govt) from A.3 above . j P j Z z J t i J . J
5. Enter the TAXABLE INCOME RATIO (i.e., taxable portion _. of salaries & business profits: range is 0.2-0.6; ,c---^ avg. - 0.3). '
6. Enter the COMBINED STATE & LOCAL INCOME TAX RATE. / "7 (Same as B.6 from Worksheet #1) '
$ ?<*/ 5ft 1. Calculate INCREASED INCOME TAX REVENUE. (4) X (5) X (6) ;£_ )
8. TAX REVENUE BENEFITS from Fed. Govt, expenditures. /t ayy i cr r Add (3) + (7) LZM—
C. JOB BENEFITS FROM FED. GOVT. EXPENDITURES
1. Enter the TOTAL SALES (Fed. Govt.) from A.3, above, 7? C~ expressed in millions ($5,600,000 - $5.6). _ _
2. Estimate the multiplier for new JOBS CREATED PER MILLION ^ Q DOLLARS OF total sales. (Same as C.2 from Worksheet #1)
3. Calculate the new JOBS CREATED by Fed. Govt, expenditures, y CTtr— (1) x (2) £ J J

20
EXAMPLE A. A RURAL AREA NATIONAL PARK IN THE ROCKY MOUNTAIN REGION
WORKSHEET #3 ECONOMIC BENEFITS RESULTING FROM PARK-RELATED EXPENDITURES BY OTHER NON-LOCAL PARTIES
A. SALES BENEFITS FROM 'OTHER' EXPENDITURES
1. Enter DIRECT SALES which are expenditures by non-local parties to purchase goods & services connected with park related activities, such as construction of State access roads to the park, motel chain construction projects, concessioner capital improvements, etc.; does not include tourism expenditures or Fed. Govt, expenditures. jp" /O dCO. "> CO
2. Enter the estimated INDIRECT & INDUCED SALES MULTIPLIER. .-> (Same as A. 5 from Tourism Worksheet #1) ^~
3. Calculate the TOTAL SALES BENEFITS from expenditures by J/•> _ /)/V\ A /> .A "other" non-local parties. (1) x (2) jPt-Q^' ,'--->-
B. TAX REVENUE BENEFITS FROM 'OTHER' EXPENDITURES The following steps are discussed in text Section I. B.
1. Enter TOTAL SALES ("Other" non-local) from A. 3 above. P £_ZJ * 1; " "
2. Enter COMBINED STATE & LOCAL RETAIL SALES TAX RATE. £ "j (Same as B.2 from Tourism Worksheet #1) '
3. Calculate the INCREASED SALES TAX REVENUES. (1) x (2) ~1LL±J—JL?
4. Enter TOTAL SALES BENEFITS ('other') from A. 3 above. P eZllZ. "'; ' "
5. Enter the TAXABLE INCOME RATIO. (Same as B.5 from _ £ jT~ Worksheet #1) '
6. Enter the COMBINED STATE & LOCAL INCOME TAX RATE. , / "7 (Same as B.6 from Worksheet #1)
d p c ^ T f - • - > J s • *
7. Calculate INCREASED INCOME TAX REVENUE. (4) X (5) X (6) vfl_— > "'""~
8. TAX REVENUE BENEFITS from expenditures by # p ZS& &C& "other" non-local parties. Add (3) + (7) ' ^J. '___
C. JOB BENEFITS FROM "OTHER" EXPENDITURES
1. Enter TOTAL SALES ("Other" non-local) from A. 3 above <>0,C> expressed in millions ($5,600,000 - $5.6). '
2. Estimate the multiplier for new JOBS CREATED PER MILLION 2£> DOLLARS of total sales. (Same as C. 2 from Worksheet #1) _
3. Calculate the new JOBS CREATED by expenditure of "Other" s'A^S non-local parties. (1) x (2)

EXAMPLE A. A RURAL AREA NATIONAL PARK IN THE ROCKY MOUNTAIN REGION
WORKSHEET #4 SUMMARY OF ECONOMIC BENEFITS ATTRIBUTABLE TO THE PARK FROM THE COMBINED EFFECTS OF VISITOR EXPENDITURES. FEDERAL GOVERNMENT EXPENDITURES. AND OTHER NON-LOCAL PARTIES' EXPENDITURES
A. COMBINED SALES BENEFITS
Worksheet #1, Item A. 6, plus ' j-.- • oC*} Worksheet #2, Item A.3, plus %' * ' Worksheet #3, Item A.3 equals: <£0> &60 f 0 OQ
B. COMBINED INCREASED TAX REVENUE BENEFITS -« / o I 2^ Worksheet #1, Item B. 8, plus '°> * L i _p Worksheet #2, Item B. 8, plus ? ?TC> 0O~> Worksheet #3, Item B. 8 equals: > )
C. COMBINED NEW JOBS CREATED Worksheet #1, Item C. 3, plus 2, ?<3 f Worksheet #2, Item C. 3, plus Z^^T Worksheet #3, Item C. 3 equals:
3/7 *Z-
21

EXAMPLE B. AN URBAN AREA NATIONAL HISTORIC SITE IN THE MIDWEST REGION
WORKSHEET #1 ECONOMIC BENEFITS RESULTING FROM PARK VISITOR EXPENDITURES
A. SALES BENEFITS FROM TOURISM: Dollar value of goods and services purchased in the local area.
QZ~fqrV \ 1. Enter the estimated NON-LOCAL PERCENT of park use. _____!__ /
2. Look up the annual RECREATION VISITOR-DAY volume. —j s\fif) (From annual NPS Statistical Abstract) /;
3. Enter the average daily EXPENDITURES PER PERSON. (May use AAA data from Appendix A if other ft> u ~) r*Vj information is not available) n ' '
4. Calculate DIRECT SALES. (1) x (2) x (3) $ J'5~, 0 (J
5. Enter the estimated INDIRECT & INDUCED SALES MULTIPLIER. -> o (Range is 1. 2 - 2 . 8 ; avg - 2 .0) £ ' _
JJ ecu yC_ 6. Calculate TOTAL SALES BENEFITS FROM TOURISM. (4) x (5) g ^ 7 > r
B. TAX REVENUE BENEFITS FROM TOURISM
u? <&k\J V 5T/ 1. Enter TOTAL SALES from A.6 above. °° '> f _
_ „
2. Enter COMBINED STATE & LOCAL RETAIL SALES TAX RATE. ' _ _
3. Calculate INCREASED SALES TAX REVENUES. (1) x (2) zJlLZ—
4. Enter TOTAL SALES from A. 6 above. P u u~} ^J^
5. Enter the TAXABLE INCOME RATIO (i.e., taxable portion
of salaries & business profits: range is 0.2 - 0.6; "«? avg. - 0.3) _______
6. Enter the COMBINED STATE & LOCAL INCOME TAX RATE.
$ 3 7* 2?C"
7. Calculate INCREASED INCOME TAX REVENUE. (4) X (5) X (6) ± J v "
8. TAX REVENUE BENEFITS from tourism. Add (3) + (7) ^___2^____7
C. JOB BENEFITS FROM TOURISM
1. Enter TOTAL SALES from A.6, expressed in millions of ^ dollars. ($5,600,000 of total sales - $5.6) " '
2. Estimate multiplier for JOBS CREATED PER MILLION DOLLARS j C of total sales. (Range is 10 - 50; avg. - 30) _ °
3. Calculate new JOBS CREATED by tourism. (1) x (2) ^ . ̂ >
22

23
EXAMPLE B. AN URBAN AREA NATIONAL HISTORIC SITE IN THE MIDWEST REGION
WORKSHEET #2 ECONOMIC BENEFITS RESULTING FROM FEDERAL GOVERNMENT EXPENDITURES FOR PARK RELATED ACTIVITIES
A. SALES BENEFITS FROM FED. GOVT. EXPENDITURES: Dollar value of goods & services purchased in local area by Fed. Govt, spending.
1. DIRECT SALES equal to total amount of park related Fed. Govt. . . expenditures that are spent in the local area. jf *"f P ^ ^~"^
2. Estimated INDIRECT & INDUCED SALES MULTIPLIER. (May be higher than number used in Step A. 5 in the tourism *) <T\ Worksheet #1. Range is 1.2 - 2.8; avg. - 2.0) ZL '
3. Calculate TOTAL SALES BENEFITS from federal $ ) \10 0(06 government expenditures. (1) x (2) ). )
B. TAX REVENUE BENEFITS FROM FED. GOVT. EXPENDITURES; The following steps are discussed in text Section I. B.
$ I llA 0 06 1. Enter TOTAL SALES BENEFITS (Fed. Govt) from A.3 above. ̂ jjtzil
2. Enter COMBINED STATE & LOCAL RETAIL SALES TAX RATE. Q <L, (Same as B.2 for Tourism from Worksheet #1)
$ / T 2.60 3. Calculate INCREASED SALES TAX REVENUES. (1) X (2) <* '/ *~ "
ft I I 2.C £ 0>6 4. Enter TOTAL SALES BENEFITS (Fed. Govt) from A.3 above. K 'J ' _ j "' 5. Enter the TAXABLE INCOME RATIO (i.e., taxable portion
of salaries & business profits: range is 0.2 - 0.6; 2 avg. - 0.3). " '
6. Enter the COMBINED STATE & LOCAL INCOME TAX RATE. / C~ (Same as B.6 from Worksheet #1) '
7. Calculate INCREASED INCOME TAX REVENUE. (4) X (5) X (6) J ZJ
8. TAX REVENUE BENEFITS from Fed. Govt. jt / / 7 QQO expenditures. Add (3) + (7) *^ -: _
C JOB BENEFITS FROM FED. GOVT. EXPENDITURES
1. Enter the TOTAL SALES (Fed. Govt.) from A.3, above, I j expressed in millions ($5,600,000 - $5.6). ' '
2. Estimate the multiplier for new JOBS CREATED PER MILLION *pO DOLLARS OF total sales. (Same as C.2 from Worksheet #1) *_ _
3. Calculate the new JOBS CREATED by Fed. Govt, expenditures. Of\ Q (1) x (2) " J '

24
EXAMPLE B. AN URBAN AREA NATIONAL HISTORIC SITE IN THE MIDWEST REGION
WORKSHEET #3 ECONOMIC BENEFITS RESULTING FROM PARK-RELATED EXPENDITURES BY OTHER NON-LOCAL PARTIES
A. SALES BENEFITS FROM 'OTHER' EXPENDITURES
1. Enter DIRECT SALES which are expenditures by non-local parties to purchase goods & services connected with park related activities, such as construction of State access roads to the park, motel chain construction projects, concessioner capital improvements, etc.; does not include tourism expenditures or Fed. Govt, expenditures. J& £ i 5_gO COO
2. Enter the estimated INDIRECT & INDUCED SALES MULTIPLIER. -, o (Same as A.5 from Tourism Worksheet #1) £ ' _
3. Calculate the TOTAL SALES BENEFITS from expenditures b y ^ ^ ^ j fl£A "other" non-local parties. (1) x (2) if > j
B. TAX REVENUE BENEFITS FROM 'OTHER' EXPENDITURES The following steps are discussed in text Section I. B.
1. Enter TOTAL SALES ("Other" non-local) from A. 3 above. ZL^J-JL—
2. Enter COMBINED STATE & LOCAL RETAIL SALES TAX RATE. Q £> (Same as B.2 from Tourism Worksheet #1) \
3. Calculate the INCREASED SALES TAX REVENUES. (1) x (2) ''-ff J ^ A CJO
4. Enter TOTAL SALES BENEFITS ('other') from A. 3 above. V Z-——±—>^
5. Enter the TAXABLE INCOME RATIO. (Same as B.5 from "2 Worksheet #1) |
6. Enter the COMBINED STATE & LOCAL INCOME TAX RATE. I? (Same as B.6 from Worksheet #1) '
7. Calculate INCREASED INCOME TAX REVENUE. (4) X (5) X (6) ' ^' -/;L/^>-
8. TAX REVENUE BENEFITS from expenditures by <# -j 5tT A.AA "other" non-local parties. Add (3) + (7) ** I22j ^
C. JOB BENEFITS FROM "OTHER" EXPENDITURES
1. Enter TOTAL SALES ("Other" non-local) from A.3 above "7 £) expressed in millions ($5,600,000 - $5.6). ,
2. Estimate the multiplier for new JOBS CREATED PER MILLION ^ ^ DOLLARS of total sales. (Same as C. 2 from Worksheet #1)
3. Calculate the new JOBS CREATED by expenditure of "Other" I $ / non-local parties. (1) x (2) '

EXAMPLE B. AN URBAN AREA NATIONAL HISTORIC SITE IN THE MIDWEST REGION
WORKSHEET #4 SUMMARY OF ECONOMIC BENEFITS ATTRIBUTABLE TO THE PARK FROM THE COMBINED EFFECTS OF VISITOR EXPENDITURES. FEDERAL GOVERNMENT EXPENDITURES. AND OTHER NON-LOCAL PARTIES' EXPENDITURES
25
A. COMBINED SALES BENEFITS
Worksheet #1, Item A. 6, plus &&% X Worksheet #2, Item A.3, plus h ' i£>> * Worksheet #3, Item A. 3 equals: 7,C>cO} OOQ
B. COMBINED INCREASED TAX REVENUE BENEFITS 9 ^ S<»7 Worksheet #1, Item B. 8, plus t fJJ£OC> Worksheet #2, Item B. 8, plus •??<" o~*Q Worksheet #3, Item B. 8 equals: ' >
C. COMBINED NEW JOBS CREATED p 5", "2-Worksheet #1, Item C. 3, plus - _ «g. Worksheet #2, Item C. 3, plus g'j' Worksheet #3, Item C. 3 equals: ( J jg
Z5~X
