the money and foreign-exchange markets during the crisis · 2014-11-06 · the money and...
TRANSCRIPT

69
The Money and Foreign-Exchange Markets during the Crisis
Anders Jørgensen, Market Operations, Paul Lassenius Kramp, Carina Moselund Jensen and Lars Risbjerg, Economics1
1. INTRODUCTION AND SUMMARY
The money market, comprising the market for interbank loans and short-term securities, came under the spotlight at the onset of the financial turmoil in August 2007. The turmoil developed into a financial crisis after the suspension of payments by Lehman Brothers in Septem-ber 2008. Central banks worldwide responded quickly and massively, launching a number of extraordinary measures to support the banks' liquidity and access to funding. In the course of March 2009 the negative sentiment in the financial markets changed. While the situation in the financial markets gradually improved, the negative consequences for the real economy were already evident. This article analyses the reasons why the Danish money and foreign-exchange markets were affected, the consequences and Danmarks Nationalbank's measures to address the crisis.
The crisis erupted from the market for mortgages to less creditworthy American homeowners, (the subprime market). Several US banks as well as banks in other countries had invested in assets exposed to the US housing market, which was suffering mounting losses. Moreover, the assets were often complex financial instruments with opaque exposure. In addition to making the banks uncertain about their counterparties' credit standings and their own liquidity situation, these conditions made them hesitant to grant credit in the money market.
The key to understanding the dissemination of the crisis is the banks' high degree of dependence on the international money and capital markets as sources of funding and the close integration of the markets. Several banks in a number of countries were thus, to a large and in-creasing extent, relying on short-term funding in foreign currency, espe-cially dollars, via the international money markets. During the crisis in the autumn of 2008, there was a shortage of dollars when US banks
1 The authors would like to thank Jacob Gyntelberg and Flemming Würtz for useful suggestions and
comments.
Monetary Review 2nd Quarter 2011 - Part 2

70
became reluctant in their lending to European banks, among others. They needed the dollar liquidity themselves and were concerned about the credit standings of the European banks.
The backdrop for the rapid dissemination of the crisis is that several large international banks that were key providers of credit across currencies were severely affected by the problems in the US housing market. As a result, they generally put a stop to their international money-market lending.
What was the situation in Denmark? The Danish banks' direct credit exposure to the subprime market was limited, but, like the banks in some other countries, they were exposed to the development in the international money markets due to their high dependence on short-term funding in foreign currency, particularly dollars and euro, cf. section 2. As foreign banks generally ceased to grant interbank loans in the autumn of 2008, the banks to a large extent borrowed from central banks instead.
Like the large banks, small and medium-sized banks also had a cus-tomer funding gap in foreign currency and were dependent on the international money and capital markets. Their access to those markets was predominantly through the large banks only. This illustrates the general experience that the crisis spread from large international banks to large domestic banks and then to smaller banks.
An econometric analysis shows that the problems in the Danish money market primarily came from the US market. It indicates that the spillover effect from the US to the Danish money market took place mainly through the euro area money market. Because of Denmark's fixed-exchange-rate policy, the Danish money market is closely linked to that of the euro area.
The crisis has shown that it is important that banks to limit their dependence on individual markets where liquidity can disappear very rapidly. Against this background, Danmarks Nationalbank and the Danish Financial Supervisory Authority have intensified their monitoring of the banks' liquidity management.
What happened in the Danish money market in kroner? The development in Danish banks' money-market loans in kroner and Danmarks Nationalbank's provision of liquidity are analysed in section 3. Danmarks Nationalbank's monetary-policy instruments give the banks a high degree of flexibility in terms of obtaining collateralised liquidity. The market operations provide access for all banks and mortgage banks to obtain the loans they demand at a fixed interest rate and against a
Monetary Review 2nd Quarter 2011 - Part 2

71
wide range of collateral. Thanks to the flexible structure of Danmarks Nationalbank's monetary-policy instruments, the Danish money market functioned comparatively well during the first part of the crisis. No extraordinary liquidity facilities were established, and the framework for Danmarks Nationalbank's liquidity management was not changed.
Extraordinary facilities were introduced at a later stage. The extent of loans from Danmarks Nationalbank in that connection was very limited, but the measures were important in order to ensure the banks' ability to meet the liquidity requirements under section 152 of the Financial Business Act.
Turnover in the money market fell during the crisis, however. It became concentrated at the very short end of the market and switched from uncollateralised to collateralised lending as growing credit and liquidity risks kept banks from granting long-term uncollateralised loans. The short-term interbank market was partly replaced by accounts with Danmarks Nationalbank, with banks increasing both their loans and deposits at Danmarks Nationalbank in the autumn of 2008. The gross accumulation peaked in December 2008 when the banks and mortgage banks' holdings of certificates of deposit exceeded their net position vis-à-vis Danmarks Nationalbank by just over kr. 280 billion. Kr. 170 billion of this was attributable to the fact that some banks placed certificates of deposit while others raised monetary-policy loans. Hence, the increased gross positions vis-à-vis Danmarks Nationalbank to a large extent reflected that banks with a liquidity surplus placed it at Danmarks Nationalbank rather than relending it. Consequently, banks with a fund-ing requirement had to obtain monetary-policy loans rather than bor-rowing in the money market.
Based on data from Danmarks Nationalbank's payment system, Kro-nos, it is shown by section 3 that some of the small and medium-sized banks in particular were affected by the problems in the money market. Compared with large banks, at the end of 2008 they on average paid a premium of 0.25-0.5 percentage point for loans in the overnight money market, which is fundamental to the banks' ongoing liquidity manage-ment. In a few instances some banks paid a premium of 2-3 percentage points. The small banks had to increase the number of counterparties in order to ensure their liquidity, and they almost doubled the number of loans and counterparties in the overnight money market.
What does the spread between uncollateralised and collateralised interest rates indicate? The modest and stable pre-crisis spread between uncollateralised and collateralised money-market interest rates – known as the money-mar-
Monetary Review 2nd Quarter 2011 - Part 2
72
ket spread – quickly became a key indicator of the funding problems in the money market, mirroring the crisis development in general. Using regression analysis, we investigate the factors behind the development in the Danish money-market spread in section 4.
Knowledge about the breakdown of the money-market spread into credit and liquidity factors is relevant for decisions on which measures should be taken in a crisis situation. If the primary reason for the widening of the spread is the deterioration of liquidity conditions, meas-ures to improve the way the money market works or the liquidity situation of the banks may be useful. If the widening reflects higher credit risk, measures to support the banks' solvency may be more rele-vant.
In practice, the credit and liquidity factors of the money-market spread are closely linked and difficult to separate. With this in mind, the empirical analysis shows that during the first part of the crisis a very large proportion of the spread could be attributed to liquidity condi-tions, and that the liquidity conditions in the euro area had a significant impact on the Danish money-market spread.
However, in the course of 2009 the Danish spread, like that of the euro area, came to predominantly imply a credit premium, reflecting that the crisis evolved from a liquidity crisis into a credit crisis. The money-market spreads narrowed as liquidity returned to the markets in the wake of the massive interventions by central banks worldwide. But at the same time it also became clear that the banks' solvency was under pressure following major losses, and that policies aimed at improving the liquidity situation were insufficient.
On the face of it, the wide credit-related spread was remarkable in view of the fact that Bank Rescue Package 1 included a government guarantee for all depositors' and other unsecured creditors' claims in banks from October 2008 to September 2010. A key explanatory factor is that most banks determined their credit policies vis-à-vis other banks as if Bank Rescue Package 1 did not exist.
What happened in the foreign-exchange markets and to the Danish krone? In the wake of Lehman's suspension of payments, investors withdraw from minor currencies, cf. section 5. This led to exchange-rate pressure, and minor currencies with floating exchange rates, e.g. Swedish kronor, depreciated. Furthermore, there were indications of some investors speculating in Danmarks Nationalbank not being able to maintain the fixed-exchange-rate policy. In addition to international investors with-drawing from minor currencies, the shortage of dollars and euro led to a
Monetary Review 2nd Quarter 2011 - Part 2

73
reduction of loans in foreign currency via FX swaps because it was intractable and expensive. The demand for foreign currency conse-quently increased, putting pressure on the Danish krone.
As a result of the Danish fixed-exchange-rate policy against the euro, Danmarks Nationalbank made intervention purchases for considerable amounts and raised its monetary-policy interest rates while other central banks generally lowered theirs. Danmarks Nationalbank's measures con-tributed to stabilising the krone. The issuance of 30-year government bonds, which were in high demand from the Danish pension sector, and Bank Rescue Package 1 also contributed to stabilising the situation.1 During the crisis the krone remained stable at a level close to its central rate against the euro.
The transmission from monetary-policy interest rates to the krone rate weakened substantially during the crisis, making it impossible to substi-tute the outflow from the foreign-exchange reserve for government currency loans at the peak of the crisis. According to experience from the autumn of 2008, very large amounts may be required for inter-vention purposes if the krone is under pressure, and a large foreign-exchange reserve is therefore needed. Danmarks Nationalbank more than doubled the foreign-exchange reserve in relation to the situation before the autumn of 2008 when the pressure on the krone really set in. The crisis also showed that Danmarks Nationalbank may need to provide foreign exchange to the banks from the foreign-exchange reserve.
What did Danmarks Nationalbank do to ensure funding in foreign currency? In the autumn of 2008, against the backdrop of the shortage of dollars and euro, Danmarks Nationalbank established swap lines with the Federal Reserve and the European Central Bank, ECB, in order to provide US dollar and euro liquidity to Danish banks. According to our regres-sion analyses in section 6, the announcement of the swap lines substan-tially improved the conditions for funding in foreign currency, reflecting that market participants were reassured by the support of the Federal Reserve and the ECB for dollar and euro financing. The results are in line with similar studies for other countries. Danmarks Nationalbank also provided dollar and euro FX swap loans from the foreign-exchange reserve in September and October 2008. The euro-denominated lending supported the conditions for funding in euro, while the result of FX swaps in dollars was less clear-cut.
1 The issuance of 30-year government bonds supported the demand for kroner to the extent that
pension companies sold European bonds in order to buy Danish government securities.
Monetary Review 2nd Quarter 2011 - Part 2

74
2. SPREADING OF THE FINANCIAL CRISIS TO DENMARK
Prior to the crisis, the Danish banks had limited exposure to the US mar-ket for subprime mortgages, so their subprime-related losses were limited.1 However, like the banks in some other countries, they were ex-posed to the international money markets because of their great dependence on short-term financing in foreign currency, especially dol-lars and euro. It was prevalent for banks to finance themselves in one currency and then swap it to another currency. As a result, they were exposed to the swap markets. Because of the high degree of depend-ence on financing via the international money markets and the close integration of the money markets, the problems rapidly spread from the US money market to the money markets in the euro area and Denmark.
Below we discuss how, up to and during the crisis, the banks financed themselves in foreign currency, and how it became increasingly difficult for them to obtain dollars and euro. We show how this shortage of foreign currency created problems in the FX swap markets, making it difficult and expensive to obtain funding in US dollars, among other currencies, via FX swaps. We also investigate how the widening of the spread between uncollateralised and collateralised interest rates spread from the US and European money markets to the Danish money market.
The Danish banks' customer funding gap For Danish banks, as was the case for many European and US banks, the years preceding the financial crisis were characterised by high lending growth rates and increased leverage, cf. the left-hand side of Chart 2.1.
The banks' lending growth was much stronger than the growth in their non-MFI deposits2, which are normally considered a stable source of funding. As a result, they had a considerable customer funding gap, cf. the right-hand side of Chart 2.1, which had to be financed in the money and capital markets.
1 US as well as European banks had invested in and provided liquidity guarantees in dollars to
structured investment vehicles (SIVs), which had invested in securities collateralised by subprime mortgages. It became difficult for the SIVs, which were typically funded by short-term loans, to continue financing themselves. As a result, the SIVs began to draw on the liquidity guarantees provided by US and European banks. Several large Danish banks also had liquidity commitments to SIVs and had, to a lesser extent, purchased capital certificates in SIVs. In the wake of the subprime crisis the Danish banks reduced their liquidity commitments and direct investments in SIVs, cf. Danmarks Nationalbank (2008b). The spread between uncollateralised and collateralised money-market interest rates widened significantly on 9 August 2007 after the announcement by the French bank, BNP Paribas, that it would stop paying instalments on its debt and calculating mark-to-market for three SIVs exposed to the subprime market. See Lund (2007), Krishnamurthy (2009) and Sarkar and Shrader (2010) for a background to the subprime crisis and the way it spread. See BIS (2009 and 2010) for a breakdown of the crisis into phases and an overview of central-bank measures.
2 MFIs stands for monetary financial institutions, primarily comprising banks and mortgage banks.
Monetary Review 2nd Quarter 2011 - Part 2

75
The banks with customer funding gaps in foreign currency were de-pendent on financing in the international money and capital markets, either directly via currency loans or indirectly via FX swaps. The banks overall had large outstanding balances at central banks and other MFIs, typically short-term, in both euro and US dollars, cf. Chart 2.2. Due to the short-term financing, the banks were subject to considerable refi-nancing risks.
The large Danish banks accounted for the main part of the customer funding gap in foreign currency in the autumn of 2008, but small and medium-sized banks also had a considerable customer funding gap and therefore needed currency financing.1 Not all banks had direct access to the international markets. The smaller banks mainly obtained their financing via the large Danish banks. For both the large and medium-sized banks the customer funding gap amounted to 13 per cent of total assets in the autumn of 2008, while the corresponding figure was 28 per cent for the small banks.
The banks' financing of the customer funding gap The banks' financing in the money and capital markets can be divided into loans from central banks, loans from other MFIs and debt issuance, cf. the left-hand side of Chart 2.3.
1 Large, medium-sized and small banks are defined according to the Danish Financial Supervisory
Authority's groups for 2010. In the 3rd quarter of 2010 the large banks in group 1 accounted for around 86 per cent of the banks' total balance sheet, while the medium-sized banks in group 2 accounted for 8 per cent and the small banks in groups 3 and 4 accounted for 7 per cent.
THE BANKS' LEVERAGE, LENDING GROWTH AND CUSTOMER FUNDING GAP Chart 2.1
4.04.55.05.56.06.57.07.58.08.59.09.5
10.0Share
-20-15-10-50510152025303540
Per cent
Leverage Lending growth (right-hand axis)
Leverage and lending growth
2004 2005 2006 2007 2008 2009 2010-200
-100
0
100
200
300
400
500
600
700
800
Kr. billion
Kroner Foreign currency Total customer funding gap
2003 2004 2005 2006 2007 2008 2009 2010
Customer funding gap
Note: Source:
The compilation comprises the Danish banks that were included in the Danish Financial Supervisory Authority's groups 1-4 in 2010 and their foreign branches and subsidiaries. The customer funding gap is calculated as the difference between lending to and deposits from non-MFIs. The leverage is calculated as the relationship between the banks' lending to non-MFIs and their equity capital in the form of capital and reserves. The lending growth is calculated as year-on-year growth rates. Last observation: 4th quarter of 2010. Danmarks Nationalbank.
Monetary Review 2nd Quarter 2011 - Part 2

76
Before the onset of the turmoil the widening customer funding gap was mainly financed by deposits from other MFIs. These deposits declined significantly from the autumn of 2008. To a large extent, non-residents stopped granting loans to Danish banks following Lehman Brothers' suspension of payments, cf. section 5. Furthermore, Roskilde Bank drew negative attention to Denmark in the international financial markets in August 2008 when it was taken over by Danmarks Nationalbank and private banks in Denmark via the Danish Contingency Association. At the same time, the banks responded by reducing the exchange of
THE BANKS' BALANCE SHEETS IN EURO AND DOLLARS Chart 2.2
-1,000
-800
-600
-400
-200
0
200
400
600
800
1,000Dollars
Non-MFIs Other MFIs Central banks Net assets
Euro
2003 2004 2005 2006 2007 2008 2009 2010-600
-500
-400
-300
-200
-100
0
100
200
300Kr. billion
Non-MFIs Other MFIs Central banks Net assets
Dollars
2003 2004 2005 2006 2007 2008 2009 2010
Note: Source:
The compilation comprises all Danish banks and their foreign branches and subsidiaries. Assets have a positive sign; liabilities have a negative sign. Last observation: 2nd quarter of 2010. Bank for International Settlements' international locational and consolidated banking statistics and own calculations.
THE BANKS' BORROWING IN THE MONEY AND CAPITAL MARKETS BROKEN DOWN BY FUNDING SOURCE AND CURRENCY Chart 2.3
0
100
200
300
400
500
600Kr. billion
400
600
800
1,000
1,200
1,400
1,600Kr. billion
Total (right-hand axis) Central banks Other MFIsShort-term debt Long-term debt
Breakdown by funding source
2003 2004 2005 2006 2007 2008 2009 20100
100
200
300
400
500
600Kr. billion
400
600
800
1,000
1,200
1,400
1,600Kr. billion
Total (right-hand axis) Dollars Euro Kroner Swiss francs
Breakdown by currency
2003 2004 2005 2006 2007 2008 2009 2010
Note: Source:
The compilation comprises Danish banks in the Danish Financial Supervisory Authority's groups 1 and 2, excluding their foreign branches and subsidiaries. Loans from MFIs constitute net borrowing from MFIs other than centralbanks and foreign branches and subsidiaries. Debt is debt securities issued. Short-term debt is issuance with an original maturity of up to and including 1 year, while long-term debt has a maturity of more than 1 year. Danmarks Nationalbank.
Monetary Review 2nd Quarter 2011 - Part 2

77
interbank liquidity.1 Loans from central banks and short-term debt issuance became the predominant sources of funding when the crisis in the financial markets culminated in the autumn of 2008.
Bank Rescue Package 1, which was announced on 5 October 2008 and included a government guarantee for all depositors' and other unse-cured creditors' claims in banks, contributed to supporting the Danish money market and the banks' access to financing. At the end of 2008 and the beginning of 2009, the deposits from non-resident MFIs grad-ually returned, and the banks increasingly issued debt securities with longer maturities.
Together with Danish kroner, US dollars accounted, to a high degree, for the increased financing in the money and capital markets up until October 2008, cf. the right-hand side of Chart 2.3. Financing in euro sub-sequently began to take over, reflecting the beginning return of deposits from non-resident MFIs and the gradual increase in the issuance of debt securities in euro.
The banks' dollar loans Dollar funding was to a large extent obtained via short-term debt is-suance. This business model made the banks vulnerable to the US money market when the debt was to be refinanced.
Short-term debt issuance in dollars in the Commercial Paper (CP) mar-ket played an important role. Here, conditions deteriorated strongly in the autumn of 2008, so it became difficult to obtain funding in this mar-ket. The Federal Reserve, the Fed, supported the market by establishing the Commercial Paper Funding Facility, CPFF, with the aim of reducing the banks' refinancing risks by purchasing 3-month CPs from financial institutions with a high credit rating. At the end of October 2008, the Fed purchased CPs issued by the largest Danish bank, Danske Bank, equi-valent to 13 per cent of the total short-term debt issuance by Danish banks. The purchase totalled just over 5 billion dollars. The CPs matured in January 2009.2
The banks' access to dollar funding was also supported by Danmarks Nationalbank's swap line with the Fed, which was established in Septem-ber 2008, cf. sections 5 and 6. The banks borrowed up to 15 billion dollars using this facility. In addition to dollars, the largest central-bank loans in foreign currency were in Swiss francs. During the crisis, a few major banks had direct access to borrowing both Swiss francs and dollars from the Swiss National Bank.
1 Cf. Danmarks Nationalbank (2008a).
2 Cf. http://www.federalreserve.gov/newsevents/reform_cpff.htm.
Monetary Review 2nd Quarter 2011 - Part 2

78
Financing via FX swaps Some Danish banks were dependent on short-term financing in foreign currency and exposed to the developments in the FX swap markets. Part of the banks' financing in dollars was thus used to finance their lending in other currencies, e.g. Swiss francs.1 The exchange-rate risk was covered by swapping dollars to the foreign-exchange exposure of the lending. As the crisis made it more difficult to access the international money and foreign-exchange markets, the banks took the opportunity to finance their loans by borrowing from central banks instead.
The banks' increased exposure to funding in foreign money and cap-ital markets in the period leading up to the crisis was an international trend. Prior to the crisis, the euro area banks had built up large foreign-exchange assets in dollars. The maturity of the funding was typically shorter than that of the assets and some of the funding was not directly in dollars. As a result, there was a pronounced currency and maturity mismatch between the banks' assets and liabilities. This increased the sensitivity to the US money market and the FX swap market where the banks needed to refinance lending on an ongoing basis, cf. Fender and McGuire (2010) and McGuire and von Peter (2009). At the end of 2008, the euro area banks' net assets in dollars amounted to around 400 billion dollars that needed to be hedged. This created an underlying demand for dollars in the FX swap market, cf. Allen and Moessner (2010a). Dollar shortage As the crisis evolved, it became more difficult to obtain dollars because the US banks became less willing to grant loans to e.g. European banks. Consequently, European banks increasingly had to raise dollars by bor-rowing in other currencies and swapping to dollars via the FX swap market rather than borrowing dollars directly. This pushed up the price of dollar funding via FX swaps considerably compared with direct dollar loans, thereby creating large deviations from the covered interest-rate parity, cf. Chart 2.4 and Box 2.1. Normally, the deviations would be elim-inated by arbitrage, but to a large extent the European banks were unable to obtain direct financing in the US money market and thus to perform the arbitrage.
1 In the years leading up to the crisis, the banks built up large assets in Swiss francs, including lending
to the agricultural sector. The assets were not financed by liabilities in Swiss francs but by liabilities in other currencies.
Monetary Review 2nd Quarter 2011 - Part 2

79
The Fed and the ECB established swap lines with a number of central banks to remedy the shortage of dollars and euro, initially in December 2007.1
The European banks were dependent on dollar financing and to some extent directly exposed to the US subprime loans. The free movement of capital and the close integration of the international money markets resulted in a spilleover effect from the US money market to the inter-national money markets as a result of arbitrage between the markets, cf. Box 2.1. But during the crisis, the money-market spread varied con-siderably across countries, cf. Chart 2.5. For instance, in the autumn of 2008 the US spread was somewhat wider than the spreads in Denmark and the euro area. From the end of 2008 until the end of 2010, the Danish spread was wider than that of the euro area. The spillover effects among the money markets are described in more detail in Box 2.2. Section 4 divides the effects into credit and liquidity factors.
1 See Allen and Moessner (2010a) for an overview of the deviations from the covered interest-rate
parity for a number of currencies and the central-bank measures to remedy the shortage of international liquidity.
DEVIATION FROM THE COVERED INTEREST-RATE PARITY Chart 2.4
-0.5
0.0
0.5
1.0
1.5
2.0
2.5
3.0
3.5
Percentage points
Kroner/dollars Euro/dollars Kroner/euro
2006 2007 2008 2009 2010 2011
Note: Source:
The uncollateralised money-market interest rates, Cibor, Libor and Euribor for the Danish, US and euro areamoney market, respectively, are used to calculate the deviation from the covered interest-rate parity in accordance with equation (3) in Box 2.1. "Kroner/dollars" expresses the difference between the cost of loans inkroner combined with FX swaps and the cost of direct borrowing in dollars. The same applies to "Kroner/euro"and "Euro/dollars". The vertical lines are set at 9 August 2007 (the onset of the turmoil after the announcement by French bank BNP Paribas that it would stop paying instalments on its debt and calculating mark-to-market for three SIVs exposed to the subprime market) and 15 September 2008 (Lehman Brothers' suspension of payments). Last observation: 31 May 2011. Bloomberg.
Monetary Review 2nd Quarter 2011 - Part 2

80
FX SWAPS AND THE COVERED INTEREST-RATE PARITY Box 2.1
An FX swap is an agreement comprising a simultaneous spot transaction and forward
contract. In connection with the spot transaction an amount is exchanged between
two currencies at the current spot rate; in connection with the forward contract the
amount is exchanged back at an agreed future point in time and at an agreed
exchange rate. FX swaps are concluded with standardised maturities from 1 day up to
12 months. They can be regarded as secured loans in one currency against collateral in
another. When a bank supplies Danish kroner and receives currency in a spot
transaction, this is the same as lending in kroner. Banks mainly use FX swaps as a
money-market instrument to fund their activities across money markets in different
currencies. It is possible to conclude the spot transaction with one counterparty and
the forward contract with another. The financial aspects are the same, and this article
does not distinguish between FX swaps and forward contracts.
The covered interest-rate parity indicates that the cost of borrowing directly in the
domestic currency, e.g. Danish kroner, is equivalent to the cost of raising a loan in a
foreign currency, e.g. dollars, while at the same time concluding an FX swap where
the dollar exposure is hedged (converted into krone exposure). The interest-rate
parity consequently entails that:
F/S· (1 + rUSD) = 1+ rDKK,, (1)
where F is the forward rate and S is the spot rate (kroner per dollar) and rUSD and rDKK
are the money-market interest rates in dollars and kroner, respectively. If the covered
interest-rate parity does not apply, there will be a basis for arbitrage, since loans can
be raised in one currency and invested and hedged in another currency at a higher
interest rate. The relationship (1) can be approximated as follows:
(F-S)/S = rDKK – rUSD. (2)
The left-hand side of the equation is an expression of the cost in per cent of
borrowing kroner against foreign currency, e.g. dollars, via an FX swap. The cost is an
expression of the implied interest-rate spread between kroner and dollars in an FX
swap. If the covered interest-rate parity remains unchanged, the implied interest-rate
spread will be in accordance with the actual spread between the Danish and the US
money-market interest rates (the right-hand side of the equation).
If the covered interest-rate parity remains unchanged for both collateralised and
uncollateralised interest rates, this would entail that the spread between uncollat-
eralised and collateralised interest rates across money markets would be the same.
This can be seen by the fact that (2) would apply to both collateralised and un-
collateralised interest rates.
In practice, deviations from the covered interest-rate parity may be observed, and
the spread between collateralised and uncollateralised interest rates will not be the
same across money markets due to e.g. transaction costs and differences in credit risk
and liquidity conditions between the markets. During the crisis, large and sustained
deviations from the covered interest-rate parity occurred, making it cheaper to
borrow dollars directly in the US money market rather than borrowing in e.g. euro,
Monetary Review 2nd Quarter 2011 - Part 2

81
CONTINUED Box 2.1
pounds sterling, Swedish kronor or Danish kroner and converting the loan into a
dollar loan via an FX swap. Hence, the following applied:
(1/F)/(1/S) (1 + rDKK) > (1+ rUSD), (3)
where 1/S and 1/F are spot and forward rates expressed as dollars per krone.
Similarly, it was cheaper to borrow directly in euro rather than raising a loan in
pounds sterling, Swedish kronor or Danish kroner and converting it into a euro loan
via an FX swap.
During the crisis, however, European banks found it difficult to borrow dollars
directly in the money market, and they had to resort to the FX swap market in order
to raise dollars. As a result of the increase in demand, the related costs rose compared
to direct borrowing. This can be illustrated by the example of FX swaps between
kroner and dollars where dollar funding meant spot purchases of dollars (against
kroner) and forward sales of dollars (against kroner). This drove down the forward
rate (F) of dollars compared to the spot rate (S), making it more expensive to borrow
dollars via FX swaps against kroner than to borrow directly in dollars, cf. (3) above.
Cross-currency swaps, exchanging principals and interest in two currencies, can be
used in the same way as FX swaps.
SPREAD BETWEEN UNCOLLATERALISED AND COLLATERALISED MONEY-MARKET INTEREST RATES IN SELECTED COUNTRIES Chart 2.5
0.0
0.5
1.0
1.5
2.0
2.5
3.0
3.5
4.0
4.5
5.0
Denmark Euro area USA UK Sweden
Percentage points
2007 2008 2009 2010 2011
Note: Source:
The money-market spreads are calculated as 3-month reference interest rates (Cibor in Denmark, Euribor in the euro area, Libor in the USA and the UK, and Stibor in Sweden), minus the 3-month interest rate in interest-rate swaps at the overnight interest rate. See section 4 for further details. Vertical lines at 9 August 2007 and 15 September 2008, cf. Chart 2.4. Last observation: 31 May 2011. Reuters EcoWin.
Monetary Review 2nd Quarter 2011 - Part 2
82
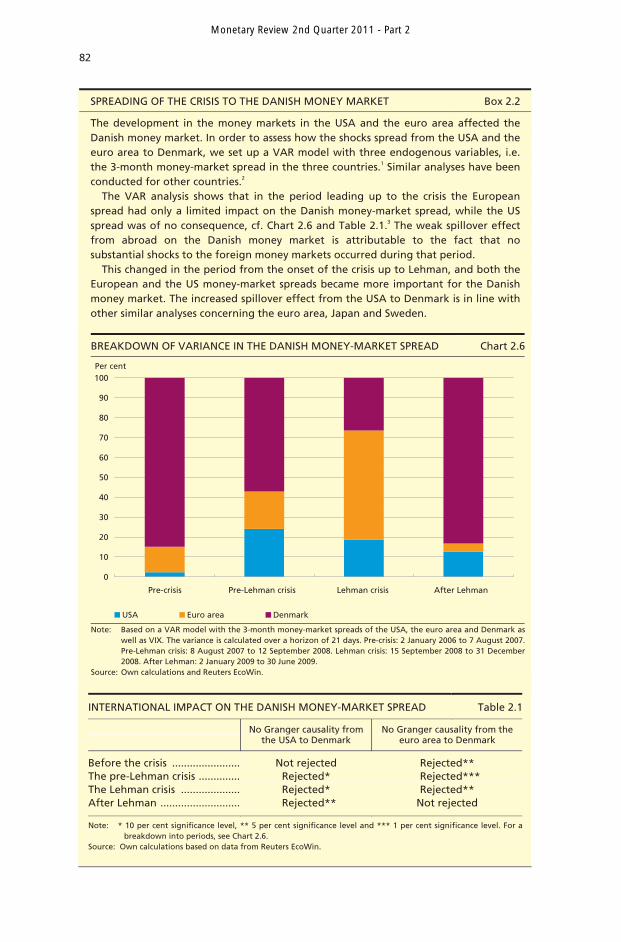
SPREADING OF THE CRISIS TO THE DANISH MONEY MARKET Box 2.2
The development in the money markets in the USA and the euro area affected the Danish money market. In order to assess how the shocks spread from the USA and the euro area to Denmark, we set up a VAR model with three endogenous variables, i.e. the 3-month money-market spread in the three countries.1 Similar analyses have been conducted for other countries.2
The VAR analysis shows that in the period leading up to the crisis the European spread had only a limited impact on the Danish money-market spread, while the US spread was of no consequence, cf. Chart 2.6 and Table 2.1.3 The weak spillover effect from abroad on the Danish money market is attributable to the fact that no substantial shocks to the foreign money markets occurred during that period.
This changed in the period from the onset of the crisis up to Lehman, and both the European and the US money-market spreads became more important for the Danish money market. The increased spillover effect from the USA to Denmark is in line with other similar analyses concerning the euro area, Japan and Sweden.
BREAKDOWN OF VARIANCE IN THE DANISH MONEY-MARKET SPREAD Chart 2.6
0
10
20
30
40
50
60
70
80
90
100
Pre-crisis Pre-Lehman crisis Lehman crisis After Lehman
USA Euro area Denmark
Per cent
Note: Source:
Based on a VAR model with the 3-month money-market spreads of the USA, the euro area and Denmark as well as VIX. The variance is calculated over a horizon of 21 days. Pre-crisis: 2 January 2006 to 7 August 2007. Pre-Lehman crisis: 8 August 2007 to 12 September 2008. Lehman crisis: 15 September 2008 to 31 December2008. After Lehman: 2 January 2009 to 30 June 2009. Own calculations and Reuters EcoWin.
INTERNATIONAL IMPACT ON THE DANISH MONEY-MARKET SPREAD Table 2.1
No Granger causality from
the USA to Denmark No Granger causality from the
euro area to Denmark
Before the crisis ....................... Not rejected Rejected** The pre-Lehman crisis .............. Rejected* Rejected*** The Lehman crisis .................... Rejected* Rejected** After Lehman ........................... Rejected** Not rejected
Note: * 10 per cent significance level, ** 5 per cent significance level and *** 1 per cent significance level. For abreakdown into periods, see Chart 2.6.
Source: Own calculations based on data from Reuters EcoWin.
Monetary Review 2nd Quarter 2011 - Part 2

83
Conclusion Prior to the crisis, Danish banks had accumulated substantial customer funding gaps, especially in foreign currency. The gaps were to a large extent financed in the international money and foreign-exchange mar-kets through loans from MFIs and short-term debt securities. When the crisis in the US and European money markets caused foreign banks to reduce their international money-market lending, Danish banks found it difficult to refinance their short-term currency debt. As a result, the Danish banks increased their central-bank loans in foreign currency considerably in the autumn of 2008. A number of small and medium-sized Danish banks relied on having access to financing through the large banks. This illustrates the general experience that the crisis spread from large international banks to large domestic banks and then to smaller banks. The Danish banks had substantial short-
CONTINUED Box 2.2
The money-market spreads widened substantially in the USA in connection with
Lehman Brothers' suspension of payments, due to special conditions in the dollar
market among other factors. The spreads in the euro area and Denmark widened
somewhat less. While the importance of the euro area spread for the Danish spread
increased substantially, the direct spillover effect from the USA declined, showing that
the spillover effect from the US to the Danish money market was effected mainly
through the euro area money market.
After Lehman, in early 2009, the money-market spreads narrowed, e.g. as a result of
a number of extraordinary measures introduced by central banks worldwide, cf.
section 3. According to the VAR model, the international development had only a
relatively limited effect on the Danish money-market spread during that period. This
should be viewed in relation to the sluggish response of Cibor, cf. Andersen and Arp
(2010), which caused isolated fluctuations in the Danish money-market spread.
Furthermore, Cibor declined more slowly than the corresponding uncollateralised
money-market interest rates in the USA and the euro area, causing a different
development in the Danish spread than in the euro area. It is clear, however, that the
narrowing of the money-market spreads in the USA and euro area was the main
driver behind the narrowing of the Danish spread.
1 The analysis uses day-to-day data. The number of lags was selected using sequential modified LR test statistics. LR typically results in relatively many lags, thereby reducing any autocorrelation problems. The results do not change if the number of lags is determined by Akaike or Schwarz information criteria. Dummies are included to correct e.g. large fluctuations in the money-market spread due to a difference in the information content between collateralised and uncollateralised interest rates, because they are calculated at different times across countries. Furthermore, the US VIX is included as an exogenous variable (tests confirm that VIX can be regarded as exogenous). VIX can be seen as a measure of the underlying market risk that may affect risk aversion. Including VIX practically eliminates autocorrelation, heteroskedasticity and too much bias (part of the normal distribution assumption). The results are robust to the exclusion of VIX.
2 See e.g. ECB (2008) and Imakubo, Kimura, Nagano (2008) and Soultanaeva and Strömquist (2009). 3 Impact is defined here as Granger causality, i.e. whether historical observations of a variable may contribute to
forecasting another variable. More specifically, an F test is calculated as to whether lagged values of a variable, X, generally contribute to explaining another variable, Y, compared to a situation where Y can only be explained by its own lagged values. If the F test can be rejected, i.e. if R2 improves when including lagged values of X, X is said to Granger-cause Y.
Monetary Review 2nd Quarter 2011 - Part 2

84
term debt in dollars, rendering them highly sensitive to conditions in the money and swap markets for dollars. According to an econometric analysis, the transmission was from the US money market to the money markets worldwide. The analysis also indicates that the transmission from the US to the Danish money market was effected mainly through the euro area. Because of the fixed-exchange-rate policy, conditions in the Danish money market are closely linked to those in the euro area.
The crisis has shown that it is important for banks to limit their dependency on individual markets where liquidity can disappear all of a sudden.1 Accordingly, Danmarks Nationalbank and the Danish Financial Supervisory Authority have intensified their monitoring of the banks' liquidity situation, including by requesting banks to provide monthly liquidity forecasts and stress tests. 3. MONETARY-POLICY INSTRUMENTS AND THE MONEY MARKET
The Danish money market functioned relatively well during the first part of the crisis. The structure of Danmarks Nationalbank's monetary-policy instruments made it easy for the banks to obtain the liquidity they demanded against collateral. No extraordinary liquidity facilities were needed, and the framework of Danmarks Nationalbank's liquidity man-agement was not changed. As the crisis escalated, the interbank ex-change of liquidity in the money market declined, and Danmarks Natio-nalbank introduced extraordinary liquidity facilities.
The efficiency of the monetary-policy instruments can generally be assessed by the extent of the pass-through from monetary-policy inter-est rates to money-market interest rates and the exchange rate, and the extent to which it is ensured that the banking sector gets the liquidity it needs and that interbank transactions in the money market are sup-ported. The transmission of monetary-policy interest rates is discussed below, including on the basis of data from Danmarks Nationalbank's payment system, Kronos, for the individual banks' loans in the overnight money market. The provision of liquidity is illustrated by the way the banks have used the monetary-policy instruments and extraordinary facilities and there is made a comparisons with the measures introduced by other central banks. The functioning of the money market and the interbank exchange of liquidity are also analysed on the basis of data from Kronos.
1 Danmarks Nationalbank (2010).
Monetary Review 2nd Quarter 2011 - Part 2

85
Transmission of monetary-policy interest rates to the money market A well-functioning money market is important to ensure a clear pass-through from Danmarks Nationalbank's monetary-policy interest rates to the short-term interest rates in the money market and to the rest of the financial system. The formation of interest rates in the money mar-ket is the basis for the deposit and lending rates that banks offer their customers and for variable-rate mortgage loans.
The levels of the overnight interest rate in the money market and the 1-month swap rate1 have kept close to Danmarks Nationalbank's monet-ary-policy interest rates, cf. the left-hand side of Chart 3.1. Danmarks Nationalbank's monetary-policy instruments are described in Box 3.1. The fluctuations in the overnight rate normally increase in step with the spread between Danmarks Nationalbank's rate of interest on certificates of deposit and the current-account rate, which was wide in the autumn of 2008. As might be expected, this led to substantial technical volatility in the T/N rate, cf. the right-hand side of Chart 3.1.2
On 8 June 2009, Danmarks Nationalbank introduced a margin be-tween the lending rate and the rate of interest on certificates of de-posit. The aim was to give the banks and mortgage banks a greater in-
1 The swap rate is the fixed interest rate in an interest-rate swap with the overnight rate (the T/N rate),
cf. Danmarks Nationalbank (2009a), Box 4.2 for further details. 2 The cause of the technical volatility is that while the overnight rate will normally be close to the
current-account rate on days when Danmarks Nationalbank does not conduct open market operations, counterparties with a liquidity surplus require a comparatively high overnight rate to lend it rather than placing it in certificates of deposit on days when Danmarks Nationalbank conducts open market operations. Market participants understand the technical volatility of the overnight rate, and the fluctuations do not normally have a effect on the longer-term money-market interest rates, cf. Andersen (2004).
DEVELOPMENT IN MONETARY-POLICY INTEREST RATES AND MONEY-MARKET INTEREST RATES Chart 3.1
0
1
2
3
4
5
6Per cent
Lending rate Certificate of deposit rate T/N rate Swap rate
Monetary-policy and money-market interest rates
2005 2006 2007 2008 2009 2010-1.5
-1.0
-0.5
0.0
0.5
1.0
1.5
2.0
2.5
3.0
T/N rate Certificate of deposit rate
1999 2000 2001 2002 2003 2004 2005 2006 2007 2008 2009 2010
Spread to current-account ratePercentage points
Note: Source:
Left-hand side: The T/N interest rate is a 5-day moving average. Right-hand side: Due to the use of 14-day maturities on monetary-policy loans and certificates of deposit, interest-rate speculation in connection with the monetary-policy interest-rate adjustments around 2002-03 and 2005-07 resulted in large technical fluctuations in the overnight rate. As a consequence, Danmarks Nationalbank changed its maturities to 7 days with effect from2 May 2007. Until 8 June 2009, the lending rate equalled the rate of interest on certificates of deposit. The netposition was subsequently positive. Last observation: 30 December 2010. Reuters EcoWin and Danmarks Nationalbank.
Monetary Review 2nd Quarter 2011 - Part 2

86
centive to even out mutual liquidity differences via the money market rather than using Danmarks Nationalbank's facilities. In general terms, the T/N rate has subsequently matched Danmarks Nationalbank's cur-rent-account rate and rate of interest on certificates of deposit. This is also to be expected when the banks' net position vis-à-vis Danmarks Nationalbank is positive, as has been the case since the introduction of the interest margin.
The development in the short-term money-market interest rates during the crisis indicates that there were no general problems with the transmission of the monetary-policy interest rates or with ensuring that there was sufficient liquidity in the banking sector.
However, there are indications that the small and medium-sized banks' exchange of liquidity in the money market was impeded in some
DANMARKS NATIONALBANK'S MONETARY-POLICY INSTRUMENTS1 Box 3.1
In practice, Danmarks Nationalbank conducts monetary policy via its monetary-policy
instruments, i.e. the facilities used by Danmarks Nationalbank to manage and
remunerate accounts (lending and deposits) with banks and mortgage banks (the
monetary-policy counterparties). The instruments are used to set the monetary-policy
interest rates in view of the fixed-exchange-rate policy and to manage the coun-
terparties' accounts with Danmarks Nationalbank in terms of volume to ensure that
there is always adequate liquidity within the banking system as a whole. The coun-
terparties exchange liquidity in the money market, which includes the market for inter-
bank loan agreements of up to 1 year. The monetary-policy counterparties have access
to two facilities at Danmarks Nationalbank:
Open market operations where, on the last banking day of each week, the coun-
terparties can borrow funds for 7 days against securities as collateral or deposit
funds for 7 days by purchasing certificates of deposit.
Current accounts where the counterparties can place liquidity on demand. The
balance of a current account cannot be negative at the close of the day.
In the weekly open market operations, the monetary-policy counterparties normally
manage their accounts with Danmarks Nationalbank so as to ensure that their total
deposits in current accounts meet the banking sector's expected liquidity requirement
in the subsequent week. If necessary, Danmarks Nationalbank conducts extraordinary
open market operations, in which it sells or buys certificates of deposit to offset
liquidity fluctuations.
An overall limit has been set for the monetary-policy counterparties' total current-
account deposits with Danmarks Nationalbank at the close of the day. The purpose of
these limits is to prevent the build-up of large current-account deposits that may be
used without notice for speculation in interest-rate and exchange-rate changes if the
krone is under pressure. The counterparties may use the certificates of deposit to raise
liquidity in connection with Danmarks Nationalbank's extraordinary open market
operations.
1 For a more detailed description, see Danmarks Nationalbank (2009a).
Monetary Review 2nd Quarter 2011 - Part 2

87
periods. The small banks paid a premium on uncollateralised overnight loans, which rose in the course of the crisis, cf. the left-hand side of Chart 3.2.1 The spread between the overnight interest rates for the individual banks also widened considerably, cf. the right-hand side of Chart 3.2. The small banks were affected when a number of medium-sized banks reduced their usual lending because they themselves ex-perienced funding problems. Compared with the large banks, at the end of 2008 the small banks on average paid an excess interest rate of 0.25-0.5 percentage point for loans in the overnight money market. In a few instances, some of the small banks paid an excess interest rate of 2-3 percentage points compared with the large banks. The results from the uncollateralised overnight market are in accordance with studies of the interest rates on the banks' total MFI loans. Ejerskov (2009) finds that compared with the large banks, the medium-sized banks paid an aver-age premium of almost 1 percentage point on their total loans from other MFIs in the autumn of 2008. A number of the medium-sized banks with considerable funding needs in the money market paid up to 3-4 percentage points more for their loans from MFIs than the average large bank.
1 Based on data from Danmarks Nationalbank's payment system, Kronos. The payments in Danish
kroner between the monetary-policy counterparties are effected via Kronos and settled via accounts with Danmarks Nationalbank. Interbank trading in uncollateralised overnight loans between counterparties can therefore be identified using an algorithm that searches all individual payments in Kronos. See Abildgren and Arnt (2004) for a more detailed description of the method to retrieve data on overnight loans from Kronos. Banks under the Financial Stability Company are excluded from the data from the day they join the Financial Stability Company.
SPREAD BETWEEN AND DEVIATION ACROSS THE BANKS' DEPOSIT RATES IN THE OVERNIGHT MARKET Chart 3.2
-0.1
0
0.1
0.2
0.3
0.4
0.5
0.6
Medium-sized banks Small banks
Overnight spread to large banks
2006 2007 2008 2009 2010
Percentage points
0
0.1
0.2
0.3
0.4
0.5
0.6
0.7
Percentage pointsDeviation of bank overnight interest rate
2006 2007 2008 2009 2010
Note: Source:
The vertical lines are set at 9 August 2007 and 15 September 2008. The interest rates are the banks' interest rates on deposits from Danish banks and foreign T/N providers. Data from Kronos. Last observation: 30 September2010. Left-hand side: Large, medium-sized and small banks refer to the Danish Financial Supervisory Authority's groups 1, 2 and 3. 21-day moving average. Right-hand side: The strong fluctuations in 2006 reflect the 14-day maturities on monetary-policy loans and certificates of deposit. This resulted in large technical fluctuations in the overnight rate in connection with monetary-policy interest-rate adjustments. Danmarks Nationalbank.
Monetary Review 2nd Quarter 2011 - Part 2

88
Danmarks Nationalbank's provision of liquidity In principle, Danmarks Nationalbank only provides liquidity to the mon-etary-policy counterparties once a week in connection with the regular open market operations on the last banking day of the week. In the course of the week the counterparties have to exchange liquidity them-selves via the money market, unless Danmarks Nationalbank conducts extraordinary open market operations.
Danmarks Nationalbank uses an "open window" in its weekly open market operations, leaving banks and mortgage banks free to deter-mine the volume of monetary-policy loans and certificates of deposit at the rates of interest fixed by Danmarks Nationalbank, cf. Box 3.1.
Given the open window in Danmarks Nationalbank's provision of li-quidity, the use of the instruments reflects the counterparties' demand. In the years up to the eruption of the crisis, the banks and mortgage banks had built up considerable holdings of both monetary-policy loans and certificates of deposit, exceeding what could be attributed to the development in the net position, cf. the left-hand side of Chart 3.3. This gross accumulation reflects increased contingency liquidity, primarily in the form of certificates of deposit, which can be used to obtain liquidity through Danmarks Nationalbank's open market operations. The gross positions increased considerably from the summer of 2007 to the end of 2008. At the beginning of December 2008, the gross positions exceeded kr. 280 billion. They were subsequently reduced due to the support of interbank loans under Bank Rescue Package 1, which included a govern-ment guarantee for all deposits and other unsecured claims in the banks.
Because of the interest margin between Danmarks Nationalbank's lending rate and the rate of interest on certificates of deposit intro-
MONETARY-POLICY COUNTERPARTIES' LOANS AND DEPOSITS AT DANMARKS NATIONALBANK Chart 3.3
-300
-200
-100
0
100
200
300
Monetary-policy loans Certificates of depositsCurrent-account deposits Net position
Kr. billion Loans at Danmarks Nationalbank, certificates of deposit and current-account deposits
2001 2002 2003 2004 2005 2006 2007 2008 2009 2010-300
-200
-100
0
100
200
300
Net position excl. current account Direct gross accumulationIndirect gross accumulation
Kr. billion Breakdown of certificates of deposit holdings
2001 2002 2003 2004 2005 2006 2007 2008 2009 2010
Note: Source:
Holdings of loans in foreign currency are not included in the net position. Last observation: 1 September 2010. Danmarks Nationalbank.
Monetary Review 2nd Quarter 2011 - Part 2

89
duced in June 2009, the gross positions have all but disappeared, so the net position corresponds to almost the entire position in current-account deposits and certificates of deposit.
The net position less current-account deposits can be seen as the banks' and mortgage banks' underlying demand for certificates of de-posit. The remaining demand, i.e. the counterparties' gross accumu-lation, can be broken down into a direct accumulation with each counterparty financing its certificates of deposit by raising monetary-policy loans, and an indirect build-up where the counterparties' holdings of certificates of deposit correspond to other counterparties' monetary-policy loans1, cf. the right-hand side of Chart 3.3, which shows an aggre-gation of this breakdown across all banks.
The direct gross accumulation amounted to around kr. 50 billion at the beginning of the crisis in August 2007. Up until the autumn of 2008, the banks increased their use of the direct channel to build up contingency liquidity. The build-up peaked at almost kr. 140 billion in early October 2008. At kr. 170 billion in early December 2008, the indirect gross accu-mulation was also substantial. Hence, the functioning of the money market left something to be desired, since most counterparties with a liquidity surplus preferred to place it at Danmarks Nationalbank rather than relending it. Consequently, counterparties with a funding require-ment had to raise monetary-policy loans rather than borrow in the money market.
In connection with the crisis in the autumn of 2008, the counterparties also expanded their contingency liquidity by increasing their current-ac-count deposits. This applied to the small and medium-sized banks in particular, cf. the right-hand side of Chart 3.4. On days characterised by considerable uncertainty in the market, the counterparties' total cur-rent-account liquidity was typically close to the overall current-account limit of around kr. 25 billion. At the peak of the crisis, the current-ac-count limit was temporarily suspended on a few days at the end of September 2008. Danmarks Nationalbank was more frequently in the market unannounced to absorb liquidity by selling certificates of de-posit. However, there were still only few days on which the balance was either close to or exceeded the current-account limit of just over kr. 25 billion.
All banks and mortgage banks have access to the monetary-policy instruments, enabling them to obtain liquidity in connection with open
1 In practice, the direct gross accumulation is found by identifying counterparties that have both
certificates of deposit and monetary-policy loans. It consists of the holdings of certificates of deposit which can be offset by monetary-policy loans raised by the individual bank. The indirect gross accumulation consists of the holdings of certificates of deposit less the net position and the direct gross accumulation.
Monetary Review 2nd Quarter 2011 - Part 2

90
market operations, e.g. if this is difficult in the money market. The number of counterparties raising monetary-policy loans doubled from August 2007 to the autumn of 2008, cf. the left-hand side of Chart 3.4. Small and medium-sized banks in particular accounted for the increase. The number declined following the introduction of the interest margin between monetary-policy loans and certificates of deposit.
Extraordinary measures introduced by Danmarks Nationalbank1 The open window in Danmarks Nationalbank's open market operations, to which all banks and mortgage banks have access, and the wide range of collateral of approximately kr. 3,000 billion, cf. Poffet (2010), have generally been sufficient to ensure that the banks were able to obtain the necessary liquidity at Danmarks Nationalbank. However, Danmarks Nationalbank established temporary facilities to support the liquidity of the small banks in particular, but they were only used to raise loans from Danmarks Nationalbank to a limited extent. This can primarily be attri-buted to the government guarantee under Bank Rescue Package 1, ef-fective from October 2008. It provided all depositors and unsecured creditors guarantee for their claims in the banks, thereby supporting the interbank exchange of liquidity. These facilities improved confidence among the banks about the availability of liquidity and helped small banks to meet the Danish Financial Supervisory Authority's liquidity re-quirement, cf. section 152 of the Danish Financial Business Act.
In May 2008, Danmarks Nationalbank gave access to borrowing against a new type of bond, loan bills, in order to boost the exchange of
1 The measures introduced by Danmarks Nationalbank to ensure that the banks had sufficient dollar
and euro liquidity are also described in section 6.
COUNTERPARTIES WITH MONETARY-POLICY LOANS AND CERTIFICATES OF DEPOSIT, AND CURRENT-ACCOUNT DEPOSITS BROKEN DOWN BY BANKS Chart 3.4
0
10
20
30
40
50
60
70
Certificates of deposit Monetary-policy loans
NumberNumber of counterparties with loans and certificates of deposit
2006 2007 2008 2009 20100
1
2
3
4
5
6
7
8
Large banks Medium-sized banks Small banks
Kr. billionCurrent-account deposits by size
2006 2007 2008 2009 2010
Note: Source:
The vertical lines are set at 9 August 2007 and 15 September 2008. 21-day moving averages. Right-hand side: The breakdown by large, medium-sized and small banks refers to the Danish Financial Supervisory Authority's groups1, 2 and 3. Last observation: 1 September 2010. Danmarks Nationalbank.
Monetary Review 2nd Quarter 2011 - Part 2

91
liquidity in the money market. Loan bills could be issued by a bank in Denmark and sold to another bank, which could pledge them as collateral to Danmarks Nationalbank, thereby raising liquidity. A total of 49 banks issued loan bills. The outstanding amount increased consider-ably in the autumn of 2008, reaching around kr. 30 billion. In the 1st half of 2009, the outstanding amount was gradually reduced. The loan bills issued were only to a limited extent pledged as collateral for credit from Danmarks Nationalbank. In October and November 2008, when the facility was utilised most, 4-5 banks pledged loan bills totalling up to kr. 1.5 billion. The banks that purchased the loan bills issued could include them in their liquidity, cf. section 152 of the Danish Financial Business Act. The loan bill facility was discontinued as from 17 July 2009, but the loan bills were included in the temporary collateral base until 26 Febru-ary 2011, cf. below.
In September 2008, Danmarks Nationalbank introduced a new tem-porary credit facility. Banks and mortgage banks were given access to borrow an amount (credit facility) depending on their excess capital adequacy. Like the loan bills, the credit facility could be included in the banks' liquidity according to the Danish Financial Business Act. The pur-pose was to prevent liquidity problems for solvent banks as a result of shortages of assets eligible as collateral for loans from Danmarks Natio-nalbank. The lending rate was higher than the rate of interest for Danmarks Nationalbank's open market operations. The overall credit facility peaked at kr. 13.7 billion in April 2009. Of the 38 banks with a credit line only two banks were granted loans. The loans amounted to kr. 10-25 million. The facility was discontinued on 26 February 2011.
In connection with the introduction of loans against excess capital adequacy, the collateral basis for the usual borrowing by banks and mortgage banks from Danmarks Nationalbank was temporarily ex-panded to include quoted shares, investment fund shares and junior covered bonds. The collateral basis was subsequently expanded to include government-guaranteed bank bonds and junior covered bonds with individual government guarantees. Around 20 banks, primarily small ones, used the temporary collateral basis. A number of the tem-porary expansions of the collateral basis expired on 26 February 2011.
Measures introduced by other central banks In view of the financial turmoil and the subsequent financial crisis, several central banks introduced a number of extraordinary measures to ensure confidence among the banks about the availability of the liquid-ity they needed. The measures varied from country to country depend-ing on the countries' monetary-policy instruments. In addition to sup-
Monetary Review 2nd Quarter 2011 - Part 2

92
porting the availability of liquidity, the measures also aimed to improve the general funding opportunities for the banking sector as well as selected markets outside the banking sector. The latter were supported by central-bank lending and purchases of securities.
The measures comprised adjustment of existing instruments, including more frequent open market operations, larger loans, a larger supply of long-term loans, reduction of the interest rate for standing lending facil-ities compared to the interest rate for open market operations and ex-pansion of the collateral base and the number of counterparties with access to central-bank instruments.1 In October 2008, the ECB changed its liquidity allotment procedure in connection with the weekly refinancing operations by introducing full allotment of all bids at a fixed interest rate. The ECB used to determine the supply of credit at an interest rate set by tender.
The Financial Stability Forum2, which includes the ministries of finance, central banks and financial supervisory authorities of major countries, among others, has analysed the factors and underlying weaknesses of the financial system that led to the onset of the financial turmoil in the summer of 2007.3 Central banks are encouraged to ensure that their oprational frameworks are sufficiently flexible to handle extraordinary situations.
Even before the crisis, Danmarks Nationalbank's instruments had some of the above qualities that made it possible to manage the extraordinary liquidity situation.4 The open window, the broad access to the instru-ments and the depth of collateral supported the banks' access to the liquidity they needed.
The functioning of the Danish money market A well-functioning money market is characterised by the counterparties exchanging liquidity on market terms. Danmarks Nationalbank is the central bank in a market economy, and a market solution normally sup-ports efficient liquidity management among its participants and efficient pricing with market interest rates reflecting market assessments of costs and risks and not only the terms of the monetary-policy instruments.
Monetary-policy counterparties use the overnight money market in their ongoing liquidity management. Total daily turnover of overnight lending fell from around kr. 50 billion at the end of July 2007, before
1 For an overview of the various measures, see Danmarks Nationalbank (2009a), Kjærgaard and
Risbjerg (2008), Borio and Nelson (2008), Committee on the Global Financial System (2008), BIS (2009) and ECB (2009a and b).
2 The Financial Stability Forum was replaced by the Financial Stability Board in 2009.
3 Cf. Financial Stability Forum (2008a), succeeded by Financial Stability Forum (2008b).
4 Danmarks Nationalbank no longer provided lending or purchased securities. See Dam and Risbjerg
(2009) for a discussion of this.
Monetary Review 2nd Quarter 2011 - Part 2
93
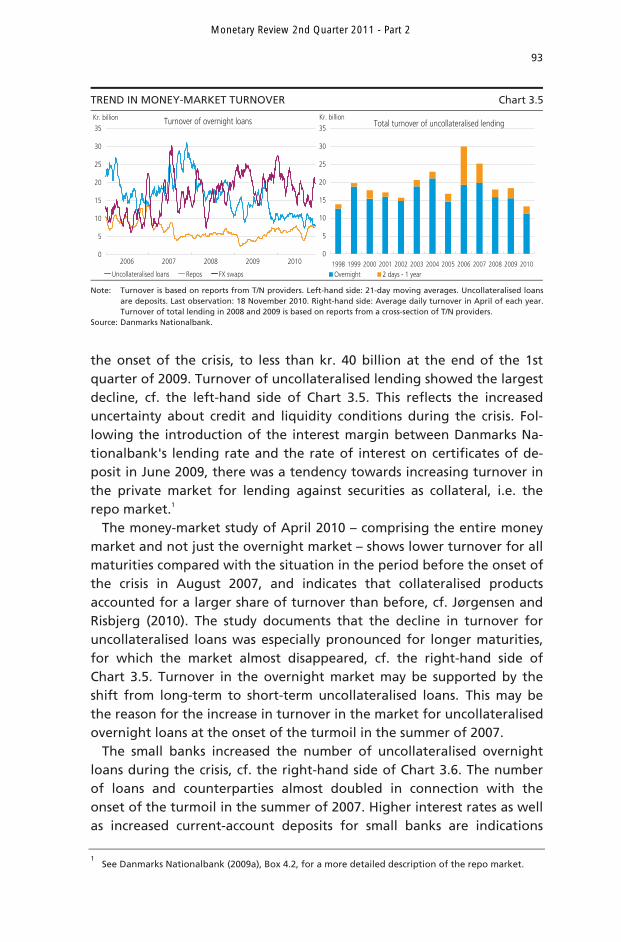
the onset of the crisis, to less than kr. 40 billion at the end of the 1st quarter of 2009. Turnover of uncollateralised lending showed the largest decline, cf. the left-hand side of Chart 3.5. This reflects the increased uncertainty about credit and liquidity conditions during the crisis. Fol-lowing the introduction of the interest margin between Danmarks Na-tionalbank's lending rate and the rate of interest on certificates of de-posit in June 2009, there was a tendency towards increasing turnover in the private market for lending against securities as collateral, i.e. the repo market.1
The money-market study of April 2010 – comprising the entire money market and not just the overnight market – shows lower turnover for all maturities compared with the situation in the period before the onset of the crisis in August 2007, and indicates that collateralised products accounted for a larger share of turnover than before, cf. Jørgensen and Risbjerg (2010). The study documents that the decline in turnover for uncollateralised loans was especially pronounced for longer maturities, for which the market almost disappeared, cf. the right-hand side of Chart 3.5. Turnover in the overnight market may be supported by the shift from long-term to short-term uncollateralised loans. This may be the reason for the increase in turnover in the market for uncollateralised overnight loans at the onset of the turmoil in the summer of 2007.
The small banks increased the number of uncollateralised overnight loans during the crisis, cf. the right-hand side of Chart 3.6. The number of loans and counterparties almost doubled in connection with the onset of the turmoil in the summer of 2007. Higher interest rates as well as increased current-account deposits for small banks are indications
1 See Danmarks Nationalbank (2009a), Box 4.2, for a more detailed description of the repo market.
TREND IN MONEY-MARKET TURNOVER Chart 3.5
0
5
10
15
20
25
30
35
Uncollateralised loans Repos FX swaps
Kr. billion Turnover of overnight loans
2006 2007 2008 2009 20100
5
10
15
20
25
30
35
1998 1999 2000 2001 2002 2003 2004 2005 2006 2007 2008 2009 2010Overnight 2 days - 1 year
Kr. billionTotal turnover of uncollateralised lending
Note: Source:
Turnover is based on reports from T/N providers. Left-hand side: 21-day moving averages. Uncollateralised loans are deposits. Last observation: 18 November 2010. Right-hand side: Average daily turnover in April of each year. Turnover of total lending in 2008 and 2009 is based on reports from a cross-section of T/N providers. Danmarks Nationalbank.
Monetary Review 2nd Quarter 2011 - Part 2

94
that during certain periods they found it difficult to obtain liquidity in the money market. Hence, the use of more counterparties may indicate a reduction in the lenders' credit lines for the small banks so more banks were needed to obtain the desired funding.
The small banks were affected when the medium-sized banks reduced their lending because they themselves experienced funding problems. This picture is supported by the fact that the small banks increased the number of loans from the large banks in order to ensure their funding, cf. the right-hand side of Chart 3.7.
The small banks also increased the volume of their overnight loans from the large banks, cf. the left-hand side of Chart 3.7, cf. the left-hand side of Chart 3.6.
AMOUNT AND NUMBER OF UNCOLLATERALISED OVERNIGHT LOANS TO SMALL, MEDIUM-SIZED AND LARGE BANKS Chart 3.6
0.0
0.5
1.0
1.5
2.0
2.5
3.0
3.5
4.0
4.5
5.0Kr. billion
Large Medium-sized Small
The banks' total loans
2006 2007 2008 2009 20100
5
10
15
20
25
30Number
Large Medium-sized Small
Number of bank loans
2006 2007 2008 2009 2010
Note: Source:
The vertical lines are set at 9 August 2007 and 15 September 2008. 21-day moving averages. Large, medium-sized and small banks refer to the Danish Financial Supervisory Authority's groups 1, 2 and 3. Data from Kronos. Last observation: 30 September 2010. Danmarks Nationalbank.
AMOUNT AND NUMBER OF UNCOLLATERALISED OVERNIGHT LOANS FROM SMALL, MEDIUM-SIZED AND LARGE BANKS TO SMALL BANKS Chart 3.7
0.0
0.2
0.4
0.6
0.8
1.0
1.2Kr. billion
Large Medium-sized Small
Small banks' loans from other banks
2006 2007 2008 2009 20100
2
4
6
8
10
12
14
16Number
Large Medium-sized Small
Number of small banks' loans from other banks
2006 2007 2008 2009 2010
Note: Source:
The vertical lines are set at 9 August 2007 and 15 September 2008. 21-day moving averages. Large, medium-sized and small banks refer to the Danish Financial Supervisory Authority's groups 1, 2 and 3. Data from Kronos. Last observation: 30 September 2010. Danmarks Nationalbank.
Monetary Review 2nd Quarter 2011 - Part 2

95
Conclusion The development in short-term interest rates indicates that during the crisis there were generally no problems with the transmission from the monetary-policy interest rates to the money market or with ensuring sufficient krone liquidity in the banking sector.
Turnover in the money market declined, however. It became concen-trated at the very short end of the market and switched from uncollat-eralised to collateralised lending when growing credit and liquidity risks kept banks from granting long-term uncollateralised loans. The banks increased their loans and deposits at Danmarks Nationalbank at the end of 2008, whereby the short-term interbank market was partly replaced by accounts with Danmarks Nationalbank. In gross terms, the loans and deposits peaked in December 2008 when the banks and mortgage banks' holdings of certificates of deposit exceeded their net position vis-à-vis Danmarks Nationalbank by just over kr. 280 billion.
There are also indications that some small and medium-sized banks' exchange of liquidity in the money market was impeded during certain periods. The analysis in this article shows that the excess interest rate they paid on uncollateralised loans rose substantially. Compared with the large banks, at the end of 2008 the small banks on average paid an exceaa interest rate of 0.25-0.5 percentage point for loans in the overnight money market, which is fundamental to the banks' ongoing liquidity management. In a few instances some of the small banks paid a premium of 2-3 percentage points. The small banks were affected when the medium-sized banks put a stop to their usual lending when they themselves experienced funding problems. The spread in the individual banks' overnight interest rates widened considerably. The small banks' problems obtaining liquidity in the money market during the crisis was also reflected in the fact that they almost doubled the number of coun-terparties for uncollateralised overnight loans. They had to depend on more sources to ensure their funding. The small and medium-sized banks also increased their loans from Danmarks Nationalbank.
The structure of Danmarks Nationalbank's monetary-policy instru-ments proved to be resilient to the crisis, and they were not adjusted during the crisis. The open window in Danmarks Nationalbank's open market operations, the broad access to the instruments and the wide range of collateral supported the banks' access to the liquidity they needed. The extent of loans in connection with Danmarks National-bank's extraordinary measures was very limited, but the measures were important in order to underpin the banks' ability to meet the liquidity requirements in accordance with section 152 of the Danish Financial Business Act.
Monetary Review 2nd Quarter 2011 - Part 2

96
4. THE SPREAD BETWEEN COLLATERALISED AND UNCOLLATERALISED INTEREST RATES
A widened spread between uncollateralised and collateralised money-market interest rates may be a sign of a poorly functioning money market. If measures are to be taken to solve problems in the money market, it is necessary to identify the underlying reasons for the widened money-market spread. The spread can be broken down into a credit risk premium and a liquidity risk premium1, cf. Box 4.1.
If the spread widens due to increasing liquidity risk, measures that improve the functioning of the money market or the banks' liquidity situation may be useful. But if the widening primarily reflects a higher level of credit risk, measures to support the banks' solvency may be more relevant. In addition to knowing the extent of credit or liquidity risk, it is important to know whether the pressures are caused by domestic problems or spillover effects from abroad.
In the wake of the crisis and the turmoil in the international money markets there was increased focus on breaking down the money-market spread.2 As the credit and liquidity risk premiums cannot be observed directly, such a breakdown is subject to uncertainty. The relevant litera-ture proposes several approaches to and many different measures of the credit and liquidity risk premiums. The results depend on the measures used.
In the following, the Danish money-market spread is first broken down by means of a simple but frequently used method. Thereafter, the credit and liquidity risk premiums as well as any spillover effects from the euro area and the USA are estimated using a number of different measures.
A simple breakdown of the money-market spread The Danish money-market spread is calculated as the difference be-tween the uncollateralised interest rate and the swap rate, cf. Box 4.2. The money-market spread is commonly broken down by estimating the credit risk premium based on the price of credit default swaps, CDS. The liquidity risk premium is then defined as the difference between the money-market spread and the estimated credit risk premium.3
A CDS is a contract that insures the buyer against losses on a bond if the bond issuer fails or defaults on its obligations. The price of a CDS –
1 It is in fact an illiquidity risk premium, since the premium is reduced with increasing liquidity.
2 Typically, the authorities will very quickly be able to identify the underlying reasons for the widened
money-market spread, e.g. through direct contact with the market participants. 3 See Kjærgaard and Skjærbæk (2008) for a similar breakdown of the money-market spread in
Denmark.
Monetary Review 2nd Quarter 2011 - Part 2

97
CREDIT AND LIQUIDITY RISK PREMIUMS Box 4.1
Credit risk premium
The credit risk premium is a payment to a lender for assuming the risk that the
borrower will default on its payment obligations. The premium rises when the
probability that the borrower is unable to repay the loan increases. A higher credit
premium may cause the creditworthy banks to reduce their borrowing or withdraw
from the market for uncollateralised loans, after which it will increasingly be risky
borrowers that raise loans in the market (adverse selection). This mechanism will result
in a further reduction of average credit standing in the money market, cf. e.g. Heider,
Hoerova and Holthausen (2009).
Liquidity risk premium
There are two types of liquidity: market liquidity and funding liquidity.
Market liquidity
Market liquidity concerns the liquidity of financial assets. A high level of market
liquidity reflects the possibility of trading large amounts quickly without any
particular price effect. By contrast, a low level of market liquidity means that trading
affects prices. Hence, market liquidity risk can be defined as the risk of incurring costs
as a result of poor liquidity when trading is needed. In general, price-quoting systems
will support market liquidity. Throughout the trading day, the participants in the price
quoting system are obliged to quote bid and ask prices at an agreed maximum
amount and spread on their own account. The participants in the price quoting system
are exposed to market and liquidity risk because they have holdings of securities, and
they are compensated for this via the spread between bid and ask prices. Increased
market volatility will consequently tend to reduce market liquidity, cf. Brunnermeier
and Pedersen (2009).
Funding liquidity
Funding liquidity is the possibility of obtaining liquidity when needed. Funding
liquidity risk is the risk of being unable to obtain sufficient liquidity when needed, or
of a sharp rise in the costs involved. A bank may obtain liquidity via both assets and
liabilities. On the assets side, it may e.g. draw on deposits with other banks, or it may
sell securities. On the liabilities side, it may raise uncollateralised loans or loans with
assets as collateral, e.g. repo loans. Loans raised at short notice are typically short-
term loans, i.e. money-market loans. Hence, well-functioning money markets are
essential to ensure the banks' access to funding liquidity.
Linkage between market liquidity and funding liquidity
Market liquidity and funding liquidity are closely linked. A decrease in the market
liquidity of the assets owned by a bank normally leads to a decrease in the collateral
value of the assets. One reason is that a haircut on repos normally increases with the
degree of illiquidity. If the collateral value of the assets falls, access to funding
liquidity will be reduced. This causality may also go from funding liquidity to market
liquidity. If funding liquidity deteriorates for participants in price-quoting systems and
other central players in the financial markets, their capacity to support market
liquidity will also deteriorate. This may give rise to negative liquidity spirals in times of
Monetary Review 2nd Quarter 2011 - Part 2

98
CONTINUED Box 4.1
crisis when negative shocks to funding liquidity, e.g. by losses related to problems in
the subprime market, reduce market liquidity, which in turn means lower funding
liquidity, and so forth.
During a crisis, market liquidity may also deteriorate due to heightened uncertainty
and market volatility, and to banks tightening their risk management and reducing
their positions. This may lead to a reduction of funding liquidity, which in turn causes
a deterioration of market liquidity, and so forth, cf. Brunnermeier and Pedersen
(2009), Pedersen (2008) and Brunnermeier (2009).
Linkage between credit and liquidity risk premiums
Credit and liquidity risk premiums are also interdependent. If a borrower is hit by a
large unexpected liquidity shock, a low level of funding liquidity will increase the risk
of the borrower being unable to repay the loan. For the lender, a defaulted loan is a
liquidity shock, because the funds of the outstanding payment must be obtained in
some other way.
known as the CDS spread – is the annual payment per krone for this insurance. The spread reflects the premium an investor requires to hold a specific bond compared with a risk-free bond. Hence, the CDS spread may be seen as a proxy for the credit risk premium.1 A simple method to determine that premium is to equate it with the 1-year CDS spread and compare it with the 1-year money-market spread defined as the difference between Cibor and the swap rate.2
Obviously, credit risk premiums can only be calculated on the basis of CDS spreads for those banks for which such spreads are available. For a number of important participants in the uncollateralised Danish money market, no CDS prices are available, so the calculated CDS spread is not necessarily fully representative of the participants in the Danish money market.
At the onset of the crisis in the summer of 2007, the credit risk premium derived from the 1-year CDS spread rose only slowly, cf. Chart 4.1. It gradually gained momentum in late 2007 and early 2008. On the other hand, the substantial widening of the money-market spread from mid-2008 – and particularly in connection with Lehman Brothers' suspen-sion of payments in September 2008 – seems to be generally linked to a higher liquidity risk premium. In the course of 2009 the spread came to
1 Alternatively, the probability that the bond issuer will fail can be derived from the CDS spread. The
credit risk premium can then be determined on the basis of the estimated failure rate and the repayment rate, cf. Manning (2004). In practice, the difference between the CDS spread and the calculated credit risk premium – given risk-neutral investors – is quite small, however.
2 The CDS market is most liquid for maturities of 5 years. As the credit risk premium increases with the
maturity, the 5-year CDS spread cannot be used directly to determine the credit risk premium of e.g. the 1-year money-market spread.
Monetary Review 2nd Quarter 2011 - Part 2

99
predominantly imply a credit risk premium, reflecting that the crisis de-veloped from a liquidity crisis into a credit crisis.1
The use of CDS spreads as a measure of the credit risk premium is not unproblematic. Dick-Nielsen, Feldhütter and Lando (2009) argue that a liquidity risk premium is included in the CDS spread.2 This is reflected by the CDS spread often being wider than the bond spread to the risk-free interest rate. Hence, the assumption that the entire CDS spread is an expression of credit risk may lead to a tendency to overestimate the im-pact of the credit risk premium.
1 See e.g. Holthausen and Pill (2009) and Soultanaeva and Strömqvist (2009) for similar results for the
euro area and Sweden, respectively. In the US market, several studies indicate that the crisis was already a credit crisis when Lehman Brothers suspended payments in September 2008, cf. Sarkar (2009) and Taylor and Williams (2009).
2 See Jensen (2008) for a discussion of factors influencing the CDS spread.
CALCULATION OF THE MONEY-MARKET SPREAD Box 4.2
In analyses of the money-market spread, the uncollateralised interest rate is typically
determined by a reference rate based on rates fixed by a number of banks, e.g. Cibor
in Denmark. There are two overall reasons for this. Firstly, data on actually traded
uncollateralised lending is typically not available, except for the very short-term
money market. Secondly, since a number of financial contracts are linked to the
reference rate, this is of great importance to the economy as a whole. However, the
use of reference rates is not unproblematic, as the actual turnover on which they are
based is sometimes very limited, and they typically react more sluggishly to changed
conditions than actually traded interest rates.
For the collateralised interest rate, the swap rate in swaps exchanging the overnight
rate for a fixed interest rate, called the swap rate, is typically used. On expiry, the
difference between the swap rate and the average overnight rates realised over the
term of a swap is exchanged. Hence, the swap rate reflects the expectations of the
overnight rate, i.e. the swap rate can be interpreted as the expected interest cost of
regularly renewing an uncollateralised overnight loan over the term of the swap. This
strategy entails an interest-rate risk in relation to e.g. a 3-month loan, as the future
overnight rates are not known. The swap rate can also be seen as an expression of a
strategy of overnight borrowing pooled with an interest-rate swap where the
overnight rate is received and the swap rate is paid, cf. Gorton and Metrick (2009),
thereby hedging the interest-rate risk. In practice, there will be a difference between
a bank's overnight lending rate and the overnight reference rate in an interest-rate
swap. From the lender's point of view, the swap rate consequently reflects ongoing
overnight lending with limited credit and liquidity risk.
The spread between the uncollateralised money-market interest rate and the swap
rate can be broken down into credit and liquidity risk premiums. The credit risk
premium can be attributed to the fact that a credit event is more likely to occur
during a period of e.g. 3 months than overnight. The liquidity risk premium reflects
that in the case of 3-month loans the lender will not have access to the liquidity lent
for 3 months, whereas in the case of overnight loans the lender has ongoing access to
the liquidity and may decide whether to provide lending.
Monetary Review 2nd Quarter 2011 - Part 2

100
Estimation of the credit and liquidity risk premiums The simple breakdown above defines the liquidity risk premium as a residual. However, in the literature there are suggested many different measures of the liquidity risk premium in order to allow the credit and liquidity risk premiums to be estimated separately. In the following, we construct a number of measures of the credit and liquidity risk pre-miums, which are subsequently used to break down the Danish money-market spread into three factors, i.e. a credit risk premium, a liquidity risk premium and spillover effects from abroad.
A measure of the credit risk premium in Denmark As described in Box 4.1 above, the credit risk premium is a payment to a lender for assuming the risk of the borrower defaulting on its payment obligations. The adoption of Bank Rescue Package 1 in October 2008 in-cluded a government guarantee for all depositors' and other unsecured creditors' claims in banks. However, the banks mainly determined their credit policies vis-à-vis other banks as if Bank Rescue Package 1 did not exist. Furthermore, some market participants may have been uncertain about how quickly they would be able to receive government funds if a counterparty failed. If the government was only able to honour claims with a certain lag, the failure of a counterparty might lead to losses due to a shortage of liquidity. Consequently, Bank Rescue Package 1 did not
MONEY-MARKET SPREAD AND CDS SPREAD Chart 4.1
0
50
100
150
200
250
300
Money-market spread CDS, Cibor reporting banks
2007 2008 2009 2010
Basis points
Note: Source:
The Chart shows the 1-year CDS spread and the 1-year money-market spread. The 1-year CDS market is not particularly liquid. Hence, there are periods during which the CDS spreads are unchanged. Last observation: 30September 2010. Reuters EcoWin and Bloomberg.
Monetary Review 2nd Quarter 2011 - Part 2

101
eliminate all credit risk, although it is expected to have reduced the credit risk premium.
The literature suggests a number of different credit risk measures. We have constructed three different types of credit measures for Denmark, the first being the CDS spreads, a widely used measure of credit risk, cf. above. The CDS market is most liquid for maturities of 5 years. We use the annual CDS spread for 5-year CDS contracts as a measure of the credit risk premium.
The second measure is daily standard deviations as regards uncollat-eralised money-market interest rates, cf. Sarkar and Shrader (2010). A large difference between the highest and lowest interest rates may imply that some banks find it difficult to obtain loans due to credit risk. We have constructed four such credit measures, i.e. the standard devi-ation of the reports for Cibor, O/N and T/N and of paid short-term money-market interest rates determined on the basis of Kronos data for uncollateralised overnight loans, cf. section 3.1
The third and last measure of the credit risk premium is a ranking measure based on Kronos data.2 The banks are ranked according to the interest they pay on uncollateralised overnight loans. The ranking meas-ure is subsequently calculated as the daily spread between the average interest paid by the seven banks which have, in relative terms, paid the lowest interest rates, and the seven banks which have, in relative terms, paid the highest.3
There is substantial correlation between the different measures. The credit measures based on the standard deviation of the short-term money-market interest rates and the ranking measure match each other closely, cf. Chart 4.2. The ranking measure and the standard deviation based on data from Kronos are the measures that seem to respond most to the adoption of Bank Rescue Package 1. A measure of the liquidity risk premium in Denmark Funding liquidity is normally measured on the banks' balance sheets and is consequently available only at a less than daily frequency. For this reason, measures of funding liquidity are not included, but, as described in Box 4.1 above, there is substantial correlation between market and
1 O/N and T/N rates are trade-weighted averages. Cibor and Kronos rates are non-weighted averages.
2 Based on Schwartz (2010).
3 The measure has been constructed using a panel estimation. The interest rate on individual money-
market loans is estimated using constants for each bank and each day. The constant for each bank is an expression of the relative interest rate the bank pays compared with the other banks, and it can consequently be used as a ranking measure. Only banks that are active for at least 10 per cent of the days are included. In addition, the banks with the highest and lowest constant, respectively, are removed. Seven banks have been selected for each of the two groups as this was the lowest number that would ensure a ranking measure for which only few observations were missing.
Monetary Review 2nd Quarter 2011 - Part 2

102
funding liquidity.1 Hence, the development in market liquidity can be used as a measure of funding liquidity.
As with the credit risk premiums, a number of different measures of market liquidity based on daily observations are mentioned in the literature. We have constructed four measures. The first measure is the yield spread between bonds issued by Ørestadsselskabet (Ørestad Devel-opment Corporation) and the government, respectively, maturing in 2015.2 As the credit risk is identical for the two bonds, the yield spread equals the liquidity risk premium.3
The second measure is an Amihud index measuring the percentage price change for a given trade volume. We have constructed a weighted Amihud measure based on Amihud indices for Danish government and mortgage bonds, cf. Buchholst, Gyntelberg and Sangill (2010). Each in-dex was given a weight corresponding to the share of the bond type in question of the total nominal outstanding volume.
The third measure is a Bollen Whaley index, cf. Schwartz (2010).4 The index is calculated as the relationship between the bid and ask spread for 2-year government bonds and the volume that can be traded at the given bid and ask prices.5 The development in the index is primarily determined by the price-quoting systems applying at a given time. Price-
1 However, we have tested two measures of funding liquidity, i.e. the banks' current-account deposits
with Danmarks Nationalbank and their holdings of certificates of deposit. None of the measures are significant.
2 As Ørestad Development Corporation is a general partnership owned by the Danish government and
the City of Copenhagen, the government can be made liable for any losses of the company. Hence, its issuance is fully government-guaranteed, cf. Danmarks Nationalbank (2003), p. 103. We have also tested A/S Storebælt (the Great Belt Bridge) which resulted in almost identical estimations, albeit with slightly lower explanatory power.
3 The maturity reduction will reduce the spread on an ongoing basis, but the impact is assessed to be
minimal. 4 Here, the index is calculated as an illiquidity index, i.e. the reciprocal of the Bollen Whaley index.
5 The calculations are based on MTS data, see e.g. Danmarks Nationalbank (2009b), pp. 64 ff.
CREDIT MEASURES Chart 4.2
Standard deviations and ranking measure
0.0
0.1
0.2
0.3
0.4
0.5
0.6
O/N loans Shor-term money-market loans T/N loans Ranking measure
Percentage points
2006 2007 2008 2009 2010
Cibor credit measures
0.00
0.05
0.10
0.15
0.20
0.25
0
50
100
150
200
250
Cibor, standard deviation CDS, Cibor reporting banks (right-hand axis)
Percentage points
2006 2007 2008 2009 2010
Basis points
Note: Source:
Left-hand side: Data has been smoothed using simple exponential smoothing. Besides, four outliers in 2006 have been removed. Last observation: 30 September 2010. Own calculations based on data from Reuters EcoWin, Bloomberg, Nordea Analytics and Kronos.
Monetary Review 2nd Quarter 2011 - Part 2

103
quoting systems are agreements between the price quoters and Govern-ment Debt Management under which the price quoters are obliged to quote bid and ask prices within fixed spreads and for fixed amounts. If the conditions of the agreement are changed, the index may show dis-crete leaps.
The fourth and last measure is the implied option volatility in the US equity market, the VIX index.1 In many studies, this index is seen as an expression of the general market risk, cf. McAndrews, Sarkar and Wang (2008) and Sarkar and Shrader (2010). Increased market volatility may reduce market liquidity, and Brunnermeier and Pedersen (2009) see VIX as an underlying liquidity factor.
There is considerable overlap between the four measures and particu-larly between VIX and Amihud, cf. the right-hand side of Chart 4.3. On the other hand, the spread between government-guaranteed bonds and government bonds as well as the Bollen Whaley index show somewhat different development patterns.
International impact According to the covered interest-rate parity, the interest rate on assets that are identical apart from the currency in which they are issued should be the same when the currency risk is hedged. If the covered interest-rate parity remains unchanged, the money-market spread will be almost the same across countries, cf. Box 2.1, and the spillover effect from abroad may be substantial.
The covered interest-rate parity is not always met, however, and in several instances deviations have been observed for prolonged periods in connection with turmoil in the financial markets. The deviations may be attributable to a number of factors, including large transaction costs or considerable credit and liquidity risk in individual markets.
Empirical studies indicate that large deviations from the covered inter-est-rate parity for a prolonged period and thus differences in the money-market spreads across countries are mainly attributable to major credit risk variations across markets, cf. Alper and Ardic (2010). If banks borrowing in a market are generally less creditworthy than banks in other markets, higher interest rates will reflect compensation for in-creased risk rather than an unrealised excess return. For banks with excess liquidity, however, lending in a market with limited liquidity will be an attractive option if it provides a higher return and the credit risk is the same.
1 VIX is a measure of the implied expected volatility derived from market-based option prices. Higher
option prices signal higher expected volatility, since higher volatility increases the probability of the option getting "in-the-money".
Monetary Review 2nd Quarter 2011 - Part 2

104
First, the money-market spread in the euro area is used as a measure of international contagion. Measures of the international credit and li-quidity risk premiums in both the euro area and the USA are subse-quently applied to make it possible to identify the channels through which international contagion was particularly pronounced.
As a measure of the credit risk premium in the euro area, an average of the 5-year CDS spreads for selected Euribor reporting banks is used, cf. Eisenschmidt and Tapking (2009). For the USA, the 5-year CDS spreads for selected systemically important US banks are used, cf. Coffey, Hrung and Sarkar (2009). There is a high level of covariance between the three CDS indices.1
The yield spread between bonds maturing in July 2015 and issued by the German Kreditanstalt für Wiederaufbau and the German govern-ment, respectively, is used as a measure of the liquidity risk premium in the euro area. For the USA, the difference between 2-year benchmark bonds issued by Fannie Mae and the US government is used.
Estimations We estimate the Danish money-market spread on the basis of the Danish and international credit and liquidity measures on a daily basis. The model is a simple OLS model based directly on the levels so that it can be used to break down the money-market spread. We use Newey-West standard deviations adjusting for autocorrelation and heteroskedasticity in the error terms. The following equation is estimated:
1 While the correlation between the CDS spreads for Cibor and Euribor reporting banks is 0.98, the
correlation between the CDS spreads for Cibor reporting banks and US banks is 0.88.
LIQUIDITY MEASURES Chart 4.3
0.00
0.01
0.01
0.02
0.02
0.0
0.4
0.8
1.2
1.6
Bollen Whaley indexSpread, government-guaranteed to sovereign borrowers (right-hand axis)
Percentage points
2007 2008 2009 20102006
Index
0
10
20
30
40
50
60
70
80
90
0.000
0.005
0.010
0.015
0.020
0.025
0.030
0.035
0.040
0.045
VIX Amihud (right-hand axis)
IndexIndex
2007 2008 2009 20102006
Note: Source:
The Amihud index has been smoothed using simple exponential smoothing, the smoothing parameter beingestimated by minimising sums of the squared forecast errors. Last observation: Bollen Whaley index: 2 August2010, Spread: 20 September 2010, VIX: 30 September 2010, Amihud: 2 June 2010. Own calculations based on data from Reuters EcoWin, Bloomberg, Nordea Analytics and Kronos.
Monetary Review 2nd Quarter 2011 - Part 2

105
where SpreadDK is the money-market spread in Denmark, and Liquid and Credit are measures of the liquidity and credit risk premium, respect-ively, in Denmark, the euro area and the USA. α is a constant.
All the credit and liquidity measures used are significant and have the expected sign in estimations where they are included as the only credit or liquidity measure. The estimations are not shown.
For market liquidity, the best individual measure is the yield spread between government bonds and government-guaranteed bonds. Com-bining the three Danish liquidity measures, i.e. all the liquidity measures except VIX, using a principal component analysis, results in a liquidity measure that improves the explanatory power.1 Consequently, we choose this index in the estimations.2
The highest explanatory power among the measures of the credit risk premium is obtained using the CDS spread. Combining several credit measures in a principal component analysis does not result in an index with higher explanatory power than the CDS spread alone. However, we choose to include the ranking measure which is considered to be the purest credit measure we have.
Model 1 estimates the Danish money-market spread solely using Dan-ish measures. The spillover effect from abroad is included in model 2 via the money-market spread in the euro area. Model 3 models the international contagion using the measures of international credit and liquidity risk premiums. Given the reservations related to using the CDS spreads as a measure of the credit risk premium, we supplement the estimations with a model 4, in which the credit risk premium in Denmark is based only on the ranking measure, and the credit measures for the euro area and the USA are omitted on the grounds that spillover effects across markets are mainly caused by differences in liquidity premiums.
In general, high explanatory powers are obtained, and significant variables have the expected signs, cf. Table 4.1. There is considerable
1 In a principal component analysis, PCA, a purely mathematical partition is performed to break down
the data into a number of uncorrelated components called principal components. The first component explains as much of the data variation as possible, and the subsequent components each explains as much as possible of the remaining data variation. If the data mainly follows a uniform pattern, the first component will be able to explain most of the data variance, and that component may therefore summarise the data without losing important information. See e.g. Campbell, Lo and MacKinlay (1997) for a review of PCA.
2 We have also constructed a liquidity measure based on a PCA of all four liquidity measures, i.e.
including VIX. This measure increases the explanatory power marginally, but to get a measure of liquidity in Denmark we choose to use the measure without VIX.
tUSAt
USAt
EURt
EURt
DKt
DKt
DKt
CreditLiquidCredit
LiquidCreditLiquidSpread
654
321
Monetary Review 2nd Quarter 2011 - Part 2

106
autocorrelation and heteroskedasticity in the error terms, which is why Newey-West standard deviations are shown.
Model 1 estimates the money-market spread solely using Danish meas-ures of the credit and liquidity risk premiums, i.e. the weighted measure of liquidity and the Danish CDS spread and the credit ranking measure. The measures of both premiums are highly significant. The weight of the ranking measure is small, so the credit risk premium is driven mainly by the development in the CDS spread. The constant is significantly posi-tive, indicating that the Danish credit and liquidity measures cannot fully explain the development in the Danish money-market spread.
Breaking down the money-market spread on the basis of model 1 gives a picture similar to the simple breakdown based on the CDS spread alone, cf. Chart 4.1. The estimation implies a significant positive con-stant, indicating that the estimated level of the pre-crisis money-market spread is too high. Accordingly, the model fails to adequately capture the great leap in the level in early August 2007. While the credit risk
REGRESSION RESULTS FOR THE DANISH MONEY-MARKET SPREAD Table 4.1
Right-hand-side variables Model 1 Model 2 Model 3 Model 4
Credit premium, DK (CDS spread) ................ 0.41***
(0.04) 0.35***
(0.02) 0.33**
(0.16) ---
Credit premium, DK (ranking measure) ....... 67.74***
(20.76) ---1
---2
39.84*
(22.66)
International contagion (spread, EUR) ......... ---
51.38***
(3.17) ---
---
Credit premium, EUR ..................................... ---
---
-0.04
(0.14) ---
Credit premium, USA ..................................... ---
---
0.10***
(0.09) ---
Liquidity premium, DK .................................. 13.87***
(1.66) 6.64***
(0.83) 9.26***
(2.12) 6.09***
(2.05)
Liquidity premium, EUR ................................ ---
---
0.29*
(0.17) 1.34***
(0.12)
Liquidity premium, USA ................................ ---
---
0.18*** (0.06)
0.15***
(0.05)
Constant ......................................................... 9.77**
(4.32) 3.16
(2.55) 2.73
(4.51) -4.26
(5.40)
R2 ..................................................................... 0.89 0.94 0.90 0.87
Note: * 10 per cent significance level, ** 5 per cent significance level and *** 1 per cent significance level. The figures in parentheses indicate Newey-West standard deviations adjusting for autocorrelation and heteroskedasticity.Estimation period: daily observations from 4 January 2006 to 1 June 2010.
Source: Own calculations based on data from Reuters EcoWin, Bloomberg and Nordea Analytics. 1 The sign of the ranking measure becomes negative and is consequently omitted. This may create a bias towards
overestimating the credit risk premium. 2 If the ranking measure is included, none of the credit risk premium measures become significant as a result of
multicollinearity.
Monetary Review 2nd Quarter 2011 - Part 2

107
increases at the beginning of the crisis, this is not enough to fully ex-plain the widening of the money-market spread, cf. Chart 4.4. In the period after the failure of Lehman Brothers, the development was pri-marily driven by higher liquidity risk. This changed in the course of 2009, however, in that credit risk became the main driver.
The model is improved by including the money-market spread in the euro area as an overall measure of international credit and liquidity risk premiums. The constant is no longer significant, and the explanatory power increases.
When the money-market spread is broken down using model 2, the leap in the money-market spread in August 2007 is captured fairly well, cf. Chart 4.5. Hence, at the beginning of the crisis, the Danish money-market spread was driven primarily by external factors represented by the money-market spread of the euro area, which, according to the ECB, was mainly driven by liquidity risk premiums during that period, cf. Holthausen and Pill (2010). From mid-2009, the spillover effect declined, and subsequently the spread was mainly driven by the Danish credit risk premium.
In model 3 the money-market spread of the euro area is replaced by measures of international credit and liquidity risk premiums. According to this model, international liquidity risk premiums in particular drove up the Danish money-market spread at the beginning of the crisis, cf.
FACTORS OF THE DANISH MONEY-MARKET SPREAD, MODEL 1 Chart 4.4
0
20
40
60
80
100
120
140
160
180
200
Credit, DK Liquidity, DK Actual spread
20102007 2008 2009
Basis points
Note: Source:
Based on model 1 in Table 4.1. The breakdown does not add up to the actual spread as the estimation includes unexplained residuals. The constant is broken down into credit and liquidity risk premiums, leaving the relativeweight between the two unchanged. Last observation: 1 June 2010. Own calculations based on data from Reuters EcoWin, Bloomberg and Nordea Analytics.
Monetary Review 2nd Quarter 2011 - Part 2

108
Chart 4.6. This is in line with other empirical studies indicating that diffe-rences in credit risk among the money markets during periods of finan-cial turmoil will typically be reflected in deviations from the covered
FACTORS OF THE DANISH MONEY-MARKET SPREAD, MODEL 2 Chart 4.5
0
20
40
60
80
100
120
140
160
180
200
Credit, DK Liquidity, DK Liquidity, EUR Actual spread
20102007 2008 2009
Basis points
Note: Source:
Based on model 2 in Table 4.1. The breakdown does not add up to the actual spread as the estimation includes unexplained residuals. Last observation: 1 June 2010. Own calculations based on data from Reuters EcoWin, Bloomberg and Nordea Analytics.
FACTORS OF THE DANISH MONEY-MARKET SPREAD, MODEL 3 Chart 4.6
0
20
40
60
80
100
120
140
160
180
200
Credit, DK Liquidity, DK Liquidity, EUR Liquidity, USA Actual spread
20102007 2008 2009
Basis points
Note: Source:
Based on model 3 in Table 4.1. The breakdown does not add up to the actual spread as the estimation includesunexplained residuals. Last observation: 1 June 2010. Own calculations based on data from Reuters EcoWin, Bloomberg and Nordea Analytics.
Monetary Review 2nd Quarter 2011 - Part 2

109
interest-rate parity rather than a spillover effect on the money-market spreads. At the beginning of the crisis, our measures of international credit and liquidity risk premiums cannot fully explain the development in the Danish money-market spread, however. After Lehman Brothers' suspension of payments, the Danish liquidity risk premium came to play a certain role. As liquidity returned to the money markets in the course of 2009, greater weight was attached to Danish credit risk premiums in model 3, though not as much as in model 1, cf. Chart 4.4 above.
In order to assess the importance of the CDS spreads in the estimation, all CDS spreads are omitted in model 4. The credit risk premium in Denmark is measured using the ranking measure, but alternative meas-ures of the credit risk premiums in the euro area and the USA are not included on the grounds that international contagion takes place mainly via liquidity risk premiums.1 This produces a markedly different result with the credit risk premium having little impact on the Danish money-market spread and the development being driven predominantly by the liquidity risk premium in the euro area, cf. Chart 4.7. Even though we have omitted the measures of the credit risk premiums in both the euro area and the USA, the explanatory power of the model declines very little.
1 If the CDS spread for the euro area is included, models 3 and 4 become practically identical. The
reason is the very considerable overlap between the CDS spreads for Denmark and the euro area.
FACTORS OF THE DANISH MONEY-MARKET SPREAD, MODEL 4 Chart 4.7
0
20
40
60
80
100
120
140
160
180
200
Credit, DK Liquidity, DK Liquidity, EUR Liquidity, USA Actual spread
20102007 2008 2009
Basis points
Note: Source:
Based on model 4 in Table 4.1. The breakdown does not add up to the actual spread as the estimation includesunexplained residuals. Last observation: 1 June 2010. Own calculations based on data from Reuters EcoWin, Bloomberg and Nordea Analytics.
Monetary Review 2nd Quarter 2011 - Part 2

110
Model 4 is inconsistent with other data, however. Hence, the decreasing turnover in the uncollateralised money market, cf. section 3, indicates a substantial credit risk premium. Robustness If the period is shortened to the beginning of 2009, the estimated money-market spreads in 2009 and 2010 are generally lower than the observed spreads. This is particularly true in model 2, where the inter-national contagion is described by means of the money-market spread in the euro area, but also to a lesser degree in models 3 and 4.
Estimation of a long-term model, in which the lagged value of the Danish money-market spread is included on the right-hand side of the equation, generally implies that the importance of the Danish credit risk premium increases without substantially changing the results.
It should be noted that after the adoption of Bank Rescue Package 1, the estimated credit risk premiums generally did not fall. This is con-sistent with other data, e.g. the falling turnover in the uncollateralised money market since the beginning of the crisis. The high estimated credit risk premiums after Bank Rescue Package 1 presumably reflect the fact that many banks determined their credit policies as if Bank Rescue Package 1 had not been adopted.
A comparison of the four models shows the importance of the measures selected for the credit and liquidity risk premiums to the breakdown of the money-market spread. This also illustrates why there is no broad consensus among economists as to whether the money-market spreads were driven by credit or liquidity risk during the crisis, cf. Holthausen and Pill (2010).
At least two factors make it difficult to break down the money-market spread. Firstly, there are considerable data problems, and no single measure of the credit and liquidity risk premiums seems to be clearly better than others. The CDS spread is among the most frequently used measures of the credit risk premium, but it also has its shortcomings. Our analysis shows that including CDS spreads typically increases the importance of the credit risk premium. It is not currently possible to determine whether this is due to the fact that liquidity risk premiums are included in the CDS spreads.
Secondly, the credit and liquidity risk premiums are not independent of each other, so higher liquidity risk premiums may be the underlying reason for the increasing credit risk premiums and vice versa. Other studies have also failed to find a solution to this problem.
Monetary Review 2nd Quarter 2011 - Part 2

111
Conclusion The analyses indicate that the crisis in Denmark up to 2009 was primarily a liquidity crisis driven by the development in liquidity conditions in the euro area. At the beginning of the crisis, there was only a limited need for policy measures aiming to reduce the Danish liquidity and credit risk pre-miums, one underlying factor being the flexible structure of Danmarks Nationalbank's monetary-policy instruments. However, after the failure of Lehman Brothers, the liquidity situation, nationally and especially inter-nationally, deteriorated substantially. This called for a number of policy measures, including swap lines with the Fed and the ECB and Bank Rescue Package 1, with a view to facilitating the banks' access to international liquidity and supporting their exchange of liquidity.
In the course of 2009, the crisis evolved from a liquidity crisis into a credit crisis. The exceptionally wide money-market spreads were reduced as liquidity returned to the markets in the wake of massive interventions by central banks worldwide. But at the same time it also became clear that the banks' solvency was under pressure following major losses, and that policies aiming to improve the liquidity situation were insufficient.
5. THE DANISH KRONE AND THE FOREIGN-EXCHANGE MARKET DURING THE CRISIS
In the wake of Lehman's suspension of payments, investors opted out of minor currencies. This led to exchange-rate pressure, and minor cur-rencies with floating exchange rates, e.g. Swedish kronor, depreciated. As a result of the Danish fixed-exchange-rate policy against the euro, Danmarks Nationalbank made intervention purchases for considerable amounts and raised its monetary-policy interest rates while other central banks generally lowered theirs. But Danmarks Nationalbank's measures contributed to stabilising the krone at a level close to its central rate against the euro. The central government's issuance of 30-year govern-ment bonds, which were in high demand from the Danish pension sector, and Bank Rescue Package 1 also contributed to stabilising the situation. The krone was stable during the crisis.
Since borrowing in foreign currency via FX swaps was reduced because market conditions made it cumbersome and expensive, demand for foreign currency increased in relation to kroner, putting pressure on the krone.
The transmission from monetary-policy interest rates to the krone rate was weakened substantially during the crisis. According to experience from the autumn of 2008, very large amounts may be needed for inter-vention purposes if the krone is under pressure, so a substantial foreign-
Monetary Review 2nd Quarter 2011 - Part 2

112
exchange reserve is necessary. Danmarks Nationalbank more than doubled the foreign-exchange reserve in relation to the situation before the autumn of 2008 when the pressure on the krone really set in.
This section elaborates on the foreign-exchange market, the situation of pressure on the krone and Danmarks Nationalbank's response. The foreign-exchange market and the pressure on the krone during the crisis1 Denmark conducts a fixed-exchange-rate policy against the euro, so monetary and foreign-exchange policies are aimed at keeping the krone stable against the euro.2 The krone was stable during the crisis without showing remarkably large fluctuations, cf. Chart 5.1.
The stable development in the krone rate is attributable to extra-ordinary factors in the foreign-exchange market and large capital flows which were addressed by the introduction of a number of measures.
The culmination of the crisis in the autumn of 2008 resulted in plummeting turnover in the foreign-exchange markets. While the drop was pronounced for the dollar, and the dollar swap market was period-ically closed, turnover of kroner and euro also fell considerably.3 The effect on the foreign-exchange markets can be illustrated by the devel-opment in the value of transactions settled via CLS (Continuous Linked Settlements)4. Here, the average value of daily foreign-exchange trans-actions involving kroner fell by 9 per cent from September to October 2008, while the value of transactions involving dollars and euro fell by 14 and 5 per cent, respectively, cf. Chart 5.2.
The lower turnover during the crisis was driven especially by a drop in the turnover of FX swaps, which account for most of the turnover in the foreign-exchange market.5
The pressure on the krone in the autumn of 2008 reflected a general tendency among international investors to withdraw from minor cur-rencies. Non-resident banks reduced their deposits with Danish banks considerably, and non-residents also withdrew from Danish securities, cf.
1 See also Bernstein (2010) for a description of the situation in relation to the krone during the crisis.
2 The formal framework for Denmark's fixed-exchange-rate policy is the European Exchange Rate
Mechanism, ERMII. 3 See Straarup (2010) for a description of the crisis from the perspective of Danske Bank.
4 The system is used primarily by banks and investment associations to settle various types of foreign-
exchange transactions, including spot transactions, forward contracts and FX swaps. The system limits the counterparty risk on settlement, as the two legs of the foreign-exchange transaction are settled at the same time. The enhanced security generally makes it more attractive for banks and investment associations to make transactions in the foreign-exchange market.
5 See Sinding-Olsen (2010) for a description of the development in turnover in the Danish foreign-
exchange market based on a survey of the foreign-exchange market coordinated by the Bank for International Settlements (BIS). This survey is conducted every three years, most recently in April 2010. No official statistics are available of turnover broken down by instruments showing the development during the crisis in the autumn.
Monetary Review 2nd Quarter 2011 - Part 2

113
GROSS VALUE OF FOREIGN-EXCHANGE TRANSACTIONS IN DOLLARS AND KRONER IN CLS Chart 5.2
0
500
1,000
1,500
2,000
2,500
3,000
0
50
100
150
200
250
300
Dollars Kroner (right-hand axis)
Billion dollars Kr. billion
2004 2005 2006 2007 2008 2009 2010
Note: Source:
Monthly averages of daily transactions. In the calculation of the gross value of transactions, FX swaps count double, as each leg of a transaction involves separate payment instructions in the currency concerned. Last observation: May 2010. CLS Bank International.
THE KRONE RATE AGAINST THE EURO AND THE VOLATILITY OF THE KRONE Chart 5.1
7.25
7.30
7.35
7.40
7.45
7.50
7.55
7.60
7.65 0.00
0.02
0.04
0.06
0.08
0.10
0.12
0.14
0.16
Market rate Central rate Band limits (+/- 2,25 per cent) Volatility (right-hand axis)
Kroner per euro Per cent
1999 2000 2001 2002 2003 2004 2005 2006 2007 2008 2009 2010
Note: Source:
Central rate and band limits in ERM2. Inverted scale on the left-hand axis. The volatility is a 21-day moving standard deviation in per cent. Last observation: 30 December 2010. Danmarks Nationalbank.
Monetary Review 2nd Quarter 2011 - Part 2

114
Chart 5.3. During the last four months of 2008, non-resident banks reduced their deposits with the banks by kr. 302 billion. Foreign-ex-change deposits accounted for around 80 per cent of non-residents' reduction of bank deposits.
Furthermore, there were indications of some investors speculating in Danmarks Nationalbank not being able to maintain the fixed-exchange-rate policy, cf. Bernstein (2010).
The money-market spread, measured by the spread between Dan-marks Nationalbank's lending rate and the ECB's marginal rate of inter-est in its weekly refinancing operations, was generally very low from the onset of the turmoil in the summer of 2007 until the krone came under pressure in September and October 2008, and for a period it was nega-tive, cf. Chart 5.4. The narrow interest-rate spread could be attributable to euro area banks requesting far more liquidity than what was offered in connection with the ECB's weekly refinancing operations. This caused the ECB's marginal rate to rise to a high level.1 Due to the shortage of euro liquidity and the narrowing of the monetary-policy interest-rate
1 Before 8 October 2008, the ECB allotted liquidity at the weekly tenders at a variable interest rate and
subsequently at a fixed interest rate. The change was announced on 8 October, taking effect from the refinancing operation settled on 15 October 2008.
NON-RESIDENTS' DEPOSITS WITH DANISH BANKS AND ACCUMULATED PORTFOLIO INVESTMENTS Chart 5.3
100
200
300
400
500
600
700
800
900
-100
0
100
200
300
400
500
600
Deposits with banks Accumulated portfolio investments (right-hand axis)
Kr. billion Kr. billion
2006 2007 2008 2009 2010
Note: Source:
Danish banks are defined as the Danish Financial Supervisory Authority's groups 1-4, excluding the branches of non-resident banks. Bank deposits exclude deposits of non-resident units and central banks. The portfolio investments have been accumulated since early 2006. Last observation: December 2010. Danmarks Nationalbank.
Monetary Review 2nd Quarter 2011 - Part 2

115
spread, Danmarks Nationalbank had to unilaterally raise its monetary-policy interest rates already in May 2008.
The shortage of euro and dollars in Denmark was exacerbated by non-resident investors withdrawing their foreign-exchange investments. This led to increased demand for euro and dollar funding via FX swaps and contributed to further dislocations in the FX swap market. See Box 2.1 for a description of the underlying mechanism.
The same applies to non-resident investors in Danish securities who had financed their investments in kroner via FX swaps (loans in kroner against foreign exchange as collateral). When the investors withdrew, demand for kroner via FX swaps was reduced.
The dislocation in the FX swap market in itself made it expensive and difficult to hedge funding of assets in e.g. dollars and euro via FX swaps. Due to the difficulties in obtaining foreign currency funding, some bor-rowers repaid their short-term loans in foreign currency rather than extending them as they matured.1 This contributed to the pressure on
1 Banks are obliged by law to predominantly hedge their currency risk. The banks' customers financed
e.g. dollar-denominated assets by loans in kroner rather than dollars, thereby failing to match the foreign-exchange exposure of the assets with that of the liabilities.
MONEY-MARKET INTEREST-RATE SPREAD AND 3-MONTH INTEREST-RATE SPREAD BETWEEN DENMARK AND THE EURO AREA Chart 5.4
-0.5
0.0
0.5
1.0
1.5
2.0
2.5
Monetary-policy spread Uncollateralised lending FX swap Interest-rate swap
Percentage points
2007 2008 2009 2010
Note: Source:
The money-market spread is the spread between Danmarks Nationalbank's lending rate and the ECB's marginal rate of interest on its main refinancing operations. In October 2008, the ECB, which had previously allotted agiven amount of liquidity at a variable interest rate, introduced full allotment at a fixed interest rate. The interest-rate spread for uncollateralised lending is the spread between 3-month Cibor and Euribor. For interest-rate swaps it is the difference between the fixed 3-month interest rate in a swap (at the overnight interest rate) in Denmark and the euro area. The implied interest-rate spread from FX swaps is given by (F-S)/S, where F is the forward rate between kroner and euro (kroner per euro), and S is the spot rate, cf. Box 2.1. Reuters EcoWin and Danmarks Nationalbank.
Monetary Review 2nd Quarter 2011 - Part 2

116
the krone, because demand for foreign currency increased in step with the repayment of the currency loans.1
Danmarks Nationalbank's response To stabilise the krone, Danmarks Nationalbank intervened in the foreign-exchange market, buying kroner against foreign exchange for a considerable amount from late September to early October 2008, cf. Chart 5.5. However, this proved insufficient to withstand the pressure on the krone, and in accordance with the fixed-exchange-rate policy Dan-marks Nationalbank unilaterally raised its monetary-policy interest rates to widen the monetary-policy interest-rate spread. As from 8 October 2008, the lending rate and the rate of interest on certificates of deposit were raised by 0.4 percentage point, and the discount rate and the current-account rate were raised by 0.25 percentage point. Danmarks Nationalbank subsequently continued to intervene in the foreign-exchange market. On 8 October around midday, the ECB announced a reduction of the interest rate by 0.5 per cent on the basis of the
1 Similar trends were seen in a number of countries, cf. Allen and Moessner (2010a). It is normally
possible to hedge funding of long-term foreign-currency assets by means of short-term FX swaps that are subject to regular renewal, cf. Danmarks Nationalbank (2004), pp. 51-53.
MONEY-MARKET INTEREST-RATE SPREAD BETWEEN DENMARK AND THE EURO AREA AND DANMARKS NATIONALBANK'S INTERVENTION PURCHASES OF FOREIGN EXCHANGE Chart 5.5
-1.5
-1.0
-0.5
0.0
0.5
1.0
1.5
2.0
2.5
-15
-10
-5
0
5
10
15
20
25
Intervention purchases (right-hand axis) Monetary-policy spread
Percentage points Kr. billion
2007 2008 2009
Note: Source:
Daily interventions. The money-market spread is the spread between Danmarks Nationalbank's lending rate and the ECB's marginal rate of interest on its main refinancing operations. In October 2008, the ECB, which had previouslyallotted a given amount of liquidity at a variable interest rate, introduced full allotment at a fixed interest rate. Last observation: 30 December 2009. Danmarks Nationalbank.
Monetary Review 2nd Quarter 2011 - Part 2

117
intensified financial crisis,1 causing the spread to widen further when Danmarks Nationalbank maintained its monetary-policy interest rates.
Despite the widening of the interest-rate spread, the pressure on the krone continued due to the outflow of foreign exchange. At the end of October, Danmarks Nationalbank therefore intervened in the foreign-exchange market again. Its interventions in October totalled around kr. 64 billion net. On 24 October, Danmarks Nationalbank raised the lend-ing rate and the rate of interest on certificates of deposit by a further 0.5 percentage point, widening the spread to the ECB's interest rate to 1,75 percentage points.
The issuance of 30-year government bonds for a total of kr. 90 billion in November and December 2008 also had substantial foreign-exchange effect. In the pension sector there was strong demand for long-term Danish government bonds to hedge long-term liabilities in kroner. The sale supported the demand for kroner to the extent the pension sector sold European bonds to buy Danish government securities.2 Finally, the introduction of Bank Rescue Package 1 in early October 2008 also had a highly stabilising effect on the situation.
During the crisis in the autumn of 2008, the monetary-policy interest-rate spread to the euro area widened by 1.40 percentage points, and Danmarks Nationalbank sold currency for kr. 64 billion. This illustrates that the transmission from monetary-policy interest rates to the ex-change rate weakens during currency crises.
From the end of October the krone appreciated again, and Danmarks Nationalbank was able to repurchase foreign exchange over the next months. For this reason, it was possible to gradually lower the monetary-policy interest rates, thereby narrowing the spread to the ECB's interest rate. Subsequently, the foreign-exchange reserve was gradually built up through government borrowing and especially via intervention pur-chases of foreign exchange, cf. Chart 5.6. At the peak of the crisis, it was impossible to substitute the outflow from the foreign-exchange reserve by short-term government CP loans, which had been possible during previous crises. Furthermore, it took some time before the government was able to raise long-term government loans in foreign currency at acceptable prices.
Danmarks Nationalbank's foreign-exchange reserve is part of its contingency resources for intervention in the foreign-exchange market. In view of its size it also has a signalling function which may contribute to dampening any speculation against the krone. According to experi-
1 This was a coordinated reduction of interest rates by a number of central banks.
2 See Danmarks Nationalbank (2009b).
Monetary Review 2nd Quarter 2011 - Part 2

118
ence from the autumn of 2008, very large amounts may be required for intervention purposes if the krone is under pressure. Hence, a substan-tial foreign-exchange reserve is necessary, and Danmarks Nationalbank has increased it considerably.
A special issue was that the extensive government guarantee under Bank Rescue Package 1 might potentially make great demands on Dan-marks Nationalbank's foreign-exchange reserve, given the banking sec-tor's large foreign liabilities.
The banks' dependence on funding in dollars and euro and the shortage thereof during the crisis also show that there may be a need to be able to offer loans in foreign currency. Accordingly, Danmarks Natio-nalbank supported the banks' funding in euro and dollars by providing loans in foreign currency from the foreign-exchange reserve. See section 6 for further details.
The financial crisis has shown that an international shortage of foreign currency may suddenly occur. The dollar shortage was addressed by massive supplies of dollars from the Fed via swap facilities with other central banks. The Fed's rapid response in this connection was essential to their efficiency, cf. Allen and Moessner (2010a). Apparently, this has already prompted several countries which experienced serious currency-
FOREIGN-EXCHANGE RESERVE AND ACCUMULATED INTERVENTION PURCHASES OF FOREIGN EXCHANGE AND FOREIGN GOVERNMENT BORROWING SINCE SEPTEMBER 2008 Chart 5.6
-200
-150
-100
-50
0
50
100
150
200
250
Sep 08 Dec 08 Mar 09 Jun 09 Sep 09 Dec 09 Mar 10 Jun 10 Sep 10 Dec 10
0
50
100
150
200
250
300
350
400
450
Foreign-exchange reserve (right-hand axis) Intervention purchases, netForeign government, net
Kr. billion Kr. billion
Note: Source:
Last observation: December 2010. Danmarks Nationalbank.
Monetary Review 2nd Quarter 2011 - Part 2

119
specific liquidity shortages during the crisis to accumulate foreign-ex-change reserves as a means of insurance, cf. Allen and Moessner (2010b). Conclusion The extraordinary conditions in the foreign-exchange market during the crisis were addressed by a number of policy measures, which kept the krone stable during the crisis. In addition to Danmarks Nationalbank's interventions and interest-rate increases, government borrowing contributed to stabilising the foreign-exchange reserve and supported the capital inflow to Denmark, even though at the peak of the crisis it was difficult to substitute the outflow of foreign exchange for government borrowing. The pressure on the krone reflected a general tendency among international investors to withdraw from minor currencies. The crisis revealed that a larger foreign-exchange reserve is required than warranted by previous experience, and Danmarks Nationalbank has more than doubled its foreign-exchange reserve in relation to the situation before the onset of the crisis in the autumn of 2008.
6. DANMARKS NATIONALBANK'S PROVISION OF EURO AND DOLLARS
Against the backdrop of the need for currency funding and insufficient access to dollars and euro, Danmarks Nationalbank, in the autumn of 2008, established swap lines with the Fed and the ECB in order to be able to supply dollar and euro funding to Danish banks. In September and October 2008, Danmarks Nationalbank also provided dollar and euro loans out of its foreign-exchange reserve.
There was a global shortage of dollars, and the Fed established dollar swap lines with a number of central banks, initially in December 2007. The ECB established euro swap lines with a number of central banks. Swap lines were also established by other central banks, e.g. the Swiss National Bank and the Bank of Japan.1
In the following, we describe the establishment of Danmarks Natio-nalbank's swap lines with the Fed and the ECB and the associated allot-ment of euro and dollar liquidity. We then assess the efficiency of the provision of foreign exchange in an econometric analysis. We also investigate whether liquidity measures introduced by the Fed and the ECB, which were not targeted directly at Denmark, have had a measure-able effect on the dollar and euro liquidity for Danish banks.
1 See Allen and Moessner (2010a).
Monetary Review 2nd Quarter 2011 - Part 2

120
Establishment of Danmarks Nationalbank's euro and dollar loans Danmarks Nationalbank provided euro and dollar loans to facilitate access to euro and dollar liquidity for Danish banks.1
Initially, Danmarks Nationalbank supplied euro and dollars from the foreign-exchange reserve in the form of FX swaps with the banks. In mid-September 2008, Danmarks Nationalbank intervened in the FX swap market, offering dollars against kroner for a total of kr. 2.6 billion with a maturity of 4 days. Likewise, in early October 2008, Danmarks Natio-nalbank intervened in the euro market by offering euro for a total of kr. 16.8 billion with maturities of 1 week and 1 month. Danmarks National-bank had not previously intervened in the FX swap market in recent times.
Danmarks Nationalbank's temporary swap line with the Fed was established on 24 September 2008. It was expanded from 5 to 15 billion dollars on 29 September 2008. The swap line was extended twice and expired on 1 February 2010. During the swap line, the Fed lent dollars to Danmarks Nationalbank, which offered dollar loans to the banks via auction. 18 auctions were held, the last one in September 2009. The need for this facility was emphasised by the fact that in the first auctions demand was considerably higher than the volume allotted, and that the participants also included large banks. The swap line of 15 billion dollars was fully exercised at the end of 2008, cf. Chart 6.1. Demand fell as the dollar funding problems declined, and the widening of the spread between the interest rate in the auctions and the market rate. While the bid volume exceeded the volume allotted in all auctions in 2008, the bid volume was lower than the volume allotted in the auctions held in 2009.
On 27 October 2008, Danmarks Nationalbank and the ECB established an equivalent swap line for 12 billion euro. Nine auctions were held, most recently on 21 August 2009. The largest outstanding volume amounted to kr. 5.9 billion. The bid volume was lower than the volume allotted in all the auctions. This probably reflects that several banks have access to the ECB's monetary-policy facilities via units in the euro area. The facility increased the availability of euro funding, however, especi-ally for banks without access to euro via the ECB's monetary-policy facilities.
The currency loans in dollars and euro under the swap lines with the Fed and the ECB were provided via auctions in which all Danmarks Nationalbank's monetary-policy counterparties were allowed to partici-pate. Participants could each submit a maximum of three bids stating amounts and bid rates. The bid rate had to be higher than or equal to
1 See Danmarks Nationalbank (2009c).
Monetary Review 2nd Quarter 2011 - Part 2

121
the minimum bid rate fixed by the ECB and the Fed. The highest bid rates were accepted first followed by bid rates in descending order until the full amount in euro or dollars had been allotted. All participants paid the marginal rate, which is the lowest among the accepted bid rates. This auction method has the advantage that all participants pay the same rate of interest, which protects banks with less market know-how.
The banks provided collateral for the currency loans using the same collateral base as for Danmarks Nationalbank's normal monetary-policy lending denominated in kroner. The ECB and the Fed lent euro and dol-lars to Danmarks Nationalbank against kroner (FX swaps). The amount in euro or dollars that Danmarks Nationalbank lent to its counterparties, it received from the ECB and the Fed, respectively, in return for a corres-ponding amount in kroner. When the loan matured, Danmarks Natio-nalbank forwarded the reverse transaction, including interest payments, to the ECB and the Fed.
The swap lines with the ECB and the Fed did not affect the foreign-exchange reserve, and Danmarks Nationalbank had no income from the swap agreements. Euro and dollar lending via the swap lines increased Danmarks Nationalbank's balance sheet.1
1 See Dam and Risbjerg (2009) for a description of the effect of the swap operations on Danmarks
Nationalbank's balance sheet.
OUTSTANDING LOANS IN CONNECTION WITH DANMARKS NATIONALBANK'S EURO AND DOLLAR AUCTIONS Chart 6.1
0
20
40
60
80
100
120
Sep 08 Nov 08 Jan 09 Mar 09 May 09 Jul 09 Sep 09 Nov 09 Jan 10
Kr. billion
Outstanding dollars Outstanding euro Source: Danmarks Nationalbank.
Monetary Review 2nd Quarter 2011 - Part 2

122
While the minimum rate of interest in connection with Danmarks Nationalbank's euro auctions was on average 75 basis points higher than the market rate of interest-rate swaps with corresponding maturities, the corresponding figure for the dollar auctions was 84 basis points on average.
Empirical analysis of Danmarks Nationalbank's euro and dollar facilities Below we analyse the extent to which Danmarks Nationalbank's inter-ventions in the FX swap market and the euro and dollar auctions alleviated the dislocations in the FX swap market for euro and dollars against kroner. During the crisis, it was considerably more expensive to fund dollars by combining loans in kroner with FX swaps between kroner and dollars rather than raising loans directly in the money mar-ket for dollars. In other words, there was a clear deviation from the covered interest-rate parity between kroner and dollars, cf. Chart 6.2. Similarly, there were deviations from the covered interest-rate parity between kroner and euro. See Box 2.1 for a description of the covered interest-rate parity.
We analyse the importance of the measures by investigating whether the deviations from the covered interest-rate parity between kroner and, respectively, euro and dollars were reduced by Danmarks National-bank's provision of foreign exchange. As seen from Chart 6.2, the devia-tion during the crisis in the autumn of 2008 is smaller when calculated for uncollateralised rather than collateralised interest rates. The reason is that the difference between uncollateralised and collateralised in-terest rates is larger in the US money market than in the Danish money market, cf. section 4.
DEVIATION FROM THE COVERED INTEREST-RATE PARITY BETWEEN KRONER AND, RESPECTIVELY, DOLLARS AND EURO Chart 6.2
-0.50.00.51.01.52.02.53.03.54.04.55.0
Based on uncollateralised interest ratesBased on collateralised interest rates
Percentage points Kroner and dollars
2006 2007 2008 2009 2010-0.50.00.51.01.52.02.53.03.54.04.55.0
Based on uncollateralised interest ratesBased on collateralised interest rates
Percentage points Kroner and euro
2006 2007 2008 2009 2010
Note: Source:
Deviation for a maturity of 3 months. Uncollateralised interest rates refer to the uncollateralised money-market interest rates in kroner, euro and dollars (Cibor, Euribor and Libor). Collateralised interest rates are the 3-month interest rate in interest-rate swaps at the overnight rate in the respective markets. Last observation: 30 December2010. Reuters EcoWin and Bloomberg.
Monetary Review 2nd Quarter 2011 - Part 2

123
Empirical model Using regression analysis, we assess the effect on the deviation from the covered interest-rate parity of Danmarks Nationalbank's FX swap inter-ventions as well as its euro and dollar auctions, cf. Box 6.1. The depend-ent variable is deviations from the covered interest-rate parity based on uncollateralised interest rates with a maturity of 3 months, which we seek to explain by variables for policy measures and a number of addi-tional explanatory variables for credit, liquidity and market risk to check for other conditions that may have affected the deviation. This method relies on similar analyses performed by Coffey, Hrung and Sarkar (2009) and Hui, Genberg and Chung (2009).1
The variables for credit risk are the CDS spreads for the banks, cf. section 4. All other things being equal, higher credit risk for the banks in the Danish money market will make it more difficult to obtain (uncolla-teralised) funding directly in the money market for dollars. This leads to increased demand for dollars via FX swaps and points to a larger devia-tion from the covered interest-rate parity. Increased credit risk for US banks has the opposite effect, since, all other things being equal, it in-
1 Baba and Shim (2010) perform EGARCH analyses in order to examine the efficiency of policy
measures on interest-rate parity deviations for Korea. Baba and Packer (2009) perform a similar analysis of the euro area, Switzerland and the UK.
OLS ESTIMATION Box 6.1
We use an OLS model on daily data to estimate the efficiency of Danmarks National-
bank's supply of euro and dollars. The model estimates the interest-rate parity
deviation based on policy variables and control variables for liquidity, credit and
market risk. The estimation is made on the basis of (daily) changes in the interest-rate
parity deviation variable and the control variables.1
The estimated variable can be summarised as the following estimation equation:
tttt creditABRcreditDKirpdevirpdev 32110
,7654 ttttt DmarketvolliquidABRliquidDK (1)
irpdevt is the dependent variable, i.e. the deviation from the covered interest-rate
parity, which is also included as an explanatory variable with a 1-day lag to capture
any autocorrelation effects. The equation then includes variables for credit and
liquidity risk in the Danish market (creditDK and liquidDK) and abroad (creditABR and
liquidABR, where ABR stands for the US market and the euro area market,
respectively). The general market risk is indicated as marketvol. The explanatory
variable Dt contains the variables for policy measures. Newey-West standard
deviations are used to allow for autocorrelation and heteroskedasticity.
1 Making this type of change estimations is standard procedure. See McAndrews, Sarkar and Wang (2008) for a discussion of estimating the effect of policy measures using data in differences and levels, respectively.
Monetary Review 2nd Quarter 2011 - Part 2

124
creases their demand for kroner via FX swaps. On the other hand, the global shortage of dollars may also make it necessary for US banks, which are subject to a higher credit risk, to obtain dollars via FX swaps, and this points to an increased interest-rate parity deviation. According-ly, the expected sign of the CDS spread for the US banks is inconclusive.
As a measure of liquidity risk, the spread between uncollateralised and collateralised money-market interest rates (the money-market spread) is included as an explanatory variable. This spread contains both a credit risk premium and a liquidity risk premium, but development in the spread is driven mainly by liquidity conditions, cf. section 4.1
A wider money-market spread in Denmark indicates tighter liquidity conditions in kroner for Danish banks. All other things being equal, this will increase the cost of borrowing in kroner combined with an FX swap to dollars (or euro), and this means a larger deviation from the covered interest-rate parity. Similarly, tighter liquidity conditions in e.g. the dollar money market will increase the costs of borrowing directly in dollars and reduce the deviation from the covered interest-rate parity.
Finally, a variable for general market risk is included. The model for dollars uses the VIX index, cf. section 4. The model for the euro area uses VSTOXX, which similarly indicates the implied volatility of options based on the Euro STOXX 50 stock index.
The policy measures include Danmarks Nationalbank's euro and dollar loans via FX swap interventions and the euro and dollar auctions in connection with the swap lines with the ECB and the Fed, cf. Table 6.1. Dummy-variables are included for dates on which the swap facilities are announced or extended. The amount for volumes sold on the auction day is included as a variable to determine the effect of holding the auctions. A priori the policy measures must be expected to contribute to reducing the interest-rate parity deviations.
We also investigate whether other measures introduced by the Fed and the ECB to improve the liquidity situation in dollars and euro have alleviated the shortage of dollars and euro in Denmark.
On 12 December 2007, the Fed announced its establishment of dollar swap lines with a number of central banks, including the ECB, cf. Fleming and Klagge (2010). The limit of the swap line with the ECB was subject to ongoing upward adjustment. The effect of policy measures on the deviation from the covered interest-rate parity between euro and dollars
1 Coffey, Hrung and Sarkar (2009) do not include funding liquidity variables in their estimations of the
effect of policy measures, as the measures are aimed at reducing liquidity risk. The money-market spread is included in a number of other studies of the effect of policy measures, however, cf. e.g. Baba and Packer (2009), Baba and Shim (2010), Hui, Genberg and Chung (2009), Griffoli and Ranaldo (2010).
Monetary Review 2nd Quarter 2011 - Part 2

125
has been investigated in a number of studies, which generally find that the deviation was significantly reduced by the measures.1 The Fed's fast
1 Coffey, Hrung and og Sarkar (2009), Hui, Genberg and Chung (2009) and Griffoli and Ranaldo (2010).
POLICY MEASURES Table 6.1
Euro Date Notes
FX swap intervention (volume) ..................
2008: 2/10, 10/10 Danmarks Nationalbank supplies euro amounting to a total of kr. 16.8 billion via the FX swap market at maturities of 5 days and 1 month
Establishment of swap line (dummy) .
2008: 27/10 Danmarks Nationalbank opens a swap line with the ECB
Auctions (volume) ... 2008: 10/11, 12/12, 19/12 2009: 21/1, 19/2, 10/3, 19,5 10/6, 21/8
Danmarks Nationalbank conducts a total of 9 auctions lending euro via its swap line with the ECB
ECB, full allotment (dummy) ..................
2008: 8/10 The ECB announces its introduction of full allotment and fixed interest rates in connection with its weekly refinancing operation
ECB, increase of LTRO ..................................
2008: 15/10 The ECB announces an increase in its long-term refinancing operations with full allotment at fixed interest rates
ECB, 1-year LTRO .... 2009: 7/5 The ECB announces 1-year refinancing operations
Dollars Date Notes
FX swap intervention (volume) ..................
2008: 18/9 Danmarks Nationalbank supplies dollars amounting to a total of kr. 2.6 billion via the FX swap market at maturities of 5 days
Establishment of swap line (dummy) .
2008: 24/9 Danmarks Nationalbank opens a swap line with the Fed for an original amount of 5 billion dollars
Increase of swap line (dummy) ..................
2008: 29/9 The swap line between Danmarks Natio-nalbank and the Fed is increased to 15 billion dollars
Extension of swap line (dummy) ...........
2009: 3/2, 26/6 Danmarks Nationalbank extends the swap line with the Fed
Auctions (volume) ... 2008: 26/9, 7/10, 24/10, 18/11, 2/12 2009: 16/1, 3/2, 12/2, 3/3, 13/3, 31/3, 7/4, 28/4, 26/5, 23/6, 21/7,18/8, 15/9
Danmarks Nationalbank conducts a total of 18 auctions lending dollars via its swap line with the Fed
The Fed's swap facility with the ECB (dummy) ..................
2007: 12/12 2008: 11/3, 2/5, 30/7, 18/9, 26/9, 29/9, 13/8 2009: 6/4
On 12 December 2007, the Fed estab-lished a swap line with the ECB which has been increased on an ongoing basis
Source: Danmarks Nationalbank, ECB, Fed.
Monetary Review 2nd Quarter 2011 - Part 2

126
establishment of swap lines was essential to the efficiency of their impact on the market, cf. Allen and Moessner (2010a). In connection with the agreed swap line, the ECB offered dollars via auctions to which their monetary-policy counterparties had access, including a number of Danish banks with units in the euro area. In addition, the improved conditions in the FX swap market between euro and dollars may have a second order effect on the FX swap market between kroner and dollars. As a result of the fixed-exchange-rate policy vis-à-vis the euro, FX swaps between euro and dollars may be widely used instead of FX swaps between kroner and dollars.
The ECB launched a number of measures to support the liquidity conditions in the euro area, cf. ECB (2009a and b). In early October 2008, the ECB announced that until further notice its weekly refinancing oper-ations would be performed with full allotment of liquidity at a fixed interest rate. In mid-October 2008, the ECB announced an expansion of its longer-term refinancing operations. In May 2009, the ECB announced the introduction of refinancing operations for 1-year loans, completing three in the course of 2009. We finally investigate whether excess liquid-ity in the Eurosystem has affected liquidity conditions in Denmark.1
The estimation for the euro and dollar model is based on a data period from early August 2007 to early October 2009. This period covers the entire crisis and includes all Danmarks Nationalbank's euro and dol-lar operations. The last dollar auction was held in September 2009.
The effect of liquidity, credit and market risk It appears from the estimated models for euro and dollars, respectively, cf. Tables 6.2 and 6.3, that a widening of the Danish money-market spread (liquidDK) significantly increases the interest-rate parity devia-tions in all the estimated models. This is in line with the assumption that higher liquidity risk for Danish banks contributes to dislocations in the FX swap market. As expected, the money-market spread in euro (liquidEUR) is also significant with a negative sign. The money-market spread for dollars (liquidUS) is not significant.
The coefficients for credit risk, credit, are neither significant in the euro nor the dollar model. The CDS spreads in Denmark and the euro area are highly correlated, and there are elements of both credit and liquidity risk in CDS spreads as well as in the money-market spreads, which may contribute to blurring the estimation results for the credit variable.
1 Excess liquidity is given as the banks' current-account deposits in the Eurosystem and lending in
connection with the ECB's fine-tuning operations less its reserve requirements and the banks' use of the marginal credit facility.
Monetary Review 2nd Quarter 2011 - Part 2

127
The coefficients for general market risk (volatility index) are not sig-nificant in any of the models.
The effect of provision of euro Danmarks Nationalbank's provision of euro to Danish counterparties via FX swaps reduced the interest-rate parity deviation. The estimation shows that FX swap interventions reduced the deviation by approxi-mately 9 basis points per 1 billion euro.
Besides, the announcement of Danmarks Nationalbank's swap line with the ECB for 12 billion euro in itself significantly reduced the interest-rate parity deviation by approximately 43 basis points. The fact
ESTIMATION RESULTS FOR EURO Table 6.2
Variable Model 1 Model 2 Model 3
Constant ................................................... 0.06 (0.24)
0.27 (0.27)
0.24 (0.26)
irpdevt-1 ...................................................... -0.23*** (0.09)
-0.28*** (0.05)
-0.29*** (0.06)
ΔcreditDKt ................................................. -0.21 (0.20)
-0.21 (0.19)
-0.17 (0.19)
ΔcreditEURt ............................................... 0.12 (0.17)
0.09 (0.16)
0.07 (0.15)
ΔliquidDKt ................................................. 0.83*** (0.10)
0.87*** (0.09)
0.87***
(0.10)
ΔliquidEURt ............................................... -0.56***
(0.13)-0.54*** (0.12)
-0.55*** (0.14)
Δmarketvolt .............................................. -0.23 (0.16)
-0.11 (0.15)
-0.13 (0.16)
FX swap interventions(m) ....................... -9.76** (4.45)
-9.36* (4.73)
Establishment of swap line(d) ................. -42.41***
(4.81)-42.64***
(5.05)
Auctions(m) .............................................. -3.21*** (0.81)
-3.22*** (0.81)
ECB, full allotment(d) .............................. 2.77 (6.55)
ECB, increase of LTRO (d) ........................ 11.38***
(2.14)
ECB, 1-year LTRO ..................................... 4.76***
(1.45)
ECB, excess liquidity ................................. -0.00 (0.01)
Adjusted R1 ............................................... 0.48 0.53 0.53
Log-Likelihood ......................................... -1,774.16 -1,747.09 1,745.21
Note: (d) = dummy variable, (m) = volume variable. 1 Significance tests are based on Newey-West's heteroskedasticity-robust standard error. ***, **, * means that the estimates
are significant at the 1, 5 and 10 per cent level, respectively. Estimation period: 9 August 2007 - 1 October 2009.
Monetary Review 2nd Quarter 2011 - Part 2

128
that the ECB backed the efforts to solve the Danish banks' euro funding problems had strong signalling value. The allotted volumes on individual auction days also had a significant impact on the deviation with an average of just over 3 basis points for each 1 billion euro allotted via the auctions or a total of 19 basis points for the total allotment of 5.9 billion euro. Although the total swap line was not fully exercised, the euro provision contributed to alleviating the dislocations in the FX swap market. This gave the Danish banks confidence that they would have access to the euro liquidity they needed.
The ECB's announcement of full allotment of euro at a fixed interest rate in its weekly refinancing operations had no significantly reducing
ESTIMATION RESULTS FOR DOLLARS Table 6.3
Variable Model 1 Model 2 Model 3
Constant ....................................................... 0.07 (0.43)
0.27 (0.45)
0.22 (0.47)
Δirpdevt-1 ....................................................... -0.03 (0.07)
-0.07 (0.10)
-0.07 (0.10)
ΔcreditDKt .................................................... 0.45 (0.46)
0.47 (0.46)
0.49 (0.48)
ΔcreditUSt ..................................................... 0.01 (0.12)
0.02 (0.13)
0.01 (0.13)
ΔliquidDKt ..................................................... 0.66***
0.18) 0.63***
(0.15) 0.63***
(0.15)
ΔliquidUSt ...................................................... 0.29 (0.27)
0.38 (0.30)
0.38 (0.30)
Δmarketvolt .................................................. -0.58 (0.38)
-0.60 (0.39)
-0.58 (0.37)
FX swap interventions(m) ........................... ---
103.57***
(22.82) 94.43***
(28.00)
Establishment of swap line(d) ..................... --- -46.04*** (11.37)
-46.01***
(11.41)
Increase of swap line(d) .............................. --- -5.28 (10.06)
-10.38 (13.95)
Extension of swap line(d) ............................ --- 0.90 (2.47)
1.15 (2.64)
Auctions(m) .................................................. --- -1.48**
(0.61) -1.55**
(0.63)
The Fed's swap line with the ECB(d) .......... --- ---
4.50 (6.47)
Adjusted R1 ................................................... 0.15 0.20 0.21 Log-Likelihood ............................................. -2,134.53 -2,118.68 -2,118.28
Note: (d) = dummy variable, (m) = volume variable. 1 Significance tests are based on Newey-West's heteroskedasticity-robust standard error. ***, **, * means that the estimates
are significant at the 1, 5 and 10 per cent level, respectively. Estimation period: 9 August 2007 - 1 October 2009.
Monetary Review 2nd Quarter 2011 - Part 2

129
effect on the interest-rate parity deviation. This may reflect the appreci-ation of the krone when, on the same day, the ECB lowered its interest rate by 0.50 percentage point, while Danmarks Nationalbank kept its interest rate unchanged, cf. section 5. The result was a widening of the spread between kroner and euro and a strengthening of the krone. This may have contributed to blurring the effect of the ECB's announcement.
The ECB's announcement in October 2008 of the expansion of its longer-term refinancing operations and in May 2009 of its establishment of the 1-year credit facility did not reduce the interest-rate parity devia-tion between kroner and euro, possibly because the market participants did not yet know the implications for the liquidity situation. Nor did the ECB's auctions in connection with the new longer-term refinancing oper-ations significantly reduce the interest-rate parity deviation. It should be noted, however, that in large part the impact of e.g. the 1-year euro-providing lending facility gradually affected the money market up to the auctions, so the overnight dummy variable for individual auctions only shows the isolated auction effect. Likewise, the excess liquidity in the euro area did not have a significant effect on the interest-rate parity deviation. The effect of dollar supplies The estimation shows a substantial and statistically significant widening of the interest-rate parity deviation on the day Danmarks Nationalbank supplied dollars from the foreign-exchange reserve via the FX swap market. The period immediately after the failure of Lehman Brothers, during which the intervention took place, was characterised by highly volatile markets. This may have contributed to blurring the effect of the interventions on market prices. Besides, the supply of dollars via the FX swap market was modest compared with the amount of Danmarks Nationalbank's operations in the euro swap market. The market for FX swaps between kroner and dollars is almost twice the size of the FX swap market between kroner and euro. If the market participants believed there was less support for the dollar operations out of the foreign-exchange reserve than for euro, this may also explain the less pronounced effect of the dollar operations compared to the euro operations.
The establishment of Danmarks Nationalbank's swap line with the Fed significantly reduced the deviation from the covered interest-rate parity between kroner and dollars by 46 basis points, thereby helping to normalise the dislocations in the FX swap market. While the expansion of the swap line from 5 to 15 billion dollars reduced the interest-rate parity deviation, the effect was not statistically significant.
Monetary Review 2nd Quarter 2011 - Part 2

130
The allotted volumes on individual auction days also reduced the inter-est-rate parity deviation. Overall, the dollar auctions held all contributed to reducing the deviation by 1.5 basis points per 1 billion dollars allotted or by a total of 23 basis points for the total allotment of 15 billion dollars.
The estimations did not show a significant effect of the Fed's swap lines with the ECB. However, the general improvement of the funding conditions in dollars undoubtedly contributed to supporting the condi-tions of dollar funding in Denmark.
Robustness of the results We have made a number of additional estimations to check the robust-ness of the results: Estimations have been made where the covered interest-rate parity is
based on collateralised interest rates (swap rates) rather than uncollat-eralised interest rates.
The spread between uncollateralised and collateralised interest rates has been replaced by the interest-rate spread between government-guaranteed and government issuance as an expression of the liquidity risk, cf. section 4.
The estimations above use CDS spreads for selected Cibor reporting banks and selected European and US banks, cf. section 4. Estimations have also been made using the CDS spread for the largest banks in the Danish money market, i.e. Danske Bank and Nordea, and the index for CDS spreads in the euro area (iTraxx) and in the USA (CDX).
The estimations above use exchange rates from the broker firm of Tullet Prebon sourced from Bloomberg. Estimations have also been made on the basis of data from Reuters where the exchange rates are determined on the basis of various reporting banks (Reuters' compo-site rates).
The level of deviation from the covered interest-rate parity has been included as an additional explanatory variable to allow for level de-pendence in the deviation. This is also the case in e.g. Baba and Shim (2010). The deviation from the covered interest-rate parity between dollars and euro and the spread between bid and ask prices in FX swaps has also been added as an explanatory variable.
Finally, estimations have been made with the estimation period begin-ning on 15 September 2008, the date of Lehman Brothers' suspension of payments, instead of 9 August 2007.
The announcement of the swap lines with the Fed and the ECB also significantly reduces the deviation from the covered interest-rate parity
Monetary Review 2nd Quarter 2011 - Part 2
131
in the alternative specifications. While in a few instances the effect of holding the auctions in connection with the swap lines and Danmarks Nationalbank's own supply of euro becomes insignificant, it has the expected sign in all instances.
Conclusion The econometric analyses in this section show that the announcement of the swap lines led to a marked improvement of the funding conditions, expressed as a reduction of the deviation from the covered interest-rate parity. This reflects that market participants were reassured by the support of the Fed and the ECB to safeguard dollar and euro funding. The announcement of the swap line with the Fed led to a significant reduction of the deviation from the covered interest-rate parity be-tween kroner and dollars of 46 basis points. On average, the dollar auctions in connection with the swap line with the Fed reduced the deviation by 1.5 basis points per billion dollars sold at the auctions, or by 23 basis points for the total allotment of 15 billion dollars. Similarly, the announcement of the swap line with the ECB led to a statistically significant reduction of the deviation from the covered interest-rate parity between kroner and euro of 43 basis points. The actual euro auctions reduced the deviation by an average 3 basis points per 1 billion euro or by a total of 19 basis points for the total allotment of 5.9 billion euro. The results are in line with similar surveys for other countries.
Danmarks Nationalbank also provided dollar and euro swap loans out of the foreign-exchange reserve. FX swaps in euro in early October 2008 led to a statistically significant reduction, by 9 basis points, of the deviation from the covered interest-rate parity while the result for FX swaps in dollars in mid-September was less clear-cut. One explanation may be that the market participants believed there was more support for the euro operations from the foreign-exchange reserve. In addition, the euro operations amount was considerably larger than the dollar amount.
We do not find that the estimations show a significant effect of the Fed's swap lines with the ECB. However, the general improvement of the funding conditions in dollars through the measures introduced by the Fed has undoubtedly also supported the conditions of dollar funding in Denmark. Similarly, it is difficult to identify, by means of the estimations, a measurable improvement of the euro funding situation in Denmark by the ECB's liquidity measures in the euro area.
Monetary Review 2nd Quarter 2011 - Part 2

132
LITERATURE
Abildgren, Kim (2004), The activity in the Danish money market, Monetary Review, 2nd Quarter. Allen, William A. and Richhild Moessner (2010a), Central bank co-operations and international liquidity in the financial crisis, BIS Working Papers, No. 310, May. Allen, William A. and Richhild Moessner (2010b), Options for meeting the demand for international liquidity during financial crisis, BIS Quarterly Review, September. Alper, C. E. and Oya Pinar Ardic (2010), Covered interest parity, in Steven N. Durlauf and Lawrence E. Blume (ed.), The New Palgrave Dictionary of Economics, Online Edition, Palgrave Macmillan. http://www.dictionaryofeconomics.com/dictionary. Andersen, Allan Bødskov (2004), Volatility in the overnight money-market rate, Danmarks Nationalbank, Monetary Review, 4th Quarter. Andersen, Bo and Henrik Arp (2010), Det danske obligationsmarked (The Danish bond market – in Danish only), Essens, Skandinaviska Enskilda Banken, 16 September. Baba, Naohiko and Frank Packer (2009), From turmoil to crisis: Dislocation in the FX swap market before and after the failure of Lehman Brothers, Journal of International Money and Finance, No. 28. Baba, Naohiko and Ilhyock Shim (2010), Policy responses to dislocations in the FX swap market: the experience of Korea, BIS Quarterly Review, June. Bernstein, Nils (2010), The Danish krone during the crisis, speech given at the Copenhagen Business School, 22 March. BIS (2009), 79th Annual Report. BIS (2010), 80th Annual Report. Borio, Claudio and William Nelson (2008), Monetary operations and the financial turmoil, BIS Quarterly Review, March. Brunnermeier, Markus K. and Lasse H. Pedersen (2009), Market liquidity and funding liquidity, Review of Financial Studies, Vol. 22, No. 6. Brunnermeier, Markus K. (2009) Deciphering the liquidity and credit crunch 2007-2008, Journal of Economic Perspectives, Vol. 23, No. 1, Winter.
Monetary Review 2nd Quarter 2011 - Part 2

133
Buchholst, Birgitte V., Jacob Gyntelberg and Thomas Sangill (2010), Liquidity of Danish government and covered bonds – Before, during and after the financial crisis – Preliminary findings, Danmarks Nationalbank Working Papers, No. 70. Campbell, John Y., Andrew W. Lo and A. Craig MacKinlay (1997), The econometrics of financial markets, Princeton University Press. Coffey, Niall, Warren B. Hrung and Asani Sarkar (2009), Capital constraints, counterparty risk, and deviations from covered interest rate parity, Federal Reserve Bank of New York Staff Reports, No. 393, October. Committee on the Global Financial System (2008), Central bank operations in response to the financial turmoil, CGFS Publications, No. 31, July. Committee on the Global Financial System (2010), The functioning and resilience of cross-border funding markets, CGFS Publications, No. 37, March. Dam, Niels Arne and Lars Risbjerg (2009), Central bank measures and balance sheets during the crisis, Danmarks Nationalbank, Monetary Review, 4th Quarter. Danmarks Nationalbank (2003), Danish Government Borrowing and Debt, 2002. Danmarks Nationalbank (2004), Financial Management at Danmarks Nationalbank. Danmarks Nationalbank (2008a), The international financial crisis, Monetary Review, 4th Quarter. Danmarks Nationalbank (2008b), Financial stability 2008. Danmarks Nationalbank (2009a), Monetary Policy in Denmark, 3rd edition. Danmarks Nationalbank (2009b), Danish Government Borrowing and Debt, 2008. Danmarks Nationalbank (2009c), Danmarks Nationalbank's euro and dollar auctions, Monetary Review, 3rd Quarter. Danmarks Nationalbank (2010), Stress Tests, 2nd half. Dick-Nielsen, Jens, Peter Feldhütter and David Lando (2009), Corporate bond liquidity before and after the onset of the subprime crisis, Copenhagen Business School, Institute of Finance Working Papers.
Monetary Review 2nd Quarter 2011 - Part 2

134
ECB (2008), Transmission of US dollar and pound sterling money market tensions to the euro money market, Financial Stability Review, December, Box 3. ECB (2009a), The implementation of monetary policy since August 2007, Monthly Bulletin, July. ECB (2009b), Recent developments in the balance sheets of the Eurosystem, the Federal Reserve System and the Bank of Japan, Monthly Bulletin, October. Eisenschmidt, Jens and Jens Tapking (2009), Liquidity risk premia in unsecured interbank money markets, ECB Working Papers, No. 1025, March. Ejerskov, Steen (2009), Money market segmentation during the financial crisis and bank lending rates, Danmarks Nationalbank, Monetary Review, 1st Quarter. Fender, Ingo and Patrick McGuire (2010), European banks' US dollar funding pressures, BIS Quarterly Review, June. Financial Stability Forum (2008a), Report of the Financial Stability Forum on enhancing market and institutional resilience, 7 April. Financial Stability Forum (2008b), Report of the Financial Stability Forum on enhancing market and institutional resilience Follow-up on implementation, 10 October. Fleming, Michael J. and Nicholas J. Klagge (2010), The Federal Reserve's foreign exchange swap lines, Federal Reserve Bank of New York, Current issues in economics and finance, Vol. 16, No. 4, April. Gorton, Gary B. and Andrew Metrick (2009), Securitized banking and the run on repo, NBER Working Papers, No. 15223, August. Griffoli, Tommaso Mancini and Angelo Ranaldo (2010), Limits to arbitrage during the crisis: funding liquidity constraints and covered interest parity, Swiss National Bank Working Papers, No. 14, June. Heider, Florian, Marie Hoerova and Cornelia Holthausen (2009), Liquidity hoarding and interbank market spreads: the role of counterparty risk, ECB Working Paper Series, No. 1126, December. Holthausen, Cornelia and Huw Pill (2010), The forgotten markets: how understanding money markets helps us to understand the financial crisis, ECB Research Bulletin, No. 9, March.
Monetary Review 2nd Quarter 2011 - Part 2

135
Hui, Cho-Hoi, Hans Genberg and Tsz-Kin Chung (2009), Funding liquidity risk and deviations from interest-rate parity during the financial crisis of 2007-2009, Hong Kong Monetary Authority, Working Paper, No. 13, July. Imakubo, Kei, Takeshi Kimura and Teppei Nagano (2008), Cross-currency transmission of money market tensions, Bank of Japan Review, July. Jensen, Annemette Skak (2008), Credit default swaps, Danmarks Nationalbank, Monetary Review, 3rd Quarter. Jørgensen, Anders and Lars Risbjerg (2010), Current trends in the money market for Danish kroner, Danmarks Nationalbank, Monetary Review, 3rd Quarter. Kjærgaard, Morten and Lars Risbjerg (2008), Financial turmoil, liquidity and central banks, Danmarks Nationalbank, Monetary Review, 1st Quarter. Kjærgaard, Morten and Katrine Skjærbæk (2008), Cibor, Danmarks Nationalbank, Monetary Review, 1st Quarter. Krishnamurthy, Arvind (2009), Amplification mechanisms in liquidity crisis, American Economic Journal, Vol. 2, No. 2, September. Lund, Jakob Windfeld (2007), Turmoil in the financial markets, Danmarks Nationalbank, Monetary Review, 3rd Quarter. Manning, Mark J. (2004), Exploring the relationship between credit spreads and default probabilities, Bank of England Working Papers, No. 225. McAndres, James, Asani Sarkar and Zhenyu Wang (2008), The effect of the Term Auction Facility on the London Inter-Bank Offered Rate, Federal Reserve Bank of New York Staff Reports, No. 335, July. McGuire, Patrick and Götz von Peter (2009), The US dollar shortage in global banking and the international policy response, BIS Working Papers, No. 291, October. Pedersen, Lasse Heje (2008), Liquidity risk and the current crisis, VoxEU, 15 November. Poffet, Astrid Henneberg (2010), Pledging of collateral to Danmarks Nationalbank, Danmarks Nationalbank, Monetary Review, 2nd Quarter. Sarkar, Asani (2009), Liquidity risk, credit risk, and the Federal Reserve's responses to the crisis, Federal Reserve Bank of New York Staff Reports, No. 389.
Monetary Review 2nd Quarter 2011 - Part 2

136
Sarkar, Asani and Jeffrey Shrader (2010), Financial amplification mechanisms and the Federal Reserve's supply of liquidity during the crisis, Federal Reserve Bank of New York Staff Reports, No. 431, March. Schwartz, Krista (2010), Mind the gap: Disentangling credit and liquidity in risk spreads, Wharton School, University of Pennsylvania, Working Paper, October. Sinding-Olsen, Maria (2010), The foreign-exchange market 2010, Danmarks Nationalbank, Monetary Review, 4th Quarter. Soultanaeva, Albina and Maria Strömquist (2009), The Swedish money market risk premium – Experience from the crisis, Sveriges Riksbank, Economic Review, No. 3. Straarup, Peter (2010), speech given at Politikens Hus, 12 November. Taylor, John B. and John C. Williams (2009), A black swan in the money market, American Economic Journal: Macroeconomics, Vol. 1, No. 1, January.
Monetary Review 2nd Quarter 2011 - Part 2