the monetary origins of asymmetric information in ... monetary origins of asymmetric information in...
TRANSCRIPT

Board of Governors of the Federal Reserve System
International Finance Discussion Papers
Number 872
September 2006
The Monetary Origins of Asymmetric Information in International Equity Markets
Gregory H. Bauer and Clara Vega
NOTE: International Finance Discussion Papers are preliminary materials circulated to stimulate discussionand critical comment. References in publications to International Finance Discussion Papers (other than anacknowledgment that the writer has had access to unpublished material) should be cleared with the authoror authors. Recent IFDPs are available on the Web at www.federalreserve.gov/pubs/ifdp/.

The Monetary Origins of Asymmetric Information in International Equity Markets
Gregory H. Bauer and Clara Vega*
Abstract: Existing studies using low-frequency data have found that macroeconomic shocks contribute littleto international stock market covariation. However, these papers have not accounted for the presence ofasymmetric information where sophisticated investors generate private information about the fundamentalsthat drive returns in many countries. In this paper, we use a new microstructure data set to better identify theeffects of private and public information shocks about U.S. interest rates and equity returns. High-frequencyprivate and public information shocks help forecast domestic money and equity returns over daily and weeklyintervals. In addition, these shocks are components of factors that are priced in a model of the cross sectionof international returns. Linking private information to U.S. macroeconomic factors is useful for manydomestic and international asset pricing tests.
JEL Classification: F3, G12, G14, G15Keywords: Private Information; International Equity Returns; Monetary Policy, Foreign ExchangeRates, Exchanged Traded Funds.
* We thank Rui Albuquerque, Mike Barclay, Michael Fleming, Richard Lyons, Michael Melvin, MatthewPritsker, Bill Schwert, JerryWarner as well as seminar participants at the Northern Finance Associationmeeting, Southern Finance Association meeting, Western Economics Association International meeting,Western Finance Association meeting, the Bank of Canada-Sauder School of Business Workshop onInternational Financial Markets, and the University of Rochester for their comments. Bauer is affiliated withthe Financial Markets Department of the Bank of Canada. Address: 234 Wellington St., Ottawa, Ontario,Canada K1A 0G9. Vega is affiliated with the Board of Governors of the Federal Reserve System and WilliamE. Simon Graduate School of Business Administration. Address: Carol Simon Hall, University of Rochester,Rochester, NY 14627. E-mail: [email protected] and [email protected]. The views in thispaper are solely the responsibility of the authors and should not be interpreted as re.ecting the views of theBank of Canada, the Board of Governors of the Federal Reserve System or of any other person associatedwith the Federal Reserve System.

1 Introduction
The causes of international stock market covariation remain a puzzling issue in �nance.Asset-pricing models dictate that expected stock returns vary in response to changesin risk-free interest rates, changes in expected future cash �ows, and/or changes in theequity risk premium. In a rational asset-pricing framework, with international marketintegration, comovements in international stock returns would be driven by news aboutmacroeconomic factors that a¤ect cash �ows, risk-free rates, or risk premiums in manycountries.Existing studies using low-frequency data, however, show that macroeconomic factors
have a limited impact on international equity returns. For example, King, Sentana andWadhwani (1994) construct a factor model of 16 national stock market monthly returnsand examine the in�uence of 10 key macroeconomic variables. They conclude that thesurprise components of these observable variables contribute little to world stock mar-ket variation. Rather, there is a dominant unobservable (i.e., non-public) factor drivinginternational returns.1 Karolyi and Stulz (1996) show that neither macroeconomic newsannouncements nor interest rate shocks signi�cantly a¤ect comovements between U.S.and Japanese stock returns. Connolly and Wang (2003) examine the open-to-close eq-uity market returns of the U.S., the U.K., and Japan and �nd that foreign returnscause movements in domestic markets even after accounting for macroeconomic newsannouncements.If public news about macroeconomic variables is not responsible for the comovements,
could some �market friction�be responsible? One potential friction is trading based onasymmetric information. In the literature that examines the limits to international risk-sharing, asymmetric information is used as a theoretical explanation of the �home bias�and �familiarity� puzzles in international portfolio selection.2 In contrast, the litera-ture has been largely silent on the e¤ects of trading based on private information oninternational asset-return covariability. When sophisticated agents trade, their privateinformation is (partially) revealed to the market, causing revisions in asset prices. Trad-ing based on private information could thus be a potential cause of the comovementsin international stock returns if agents had superior knowledge about the common fac-tors that price equities from many countries. However, the economic origins of suchprivate information remain unexplored. Indeed, Goodhart and O�Hara (1997) wonder:�in the international context, how could private information be expected to have a global
1 King, Sentana and Wadhwani interpret the common factor that is unrelated to fundamentals asan index of �investor sentiment.�See also King and Wadhwani (1990) and Lin, Engle and Ito (1994).
2 Sophisticated agents are believed to have superior (�private�) information about the returns onassets in their own country. A broader de�nition of private information is given below.
1

impact?�In this paper, we provide an answer to this question. We start by providing em-
pirical estimates of trading based on private information in the U.S. money and equitymarkets. Using an analysis of microstructure data, we show that some agents have supe-rior knowledge about both future U.S. interest rates and aggregate U.S. equity marketreturns. Trades based on private information have a signi�cant impact on money andequity market returns over holding periods that range from one day to one week.Our interpretation of these results is that sophisticated investors have good infor-
mation about future macroeconomic factors that will a¤ect both U.S. equity prices andinterest rates. If international equity markets are integrated, then information aboutU.S. factors will give informed agents superior knowledge about the global factors thatprice stocks in many countries (Albuquerque, Bauer and Schneider 2003a). It is thenlikely that the private information of the sophisticated investors trading in these (liquid)U.S. markets will help explain the cross section of international equity returns.We use a latent-factor model of international equity returns to evaluate the e¤ects
of private information originating in U.S. markets on foreign markets. The latent factoris composed of public and private information shocks from the U.S. money and equitymarkets. We examine how the factor is related to daily and weekly returns on foreignequity markets. We show that private and public information shocks arising in U.S.markets are components of the priced factor in a model of the cross section of internationalequity returns. Sophisticated investors have an impact on global markets when theirsuperior information is incorporated into international equity returns. To the best of ourknowledge, this is the �rst paper to show that private information is part of a pricedfactor in an international setting.This paper extends the existing literature in three ways. The �rst extension is to adapt
techniques from the microstructure literature (primarily Hasbrouck 1991) to identifyinformation shocks in aggregate U.S. stock and money markets from quote revisions andorder �ows sampled at high frequencies. These shocks can be orthogonalized into thosedue to private and public information. Using order �ow sampled at high frequenciesprovides a powerful method of obtaining private information shocks (e.g., Hasbrouck1991, Brennan and Subrahmanyam 1996, Madhavan, Richardson and Roomans 1997,and Yu 2003). Similarly, the e¤ect of public news on asset prices can be measuredmore accurately using high-frequency data (Andersen et al. 2003). We can use thehigh-frequency shocks obtained from our time-series regressions as elements of the latentfactor in a conditional asset-pricing model of the cross section of international returns.The model reveals that the shocks are both statistically and economically important.The second extension is to focus on shocks related to a speci�c macroeconomic fun-
2

damental: U.S. interest rates. Cochrane and Piazzesi (2002) and others have shown thatunanticipated daily movements in short-term U.S. interest rates are good proxies formonetary policy innovations. Cochrane and Piazzesi (2002) also show that these publicinformation shocks have a large impact on short and long-term U.S. bond yields. Weextend their work in two ways. First, using time-series regressions on our microstructuredata, we obtain both public and private information shocks about U.S. interest rates.We then show that these shocks a¤ect prices in the U.S. equity market. Second, we showthat the shocks have an a¤ect on the cross section of international equity returns.Our third extension is that, instead of focusing on the returns of foreign stocks traded
in national markets, we use foreign stock indexes that trade in New York as exchangetraded funds (ETFs). ETFs are bundles of foreign stocks that trade on the AmericanStock Exchange (AMEX) and are priced in U.S. dollars. They are designed to be alow-cost instrument that tracks a foreign stock index. Because the supply of an ETFcan be altered at any time, arbitrage ensures that its price closely tracks the index. Byusing these contracts, we observe returns and order �ows on foreign equities that tradecontemporaneously with their U.S. counterparts. We can thus obtain high-frequencymeasures of public and private information shocks that a¤ect the foreign indexes duringU.S. trading times.One potential problem in previous low-frequency studies of international equity mar-
ket comovements is non-synchronous trading. Those studies examined the impact ofinformation events that occurred during U.S. trading times on foreign (overnight) re-turns. The di¤erent time zones of the markets complicate the inference.3 In this paper,we avoid this problem by using foreign assets that trade contemporaneously with Amer-ican stocks, and by focusing on public and private information shocks released duringU.S. trading times only. The foreign assets, however, will respond to news released in thehome markets as well. Thus, our approach does not measure the e¤ects of all tradingbased on private information on the assets, but only a subset of the trades.4
A potential problem with our approach is that the foreign indexes (ETFs) trade lessin the U.S. market than they do in their home market. The potential for stale prices willcomplicate any short-run analysis of the returns. In contrast, the focus in this paper is
3 Low-frequency studies �nd con�icting results about causality. For example, Hammao, Masulisand Ng (1990), and King and Wadhwani (1990), �nd that correlations in volatility and prices appearto be causal from the United States to other countries. On the other hand, Lin, Engle and Ito (1994)�nd a bidirectional relationship between New York and Tokyo, and Susmel and Engle (1994) �nd abidirectional relationship, albeit weak, between New York and London. Engle, Ito and Lin (1990) �nda bidirectional relationship in the intraday yen/dollar exchange rate.
4 Craig, Dravid and Richardson (1995) �nd that trading in Nikkei futures in the United Statesprovides information about next-day Japanese equity returns. However, they do not identify the sourcesof the information.
3

on changes in the foreign equity prices over holding periods ranging from one day to oneweek.5 At these intervals, stale prices will have much less of an in�uence. An additionalbene�t of examining daily and weekly intervals is that we obtain the aggregate U.S.and foreign market response to information released during U.S. trading times. This isimportant, because foreign market trading could negate the e¤ects of information releasedduring U.S. trading times, leaving no long-run impact on the price of the security. We�nd, however, that our high-frequency information shocks that occur during U.S. tradingtimes continue to have an impact on foreign equity returns up to a week later.Our focus on trading related to U.S. variables helps to �ll in the gaps from previous
studies. Albuquerque, Bauer and Schneider (2003a) identify a common global factor thataccounts for approximately half of the variation in monthly trades by U.S. investors dueto private information. Although they speculate on the origins of the private information,they do not test any particular factor. Other papers have hinted that private informationin one market may spill over into a foreign equity market. For example, Werner andKleidon (1996) examine the intra-day patterns in trading volume, return volatility, andbid-ask spreads of cross-listed stocks in the U.K. and U.S. equity markets. After testingseveral hypotheses that could cause the patterns, they conclude that the main cause isthe private information revealed by U.S. order �ow. Werner and Kleidon do not, however,indicate what the private information could be.Our paper also contributes to areas other than international asset pricing. One con-
tribution is to the growing literature that attempts to link microstructure concepts, suchas private information and liquidity, to asset pricing.6 Easley, Hvidkjaer and O�Hara(2002) �nd that a measure of a stock�s probability of private information based trading ispriced in the cross section of U.S. stocks. In this paper, we provide additional support fortheir analysis by showing that part of the private information in the U.S. equity marketis related to a speci�c macroeconomic fundamental.We proceed as follows. In section 2, we describe the data and show how our Eurodollar
interest rate series is related to U.S. monetary policy. In section 3, we describe our generalmicrostructure model for extracting private and public information shocks from the U.S.money and equity markets. In section 4, we present our latent-factor model and showthat private information is a priced factor in the cross section of international equityreturns. We conclude in section 5.
5 We construct the daily and weekly returns using overlapping samples of high-frequency data. Thisallows us to maintain the identi�cation advantages of a microstructure analysis while focusing on theinformation content of longer holding-period returns.
6 This literature is surveyed in Easley and O�Hara (2002).
4

2 Data Description and U.S. Monetary PolicyProxies
This section starts by explaining the sources of our data series. It also explains how toobtain signed trades (order �ow) from the Eurodollar, U.S. equity, and foreign equitymarkets. We then show how shocks in the Eurodollar futures market are related tochanges in U.S. monetary policy.
2.1 Data description
To capture public and private information shocks in the U.S. and foreign equity markets,we use high-frequency data on ETFs. ETFs are shares of a portfolio of stocks thattrade continuously on an exchange and are designed to track closely the performance ofa speci�c index.7 Managers of the ETFs may buy either all the stocks in the index ora sample of stocks, to track the index. It is important to emphasize that ETFs are notclosed-end funds. Closed-end funds o¤er a �xed supply of shares, and as demand changesthey frequently trade at appreciable discounts from (and sometimes premiums to) theirnet asset values (NAVs). In contrast, market participants are able to create and redeemshares in an ETF when its market price di¤ers from the value of its underlying index.This ability to open the funds at any time ensures that ETFs trade near their NAVs.8
The U.S. ETF is the Standard and Poor�s (S&P) 500 fund (SPDR, or �Spider�) thatbegan trading on the AMEX in 1993.9 Elton et al. (2002) discuss the investment andtracking performance of this fund. They conclude that the SPDR closely tracks the S&P500 index, because the di¤erence between the two is less than 1.8 basis points per annum.The SPDR is a very liquid security; in mid-2003, the fund had over U.S. $37 billion inassets under management, with average daily trading volume totalling U.S. $4 billion.The foreign ETFs are shares of portfolios designed to track the performance of foreign
market indexes compiled by Morgan Stanley Capital International (MSCI). They werelaunched under the World Equity Benchmark Shares (WEBS) brand and were renamedin 1998 as �iShares,� or index shares. They are managed by Barclays Global FundAdvisors and trade on the AMEX. We use bid quotes, ask quotes, and transactionsprices for the ETFs of the U.S. and 10 foreign countries (Germany, Japan, the U.K.,
7 All the ETFs we use are listed on the AMEX; some of them are listed on other exchanges, includingforeign exchanges. Nevertheless, the largest trading volume for these assets takes place on the AMEXduring our sample period, and we con�ne ourselves to data from that exchange.
8 Another advantage of ETFs is their tax e¢ cieny. See Elton et al. (2002).9 The SPDR also traded on the NYSE and NASDAQ (as well as other exchanges) during our sample
period. Howevere, trading on the AMEX remained quite liquid during this time.
5

Switzerland, Canada, France, the Netherlands, Sweden, Australia, and Italy). We selectthese countries because they have developed equity markets and ETF data that areavailable over our sample period.The U.S. and foreign ETF data are obtained from the Trades and Quotes (TAQ)
database. The sample period consists of continuously recorded tick-by-tick data fromApril 1, 1996 to November 30, 2001 (1,206 days). To calculate ETF buyer-initiatedorders and seller-initiated orders, we use the algorithm developed by Lee and Ready(1991).10 Order �ow is the net amount of buyer-initiated less seller-initiated trades.To estimate public and private information shocks in U.S. interest rates, we use high-
frequency data on the Eurodollar futures contract that trades on the Chicago MercantileExchange (CME).11 The Eurodollar contract is considered to be the most liquid exchange-traded money market instrument in the world. The contract is valued at 100 less theLondon Inter-Bank O¤ered Rate (LIBOR) on Eurodollars at maturity. We examine �vedi¤erent maturities: the 3-month, 6-month, 9-month, 1-year, and 5-year (k = 3; 6; 9; 12;and 60) contracts. The contracts maturing in less than one year are the most liquid.The CME records �time and sales data,� which contain the time and price of a
transaction only if the price is di¤erent from the previously recorded price. Bid (ask)quotes appear in this �le only if the bid quote is above (the ask quote is below) thepreviously recorded transaction price. Because quotes are generally not recorded, we usethe �tick test� to estimate buyer-initiated and seller-initiated orders.12 The order-�owseries that we use is the net purchases (buyer-initiated less seller-initiated trades).Using time and sales data produces two opposite e¤ects on our measure of private
information. The �rst e¤ect is that we underestimate the number of �liquidity trades�as opposed to �informed trades.� Since we have time and sales data, we can measuretrades only when the price of the asset changes, which is more likely to occur due toan informed trade rather than a liquidity-based trade. Thus, we systematically under-estimate liquidity-based trades. This implies that our order-�ow series is dominated by
10 This algorithm compares transaction prices with the mid-quote �ve seconds before the transactiontook place. If the transaction price is above the mid-quote, then we classify the trade as a buy; if thetransaction price is below the mid-quote, we classify the trade as a sell. If the transaction price is equalto the mid-quote, then we use the tick test. Ellis, Michaely and O�Hara (2000) evaluate how well theLee and Ready algorithm performs, and �nd that it is 81.05 per cent accurate.11 We could also have used federal funds futures contract data (e.g., Rudebusch 1998, Kuttner 2001,
and Carlson, McIntire and Thomson 1995). We use the Eurodollar futures contract because it is moreliquid than the Federal funds futures contract, implying that it may better re�ect information aboutthe state of the economy. We use futures market data because no high-frequency transactions data areavailable in the spot market.12 The tick test is as follows: if the transaction price is higher than the previous price, we classify the
trade as a buy, and if it is below the previous transaction price, we classify it as a sell. Ellis, Michaelyand O�Hara (2000) �nd that the tick test correctly classi�es 77.6 per cent of the trades.
6

information-based trading.The second e¤ect results from not being able to observe quotes, which forces us to
classify trades using the tick test. Our estimated order �ows for the Eurodollar datausing the tick test will be noisier than the order-�ow measure for the other assets, whichwe obtain by using the Lee and Ready algorithm. However, Ellis, Michaely and O�Hara(2000) show that the tick test does not induce a systematic bias into the resulting order-�ow data.The foreign ETFs trade in U.S. dollars. As a robustness check to our results below,
we wish to evaluate the e¤ect of our public and private information shocks on foreignequity returns measured in foreign currencies. Unfortunately, we are unable to obtainhigh-frequency quote and transaction data on the spot market foreign exchange ratesassociated with our 12 foreign countries. We therefore use currency future contractstraded on the CME. We obtain time-and-sales data for the Euro, Japanese Yen, U.K.Pound, Swiss Franc, and Canadian Dollar futures contracts.13 The contracts are pricedin U.S. dollars per unit of foreign currency. Again, we use the tick test to categorize thetransactions data as purchases or sales. We use the 3-month futures contracts, becausethey are the most liquid.One di¢ culty with combining our various data series is that the markets that we
analyze have slightly di¤erent trading times. The Eurodollar and foreign currency futurescontracts trade on the CME, where the trading hours are from 8:20 a.m. to 3.00 p.m.EST. The ETFs trade on the AMEX, where the trading hours are from 9:30 a.m. to4.00 p.m. EST. In our analysis, we constrain the aggregate data set to a common period.We also divide the trading day into subperiods, to determine the in�uence of one marketon the other. We therefore divide the day into eleven 30-minute intervals, with the �rstinterval starting at 9:30 a.m. EST and the last interval ending at 3.00 p.m. EST. Thisresults in a total of 15,598 half-hour observations for the entire data set. We use the lastmid-quote recorded during each half-hour interval as our price.14 Quote revisions are thelog di¤erences of these prices. Signed order �ow is the total number of purchases less thetotal amount of sales during the interval.Another di¢ culty with the data set is that the trades and quote revisions display
an intra-day seasonality. We therefore perform an initial deseasonalization by projectingthe order �ows and quote revisions data on time-of-day dummy variables, and use the
13 As in Fair (2003), the euro futures contract series is the German Deutsche Mark futures contractprior to 1 June 1999, and the euro futures contract after that. Both contracts traded somewhat beforeand after this date, but this date is a reasonable splicing date, because at that time liquidity started toswitch from the German Deutsche Mark market to the euro market.14 For the Eurodollar and foreign currency futures contracts, we use the last transaction price
recorded during the interval.
7

mean-centred residuals as our basic data series.Table 1a shows sample statistics for the quote revisions on the Eurodollar futures
contracts, the U.S. and foreign ETFs, and the foreign currency futures contracts. TheEurodollar futures contracts have a very small average mean return and a low standarddeviation relative to the other series. The contracts with maturities of less than oneyear are very liquid, with almost all intervals recording a quote (transaction price). TheETFs are much more volatile, with standard deviations above 0:2 per cent per half-hourof trading for all countries. The U.S. ETF (Spider) is very liquid, with observationsrecorded in 99:7 per cent of all intervals. The foreign ETFs are naturally less liquid, withsome contracts having a quote observation in only 40 per cent of the intervals. This maycomplicate the short-horizon analysis of returns; however, our daily and weekly holdingperiods make this issue much less important. The foreign currency contracts are allliquid.Table 1b shows the sample statistics of the order-�ow data for the assets. These
data are displayed in numbers of net purchases per half-hour period. For example, the3-month Eurodollar futures contract has an average of 0:029 contracts purchased neteach half-hour during the sample period. As can be seen, the net number of contractstraded each interval ranges widely for the Eurodollar contracts, the U.S. ETF, and theforeign currency futures contracts, indicating a fair degree of trading activity.15 Someof the foreign ETFs trade much less frequently, with trades recorded in approximately20 per cent of all the intervals. We obtain the global private information shocks fromtrading in the Eurodollar and U.S. ETF markets, both of which are quite liquid.Table 1c shows the correlation coe¢ cients between the log price changes of the ETF
and their underlying MSCI indexes for daily and weekly holding periods. The correlationsrange from 0:603 to 0:802 at the daily interval, whereas they rise to above 0:85 at theweekly interval. There are two reasons for the less-than-perfect correlations. First, theETF may not be able to hold stocks in the same composition as that of the MSCI index.For example, if a particular foreign stock is a large portion of the foreign index, thenthe ETF fund manager may have trouble tracking the index while keeping the ETFdiversi�ed enough for U.S. tax and regulatory purposes. Second, investors are not ableto arbitrage all di¤erences between the price of the ETF and the underlying stocks, dueto transactions costs and di¤erences in trading times.16 The e¤ect of timing di¤erenceswill be particularly large at daily intervals. Nevertheless, the correlations are high enough
15 The frequency of observations recorded for the Eurodollar and foreign currency contract data arethe same for both the quotes and order �ows for the series, due to the use of time-and-sales data.16 The prices of the ETFs are recorded at close of trade during U.S. trading hours, whereas the
MSCI indexes are calculated at close of trade in the national markets.
8

at the weekly interval that we are con�dent that the ETFs represent the U.S. prices ofthe foreign equities.Table 2a shows the contemporaneous correlations between the quote revisions on
the assets. The top part of the table shows the correlations between the Eurodollarfutures, the U.S. ETF, and the foreign currency futures contracts. There is a highdegree of correlation between price movements on the short-dated Eurodollar futurescontracts. The negative correlation between the U.S. ETF quote revision and those onthe Eurodollar contracts implies that price gains in the U.S. ETF are associated withrising Eurodollar interest rates. In our sample, the U.S. Federal Reserve raised interestrates as the equity market was gaining, and then lowered rates as the market declined.The correlations with the foreign currency contracts indicate that an increase in the U.S.equity market is associated with a strengthening U.S. dollar against all of the foreigncurrencies except the Canadian dollar. The correlations among the U.S. and foreignequity quotes at the bottom part of Table 2a indicate that common factors are a¤ectingthe returns on these assets during U.S. trading times.The net purchases data also display common variation, though the correlations are
not as high (Table 2b). Again, the short-dated Eurodollar contracts display commonvariation. Investors purchase Eurodollar contracts when they are selling the U.S. equitymarket, as shown in the middle of the table. The bottom part of the table indicates somecommon variation to net purchases across the ETF markets.In our analysis below, we study the e¤ects of information shocks that arise in the
U.S. money and equity markets on foreign equities. This implies a causal (time-series)relation that we should establish �rst. We thus undertake a number of Granger causalitytests. In the �rst set of tests, we examine whether foreign equity market order �ows andquote revisions cause either quote revisions or order �ow in the Eurodollar market. Inthese tests, we regress the quote revision or order �ow in the U.S. money market on 12lagged values of order �ow and quote revisions in the market.17 We also include 12 laggedvalues of the U.S. or foreign ETF order �ows and quote revisions, to determine whetherthe coe¢ cients on the latter variables are jointly signi�cant, yielding a test statistic thatis distributed as �2(12).Table 3a shows the asymptotic marginal signi�cance levels (P -values) of the tests. A
small value would indicate predictability of the U.S. or foreign equity market variablefor the U.S. money market. None of the 44 statistics is signi�cant at a 5 per cent level,indicating that neither the order �ows nor the quote revisions from the U.S. or foreignETF markets Granger-cause the Eurodollar market.
17 We use 12 lagged values to capture the e¤ects of a full day of trading. Our results are robust tothis choice.
9

We repeat the same test for the U.S. equity markets quote-revision and order-�owregressions. We also test (Table 3b) whether the Eurodollar variables help predict move-ments in the U.S. equity market. There is clear evidence that Eurodollar order �owsand quote revisions cause movements in U.S. equity order �ows and quote revisions. Incontrast, only a few of the foreign ETF variables Granger-cause order �ows or quoterevisions in the U.S. ETF.We also test (Table 3c) whether the U.S. money and equity markets Granger-cause
the foreign equity markets. Lagged order �ow in the Eurodollar and U.S. ETF marketsis a signi�cant predictor of future quotes and order �ows in a number of countries.Lagged quote revisions in the Eurodollar and U.S. ETF markets yield a large amountof predictability in the foreign ETF order-�ow processes. Investors who transact in U.S.trading times appear to base their foreign buying decisions on recent price movementsin the U.S. markets. There is also a strong relationship in the foreign quote-revisionregressions. ETF market makers respond to lagged order �ows and quote revisions in thetwo U.S. markets when they set their quotes.The tests indicate that price discovery occurs �rst in the U.S. money and then in
the U.S. equity market. This information is subsequently impounded into foreign equityprices. This sequence is related to the relative liquidity of the markets. When investorsreceive private news about �global�factors (i.e., factors that a¤ect many asset markets),they undertake transactions in those markets that are the most liquid. Thus, the initialprice response in the Eurodollar and U.S. ETF markets may simply result from therelative liquidity of the markets. The market makers in the less-liquid market observethese prices and then adjust their quotes.
2.2 The Eurodollar futures contract and U.S. monetary policy
This paper uses the rate on Eurodollar futures contracts to estimate monetary policyshocks. Previous research has provided evidence on several components in the Eurodol-lar futures interest rate. Cochrane and Piazzesi (2002) show that the (spot) Eurodollarinterest rate can successfully forecast moves in the Federal funds target rate, the ratewhich anchors moves in the spot Federal funds rate. Lee (2003) examines the closeconnection that exists between the overnight Federal funds market and its Eurodollarcounterpart (the �on-shore �o¤-shore interest di¤erential�). He �nds a small potentialarbitrage between the two rates, but notes a number of frictions that may prevent ar-bitrage trades from happening. Stigum (1990, p. 911) also notes the close connectionbetween the Eurodollar and domestic interest rate markets and quotes a Eurobanker assaying that �Rarely does the tail wag the dog. The U.S. money market is the dog, the
10

Euromarket the tail.�She goes on to say that: �The truth of this statement has created aforeign contingent of Fed watchers �in London, Paris, Singapore and other Eurocenters.... Eurobankers must understand the workings of the U.S. money market and followclosely developments there.�Piazzesi and Swanson (2004) show that Eurodollar futuresrates predict future Federal funds rates. In addition, they �nd a signi�cant time-varyingrisk premium in the futures rates, which can complicate the extraction of monetary policyforecasts from the futures�rates.Thus, we can break the price of the Eurodollar futures contract into three components.
The �rst is the forecast of the Federal funds rate (the �monetary policy�component). Thesecond is the forecast of the di¤erence between the Eurodollar interest rate (LIBOR) andthe Federal funds rate (the �on-shore �o¤-shore interest rate di¤erential�component).The third is the risk-premium component from holding the contract. Our assumption inthis paper is that trades in the Eurodollar market re�ect private information about thethree components.We use this framework to extract monetary policy innovations. Piazzesi and Swanson
(2004) note that daily changes in the price of a Eurodollar futures contract can be usedas a measure of a monetary policy shock, since the risk-premium component is relativelystable over their 2-day window. We use the change in the price of a short-term Eurodollarfutures contract at the time of the target rate announcement as our measure of a monetarypolicy shock. Our assumption is that neither the risk-premium component nor the on-shore �o¤-shore interest di¤erential component will change signi�cantly during this half-hour period. Below, in our analysis of the microstructure data, we will show how to geta good measure of the unanticipated move in the rate at high frequencies. For now, weprovide some simple forecasts using daily data. In Figure 1, we show how the price ofthe 6-month Eurodollar futures contract is related to future Federal funds target moves.From June 1999 to June 2000, the Eurodollar futures lead the Federal funds target rateincreases. Likewise, from November 2000 to November 2001, the Eurodollar futures leadthe target rate decreases. In the earlier part of the sample, from April 1996 to June 1999,there are two �false�predictions, but, for the most part, the Eurodollar futures correctlypredicts no changes in the target and leads the increase and decrease in the target rate.To formalize how well the Eurodollar futures contract can forecast target rate changes,
we estimate the forecasting model of Cochrane and Piazzesi (2002). We estimate themodel in price form; i.e., we calculate a �price� for the Federal funds target rate asP TR� = log(100�TR� ), where TR� is the target rate at time � . We make this estimationto be consistent with our public and private information system of equations used insection 3, which are in quote revision form. The forecast regression is then
�P TR� = a+ bP TR��1 + cSPj��1 + "j� ; (1)
11

where �P TR� = P TR� � P TR��1 is the �return�on the target rate at time � , when a changeto the target rate is announced; P TR��1 is the target rate 30 minutes before the announcedchange to the target rate; and SPj��1 = P TR��1 � log(PED��1) is the spread between thelog target rate price and the log Eurodollar futures price on the j-month contract, alsorecorded 30 minutes before the change to the target rate. Note that the time index, � ;is an event time index. In our sample period, there are 19 changes to the target rate, so� = 1; :::; 19:18
We run the Cochrane-Piazzesi regression separately using each of the Eurodollar fu-tures contracts. Table 4 shows the results. The 6-month contract has the highest predic-tive power, with an R2 of 0:918: The negative coe¢ cient on the spread is to be expected;if the �price�of the target rate is above that on the Eurodollar contract, the negativecoe¢ cient indicates that a decrease in the Federal funds price is forecast, so that itmoves closer to that of the Eurodollar contract. Overall, the regressions indicate thatthe spread between the Eurodollar futures contracts and the current level of the targetcontains signi�cant information about future changes to the Federal funds target.
3 Private Information in U.S. Asset Markets
In this section, we use microstructure theory and a modi�cation of a standard empiricalmodel to obtain measures of private and public information shocks in the U.S. moneyand equity markets.19 We start by outlining our general modelling approach and thenapply it to the U.S. money and equity markets. The model yields public and privateinformation shocks from the two markets that are used in the cross sectional analysis ofinternational stock returns in section 4. However, they are also of interest in their ownright for revealing the impact of trades based on private information in aggregate U.S.markets.
3.1 General modelling approach
Theoretical papers designed to explain price changes in a microstructure setting haveemphasized two factors: the optimal inventory level of the specialist and the responseof the quote to information revelation. Our approach is to focus on the information-revelation component while controlling for inventory and liquidity e¤ects. Figure 2 shows
18 Following the literature, we exclude the change to the target rate following the terrorist attacksof September 11, 2001.19 See O�Hara (1997) for a discussion and derivation of domestic microstructure models. For a
discussion and derivation of international microstructure models, see Lyons (2001). For a survey ofempirical time-series microstructure models, see Hasbrouck (1996).
12

the stylized timing convention that is present in the models. An investor observes theoriginal quotes (qbt�1 is the bid, q
at�1 is the ask) set by the market maker at time t � 1.
The investor then decides on their trade (i.e., net order �ow), xt; which is driven partiallyby private information and by liquidity needs. Public information news arrives after thetrade is completed and the market maker sets new quotes at time t, prior to any newtrades being completed.To estimate the public and private information shocks in a particular asset market,
we adopt the linear vector autoregression of Hasbrouck (1991). As he points out, manymicrostructure imperfections (e.g., inventory control e¤ects, price discreteness, exchangemandated price smoothing) can cause lagged e¤ects in order-�ow and quote-revisiondynamics. We therefore model investor order �ow as a linear function of past �ows andquote revisions:
xt = c+ �(L)rt + �(L)xt + v(x)t; (2)
where xt is the (net) order �ow in the market; rt is the quote revision on the asset;and �(L) and �(L) are polynomials in the lag operator. The residual in this equation(v(x)t) includes two components. The �rst is unanticipated trades due to liquidity shocks:investors will undertake trades in an asset market in response to random shocks to theirwealth. The second component is unanticipated trades due to new private information:investors will undertake trades when their private assessment of the asset�s value di¤ersfrom the prevailing market quote.20
Quote revisions can be modelled using a similar autoregressive structure:
rt+1 = c+ (L)rt + �(L)xt + �v(x)t + v(r)t: (3)
The lagged quote revision and order-�ow variables are also present to capture tran-sient microstructure e¤ects. Note that contemporaneous unanticipated trades (v(x)t)are included in this equation, given the above assumption about information revelationin microstructure time. Because the explanatory variables account for microstructuree¤ects and private information, the disturbance v(r)t re�ects public information news.The combined system of (2) and (3) thus provides two (orthogonal) shocks that representprivate and public news in an asset market, respectively.
20 We can improve our measures of private information by having as much of the e¤ects of laggedpublic information removed from them as possible. This means that, instead of using a statisticalcriterion (such as AIC or SIC) to choose the optimal lag length, L, we choose large lag lengths thatare likely to be longer than those mandated by a statistical test or casual economic reasoning. Wethus choose a lag length equal to just over one day of trading (12 half-hour intervals) for our base-caseanalysis.
13

In this system, a private information shock will cause a sequence of quote revisionsas the information becomes absorbed into the market price. The key di¢ culty is inidentifying the private information component of the (unanticipated) trade (v(x)t). Theidentifying assumption is that, in a market with informed and uninformed traders, or-der �ow conveys information and therefore causes a persistent impact on the security�sprice.21 Trades based on liquidity or inventory have no information value and thus haveonly a transitory impact on prices. Therefore, with the passage of time, all rationalagents expect quotes to revert (on average) to the fair value of the security,
as s! T;E�(qbs + qas )=2� pT j�t
�! 0; (4)
where s is some future time; T is the terminal time when the true value of the security,pT , is revealed; and �t is the current (time t) information set. Private information aboutan asset�s value will cause a change in the fair value of the security as the informationis revealed through trading and becomes incorporated in the market�s expectation ofthe price. To calculate the e¤ect of a private information shock on an asset�s price,we calculate the long-run impact that unanticipated trade orders have on the security�squotes.To measure the permanent e¤ects of an unanticipated trade, we construct the change
in the (log) price of the asset over the holding period, H:
rt;t+H � log(Pt+H)� log(Pt): (5)
We can then model the H-period return using the same structure as above:
rt;t+H = c+ (L)rt + �(L)xt + �v(xt) + v(r)t: (6)
In this equation, the holding-period return is driven in part by private information �news�that has been revealed to the market in the form of unanticipated trades (v(xt)). Theseunanticipated trades are noisy measures of private information, because they includeliquidity or inventory e¤ects. The key economic identi�cation that we obtain from themicrostructure literature is that liquidity e¤ects are transient, whereas information ef-fects are permanent. The trades will represent private information if the � coe¢ cient isstatistically signi�cant for longer holding periods.Our econometric speci�cation is similar to that by Hasbrouck (1991), in that a
reduced-form speci�cation for trades is used to obtain a residual that is a noisy mea-sure of the private information news. He uses impulse-response functions to obtain the
21 Standard microstructure theory models with this set-up include: Kyle (1985), as an example ofan auction or batch strategic trading model; and Glosten and Milgrom (1985) and Easley and O�Hara(1987), as examples of sequential trade models.
14

impact of an unanticipated net purchase on quote revisions. Our method has direct testsof the private information e¤ects on returns via an examination of the signi�cance of the� coe¢ cient. Our approach provides robust standard errors on the impact of unantici-pated trades on returns, something that is not easily available in a reduced-form VARwith simultaneous variables on the right-hand side.22
3.2 Private and public information in U.S. money and equitymarkets
In this section, we describe our model of net purchases and quote revisions in the Eurodol-lar futures and U.S. ETF markets. While we base our model on the general approach ofsection 3.1, there are two additional issues that we must face. The �rst is that we areestimating the dynamics of quote revisions and order �ows in the U.S. money and equitymarkets simultaneously. An assumption is therefore required about the information setsof the market makers in the two markets. We assume that the market makers in bothmarkets can observe past order �ows and prices from both markets.23 In this way, privateinformation shocks in one market may be transmitted to the other market.The second issue is the assumed variance-covariance stationarity of the data needed
to estimate the VAR, which is clearly not the case with the Eurodollar futures contract.24
Figure 1 shows that the mean of the Eurodollar rate changes over time as it �uctuatesaround the Federal funds target rate. We therefore model the conditional mean of theEurodollar rate as a function of the Federal funds target rate.Following our general approach in section 3.1, the �rst equation in the system models
the time-series process of the order �ow in the Eurodollar futures market (xEDt ),
xEDt = c+ a(L)rEDt + b(L)xEDt + c(L)rUSt + (7)
d(L)xUSt + gP TRt�1 + hSPt�1 + v(x)EDt :
22 Conventional measures of standard errors from this system are likely to be understated, due totwo problems. The �rst is that extending the holding period of the asset out to H periods will result ina moving-average error process in (9) and (10). The second problem is that the residuals in our intradaydata are likely to be heteroscedastic, in line with other microstructure studies. We therefore report allresults using Newey-West (1987) standard errors with a lag length equal to the minimum of H � 1; or12 half-hour trading intervals.23 We are assuming that sophisticated investors will trade on their superior knowledge of macroeco-
nomic factors in several liquid markets simultaneously. Market makers would realize this and use asmany sources of information as possible to reduce the information asymmetry. They can see aggregatetrading activity in other asset markets and infer the signs of the recent trades from the cross-section ofcontemporaneous volume and price data.24 In the steady state of this system, information shocks would be absent and inventories would be
at desired levels. Expected returns are constant and prices are thus a martingale.
15

In this equation, net purchases in the Eurodollar futures market are linear functions ofpast net purchases and quote revisions in both the Eurodollar and U.S. ETF markets.Current trades are a function of these public information variables, due to various mi-crostructure e¤ects, which, in our setting, may have an in�uence across several markets.We also include the two �monetary policy� variables that were used in the Cochrane-Piazzesi target rate regressions: the price of the lagged Federal funds target rate (P TRt�1)and the spread between the log target-rate price and the log Eurodollar futures price(SPt�1 = P TRt�1 � log(PEDt�1 )). Recall that both variables were shown to have good ex-planatory power for forecasting future U.S. Federal Reserve policy moves in Table 4. Ifagents trade in the Eurodollar market in anticipation of future Fed moves, these variablesshould help capture those e¤ects.The order-�ow process for the U.S. ETF can be modelled similarly:
xUSt = c+ a(L)rEDt + b(l)xEDt + c(L)rUSt + d (L)xUSt (8)
+gP TRt�1 + hSPt�1 + kv(x)EDt + v(x)USt :
Equity market order �ow is also a function of past order �ow and quote revisions in thetwo markets.25 If sophisticated investors trade in the equity market in anticipation ofinterest rate changes by the Federal Reserve, then the monetary policy variables fromthe Cochrane-Piazessi regressions should help capture this �ow. Following our Grangercausality test results, we assume that the equity market maker sees the unanticipatedorder �ow from the Eurodollar money market. The �rst two equations then provide(orthogonalized) residuals that contain the private information of sophisticated investorsin the money and equity markets.The third equation in the system models the quote revision process in the U.S. money
market:
rEDt;t+H = c+ �(L)rEDt + '(L)xEDt + !(L)rUSt + �(L)xUSt (9)
+�P TRt�1 + SPt�1 + �EDv(x)EDt + �USv(x)
USt + v(r)EDt :
In this equation, the holding-period return on a Eurodollar futures contract is a functionof past quote revisions and order �ows in the two markets. These may have an in�uenceover short holding periods, because microstructure e¤ects are important. As the holdingperiod lengthens, these variables are less likely to have an in�uence. We also includethe monetary policy variables in this regression, for the reasons given above. The closerelationship between the Eurodollar and target rates implies that the spread variablemay help to capture the movement of the rates towards each other.25 The coe¢ cients in (8) are di¤erent from those in (7). The symbols are the same, because we do
not wish to increase the notational burden.
16

Quote revisions are also driven in part by private information �news�that has beenrevealed to the market in the form of unanticipated trades in both the money and equitymarkets (v(x)EDt and v(x)USt , respectively). These unanticipated trades are noisy mea-sures of private information, because they include liquidity or inventory shocks. As statedabove, the key economic identi�cation that we obtain from the microstructure literatureis that liquidity shocks are transient, whereas information shocks have a permanent e¤ecton the price of the asset. To measure the permanent e¤ects of information shocks, welook at quote revisions in the Eurodollar futures over the holding period, H:
rEDt;t+H � log(PEDt+H)� log(PEDt );
where PEDt is the price of the Eurodollar futures contract.26 Thus, the trades will repre-sent private information if the �ED or �US coe¢ cients are signi�cant for longer holdingperiods.We can gauge the e¤ect of public and private information on U.S. equity returns
similarly via:
rUSt;t+H = c+ �(L)rEDt + '(L)xEDt + !(L)rUSt + �(L)xUSt (10)
+�P TRt�1 + SPt�1 + �EDv(x)EDt + �USv(x)
USt
+&v(r)EDt � 1(�TR 6= 0) + v(r)USt :
In this regression, accumulated U.S. equity returns over the holding period, H (rUSt;t+H �log(PUSt+H) � log(PUSt )) are a function of past public information originating in the U.S.money and equity markets. Unanticipated money and equity market order �ows willforecast future equity returns if they contain private information that is relevant tothe equity market maker. As in our money market analysis, the key test is that theunanticipated money and equity market trades have an e¤ect on returns over longerholding periods (H = 1 day or 5 days).The half-hour (H = 1) version of the money market quote-revision regression (9)
provides an estimate of the expected change in the price of the Eurodollar contract.The residual from this regression (v(r)EDt ) will be the unexpected change in interestrates due to public news innovations. We can further decompose this residual usingdummy variables into those shocks that occur when there is a change to the Federalfunds target rate (1(�TR 6= 0)) and when there is not (1(�TR = 0)). During the half-hour period when the Federal Reserve changes interest rates, there is a clear causal chain
26 Under our assumption (4), this is equivalent, as time progresses, to the return on a buy-and-hold strategy over H periods in a Eurodollar futures contract. Note that a one-period return, rEDt;t+1;represents the change in the price of the contract over a half-hour interval.
17

from the money market to the equity market. Thus, the change in the price of theEurodollar contract during these particular half-hour periods (1(�TR 6= 0)) provides ahigh-frequency counterpart to the monetary policy shocks constructed by Cochrane andPiazzesi (2002). We therefore include these residuals in the equity market order-�owregression.
3.3 Results
Table 5a shows results of the �rst two equations from the model. The estimate of theEurodollar order-�ow regression is at the top. Overall, the instruments do a poor job incapturing expected Eurodollar order �ow: the R2 statistic is only 0:006.27 The monetaryvariables are not signi�cant, which suggests that traders do not position themselvesaround monetary policy changes. This result may be misleading, however, because thesetrades could occur at any time, and thus trying to capture them with one lagged valuemay not be su¢ cient. The second regression is for U.S. equity market order �ow. Thisregression has an adjusted R2 statistic of 0:083, which indicates that the instruments havesome ability to forecast the next period�s order �ow. The sums of the U.S. ETF laggedorder-�ow and quote-revision coe¢ cients are signi�cant, as are the lagged Eurodollarquote revisions. The spread variable is also signi�cant, with a positive coe¢ cient.The poor ability of the selected instruments to capture order-�ow variation raises
concern about the use of the residuals from these regressions in the holding-period re-turn regressions (9) and (10). The low degree of explanatory power indicates that theinstruments are not able to capture much of the short-run inventory dynamics that arepresent in the markets. The residuals will therefore contain more of these short-run in-�uences, making them noisier signals of the long-run information component. This, inturn, makes our subsequent �ndings of signi�cant information e¤ects more conservative.Table 5b shows the results of estimating the holding-period returns (9) on the Eu-
rodollar futures contract over periods ranging from one half-hour to �ve trading days.The ability of the selected instruments to model short-run movements in Eurodollar quoterevisions is very high, with the half-hour regression having an R2 statistic of 0:752: Asthe holding period lengthens, the statistics decrease rapidly, in line with similar estimatesof daily and weekly returns throughout the asset-pricing literature. The spread variableis signi�cant at conventional levels for all of the holding periods. When the spread ishigher, the regressions in Table 4 show that the price of the target asset was expected to
27 Throughout this paper, the R2 statistics are adjusted for degress of freedom. The low degree ofexplanatory power is similar to estimates of order �ow in other asset markets. For example, Hasbrouck(1991) obtains an R2 of 0.086 when he estimates the order �ow of an individual stock.
18

fall (an increase in the target rate was likely). The spread shows that a decrease in theEurodollar price (an increase in the Eurodollar rate) is also likely.The regressions also include the unanticipated order �ows from the money and equity
markets (i.e., the residuals from the order-�ow regressions in Table 5a). The Eurodollarorder-�ow variable is signi�cant at all holding periods, which indicates that trades basedon private information are present in the Eurodollar futures market. Sophisticated agentsappear to have superior information about the direction of future U.S. interest rates.When they trade, the information becomes incorporated into market rates. The marketmakers do not appear to use equity market order �ow for longer-run pricing decisions,providing further evidence that the direction of causality is from the money market tothe equity market.Table 5c shows the estimates of the holding-period returns on the U.S. ETF. As
with the quote-revision regressions, the half-hour holding period returns display a largeamount of predictability, with an R2 statistic of20:3 per cent. As the holding period lengthens, the degree of linear predictability againnaturally falls. Neither of the two monetary policy variables from the Cochrane-Piazzesiregressions is signi�cant. Rather, the in�uence of the money market is captured by theinformation shocks from the Eurodollar market. Unanticipated money market order �owis signi�cant for the half-hour to 5 day holding periods. Thus, private information re-vealed in the U.S. money market helps predict subsequent U.S. equity market movements.We note that the negative coe¢ cients are in line with the unconditional negative corre-lation coe¢ cients between the price of the ETF and U.S. equity market shown in Table2; traders are adjusting their positions in line with the movements between interest ratesand equity returns during this period.The e¤ect of an unexpected change in the price of the Eurodollar contract when there
is a Federal Reserve policy change (v(r)EDt 1(�TR 6= 0)) is shown in the next column ofTable 5c. The positive coe¢ cients are in line with other estimates in the literature: apolicy-driven increase in interest rates causes a decline in equity market prices. However,the coe¢ cients are signi�cant at conventional levels for the half-hour and 1 day holdingperiods only. At the 5 day horizon, the coe¢ cient has a P-value of 0:124.There are two ways to interpret this �nding. The �rst is that, although public news
about U.S. monetary policy changes is quickly incorporated into U.S. equity marketreturns, the news has no long-run e¤ect on prices. However, this interpretation wouldbe at odds with a large and growing literature that �nds that unexpected changes to theFederal funds target have an e¤ect on longer-run asset market returns.28
28 Researchers who �nd a signi�cant in�uence of monetary policy on U.S. stocks include Schwert(1981), Pearce and Roley (1985), Hardouvelis (1987), Jensen, Mercer and Johnson (1996), Patelis (1997),
19

The second interpretation of our results is that there are too few (19) changes to thetarget rate during our sample period. Longer-run returns are noisier and the power of theregressions to detect the e¤ect of the changes declines. In addition, other macroeconomicannouncements occur during the weekly holding periods. For example, there are U.S.payroll announcements during the week following six of the target rate changes in oursample. Five of these announcements are negative and would have the e¤ect of decreasingU.S. equity returns, as Andersen et al. (2004) show. Thus, the e¤ects of monetarypolicy shocks are being negated by the e¤ects of the U.S. employment shocks. Undereither interpretation of these public news shocks, it is important to note that the privateinformation shocks have a long-run impact.The last column in the table shows the e¤ect of unanticipated equity market pur-
chases over a half-hour period on future equity returns. The coe¢ cients are positive andsigni�cant for all of the holding periods examined. While this variable may re�ect bothliquidity and information shocks at short horizons, only the information-based compo-nent will have an e¤ect over longer holding periods. It is clear, then, that sophisticatedinvestors have private information about the aggregate U.S. equity market. When theytrade, this information is gradually incorporated into prices.
3.4 Interpretation
Our view of asymmetric information is di¤erent from the standard one, in which tradershave good information about a speci�c �rm. One way to view the equity market re-sults in this section is that traders have correlated private information about many �rms.Although the theoretical works of Subrahmanyam (1991) and Chan (1993) examine cor-related private information, they are silent on the economic origins of the information.Our contribution is to relate aggregate private information to factors that in�uence
the returns on many assets; in particular, monetary policy. We have shown that unan-ticipated changes in the Eurodollar rate when there is a Federal Reserve policy change,a public news shock, a¤ect U.S. stocks over a 1 day interval.29 However, private infor-mation originating in the U.S. money markets forecasts stock returns over 1 to 5 days.30
This suggests that it may take longer for investors to interpret the trades based on privateinformation about interest rates than the moves in the interest rate itself.
Thorbecke (1997), and Bernanke and Kuttner (2005). Changes in U.S. monetary policy also a¤ect foreignequity markets (Kim 2001).29 While monetary policy is one of the factors in�uencing prices, there are likely to be many others.
See Andersen et al. (2004) for an analysis.30 Melvin (2002) �nds that the exchange rate market switches to a more informed state on Federal
Open Market Committee days, which suggests greater private information revelation.
20

Saar (2001) notes that the price impact of trades may not be the result of supe-rior knowledge about the cash �ows on the assets being released to the market. Itmay, instead, be the result of the market maker assessing the distribution of demand ina heterogeneous investor environment. The market maker uses trades to obtain moreinformation about investor preferences and endowments. We note that this private in-formation is not �insider�information; rather, it is the superior interpretation of publicsignals. The expense devoted to �Fed watching�by many �nancial institutions suggeststhat the forecasting of Federal Reserve actions is a pro�table activity. Fed watchers (orthe agents who use their analyses) can thus be viewed as informed traders whose ordersconvey information.Given these �ndings, we are indi¤erent as to whether the private information we �nd
is about either the cash �ows on the assets or how these cash �ows will be demandedby market participants. Sophisticated investors could obtain superior knowledge of fac-tors that a¤ect the cash �ows that U.S. equities are claims to, or superior knowledgeabout future interest rate levels, from macroeconomic analysis. Alternatively, they couldobtain knowledge of future investor order �ow in the U.S. markets. In either case, theinformation asymmetry would likely impact foreign equity markets, as we show below.One question about our results is the long-lived nature of the private information
shock. Our daily and weekly results are bracketed by results in other studies that exam-ine the e¤ects of trading based on private information. For example, Hasbrouck (1991)examines the impact of private information on quote revisions that occur up to 20 trans-actions later. In contrast, Easley, Hvidkjaer and O�Hara (2002) �nd that a measure ofa stock�s probability of information-based trading is priced in the cross section of U.S.stocks using monthly data.Our results have implications for studies that attempt to link private information and
other market frictions to domestic asset prices. For example, other work has exploredsystematic factors in liquidity and their link to the cross section of U.S. stock returns(Chordia, Roll and Subrahmanyam 2000, Hasbrouck and Seppi 2001, and Pastor andStambaugh 2003). We note that liquidity and trading based on private informationare linked in many microstructure models. Our �nding of a role of common privateinformation may therefore provide some guidance for the economic origins of systematicliquidity.
4 The Cross Section of International Equity Returns
The previous sections have shown that trading based on private information predicts bothU.S. money and equity market returns over daily and weekly holding periods. In addition,
21

public information shocks in the Eurodollar market associated with policy changes a¤ectU.S. equity prices. If international equity markets are integrated, then the factors thata¤ect U.S. equity markets will also a¤ect international markets. In this section, weexplore whether these shocks are priced by estimating a latent-factor model of the crosssection of international equity returns.
4.1 Latent-factor model
To test whether the U.S. information shocks are priced factors in international markets,we use the latent-factor model of Hansen and Hodrick (1983) and Gibbons and Fer-son (1985). In this model, the excess return on a foreign asset, i; is a function of therealizations of K factors:
ri;t+1 = Et[ri;t+1] + �ift+1 + "i;t+1; (11)
where f is a K � 1 vector of factor realizations with Et[ft+1] = 0; �i = cov(ri;t+1; ft+1)
is a 1 � K vector of constants; and "i is an idiosyncratic error, uncorrelated with f:Equilibrium requires that the expected return on the asset be a function of the K sourcesof risk:
Et[ri;t+1] = �i�t; (12)
where �t is a K � 1 vector that contains the market price of risk of the factors.In the latent-factor approach, the factors are not speci�ed directly. Rather, there are
a number of instruments that forecast returns in the markets and are likely related tothe true, but unknown, factors. The price of risk of the k-th factor, �k;t, is written as alinear combination of the set of N instruments, It:
�k;t = �kIt; (13)
where the �k are coe¢ cients.Combining the assumption about the process driving returns (11), the equilibrium
condition (12), and the assumption on the market price of risk (13) yields a non-linearpricing equation for asset i:
ri;t+1 = �i�It + e"i;t+1;where the K � N � matrix contains the �k coe¢ cients on the instruments for the Kfactors and e"i;t+1 = �ift+1+ "i;t+1. This model is used to examine the cross section of Massets via:
Rt+1 = ��It + e"t+1:22

Rt+1 is the M vector that contains the quote revisions on the foreign countries. The Mby K matrix, �; is the loading of the returns on the time-varying factor returns. TheK by N matrix, �; are the coe¢ cients on the instruments; the linear combination, �It;represents the time-varying return on the latent factors.Because the factors are latent in this model, its ability to price the cross section of
international equity returns will depend on the selection of the instruments. Campbell(1996) asserts that the factors that price the cross section of asset returns should bethe innovations on those variables that can forecast the moments of the investment-opportunity set. In our model, with the assumption of international market integration,the innovations on those variables that forecast U.S. asset returns will be able to forecastthe international investment-opportunity set.31 Thus, we use the public and privateinformation variables from our time-series regressions for our instruments:
It = (constant, P TRt�1; SPt�1; v(x)EDt ; v(r)EDt � 1(�TR = 0);
v(r)EDt � 1(�TR 6= 0); v(x)USt ; v(r)USt ):
Our information set, It; includes the monetary policy variables that were shown to havesome predictability for the Eurodollar and U.S. ETF markets. We include the unantic-ipated order �ow and quote revision from the Eurodollar money market regressions, (7)and (9), respectively. Note that we segregate the public information shocks into thosethat have occurred as a function of changes to the target rate (�TR 6= 0) and those thathave not (�TR = 0). We also include the unanticipated order �ow and quote revisionfrom the U.S. equity market regressions, (8) and (10), respectively.Our interest centres on the public and private information content of the shocks from
the Eurodollar and U.S. equity markets. The unanticipated quote revisions representpublic information news in the two markets. As stated earlier, the unanticipated order�ows will contain elements related both to microstructure (e.g., liquidity or inventory)e¤ects and to shocks to the private information sets of sophisticated investors. Overlonger holding periods, the microstructure e¤ects will disappear and the informatione¤ects of the trades may be obtained by estimating:
Rt+H = �H�HIt + e"H;t+1; (14)
where Rt+H is the vector of H-period returns on the foreign equity markets. If private in-formation is part of a priced factor, the �H coe¢ cients associated with the unanticipated
31 In previous asset-pricing tests, the instruments It were the �usual suspects� that were found toforecast returns at monthly horizons. Examples include dividend yields, term structure slopes, short-term interest rates, and credit spreads. We focus on variables that have predictive ability over shorterhorizons.
23

order �ows will be signi�cant for longer holding periods (e.g., H = 1 day or 1 week).The model is estimated by generalized method of moments (GMM). We estimate the
system (14) separately for each holding period, H. The Newey-West (1987) form of theoptimal weighting matrix is used to capture any autocorrelation of heteroskedasticity inthe residuals. In its current form, the model is unidenti�ed due to the �H�H combination.We thus impose the standard identi�cation that the �rst K rows of the matrix �H areequal to an identity matrix. The cross-equation restrictions of the model can be testedusing the standard �2 test statistic from a GMM system.Using the latent-factor model to capture the cross section of returns has a number
of advantages.32 In this study, as with other empirical studies of market frictions onasset prices (e.g., Pastor and Stambaugh 2002, Hou and Moskowitz 2003), we do notspecify a model that directly ties asymmetric information to the cross section of expectedinternational returns.33 Rather, the cross section of returns should be explained by thosevariables that can predict time variation in the investment-opportunity set. Given thetime-series results above, the variables we have chosen should have some power to explainthe cross section. The advantage of the latent-factor model is that it can capture thepricing ability of all of the variables in a parsimonious setting.Another advantage of the latent-factor model is that it allows the data to reveal the
structure of the cross section of expected returns. This can answer a number of questions.For example, are private and public information shocks separate factors, or part of thesame factor? Do all of the countries examined load on the same shocks? Alternatively, asnoted by Campbell and Hamao (1992), the latent-factor model can be evaluated simplyby its ability to describe the cross section of returns.
4.2 Results
Table 6 shows the summary statistics of a one-latent-factor model. The �2 test statisticsof the cross-equation restrictions on the parameters are shown at the top of the table,along with their asymptotic marginal signi�cance levels (P -values). The statistics showthat the one-factor model is rejected for the one-half-hour (H = 1) returns, whereas it isnot rejected for the daily and weekly returns (H = 1 and 5 days). To judge whether themodel does a good job in capturing expected equity returns, we examine some variance
32 Latent-factor models have been used in a number of domestic and international asset-pricing tests.See Ferson (1995) for a survey.33 See, however, Easley, Hvidkjaer and O�Hara (2002) for such a model on domestic stock returns.
Albuquerque et al. (2003b) provide a model that relates returns and �ows to private information in aninternational setting. However, they do not test the e¤ects of private information on the cross sectionof asset prices.
24

ratios. The numerator of the ratio is the variance of the expected return on the foreigncountry ETF from the latent-factor model. The denominator is the variance of theexpected return from a regression of the ETF return on the same instruments. If themodel does a good job in capturing expected return variation, then the ratio should benear 1.00. As can be seen, the ratios are lower for the half-hour holding period, whereasthey rise for most countries for the daily and weekly intervals.The results of these tests contain a mixed message for the model. Formally, our choice
of instruments and the over-identifying restrictions are rejected for the half-hour holdingperiod, likely due to short-run microstructure e¤ects such as inventory rebalancing orliquidity shocks. The microstructure e¤ects will be captured (in part) by our instrumentsand will a¤ect half-hour holding-period returns as the market maker adjusts their quotesto the shocks. The quote adjustment process, however, appears to be more complicatedover half-hour intervals than the factor model indicates. The large number of data points(15,598) allows us to detect these small di¤erences even though the model captures alarge portion of the predictable returns based on these instruments.At longer holding periods of a day to a week, the microstructure e¤ects disappear
and pricing decisions are driven by the assessment of information in the market. Thecombination of our instruments and the over-identifying restrictions of the model are notrejected, which indicates that the information e¤ects driving longer horizon returns areless complicated than the shorter-run microstructure e¤ects. In addition, the varianceratios indicate that the model captures a signi�cant portion of expected return variation.Thus, given the formal model tests and the variance ratio results, we use the latent vari-able model as our starting point for analyzing the cross section of international returns.Table 7 shows the estimates of the �H coe¢ cients for the 10 foreign countries and
the three holding periods. The coe¢ cients on the German returns are normalized to 1:00for identi�cation. For each holding period, all of the countries load on the factor with asigni�cant coe¢ cient. This shows that the instruments are doing a good job in capturingthe common information e¤ects that are driving the cross section of international returns.An examination of the �H coe¢ cients reveals which of the individual variables are
priced in the cross section. Table 8 shows these estimates over the three holding peri-ods. Each cell contains three numbers; the �rst two are the estimated coe¢ cient fromthe model and its t-statistic. The third number [�-shock] is designed to show the eco-nomic signi�cance of the indicated variable. It is calculated as the absolute value ofthe estimated �H coe¢ cient times a one-standard-deviation shock to the variable, di-vided by the standard deviation of the latent factor. It is thus similar to a (normalized)one-standard-deviation shock analysis of an impulse response function.The coe¢ cients on the monetary policy variables are shown in the �rst two columns of
25

Table 8. As with the U.S. equity return regressions, these instruments show little abilityto price the cross section of international returns. The next three columns measure thee¤ects of the Eurodollar market on the foreign equity markets. At the longer holdingperiods, the unanticipated Eurodollar purchases (v(x)EDt ) are noisy measures of privateinformation released during U.S. trading times. The coe¢ cients on this variable are sig-ni�cant and negative, again in line with the U.S. ETF results. Thus, private informationreleased in the U.S. money market is part of the priced factor in the international crosssection. The e¤ects of the private information shocks are also economically important.A one-standard-deviation shock to the variable accounts for approximately 30 per cent(20 per cent) of the volatility of the factor at a half-hour (weekly) horizon.Unanticipated Eurodollar quote revisions (v(r)EDt ) represent public news shocks.
Shocks that are not associated with monetary policy moves (�TR = 0) have a nega-tive coe¢ cient and are statistically signi�cant at all horizons. Shocks that are associatedwith monetary policy innovations (�TR 6= 0) have a positive coe¢ cient and are signi�-cant for the half-hour and 1-day horizons. The shocks account for approximately 19 percent of the factor�s variability at the same intervals. The shocks are not signi�cant forthe weekly holding-period returns. The sign and signi�cance of the coe¢ cients attachedto monetary policy innovations over the three horizons match those obtained for U.S.ETF returns.Thus, during this period, the e¤ect of interest rate changes on equity market returns
depends on whether the change was driven by a policy move. However, both of the publicinformation interest rate shocks (policy and non-policy driven) have smaller measures ofeconomic signi�cance than do the private information shocks.The �nal two columns of Table 8 show the coe¢ cients associated with private and
public information shocks that arise in the U.S. equity market. Public information shocksin the U.S. equity market (v(r)USt ) are a part of the priced factor in foreign equity returns,in line with previous low-frequency studies that use excess U.S. equity market returns(e.g., Campbell and Hamao 1992, Bekaert and Hodrick 1992). The new result is thatprivate information shocks are also a priced factor for the half-hour and daily intervals.The coe¢ cients on unanticipated net purchases are positive and signi�cant for theseintervals. In addition, the private information shocks are large economically, with aone-standard-deviation shock being equivalent to 48:2 per cent of the variation in dailyexpected returns. The �-shock measures are large for the public information shocks evenout to a weekly horizon, which suggests that public information shocks take a long time tobe absorbed by the market. This may be misleading, however, since there will be factorsother than the money market shocks, which will be analyzed by sophisticated investors.We conclude that sophisticated U.S. investors obtain information that is related to the
26

common factors that in�uence asset prices around the world. When they trade in theU.S. equity index market, market makers in the ETFs can use this information to setforeign equity prices.
4.3 Interpretation
In the international literature, private information is used as an explanation of the homebias phenomenon (French and Poterba 1991, Gehrig 1993, Brennan and Cao 1997, andCoval 1999). In this literature, sophisticated agents have superior information aboutreturns on stocks in their own countries; e.g., German investors have superior knowledgeabout German �rms, which U.S. investors could not obtain. This generates an additionalsource of risk to investing in international stocks, which leads agents to invest in domesticequities.This view of the structure of private information has been challenged by Albuquerque,
Bauer, and Schneider (2003a), who show that sophisticated U.S. investors have privateinformation about global factors that a¤ect returns in many countries. They use a factoranalysis of monthly international transactions by U.S. residents to generate the globalfactor. We improve on their �ndings in two ways. First, we use high-frequency datato identify public and private information shocks based on well-established approachesfrom the microstructure literature. Second, we show that international trading basedon private information is related (in part) to U.S. interest rates. As with our domesticmarket analysis above, we acknowledge that there may be other important economicsources of private information that we are not modelling.The origins of the private information can be motivated in two ways. Sophisticated
agents, such as hedge funds, can conduct �top-down�analyses in which they generateprivate information about macroeconomic fundamentals from a superior interpretationof public information. The fundamentals could be related to either the U.S. or foreigneconomies. In either case, with integrated international markets, such information wouldbe useful for capturing return variation in many countries. The large number of PhDsemployed by such funds to generate private trading opportunities is consistent with thisstory. We note that, as with our domestic results, this private information about mone-tary policy does not come from information leakages from the Fed.Alternatively, order �ow in the U.S. markets could be acting as a �bottom-up�aggre-
gator of di¤use private information. Evans and Lyons (2004) construct a model of theforeign exchange market where order �ow aggregates the dispersed private informationabout productivity shocks in the two countries. They note that, whereas productivityshocks would occur at the level of the �rm, aggregate trades by agents in the country
27

would give a more precise estimate of the country�s productivity shock for that period.Evans and Lyons also note that agents�trades could be aggregating information aboutother variables that are realized at the micro level, such as money demand. Our U.S.shocks can therefore be interpreted as money-demand shocks and real shocks that arisefrom �rm-level information. Financial �rms in the U.S. that observe a large cross sectionof customer order �ow could then extract such information and use it for proprietarytrading. Again, with integrated markets, such U.S. information shocks would have aninternational e¤ect.We acknowledge that our results could be consistent with investors having country-
speci�c private information. Kodres and Pritsker (2002) present a model of rationalcontagion across countries. In their model, asset prices contain both a country-speci�cprivate-information component and a global public-information component. As informedagents trade securities of a speci�c country due to new private information, their portfo-lios will require rebalancing to maintain the desired exposure to the global risk factors.This will, in turn, cause trading in assets from other countries. Thus, private infor-mation revelation in one market causes trading in many other markets due to portfoliorebalancing.While our story may be consistent with country-speci�c private information, we be-
lieve that global private information factors o¤er a better interpretation. We are ob-taining the private information signals from aggregate U.S. money and equity markets.These signals are more likely to have value for equities in many markets than the country-speci�c signals originating in developing markets as in Kodres and Pritsker. For example,short-term U.S. interest rates have been found to have forecasting ability for internationalequity returns by Campbell and Hamao (1992), Dumas and Solnik (1995), Harvey (1991)and Ferson and Harvey (1994). One of the contributions of this paper is to show thatprivate information about U.S. interest rates is also a useful variable in these tests. How-ever, even if our private information shocks are speci�c to the U.S., our two main pointsremain valid: (i) trading based on private information is at least partially responsible forthe correlated moves in international equity markets; and, (ii) this private informationis, in part, related to U.S. interest rates.One question that we cannot answer from our data set is the identity of the agents
who are generating the private information. We are able to identify all private informa-tion generated during U.S. trading hours in U.S. markets. The information could comefrom sophisticated investors from many countries who are trading in U.S. markets. Forexample, foreign sophisticated investors (e.g., hedge funds) could obtain superior infor-mation about U.S. based factors if they devote signi�cant resources to that purpose andare able to pro�t from trading on the information. In this sense, what matters more for
28

international markets is the degree of investor sophistication, not the country in whichthey reside (Albuquerque, Bauer and Schneider 2003b).
4.4 Home currency returns
A number of studies have shown that asymmetric information is a signi�cant driver ofexchange rates (Lyons 1995, 2001; Evans and Lyons 2002; Covrig and Melvin 2002). Ifsophisticated investors generate private information about foreign exchange rates, theywill be able to trade assets denominated in the foreign currencies and make a pro�t. Thismay be driving our results, since the return on the foreign ETF that is traded in U.S.markets is composed of a home currency return on the index plus a change in the valueof the foreign exchange rate. It follows that the results of our previous analysis could bedue to sophisticated investors generating private information about the foreign exchangecomponent, rather than the foreign equity component.To show that the results for the equity markets were not solely due to exchange rate
e¤ects, we construct home currency equity returns by dividing the U.S. dollar price ofthe foreign country ETF by the foreign exchange rate from the futures market:
rHCt;t+H � log(PETFt+H =P FCt+H)� log(PEDt =P FCt );
where P FCt is the price of the foreign currency futures contract at time t. We note thatthis return only approximates the home currency return, because the spot exchange rateprice should have been used, but it is unavailable to us in microstructure time. Theapproximation, however, should be good because the variability of the futures price willbe dominated by movements in the spot exchange rate. We can project these homecurrency equity returns on the estimated latent factor from our model:
rHCt;t+H = 'H(b�HIt) + "�H;t+1; (15)
where b�H are the estimated coe¢ cients from the GMM estimation of (14). If the exchangerate e¤ects do not matter, then the 'H coe¢ cients in this regression should be close tothe �H coe¢ cients from the original GMM estimation. The null hypothesis is then
H0 : 'H = �H . (16)
Table 9 shows the ordinary least squares (OLS) estimates of (15) and the asymptotict-test statistics associated with (16). The P-values of the test statistics associated withthe test of (16) are also included. The parameter estimates of the loadings of the homecurrency returns are large for the half-hour holding period and then decline with theforecast horizon. None of the coe¢ cients is statistically signi�cant at the weekly horizon.
29

The small P-values on the half-hour test results for all of the countries except Canadashow that there is enough power to reject the joint equivalence of both estimates. Asbefore, this is likely related to the poor ability of the model to capture the microstructuree¤ects. The two estimates, however, are not statistically di¤erent in either the daily orweekly returns for all of the countries, which suggests that the information componentsof the returns are similar. We conclude that the changes in the foreign exchange rates aresomewhat related to the linear combination of the selected instruments obtained fromthe equity pricing model. The earlier results, however, were not driven solely by thisphenomenon.
5 Conclusions
Our goal in this study was to deepen our understanding of the links between foreignasset movements and news (public and private) originating in U.S. money and equitymarkets. Recent studies using high-frequency data show that public news about U.S.money and equity markets a¤ects equity markets abroad (Andersen et al. 2003). Ourmain contribution has been to show that some agents have superior knowledge aboutfuture U.S. interest rates and aggregate equity market returns. This superior knowledgeis partially revealed through trades that a¤ect daily and weekly returns on internationalstocks. This �nding gets to the core of Goodhart and O�Hara�s (1997) question as to howprivate information can have a global impact. Not only have we shown that public andprivate information about U.S. interest rates and aggregate equity markets predicts futureforeign equity market movements, but we have also shown that these are components ofthe factor that is priced in the international cross section.These �ndings suggest that further research should be conducted into the behavior of
domestic and foreign markets. In recent work, Pastor and Stambaugh (2002) and othersshow that market-wide liquidity is a state variable that is important for domestic assetpricing. Liquidity is de�ned as temporary price �uctuations induced by order �ow. Incontrast, private information is de�ned as permanent price �uctuations induced by order�ow. The literature has largely treated these as distinct concepts. As Kyle (1985) notes,however, the two quantities are correlated, since informed traders prefer to strategicallyplace trades in liquid markets to hide their behavior and maximize their pro�ts. Futureresearch on asset returns should attempt to distinguish between the two e¤ects anddetermine their economic origins.
30

References
[1] Albuquerque, Rui, Gregory H. Bauer, and Martin Schneider (2003a), �Characteriz-ing Asymmetric Information in International Equity Markets,�mimeo, Universityof Rochester.
[2] Albuquerque, Rui, Gregory H. Bauer, and Martin Schneider (2003b), �InternationalEquity Flows and Returns: A Quantitative Equilibrium Approach,�mimeo, Univer-sity of Rochester.
[3] Andersen, T., T. Bollerslev, F.X. Diebold, and C. Vega (2003), �Micro E¤ects ofMacro Announcements: Real-Time Price Discovery in Foreign Exchange, �Ameri-can Economic Review, 93, 38-62.
[4] Andersen, T., T. Bollerslev, F.X. Diebold, and C. Vega (2004), �Real-Time PriceDiscovery in Stock, Bond and Foreign Exchange Markets, �mimeo, NorthwesternUniversity.
[5] Bekaert, Geert and Robert J. Hodrick (1992), �Characterizing Predictable Com-ponents in Excess Returns on Equity and Foreign Exchange Markets� Journal ofFinance, 47(2) 467-509.
[6] Bernanke, Ben and Kenneth N. Kuttner (2005), �What Explains the Stock Market�sReaction to Federal Reserve Policy,�Journal of Finance, forthcoming.
[7] Brennan, Michael J., and H. Henry Cao (1997), �International Portfolio InvestmentFlows,�The Journal of Finance, 52, 1851-1880.
[8] Brennan, Michael J. and Subrahmanyam A. (1996), �Market Microstructure andAsset Pricing: On the Compensation for Illiquidity in Stock Returns,�Journal ofFinancial Economics, 41, 441-464.
[9] Brennan, Michael J., Narasimhan Jegadeesh, and Bhaskaran Swaminathan (1993),�Investment Analysis and the Adjustment of Stock Prices to Common Information,�The Review of Financial Studies, 6, 799-824.
[10] Campbell, John Y. (1996), �Understanding Risk and Return,�Journal of PoliticalEconomy, 104, 298-345.
[11] Campbell, John Y. and Yasushi Hamao (1992), �Predictable Stock Returns in theUnited States and Japan: A Study of Long-Term Capital Market Integration�, TheJournal of Finance, 47, 43-69.
31

[12] Carlson, John B., Jean M. McIntire and James B. Thomson (1995), �Federal FundsFutures as an Indicator of Future Monetary Policy: A Primer,�Economic Review,20-30.
[13] Chan, Kalok (1993), �Imperfect Information and Cross-Autocorrelation amongStock Prices,�Journal of Finance 48:1211-1230.
[14] Chordia, Tarun, Richard Roll and Avavidhar Subrahmanyam (2000), �Commonalityin Liquidity,�Journal of Financial Economics, 56, 3-28.
[15] Cochrane, John H. and Monika Piazzesi (2002), �The Fed and Interest Rates: AHigh-Frequency Identi�cation,� American Economic Review Papers and Proceed-ings, 92, 90-95.
[16] Connolly, R. and A. F. Wang (2003), �International Equity Market Comovements:Economic Fundamentals or Contagion?�Paci�c-Basin Finance Journal 11: 23�43.
[17] Coval, Joshua (1999), �International Capital Flows when Investors have Local In-formation,�University of Michigan, mimeo.
[18] Covrig, Vincentiu and Michael Melvin (2002), �Asymmetric Information and PriceDiscovery in the FX Market: Does Tokyo Know More About the Yen?,�Journal ofEmpirical Finance, .
[19] Craig, Alastair, Ajay Dravid and Matthew Richardson (1995), �Market E¢ ciencyAround the Clock Some Supporting Evidence in Using Foreign-Based Derivatives,�Journal of Financial Economics, 39, 161-180.
[20] Dumas, Bernard and Bruno Solnik (1995), �The World Price of Foreign ExchangeRisk,�Journal of Finance 50: 445-479.
[21] Easley, David, and Maureen O�Hara (1987), �Prices, trade size and information insecurity markets,�Journal of Financial Economics, 19, 69-90.
[22] Easley, David, and Maureen O�Hara (2002), �Microstructure and Asset Pricing, �in G.M. Constantinides, M. Harris and R. Stulz (eds.), Handbook of Economics ofFinance. Elsevier-North Holland, forthcoming.
[23] Easley, David, Soeren Hvidkjaer and Maureen O�Hara (2002), �Is Information Riska Determinant of Asset Returns?�, The Journal of Finance, 57, 2185-2221.
32

[24] Ellis, Katrina, Roni Michaely and Maureen O�Hara (2000), �The Accuracy of TradeClassi�cation Rules: Evidence from Nasdaq,�Journal of Financial and QuantitativeAnalysis, 35, 529-551.
[25] Elton, E. J., J. M. Gruber, G. Comer and K. Li (2002), �Spiders: Where Are theBugs?,�Journal of Business, forthcoming.
[26] Engle, Robert F., Ito Takatoshi and Wen-Ling Lin (1990), �Meteor Showers orHeat waves? Heteroskedastci Intra-Day Volatility in the Foreign Exchange Market,�Econometrica, 58, 525-542.
[27] Evans, Martin D.D. and Richard K. Lyons (2002), �Order Flow and ExchangeRates�, Journal of Political Economy, 110, 170-180.
[28] Evans, Martin D.D. and Richard K. Lyons (2004), �A NewMicro Model of ExchangeRate Dynamics�, mimeo, University of California Berkeley.
[29] Fair, C. Ray (2003), �Shock E¤ects on Stocks, Bonds, and Exchange Rates,�Journalof International Money and Finance, 22, 307-341.
[30] Ferson, Wayne E. (1995), �Theory and Empirical Testing of Asset Pricing Models,�in R.Jarrow et al. (eds.), Handbooks in OR & MS, vol. 9, 145-200.
[31] Ferson, Wayne E. and Campbell R. Harvey (1994), �An Exploratory Investigation ofthe Fundamental Determinants of National Equity Market Returns,�in The Inter-nationalization of Equity Markets, Je¤rey A. Frankel (ed.). Chicago: The Universityof Chicago Press.
[32] French, Kenneth, and James Poterba (1991), �Investor Diversi�cation and Interna-tional Equity Markets,�American Economic Review Papers and Proceedings, 81,222-226.
[33] Gehrig, Thomas (1993), �An Information Based Explanation of the Domestic Bias inInternational Equity Investment,�Scandinavian Journal of Economics, 95, 97-109.
[34] Gibbons, Michael R. and Wayne Ferson (1985), �Testing Asset Pricing Models withChanging Expectations and an Unobservable Market Portfolio�, Journal of Finan-cial Economics, 14, 217-236.
[35] Glosten, Lawrence R., and Paul R. Milgrom (1985), �Bid, Ask and TransactionPrices in a Specialist Market with Heterogeneously Informed Traders,�Journal ofFinancial Economics, 14, 71-100.
33
[36] Goodhart, A.E. Charles and Maureen O�Hara (1997), �High Frequency Data inFinancial Markets: Issues and Applications,�Journal of Empirical Finance, 4, 73-114.
[37] Hamao, Y., R.W. Masulis and V.K. Ng (1990), �Correlations in Price Changes andVolatility across International Stock Markets,�Review of Financial Studies, 3, 281-307.
[38] Hansen, Lars P. and Robert J. Hodrick (1983), �Risk Averse Speculation in theForward Foreign Exchange Market: An Econometric Analysis of Linear Models�, inJacob A. Frenkel (ed.), Exchange Rates and International Macroeconomics. Chicago:The University of Chicago Press.
[39] Hardouvelis, Gikas A. (1987), �Macroeconomic Information and Stock Prices,�Jour-nal of Economics and Business, 39, 131-140.
[40] Harvey, Campbell R. (1991), �The World Price of Covariance Risk�, The Journal ofFinance 46: 111-157.
[41] Hasbrouck, Joel (1991), �Measuring The Information Content of Stock Trades,�TheJournal of Finance, 46, 179-207.
[42] Hasbrouck, Joel (1996), �Modeling Market Microstructure Time Series,�Handbookof Statistics, 14, 647-692.
[43] Hasbrouck, Joel and Duane J. Seppi (2001), �Common Factors in Prices, OrderFlows and Liquidity,�Journal of Financial Economics, 59, 383-411.
[44] Hou, Kewei and Tobias J. Moskowitz (2003), �Market Frictions, Price Delay andthe Cross-Section of Expected Returns,�working paper.
[45] Jensen, G. R., J.M. Mercer and R.R. Johnson (1996), �Business Conditions, Mone-tary Policy, and Expected Security Returns,�Journal of Financial Economics, 40,213-237.
[46] Karolyi, G. Andrew, and Rene M. Stulz (1996), �Why Do Markets Move Together?An Investigation of U.S.-Japan Stock Return Comovements,�The Journal of Fi-nance, 51, 951-985.
[47] Kim, Soyoung (2001), �International Transmission of US Monetary Policy Shocks:Evidence from VAR�s,�Journal of Monetary Economics, 48, 339-372.
34

[48] King, Mervyn and Sushil Wadhwani (1990), �Transmission of Volatility BetweenStock Markets�, The Review of Financial Studies, 3, 5-33.
[49] King, Mervyn, Enrique Sentana and Sushil Wadhwani (1994), �Volatility and theLink Between National Stock Markets�, Econometrica, 62, 901-33.
[50] Kodres, Laura E. and Matthew Pritsker (2002), �A Rational Expectations Model ofFinancial Contagion�, Journal of Finance, 57, 769-799.
[51] Kuttner, Kenneth N. (2001), �Monetary Policy Surprises and Interest Rates: Ev-idence from the Fed Funds Futures Market,�Journal of Monetary Economics, 47,523-544.
[52] Kyle, Albert S. (1985), �Continuous Auctions and Insider Trading,�Econometrica,53, 1315-1335.
[53] Lee, Charles M. and Mark Ready (1991), �Inferring Trade Direction from IntradayData,�The Journal of Finance, 46, 733-746.
[54] Lee, Young-Sook (2003), �The Federal funds market and the overnight Eurodollarmarket�, Journal of Banking and Finance, 27, 749-771.
[55] Lin, W., Engle, R., and T. Ito (1994), �Do Bulls and Bears Move accross Borders?International Transmission of Stock Returns and Volatility,�Review of FinancialStudies, 7, 507-538.
[56] Lyons, Richard K. (1995), �Tests of Microstructural Hypothese in the Foreign Ex-change Market�, Journal of Financial Economics, 321-351.
[57] Lyons, Richard K. (2001), The Microstructure Approach to Exchange Rates, MITPress.
[58] Madhavan, A., M. Richardson and M. Roomans, (1997), �Why Do Security PricesChange? A Transaction-Level Analysis of NYSE Stocks,�Review of Financial Stud-ies 10(4), 1035-1064.
[59] Melvin, Michael (2002), �Exchange Rates and FOMC Days�, mimeo, Arizona StateUniversity.
[60] Newey, W. and K. West (1987), �A Simple Positive-De�nite Heteroskedasticity andAutocorrelation Consistent Covariance Matrix,�Econometrica 55, 703-708.
[61] O�Hara, Maureen (1997), Market Microstructure Theory, Blackwell Publishers.
35

[62] Pastor, Lubos and Robert F. Stambaugh (2003), �Liquidity Risk and Expected StockReturns�, Journal of Political Economy, 111, 642-685.
[63] Patelis, A. (1997), �Stock Return Predictability and the Role of Monetary Policy,�The Journal of Finance, 52, 1951-1972.
[64] Pearce, Douglas K. and V. Vance Roley (1985), �Stock Prices and Economic News,�Journal of Business, 58, 49-67.
[65] Piazzesi, Monika and Eric Swanson (2004), �Futures Prices as Risk-Adjusted Fore-casts of Monetary Policy�, NBER Working paper 10547.
[66] Rudebusch, Glenn D. (1998), �Do Measures of Monetary Policy in a VAR MakeSense�, International Economic Review 39(4), 907-31.
[67] Saar, Gideon (2001), �Investor Uncertainty and Order Flow Information�, workingpaper, New York University.
[68] Saar, Gideon and Lei Yu (2002), �Information Asymmetry about the Firm and thePermanent Price Impact of Trades: Is there a Connection?�, working paper, NewYork University.
[69] Schwert G. William (1981), �The Adjustment of Stock Prices to Information aboutIn�ation,�The Journal of Finance, 36, 15-29.
[70] Subrahmanyam, Avanidhar (1991), �A Theory of Trading in Stock Index Futures,�Review of Financial Studies 4:17-51.
[71] Stigum, Marcia (1990), The Money Market. Chicago: Richard D. Irwin, Inc.
[72] Susmel, R. and R. F. Engle (1994), �Hourly Volatility Spillovers Between Interna-tional Equity Markets,�Journal of International Money and Finance, 13, 3-25.
[73] Thorbecke, W. (1997), �On Stock Market Returns and Monetary Policy,�The Jour-nal of Finance, 52, 635-654.
[74] Werner, Ingrid M. and Allan W. Kleidon (1996), �U.K. and U.S. Trading of BritishCross-Listed Stocks: An Intraday Analysis of Market Integration�, The Review ofFinancial Studies, 9, 619-664.
[75] Yu, Lei (2003), �Basket Securities, Price Formation and Informational E¢ ciency�,working paper, New York University.
36

Figure 1 Six-month Eurodollar Futures and Fed Funds Target Rate
The two solid lines are the daily 6-month Eurodollar futures rate and the actual target-rate. The sample period is from April 1, 1996 to November 30, 2001. There were 20 target-rate changes in this period. The Eurodollar futures data are from the Chicago Mercantile Exchange (CME). The target rate is from the Federal Reserve Bank of New York.
0
1
2
3
4
5
6
7
8
1-Apr-96 14-Aug-97 27-Dec-98 10-May-00 22-Sep-01
Date
Inte
rest
Rat
e (p
erce
nt)

Figure 2 Timing of Quotes, Private Information, Trade Orders and Public Information
Private information is the persistent impact unanticipated trade orders have on the security price. To measure private information we estimate a system of equations similar to Hasbrouck (1991). The two main identification assumptions are the following: trade orders are in no part driven by public information and trade orders are driven partially by private information and liquidity needs. These two assumptions can be summarized as a timing convention. The timing is shown bellow, where 1−t
bq is the bid quote, 1−taq is the ask quote at time t-1
and tsx are the seller-initiated orders and t
bx are the buyer-initiated orders.
Initial Quotes
Private Information
Trade Orders Public Information
New Quotes
11 , −− ta
tb qq shock
ttbs xx , Shock t
at
b qq ,

Table 1a Summary Statistics of Quote Revisions on Eurodollar Futures Contracts,
Exchange Traded Funds and Foreign Currency Futures Contracts
The table shows summary statistics of quote revisions on Eurodollar futures contracts, Exchange Traded Funds (ETFs), and foreign currency futures contracts. The Eurodollar futures contracts are from the Chicago Mercantile Exchange (CME) and have a maturity of k months. The US ETF is the Standard and Poor’s 500 Depository Receipt (“Spider”) managed by State Street Global Advisors. The foreign country exchange traded funds are the “ishares” ETFs managed by Barclay’s Global Advisors. The source of the ETF data is the TAQ database. The foreign currency futures data are also from the CME and are denominated in US dollars per unit of foreign exchange. All of the series are aggregated to 11 one-half hour intervals during the common trading times of the CME and the NYSE/AMEX exchanges. The sample period is April 1, 1996 to November 30, 2001 resulting in a total of 15,598 half-hour observations. The quote revisions are the (log) change in the last quote recorded during each one-half hour interval, multiplied by 100. The table shows the: mean; standard deviation; first and 99th fractiles; the per cent of all intervals which have an observation (“freq”); and asymptotic marginal significance levels (P-values) of the Ljung-Box test statistics for autocorrelation out to the indicated lags. The intra-day seasonality has been removed from all of the quote revisions; the final column shows the P-value of a test of the null hypothesis of no intra-day seasonality on the raw data.
std. fractiles L.-B. Q-test Intra-day mean dev. 1st 99th freq. 1 lag 11 lags seasonal
(%) (% ) (%) (%) (%) (P – value) (P – value) (P – value) Eurodollar futures k = 3 0.0002 0.010 -0.021 0.021 91.197 <0.001 <0.001 0.007 k = 6 0.0003 0.013 -0.031 0.031 94.961 <0.001 <0.001 0.001 k = 9 0.0002 0.014 -0.037 0.036 95.313 0.059 <0.001 0.063 k = 12 0.0001 0.015 -0.038 0.038 94.031 0.617 0.001 0.070 k = 60 -0.0003 0.016 -0.053 0.044 42.797 0.028 <0.001 0.018
Exchange Traded Funds US -0.002 0.275 -0.714 0.702 99.711 0.207 0.359 0.245 Germany -0.002 0.251 -0.735 0.710 71.777 0.796 0.089 0.286 Japan -0.009 0.273 -0.777 0.712 93.210 <0.001 <0.001 <0.001 UK 0.002 0.245 -0.747 0.714 61.384 0.028 <0.001 0.060 Switzerland -0.002 0.226 -0.776 0.714 49.580 0.004 0.027 0.054 Canada -0.004 0.273 -0.977 0.856 41.444 0.234 0.049 0.214 France -0.002 0.217 -0.672 0.643 57.947 0.889 0.030 0.017 Netherlands 0.001 0.213 -0.598 0.632 46.624 0.048 0.301 0.052 Sweden 0.001 0.277 -0.825 0.823 46.759 0.012 0.016 0.003 Australia -0.004 0.241 -0.727 0.654 46.458 <0.001 <0.001 0.090 Italy -0.004 0.236 -0.714 0.687 54.754 0.538 0.036 0.011
Foreign Currency Futures Euro 0.001 0.120 -0.321 0.314 93.384 0.244 0.124 0.003 Yen -0.002 0.122 -0.326 0.340 98.442 <0.001 <0.001 0.047 UK Pound 0.002 0.093 -0.249 0.259 98.211 <0.001 <0.001 0.001 Swiss Franc -0.0001 0.137 -0.351 0.362 98.352 0.001 0.047 <0.001 Canadian $ -0.002 0.071 -0.198 0.201 98.282 <0.001 <0.001 <0.001

Table 1b Summary Statistics of Signed Order Flows of Eurodollar Futures Contracts,
Exchange Traded Funds and Foreign Currency Futures Contracts
The table shows summary statistics of signed order flows of Eurodollar futures contracts, Exchange Traded Funds (ETFs), and foreign currency futures contracts. The sources of the data are given in Table 1a. Using all observations, the signs of the trades in the Eurodollar and foreign currency futures contracts have been estimated using the “tick rule” as detailed in the text. The ETF trades from the TAQ database have been labeled as purchases or sales according to the Lee and Ready (1991) algorithm. All of the order flow series are aggregated to 11 one-half hour intervals during the common trading times of the CME and the NYSE/AMEX exchanges. The sample period is April 1, 1996 to November 30, 2001 resulting in a total of 15,598 half-hour observations. The table shows the: mean; standard deviation; the 1st and 99th fractiles; the per cent of all intervals which have an observation (“freq”); and asymptotic marginal significance levels (P-values) of the Ljung-Box test statistics for autocorrelation out to the indicated lags. The intra-day seasonality has been removed from all of the order flows; the final column shows the P-value of a test of the null hypothesis of no intra-day seasonality on the raw data.
std. fractiles L.-B. Q-test Intra-day mean dev. 1st 99th freq. 1 lag 11 lags seasonal
(#) (#) (#) (#) (%) (P – value) (P – value) (P – value) Eurodollar futures k = 3 0.029 1.521 -4.052 4.041 91.197 <0.001 <0.001 0.003 k = 6 0.028 1.990 -5.907 5.093 94.961 <0.001 <0.001 0.001 k = 9 0.029 2.257 -6.109 6.000 95.313 0.013 <0.001 0.015 k = 12 0.011 2.359 -6.915 6.085 94.031 0.164 <0.001 0.195 k = 60 -0.013 0.802 -2.024 2.020 42.797 0.131 <0.001 0.049
Exchange Traded Funds US 0.886 14.471 -41.506 40.329 99.679 <0.001 <0.001 <0.001 Germany 0.126 1.519 -3.959 4.080 56.101 <0.001 <0.001 <0.001 Japan 0.298 3.022 -7.156 9.183 88.145 <0.001 <0.001 <0.001 UK 0.067 1.103 -3.021 2.998 43.848 <0.001 <0.001 <0.001 Switzerland 0.038 0.691 -1.991 2.036 28.300 <0.001 <0.001 <0.001 Canada 0.039 0.661 -1.989 2.016 21.568 <0.001 <0.001 <0.001 France 0.049 0.884 -2.072 2.972 40.174 <0.001 <0.001 <0.001 Netherlands 0.032 0.580 -1.961 1.987 22.684 <0.001 <0.001 <0.001 Sweden 0.028 0.540 -1.030 1.990 19.818 <0.001 <0.001 <0.001 Australia 0.032 0.731 -2.025 2.020 30.916 <0.001 <0.001 <0.001 Italy 0.018 0.905 -2.042 2.968 36.404 <0.001 <0.001 <0.001
Foreign Currency Futures Euro 0.016 6.968 -18.139 18.108 98.384 <0.001 0.027 0.143 Yen -0.020 7.255 -18.938 18.569 98.442 <0.001 <0.001 0.391 UK Pound 0.119 5.615 -14.298 14.189 98.211 <0.001 <0.001 <0.001 Swiss Franc 0.094 6.881 -17.845 17.964 98.352 <0.001 <0.001 0.171 Canadian $ -0.159 4.289 -11.116 11.198 98.282 <0.001 <0.001 <0.001

Table 1c Correlation Coefficients of Foreign Exchange Traded Funds and M.S.C. I. Indexes
The tables shows correlation coefficients of the log price change in the foreign Exchange Traded Funds (ETFs) and the log change in the Morgan Stanley Capital Incorporated (MSCI) foreign stock index over the indicated holding period H. The sources of the data are given in Table 1a.
H = 1 day H = 5 days Germany 0.767 0.934 Japan 0.674 0.909 UK 0.675 0.876 Switzerland 0.674 0.883 Canada 0.655 0.902 France 0.802 0.943 Netherlands 0.761 0.932 Sweden 0.725 0.896 Australia 0.603 0.856 Italy 0.801 0.932

Table 2a Contemporaneous Correlations of Quote Revisions on Eurodollar Futures Contracts,
Exchange Traded Funds and Foreign Currency Futures Contracts
The top part of the table shows contemporaneous correlation coefficients of quote revisions on the Eurodollar futures contracts, the US Exchange Traded Fund, and the foreign currency futures contracts. The bottom part of the table shows the contemporaneous correlation coefficients of quote revisions on the US and foreign Exchange Traded Funds. The sources of the data are given in Table 1a.
Eurodollar futures US Foreign Currency Futures
k = 3 k = 6 k = 9 k = 12 k = 60 ETF Euro Yen UK Pd Sw. Fr.
Eurodollar futures k = 3 1 k = 6 0.773 1 k = 9 0.733 0.873 1 k = 12 0.696 0.835 0.901 1 k = 60 0.245 0.283 0.317 0.333 1 US ETF -0.157 -0.168 -0.157 -0.154 -0.010 1 Foreign Currency Futures Euro 0.177 0.167 0.161 0.152 0.044 -0.309 1 Yen 0.102 0.086 0.068 0.054 0.008 -0.186 0.379 1 UK Pd 0.087 0.082 0.081 0.076 0.023 -0.174 0.540 0.229 1 Sw. Fr. 0.221 0.204 0.184 0.172 0.058 -0.325 0.883 0.396 0.496 1 Cdn $ 0.022 0.017 0.025 0.026 0.033 0.100 -0.014 -0.005 -0.005 -0.024
Exchange Traded Funds
US Ger. Jap. UK Swiss Can. Fra. Neth Swe. Aus.
US 1 Germany 0.196 1 Japan 0.144 0.148 1 UK 0.176 0.209 0.110 1 Switzerland 0.168 0.173 0.082 0.195 1 Canada 0.163 0.188 0.112 0.143 0.141 1 France 0.215 0.404 0.156 0.226 0.200 0.233 1 Netherlands 0.228 0.224 0.099 0.244 0.300 0.138 0.241 1 Sweden 0.251 0.197 0.101 0.225 0.256 0.143 0.219 0.352 1 Australia 0.113 0.168 0.101 0.145 0.108 0.147 0.171 0.144 0.073 1 Italy 0.166 0.331 0.142 0.193 0.192 0.209 0.402 0.226 0.167 0.183

Table 2b Contemporaneous Correlations of Signed Order Flows of Eurodollar Futures Contracts,
Exchange Traded Funds and Foreign Currency Futures Contracts
The top part of the table shows contemporaneous correlation coefficients of signed order flows of the Eurodollar futures contracts, the US Exchange Traded Fund, and the foreign currency futures contracts. The bottom part of the table shows the contemporaneous correlation coefficients of order flows of the US and foreign Exchange Traded Funds. The sources of the data are given in Table 1b.
Eurodollar futures US Foreign Currency Futures
k = 3 k = 6 k = 9 k = 12 k = 60 ETF Euro Yen UK Pd Sw. Fr.
Eurodollar futures k = 3 1 k = 6 0.672 1 k = 9 0.647 0.814 1 k = 12 0.619 0.774 0.836 1 k = 60 0.185 0.239 0.267 0.285 1 US ETF -0.121 -0.122 -0.114 -0.113 0.006 1 Foreign Currency Futures Euro 0.056 0.060 0.067 0.055 0.001 -0.092 1 Yen 0.008 0.015 0.006 0.004 -0.016 -0.027 0.158 1 UK Pd 0.027 0.031 0.029 0.033 0.001 -0.046 0.216 0.061 1 Sw. Fr. 0.035 0.031 0.035 0.030 -0.012 -0.062 0.292 0.110 0.152 1 Cdn $ 0.014 0.008 0.007 0.010 0.020 0.024 -0.014 0.003 -0.018 -0.020
Exchange Traded Funds
US Ger. Jap. UK Swiss Can. Fra. Neth Swe. Aus.
US 1 Germany 0.058 1 Japan 0.044 0.094 1 UK 0.050 0.172 0.091 1 Switzerland 0.037 0.155 0.058 0.161 1 Canada 0.033 0.066 0.054 0.040 0.051 1 France 0.055 0.256 0.093 0.188 0.158 0.053 1 Netherlands 0.024 0.126 0.047 0.131 0.209 0.040 0.196 1 Sweden 0.010 0.098 0.043 0.085 0.125 0.042 0.135 0.148 1 Australia 0.017 0.079 0.070 0.100 0.094 0.080 0.084 0.096 0.060 1 Italy 0.040 0.155 0.053 0.106 0.141 0.034 0.213 0.172 0.097 0.086

Table 3a Granger Causality Tests of the Predictability of US and Foreign-Country ETF Variables
in the Six-Month Eurodollar Order Flow and Quote Revision Regressions The table presents asymptotic marginal significance levels (P-values) of the test statistics associated with Granger causality tests of the predictive ability of the indicated US and foreign country variables in the six-month Eurodollar futures quote revision and order flow regressions. The panel on the left shows the Granger causality tests for the Eurodollar order flow regression while the panel on the right shows the corresponding tests for the quote revision regression. The tests are for the joint significance of 12 lagged values of the indicated US or foreign country ETF variable in a regression that includes lagged Eurodollar quote revisions and order flows. The test statistics, which are robust to general forms of heteroskedasticity and autocorrelation (Newey and West (1987)), are χ2 distributed with 12 degree of freedom.
Eurodollar Order Flow Regression
Eurodollar Quote Revision Regression
lagged order flows
lagged quote
revisions
lagged order flows
lagged quote
revisions country j =
US 0.686 0.139 0.869 0.309 Germany 0.564 0.431 0.539 0.679 Japan 0.544 0.084 0.747 0.054 UK 0.787 0.771 0.703 0.726 Switzerland 0.745 0.864 0.920 0.927 Canada 0.051 0.188 0.128 0.314 France 0.817 0.418 0.474 0.277 Netherlands 0.098 0.922 0.174 0.857 Sweden 0.855 0.785 0.952 0.816 Australia 0.581 0.100 0.657 0.159 Italy 0.877 0.957 0.601 0.931

Table 3b
Granger Causality Tests of the Predictability of Eurodollar and Foreign-Country ETF Variables in the US ETF Order Flow and Quote Revision Regressions
The table presents asymptotic marginal significance levels (P-values) of the test statistics associated with Granger causality tests of the predictive ability of the indicated Eurodollar and foreign-country ETF variables in the US ETF order flow and quote revision regressions. The panel on the left shows the Granger causality tests for the US ETF order flow regression while the panel on the right shows the corresponding tests for the quote revision regression. The tests are for the joint significance of 12 lagged values of the indicated Eurodollar (with maturity of k months) or foreign-country ETF variable in a regression that includes lagged US ETF quote revisions and order flows. The test statistics, which are robust to general forms of heteroskedasticity and autocorrelation (Newey and West (1987)), are χ2 distributed with 12 degree of freedom.
US ETF Order Flow Regression
US ETF Quote Revision Regression
lagged order flows
lagged quote
revisions
lagged order flows
lagged quote
revisions Eurodollar futures k = 3 0.013 0.021 0.042 0.036 k = 6 <0.001 <0.001 <0.001 <0.001 k = 9 0.021 <0.001 0.212 0.010 k = 12 0.217 0.101 0.142 0.154 k = 60 0.117 0.207 0.425 0.856
Exchange Traded Funds
Germany 0.146 0.898 0.038 0.979 Japan 0.696 0.675 0.655 0.287 UK 0.882 0.177 0.939 0.769 Switzerland 0.007 0.567 0.681 0.509 Canada 0.269 0.092 0.101 0.219 France 0.221 0.400 0.933 0.911 Netherlands 0.672 0.010 0.862 0.023 Sweden 0.081 0.315 0.311 0.350 Australia 0.703 0.001 0.337 0.325 Italy 0.081 0.629 0.082 0.277

Table 3c Granger Causality Tests of the Predictability of the Six-Month Eurodollar and US ETF Variables
in the Foreign-Country ETF Order Flow and Quote Revision Regressions The table presents asymptotic marginal significance levels (P-values) of the test statistics associated with Granger causality tests of the predictive ability of the indicated six-month Eurodollar and US ETF variables in the foreign country ETF order flow and quote revision regressions. The panel on the left shows the Granger causality tests for the foreign-country order flow regressions while the panel on the right shows the corresponding tests for the quote revision regressions. The tests are for the joint significance of 12 lagged values of the indicated six-month Eurodollar or US ETF variable in a regression that includes lagged Eurodollar, US ETF and foreign-country ETF quote revisions and order flows. The test statistics, which are robust to general forms of heteroskedasticity and autocorrelation (Newey and West (1987)), are χ2 distributed with 12 degree of freedom.
Country-j ETF Order Flow Regressions
Country-j ETF Quote Revision Regressions
Eurodollar
US ETF
Eurodollar
US ETF
lagged order flows
lagged quote
revisions
lagged order flows
lagged quote
revisions
lagged order flows
lagged quote
revisions
lagged order flows
lagged quote
revisions country j = Germany 0.078 0.007 0.046 <0.001 <0.001 <0.001 0.263 <0.001 Japan <0.001 <0.001 0.690 <0.001 <0.001 <0.001 0.078 <0.001 UK 0.113 0.001 0.274 <0.001 <0.001 <0.001 0.954 <0.001 Switzerland 0.081 0.066 0.060 0.297 0.085 <0.001 0.041 <0.001 Canada 0.350 0.096 0.435 <0.001 <0.001 <0.001 0.542 <0.001 France 0.504 0.332 0.188 <0.001 0.291 0.158 0.826 <0.001 Netherlands 0.004 <0.001 0.011 0.070 0.105 0.544 0.629 <0.001 Sweden 0.004 <0.001 0.355 0.472 0.369 0.089 0.017 <0.001 Australia 0.023 <0.001 0.741 <0.001 0.002 0.005 0.112 <0.001 Italy 0.114 0.135 0.811 <0.001 0.157 0.156 0.372 <0.001

Table 4 Cochrane-Piazzesi (2002) Regressions using Eurodollar Futures Contracts
The table provides estimates of the Cochrane and Piazzesi (2002) regressions to model the relationship between the Eurodollar futures contract and future monetary policy changes. The dependent variable in all of the regressions is the change in the “price” of the Federal funds target (Δ PTR
τ), when a target change occurs. Note that an increase in this variable implies a decrease in the target rate. The independent variables are the lagged level of the Federal funds target rate price (PTR
τ-1) and the spread between the log target-rate shadow price and the j-month log Eurodollar futures price (SPτ-1=PTR
τ-1 – PEDτ-1). These latter two variables are recorded 30-minutes
before the target-rate change. The sample period is from April 1, 1996 to November 30, 2001. The time index is in event time: τ = 1,...19, as there were 19 target-rate changes in this period. (We exclude the target rate change following September 11, 2001). The White t statistics (in parentheses) are asymptotically robust to general forms of heteroskedasticity. The R2 statistics are adjusted for degrees of freedom.
futures contract maturity PTR
τ-1 (t-stat.)
SPτ-1 (t-stat.)
R2
k = 3
0.043 (2.918)
-0.517 (-16.894)
0.907
k = 6
0.079 (7.324)
-0.383 (-17.255)
0.918
k = 9
0.105 (8.112)
-0.347 (-14.091)
0.874
k = 12
0.137 (8.338)
-0.336 (-11.159)
0.851
k = 60
0.384 (8.568)
-0.383 (-5.503)
0.583

Table 5a Estimates of the Modified Hasbrouck (1991) Model for the
Eurodollar Futures and US Exchange Traded Fund Order Flow Regressions
The table presents the results from OLS regressions of the six-month Eurodollar futures signed order flow (7) and the US ETF signed order flow (8) on the selected public information variables. The signed order flows on the two assets are accumulated over a one-half-hour interval. They are projected on 12 lagged values each of the Eurodollar and the US ETF order flows and quote revisions. For these variables the sum of the 12 coefficients is given along with a t statistic of the significance of the sum. The regressions also include: the lagged Federal Funds target price (PTR
t-1); and the lagged difference between the Fed Funds target price and the price of the Eurodollar contract (SPt-1 = PTR
t-1 – PEDt-1). The US ETF order flow regression also includes the unanticipated net
purchases from the Eurodollar order flow regressions (ν(x)tED). The Newey-West t statistics (in parentheses) are
asymptotically robust to general forms of heteroskedasticity and autocorrelation. The R2 statistics are adjusted for degrees of freedom.
Eurodollar US ETF monetary policy lagged
order flows
lagged quote
revisions
lagged order flows
lagged quote
revisions
PTR
t-1
SPt-1
ν(x)tED
R2
(t-stat.) (t-stat.) (t-stat.) (t-stat.) (t-stat.) (t-stat.) (t-stat.) Eurodollar Order Flow Regression 0.029
(0.480) 2.148
(0.224) 0.001
(0.320) 0.134
(0.561) -0.016
(-0.640) -0.022
(-0.501) 0.006
US ETF Order Flow Regression -0.041
(-0.094) 216.576 (3.227)
0.371 (12.282)
-6.749 (-3.673)
-0.953 (-5.387)
1.080 (3.844)
-0.894 (-9.687)
0.083

Table 5b Estimates of the Modified Hasbrouck (1991) Model for the Six-Month Eurodollar Futures Contract Holding Period Returns
The table presents the results from OLS regressions of the six-month Eurodollar futures contract’s holding period return on the selected private and public information variables (9). The holding period returns are the (log) difference in price of the contract over the holding period H. The returns are projected on 12 lagged values each of the six-month Eurodollar and US ETF order flows and quote revisions. For these variables the sum of the 12 coefficients is given along with a t statistic of the significance of the sum. The regressions also include: the lagged Federal Funds target price (PTR
t-1); the lagged difference between the Fed Funds target price and the price of the Eurodollar contract (SPt-1=PTR
t-1 – PEDt-1); the unanticipated net purchases from
the Eurodollar and US ETF order flow regressions in Table 5a (ν(x)tED and ν(r)t
ED, respectively). The Newey-West t statistics (in parentheses) are asymptotically robust to general forms of heteroskedasticity and autocorrelation. The R2 statistics are adjusted for degrees of freedom.
Eurodollar US ETF monetary policy Eurodollar US ETF lagged
order flows
lagged quote
revisions
lagged order flows
lagged quote
revisions
PTR
t-1
SPt-1
ν(x)tED
ν(x)t
US
R2
(t-stat.) (t-stat.) (t-stat.) (t-stat.) (t-stat.) (t-stat.) (t-stat.) (t-stat.)
H = ½ hour -0.000
(-0.695) 0.043
(2.329) -0.000
(-0.842) 0.002
(1.091) -0.000
(-0.719) -0.000
(-2.821) 0.0006
(77.794) 0.00002 (1.886)
0.752
1 day -0.009
(-2.587) 1.595
(3.012) -0.000
(-1.241) -0.015
(-0.685) -0.001
(-0.558) -0.010
(-2.728) 0.006
(18.597) -0.00003 (-0.593)
0.038
5 days -0.024
(-2.222) 2.287
(1.400) -0.000
(-0.068) -0.020
(-0.437) -0.006
(-0.523) -0.048
(-3.136) 0.005
(6.919) 0.00003 (0.311)
0.030

Table 5c Estimates of the Modified Hasbrouck (1991) Model for the US ETF Holding Period Returns
The table presents the results from OLS regressions of the US ETF holding period return on the selected private and public information variables (10). The holding period returns are the (log) difference in price of the ETF over the holding period H. The returns are projected on 12 lagged values each of the six-month Eurodollar and US ETF order flows and quote revisions. For these variables the sum of the 12 coefficients is given along with a t statistic of the significance of the sum. The regression also includes: the lagged Federal Funds target price (PTR
t-1); the lagged difference between the Fed Funds target price and the price of the Eurodollar contract (SPt-1 = PTR
t-1 – PEDt-1); the unanticipated net purchases from the Eurodollar and US ETF order flow regressions in Table
5a (ν(x)tED and ν(x)t
US, respectively); and the unanticipated quote revision on the Eurodollar contract from the H = ½ hour regression in Table 5b (ν(r)tED) when
there was a change in the Fed Funds target rate during the half-hour period (1(ΔTR≠0)). The Newey-West t statistics (in parentheses) are asymptotically robust to general forms of heteroskedasticity and autocorrelation. The R2 statistics are adjusted for degrees of freedom.
Eurodollar US ETF monetary policy Eurodollar US ETF lagged
order flows
lagged quote
revisions
lagged order flows
lagged quote
revisions
PTR
t-1
SPt-1
ν(x)tED
ν(r)t
ED• 1(ΔTR≠0)
ν(x)t
US
R2
(t-stat.) (t-stat.) (t-stat.) (t-stat.) (t-stat.) (t-stat.) (t-stat.) (t-stat.) (t-stat.)
H = ½ hour 0.006
(1.022) 0.574
(0.782) 0.001
(1.552) -0.019
(-0.528) 0.002
(0.623) 0.004
(0.863) -0.027
(-9.275) 16.858 (4.950)
0.008 (33.275)
0.203
1 day 0.047
(0.675) -1.852
(-0.214) -0.005
(-0.890) 0.767
(1.861) 0.010
(0.260) 0.035
(0.482) -0.025
(-3.750) 18.423 (3.432)
0.010 (10.365)
0.015
5 days 0.070
(0.268) -19.035 (-0.470)
-0.036 (-2.320)
-0.494 (-0.515)
0.037 (0.227)
0.170 (0.553)
-0.027 (-2.123)
17.203 (1.538)
0.005 (3.171)
0.007

Table 6 Summary Statistics from and Tests of the Latent Factor Model
of International Stock Returns
The top part of the table presents the value of the J-statistics associated with the Wald tests of the over-identifying restrictions of the latent factor model of international stock returns. The statistics are distributed as χ2(63) and are presented along with their asymptotic marginal significance levels (P-value). The model is estimated separately for each holding period H by Generalized Method of Moments. The bottom part of the table presents variance ratio measures of the statistical fit of the model. The ratio shows how the latent factor model captures the expected return variation in the data. The numerator is the variance of the expected return on the foreign ETF from the latent factor model while the denominator is the variance of the expected return from an OLS regression of the foreign ETF return on the global instruments.
H = ½ hour H = 1 day H = 5 days J-statistic model test χ2 (63) statistic 129.52 73.07 73.74 P-value <0.001 0.181 0.167 Variance ratios Germany 0.256 0.917 1.189 Japan 0.546 0.857 1.032 UK 0.503 0.927 1.575 Switzerland 0.690 0.928 1.388 Canada 0.375 0.883 0.572 France 0.291 0.927 1.386 Netherlands 0.440 0.925 1.329 Sweden 0.879 0.814 0.237 Australia 0.023 0.742 0.417 Italy 0.150 0.810 1.450
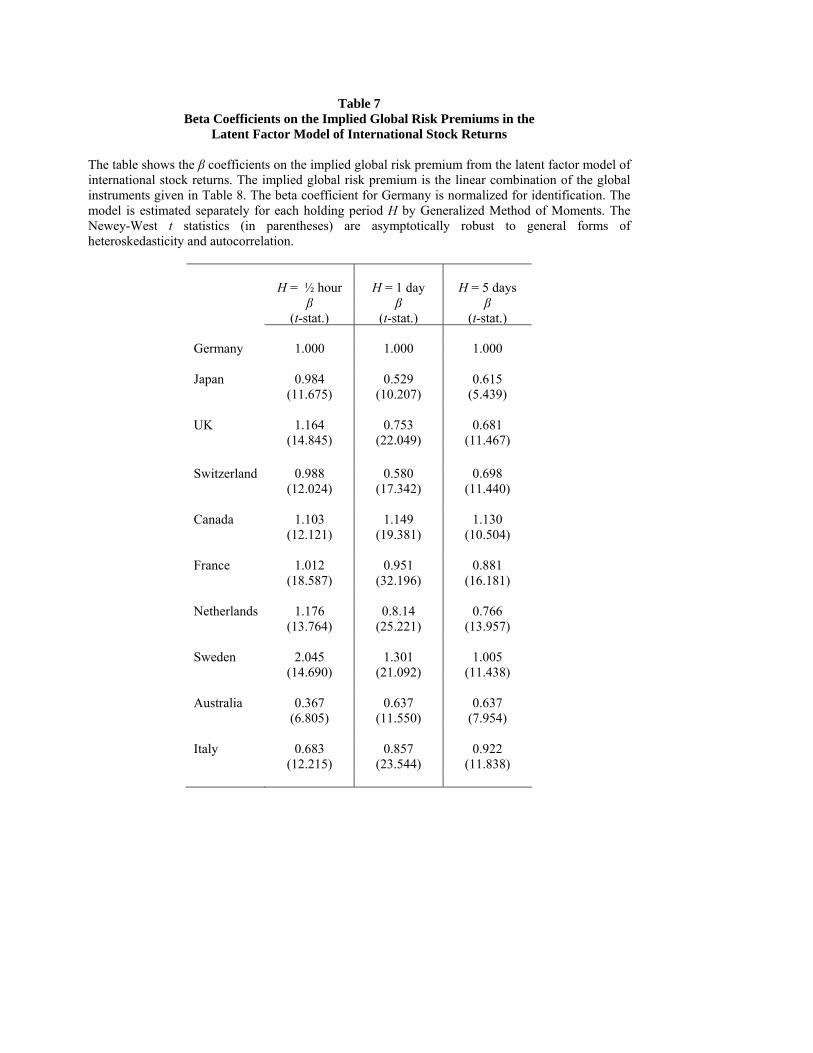
Table 7 Beta Coefficients on the Implied Global Risk Premiums in the
Latent Factor Model of International Stock Returns
The table shows the β coefficients on the implied global risk premium from the latent factor model of international stock returns. The implied global risk premium is the linear combination of the global instruments given in Table 8. The beta coefficient for Germany is normalized for identification. The model is estimated separately for each holding period H by Generalized Method of Moments. The Newey-West t statistics (in parentheses) are asymptotically robust to general forms of heteroskedasticity and autocorrelation.
H = ½ hour H = 1 day H = 5 days β β β (t-stat.) (t-stat.) (t-stat.) Germany 1.000 1.000 1.000 Japan 0.984
(11.675) 0.529
(10.207) 0.615
(5.439) UK 1.164
(14.845) 0.753
(22.049) 0.681
(11.467) Switzerland 0.988
(12.024) 0.580
(17.342) 0.698
(11.440) Canada 1.103
(12.121) 1.149
(19.381) 1.130
(10.504) France 1.012
(18.587) 0.951
(32.196) 0.881
(16.181) Netherlands 1.176
(13.764) 0.8.14
(25.221) 0.766
(13.957) Sweden 2.045
(14.690) 1.301
(21.092) 1.005
(11.438) Australia 0.367
(6.805) 0.637
(11.550) 0.637
(7.954) Italy 0.683
(12.215) 0.857
(23.544) 0.922
(11.838)

Table 8 Coefficients on the Global Instruments in the Latent Factor Model of International Stock
Returns
The table shows the αH coefficients on the global instruments in the latent factor model of international stock returns. The global instruments are: a constant; the lagged Federal funds target price (PTR
t-1); the lagged difference between the Fed Funds target price and the price of the Eurodollar contract (SPt-1=PTR
t-1 – PED
t-1); the unanticipated net purchases on the six-month Eurodollar contract from Table 5a (ν(x)tED); the
unanticipated quote revision on the Eurodollar contract from the H = ½ hour regression in Table 5b (ν(r)t
ED), which are separated into whether there was a change in the Fed Funds target rate during the half-hour period (1(ΔTR≠0)) or not; and the unanticipated net purchases and quote revisions on the US ETF from Tables 5a and 5c (ν(x)t
US and ν(r)tUS ). The model is estimated separately by Generalized Method of
Moments for each holding period H. The Newey-West t statistics (in parentheses) are asymptotically robust to general forms of heteroskedasticity and autocorrelation. The σ-shocks [in brackets] represent the effect of a one standard deviation shock to the indicated variable, normalized by the standard deviation of the latent factor.
monetary policy Eurodollar US ETF
constant PTRt-1 SPt-1 ν(x)t
ED ν(r)tED•
1(ΔTR=0) ν(r)t
ED• 1(ΔTR≠0)
ν(x)tUS ν(r)t
US
(t-stat.) (t-stat.) (t-stat.) (t-stat.) (t-stat.) (t-stat.) (t-stat.) (t-stat.) [σ-shock] [σ-shock] [σ-shock] [σ-shock] [σ-shock] [σ-shock] [σ-shock]
H = ½ hour
-0.641
(-1.246) 0.001
(1.245) [0.036]
0.0003 (0.169) [0.005]
-0.005 (-8.327) [0.311]
-0.797 (-6.462) [0.143]
3.001 (13.383) [0.192]
0.001 (10.664) [0.385]
0.112 (14.427) [0.827]
H = 1 day
2.204 (0.148)
-0.005 (-0.146) [0.019]
0.029 (0.507) [0.067]
-0.027 (-5.096) [0.242]
-2.330 (-2.797) [0.064]
20.096 (13.353) [0.196]
0.008 (8.971) [0.482]
0.722 (13.089) [0.811]
H = 5 days
118.18 (2.201)
-0.259 (-2.199) [0.730]
-0.123 (-0.579) [0.212]
-0.031 (-2.981) [0.208]
-7.940 (-4.984) [0.159]
1.442 (0.770) [0.010]
0.002 (1.377) [0.093]
0.745 (7.737) [0.614]

Table 9 OLS Regressions of Home-Currency Returns on Foreign Exchange Traded Funds on the
Latent Factor
The table shows the OLS regression coefficients (ϕ̂ ) of the (log) change in the home-currency price of the foreign-country ETF over holding period H on the latent factor from the international equity pricing model. The home currency price of the ETF is calculated using the foreign currency futures prices. The latent factor is the linear combinations of the global instruments given in Table 8. The Newey-West t statistics (in parentheses) are asymptotically robust to general forms of heteroskedasticity and autocorrelation. The R2 statistics are adjusted for degrees of freedom. The table also shows the values of the asymptotic marginal significance levels (P-values) associated with the χ2 statistics which test whether the indicated coefficient is equal to the value of the beta coefficient from the cross-sectional model that is shown in Table 7.
H = 1/2 hour H = 1 day H = 5 days ϕ̂ R2 ϕ̂ R2 ϕ̂ R2 (t-stat.) P-value
(φ=β) (t-stat.) P-value
(φ=β) (t-stat.) P-value
(φ=β) Germany 2.803
(5.761) 0.111
<0.001 1.177
(13.676) 0.024 0.040
0.290 (0.607)
-0.001 0.137
Japan 2.001
(6.835) 0.049 0.001
0.602 (7.977)
0.007 0.331
-0.229 (-0.648)
-0.002 0.017
UK 1.923
(6.831) 0.059 0.007
0.847 (12.821)
0.019 0.156
0.378 (1.262)
0.001 0.312
Switzerland 2.604
(7.725) 0.107
<0.001 0.801
(10.248) 0.016 0.005
0.513 (1.401)
0.001 0.614
Canada 1.310
(4.353) 0.025 0.491
1.061 (13.507)
0.022 0.265
-0.059 (-0.115)
-0.000 0.020