the modern forel-ule scale: a ‘do-it-yourself’ colour
TRANSCRIPT
J. Europ. Opt. Soc. Rap. Public. 9, 14025 (2014) www.jeos.org
The modern Forel-Ule scale: a ‘do-it-yourself’ colourcomparator for water monitoring
NIOZ Royal Netherlands Institute for Sea Research, NL-1790 AB Den Burg, the Netherlands
M. R. Wernand NIOZ Royal Netherlands Institute for Sea Research, NL-1790 AB Den Burg, the Netherlands
H. J. van der Woerd Institute for Environmental Studies (IVM), VU University Amsterdam, De Boelelaan 1087, 1081 HVAmsterdam, the Netherlands
The colour comparator Forel-Ule scale has been used to estimate the colour of natural waters since the 19th century, resulting in one of thelongest oceanographic data series. This colour index has been proven by previous research to be related to water quality indicators suchas chlorophyll and coloured dissolved organic material. The aim of this study was to develop an affordable, ‘Do-it-Yourself’ colour scalethat matched the colours of the original Forel-Ule scale, to be used in water quality monitoring programs by citizens. This scale can bemanufactured with high-quality lighting filters and a white frame, an improvement with respect to the materials employed to manufacturethe original scale from the 19th century, which required the mixing of noxious chemicals. The colours of the new scale were matched tothe original colours using instrumental and visual measurements carried out under controlled lighting conditions, following the standardmeasurement protocols for colour. Moreover, the colours of the scale are expressed in Munsell notations, a standard colour system alreadysuccessfully used in water quality monitoring. With the creation of this Modern Forel-Ule scale, as a ‘Do-it-yourself’ kit, the authors foreseea possible use of the Forel-Ule number as a water quality index that could be estimated by means of participatory science and used byenvironmental agencies in monitoring programs.[DOI: http://dx.doi.org/10.2971/jeos.2014.14025]
Keywords: Forel-Ule scale, water quality, participatory science, ocean colour, colourimetry, citizen science, water monitoring
1 INTRODUCTION AND PROBLEMSTATEMENT
The colour of natural waters has been measured globally andintensively by oceanographers and limnologists since the 19th
century by means of the Forel-Ule (FU) colour comparatorscale [1]–[3], resulting in one of the longest oceanographicdata series after the Secchi disk depth. Wernand et al. (2013)[4] used these data sets to estimate global changes occurringin the ocean in relation to the chlorophyll-a concentration, akey index of phytoplankton biomass and primary productiv-ity studies [5]. It was also shown that the FU scale is related tocoloured dissolved organic matter (CDOM) absorbance, con-sidered as well to be one of the water quality indicators [6].
The colour of natural waters is mainly affected by three typesof elements: 1) The pigments in organic material, normallyexpressed as chlorophyll-a concentration (mainly of greenishcolour unless it is a specific type of algal bloom), 2) CDOM, anindicator of freshwater content and plant degradation (alsoknown as yellow substance), and 3) Total Suspended Mate-rial concentration (TSM), an indicator of turbidity that is influ-enced by coastal erosion, riverine flux, and wind- or current-generated re-suspension (usually of brownish or grey colourdepending on location). Therefore, the colour of water is anapparent optical property that provides information on itscomposition, and for that reason, the concept of ‘optical waterquality’ was introduced by Kirk (1988) [7], who highlighted
the importance of measuring these optical properties for wa-ter quality monitoring.
Colour, together with clarity (or transparency), is one of thefirst apparent features to the human eye when observing natu-ral waters. Humans associate pristine water bodies with deepblues or turquoise colours and a certain depth visibility is nec-essary to safely enjoy water activities (Bathing water directive76/160/EEC Report). Hence, colour strongly affects the visualand aesthetic perception of the public and their recreationaluse [8, 9]. Moreover, the colour of water has a strong effect onaquatic ecosystems, as it has been shown to affect photosyn-thesis and primary productivity [10, 11] , predation regimesof herbivores [12], invertebrate behavior [13, 14] and alter theavailability and toxicity of heavy metals to fish [15, 16].
Changes in colour and clarity in aquatic systems can becaused by natural causes, such as heavy rains that trans-port organic material, nutrients and mineral. However, thesechanges can also be due to anthropogenic activities such asthe introduction of an excess of nutrients, originating fromfertilisers used in agriculture. These inputs can then cause al-gal blooms that change the colour and clarity of the water, aphenomenon known as eutrophication, which is a major en-vironmental issue across Europe [17]. In order to determine
Received April 11, 2014; revised ms. received May 15, 2014; published July 21, 2014 ISSN 1990-2573
J. Europ. Opt. Soc. Rap. Public. 9, 14025 (2014) S. Novoa, et al.
if a change in colour is due to a particular anthropogenic ac-tivity, it is important to collect long-term data on the colourand clarity of water bodies (British Columbia Ministry of En-vironment) [18], making it necessary to have easy-to-use andaffordable tools to cover large areas, as well as a high samplingfrequency.
Clarity of natural bodies can be easily and affordably esti-mated by means of a Secchi disk [19, 20]. However, colouris a more difficult feature to measure as it requires the anal-ysis of the wavelength distribution of light. This analysis canbe achieved using a spectroradiometer [21], but this type ofinstrument is expensive and not suitable for citizen moni-toring surveys and fast interpretation. Davies-Colley [22, 23]showed that a colour-matching method using the Munsellsystem [24, 25], one of the most widely known colour sys-tems, is suitable for routine water resources surveys and mon-itoring, since humans can easily match colours observed si-multaneously. This method was implemented by the NationalInstitute of Water and Atmospheric Research (NIWA) as partof the water quality monitoring programs [26]. However, thematching of natural colours to the Munsell scale is a relativelynew technique and it seems to be employed only in some wa-ter quality monitoring programs [8, 27] (New Zealand, BritishColumbia), providing a limited amount of data for globallong-term studies.
The original FU colour comparator scale consists of 21coloured solutions, between indigo blue and cola brown,going through green. These solutions, made with distilledwater, ammonia, copper sulfate, potassium-chromate andcobalt-sulfate, are placed in vials. The colour is determinedby comparison of the colour of the water observed abovea Secchi disk to the coloured vials. Although easy to use,this scale is not simply reproduced [28], and furthermorethe chemicals used to prepare the solutions can be toxic tohumans [29].
The colour of natural waters and other materials depends onthree main features: hue, saturation and brightness. Hue refersto how the colour is described (e.g. ’blue’ or ’green’), and it isdetermined by the dominant wavelength in the visible spec-trum. Saturation or colour purity (less saturated is more grey-ish than saturated, which has a more intense colour) dependson the spread of energy around the dominant wavelength[30, 31]. Brightness refers to the amount of energy detectedby the human eye, which is most sensitive around the greenwavelength (555 nm). The FU scale involves the matching ofonly the hue, while the Munsell system considers purity andbrightness as well.
Framed within the European Project CITCLOPS (Citizens’ Ob-servatory for Coast and Ocean Optical Monitoring), the aimof this manuscript is to present a tool that can be employedby citizens to determine the colour of the water based on theFU colour comparator scale. A scale that accurately matchesthe original FU colours was developed using accessible andaffordable materials. Hence, this ’Do-It-Yourself’ kit can beprepared using high-quality illumination filters and a framemade of a white Plexiglas (or other white material). The inten-tion was to create a colour comparison tool that could be used
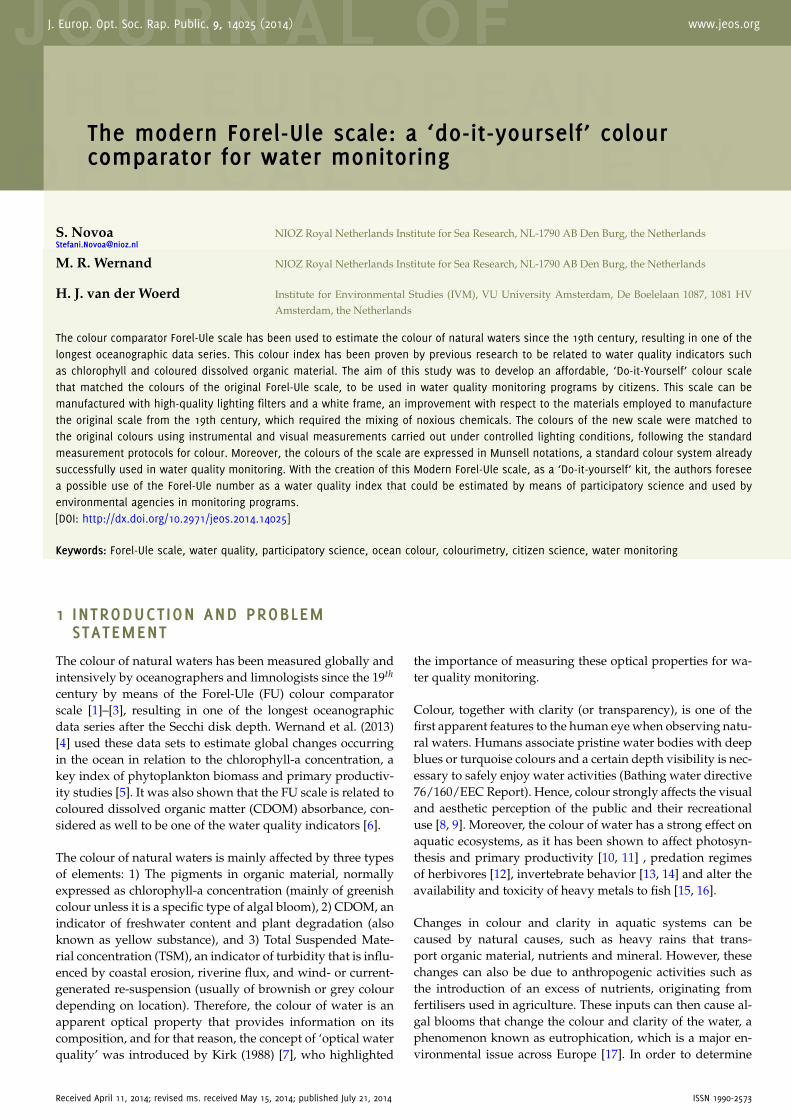
FIG. 1 Light cabinet set-up for the colour-matching procedure. The coloured vials and
filters (combinations) were placed flat, at the bottom of the cabinet, on top of a white
plate side by side, 4.0 cm apart. Comparisons were carried out under a 45° /normal
geometry, and the lamps (D65, D75) were placed above the objects at a distance of 50
cm.
by anyone willing to participate in environmental monitor-ing, providing an easy method to record not only the colour,but also the clarity of natural waters, since this scale needs tobe used together with a Secchi disk. In addition, the coloursof the scale were matched to the colours of the Munsell sys-tem, providing a connection with additional work conductedon monitoring of natural waters using colour-matching tech-niques [22], and combining the advantages of both scales towork towards an improved colour estimation technique forwater quality monitoring.
2 MATERIALS AND METHODS
2.1 Visual and instrumental colourimetricmeasurements
In this study we compared the colour of two objects by meansof visual inspection and using a spectrometer in a dedicatedlaboratory environment. The visual assessment of a colour byan observer is as important as the colour measured by the in-strument, especially in our case where the colour-matchingof the water is going to be assessed visually. The colour ap-pearance of an object is affected by many factors, includingthe spectral properties of the light source, the level of illu-mination, background reflectance and the object composition.Hence, to correlate the instrumental measurements with ourvisual measurements, the conditions under which the eval-uation is conducted need to be very restricted [32]. For thatreason, controlled lighting conditions were prepared in a lightcabinet placed in a dark room (Figure 1). To ensure the cor-rectness of the visual assessments, the authors of this doc-ument successfully passed the Farnsworth-Munsell 100 HueColour Vision Test [33] (www.colour-blindness.com, searchfor: farnsworth munsell 100-hue colour vision test), a test com-monly used to determine any colour vision deficiencies.
2.2 Colour-matching procedure
The liquid colours of the FU scale were replaced byplastic colour-effect lighting filters of the brands LEE
14025- 2
J. Europ. Opt. Soc. Rap. Public. 9, 14025 (2014) S. Novoa, et al.
(www.leefilters.com) and Roscolux (www.rosco.com). Visualand instrumental (spectral measurements) matches of thefilters against the coloured liquids in vials were conductedunder diffused artificial daylight simulators D65 (VeriVide,width: 600 mm, 18W) and D75 (VeriVide, width: 600 mm,20W), on top of a diffuser, in a colour assessment cabinet(VeriVide) with a grey coating inside (Munsell num. 5).The term illuminant refers to a spectral power distributionrealizable by a light source, while the term source refers toany light emitting object (relative energy distribution in thevisible spectrum, 380 - 750 nm), such as the sun or a lightbulb.
The D65 light source has a correlated colour temperature of6500 K and was selected because it represents the average day-light, at various times throughout the day and throughout theyear. According to the International Commission on Illumina-tion (CIE, www.cie.co.at), the D65 illuminant should be usedin all colorimetric calculations requiring representative day-light, unless there are particular reasons to use a different il-luminant. The D75 light source was chosen as well becauseit represents the North Sky daylight with a correlated colourtemperature of 7500 K (slightly bluer than D65) and has beenrelated to overcast sky conditions [34]. The D65 and D75 CIEStandard Illuminant defined by the CIE are part of the D se-ries of illuminants that try to describe standard illuminationconditions at open-air in different parts of the world. Hence,these two illuminants were selected to obtain a matching filterscale under different open-air lighting conditions.
The colour-matching procedure was conducted following therecommendations of the American Society for Testing andMaterials Standard International publications (ASTM E1164 -12, ASTM E179-12; ASTM E308) [35]–[37], commonly used inthe industry to assess the colour differences between batchesof manufactured objects. The liquid vial and the correspond-ing combination of colour effect filters were placed at thebottom part of the lighting cabinet, lying flat over a whiteplate. Both the visual and instrumental comparisons were car-ried out at a 45° degree angle, labeled as 45° /normal ge-ometry by the CIE [36] (International Commission on Illu-mination, ASTM E179-12) and the lamps (D65, D75) wereplaced above the objects at a distance of 50 cm. The vi-sual comparison was conducted by observing simultaneouslyboth the vials and the filters, placed side by side, 4.0 cmapart. The instrumental measurement was conducted usinga PHOTORESEARCH PR-655 SpectraScan spectroradiometer(www.photoresearch.com). The device was placed in front ofthe cabinet, with the samples centered at the bottom and atan angle of 45° with respect to the samples, at the same po-sition as the one used for the visual comparison (see Fig-ure 1). The measurements were carried out always with thesamples placed at the same location inside the cabinet, sinceslight differences in the chromaticity values calculated for thelight source were observed in different parts of the cabinet.Also, the light source irradiance was measured every singletime the matching procedure was conducted, as minor dif-ferences in the intensity were observed as well. The lamp ir-radiance was measured at the beginning and the end of ev-ery measurement session, using a PHOTORESEARCH PR-640spectrometer with a cosine collector. The matching procedure
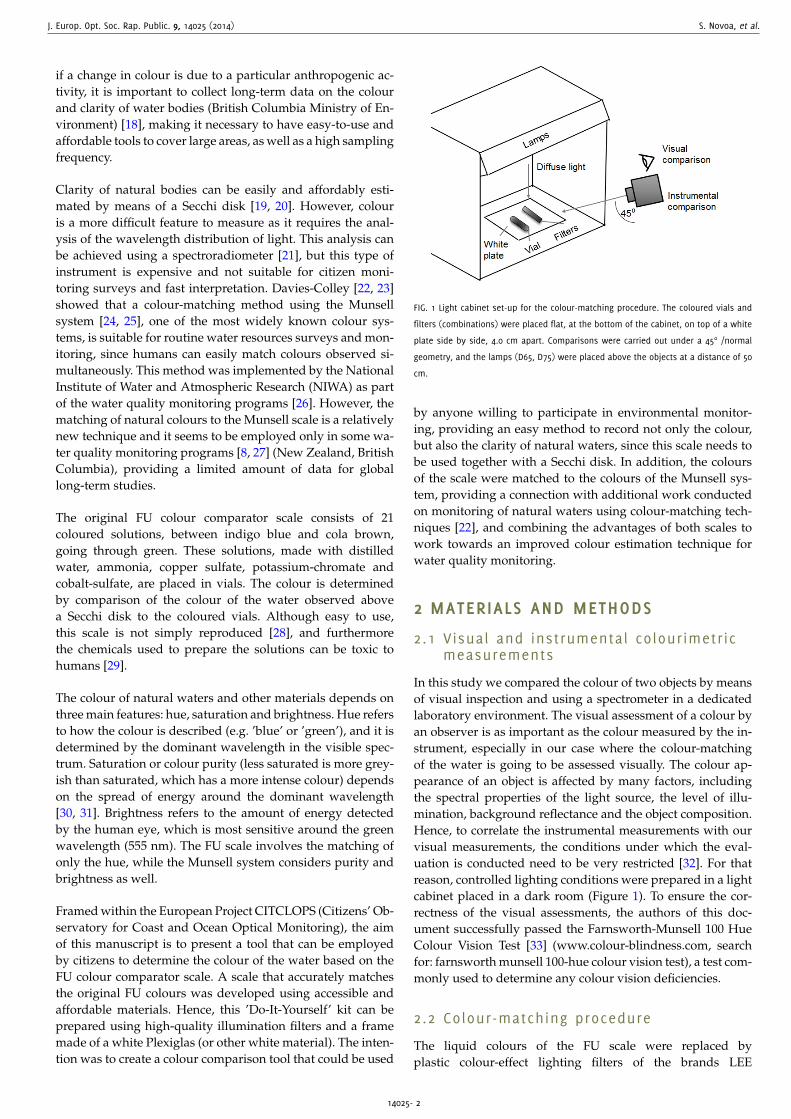
FIG. 2 Munsell color system diagram showing the Hue, the Value and the Chroma.
started with a visual selection of the filters from the samplesaccording to the transmission curves provided by the manu-facturer, and the observed colours of the filters, followed bythe spectral match using reflectance measurements of boththe vials and filter combinations. The ‘SpectraWin2’ softwarefrom PHOTORESEARCH was used to visualise and calculatereflectance spectra, chromaticity coordinates, saturation andthe dominant wavelength of the measured samples.
The association with the Munsell system (Figure 2) was con-ducted visually under the D65 light source using the glossyversion of ‘Munsell book of colors’ [25] (www.munsell.com).The samples from the book (commonly referred as ‘chips’)were matched visually to the FU coloured vials, one by one.The Munsell colour system notation consists of three indepen-dent dimensions hue (H), value or lightness (V) and chroma(C). The system is divided into five principal hues: Red, Yel-low, Green, Blue, and Purple, along with 5 intermediate hues(e.g. BG, as Blue-Green). The value or lightness changes ver-tically along the hue, from black (value 0) at the bottom, towhite (value 10) at the top. Chroma represents the “purity”of a colour (related to saturation), with higher chroma beingmore pure and lower chroma being paler colours.
2.3 Calculat ions
The SpectraWin2 program calculated the reflectance, definedas the ratio of the measured radiance of the object and theirradiance of the lamp source. Dominant Wavelength (DW)is defined as the wavelength on the CIE diagram boundary(or colour locus) that, when mixed in appropriate proportionswith the white reference, yields the chromaticity coordinateof the measured sample (Figure 3). Mathematically, a line isdrawn from the standard illuminant, through the measuredpoint to the monochromatic locus (boundary) of the CIE di-agram and the dominant wavelength is where the line inter-cepts the locus (Figure 3). Saturation (or Purity) is the measureof how pure, or monochromatic, the colour is. The distance ofthe measured sample to the boundary at the dominant wave-length location is divided by the distance of the standard il-luminant (achromatic point) to the same point. This measureis expressed in a percentage, 100 % saturation is a perfectlysaturated colour (lies on the monochromatic locus), and it is
14025- 3

J. Europ. Opt. Soc. Rap. Public. 9, 14025 (2014) S. Novoa, et al.
FIG. 3 The CIE1931 x, y chromaticity diagram for monochromatic colours. The outer
curved boundary is the spectral or monochromatic locus, with wavelengths in nanome-
ters. Each measured sample is defined by its (x, y) chromaticity coordinate set and
colour ’purity’ or ’saturation’
calculated using the following formula:
Saturation % =TSd ∗ 100
RId(1)
Where:TSd = Distance from sample to monochromatic locus.RId = Distance from standard illuminant to monochromaticlocus.The tristimulus values XYZ were calculated by the Spec-traWin2 software, using the reflectance spectra and accordingto:
X = 683830∫
360
S (λ) x (λ)∆ (λ)
Y = 683830∫
360
S (λ) y (λ)∆ (λ)
Z = 683830∫
360
S (λ) z (λ)∆ (λ) (2)
Where S(λ) is the spectral data that depends on the wave-length (λ), XYZ are the tristimulus values and x, y, z are thecolour-matching functions (CMFs). Lumens are converted towatts using the 683 constant.
The CIE 1931 chromaticity coordinates were calculated ac-cording to:
x =X
X + Y + Zand y =
YX + Y + Z
(3)
More information on the calculation of tristimulus values andchromaticity coordinates can be found in Wyszecki and Stiles(1982) [38].
The differences between the colours of the vials and the filtercombinations were estimated using the dominant wavelength
and the saturation. From the visual inspection, we concludedthat it was important to minimise the deviation in both the hueand saturation. The deviations between vials and filters hadto be considerably smaller than the difference in dominantwavelength between adjacent filters. Thus, there was enoughcolour spacing between the filters to be able to discriminateamong them, but also provide a range of error to account forthe difference in colour appearance of the two types of mate-rials compared, liquid in vials versus plastics. The deviationin saturation between vials and filters was also kept as lowas possible. The relative dominant wavelength difference per-cent (DWD %) and saturation difference (SD %) percent of thefilters ( f ) with respect to the vials (v) were calculated as fol-lows:
DWD % =DWvi − DW f i
DWvi − DWvj(4)
Where DWvi and DW f i are the dominant wavelengths mea-sured for vial vi and the filter combination f i in nanometers(nm), normalised to the difference in dominant wavelengthbetween two adjacent FU vials (DWvi − DWvj), with respect tothe previous and the posterior adjacent FU vial (vj), providingtwo values, the ‘DWD +’ % and ‘DWD –’ %, respectively.
The difference in saturation percentage (SD %) was calculatedin the same manner, but normalised to the saturation of thevial (Svi).
SD % =Svi − S f i
Svi× 100 (5)
Where Svi and S f i are the saturation values measured for thevial i (vi) and the corresponding filter combination ( f i).
The exact Munsell notations were calculated using the pro-gram ‘colour2drop’ (developed by Zsolt Kovacs and availableat www.ing.unibs.it/), based on the information on the Mun-sell calculations found in the American Society for Testing andMaterials publication [39] (ASTM D 1535).
3 RESULTS
A total of 30 colour effect filters (27 LEE and 3 Roscolux) werenecessary to match the colours of all 21 vials (vial numbersshown in Table 1). The colours measured (dominant Wave-length, DW, and saturation, S) of the filters deviated a maxi-mum of 20.83 % and 12.18 %, respectively, from the colours ofthe vials.
Figure 4 shows the comparison of the DW estimated for theFU vials and filters. There is a strong match in DW, betweenthe vials and the filters, so the selected filters were consideredto be appropriate for the scale. It can be noticed that the DWgradually increases up to FU7, after which there is a sharpupward slope until FU11. Then, the slope between FU11-FU21becomes more moderate again. There is also a higher angledifference between adjacent FU colours in the ‘bluer’ part ofthe scale (FU1-11), with an average of 9 nm, compared to the‘browner’ part of the scale (FU12-21), with an average 3.8 nm.The highest dominant wavelength difference (DWD) betweenthe filters and the vial was obtained for FU6, with a 20.83 %difference with respect to the previous adjacent colour FU5.
14025- 4

J. Europ. Opt. Soc. Rap. Public. 9, 14025 (2014) S. Novoa, et al.
FU Number Filter combinations1 L2002 L501+L0633 L504+ L2014 L241+ L0615 L504+L2416 L503+ L730+ L2427 L2428 L278+R3316+L2429 L733+L HT007+L73010 L245+L HT007+L73111 L731+R4515+R456012 L244+L22313 L206+L24414 L244+L443+L76315 L244+L009+L29816 L244+L223+L285+L29817 L65018 L223+L650+L20619 L230+L763+L24920 L230+L223+L50621 L207+L506+L298
TABLE 1 Filter combinations to obtain each FU colour. Abbreviations: L = Lee filters;
L HT = High temperature Lee filters; R = Roscolux filters. The order of the filters is
important, the first filter has to be placed at the top and the last at the bottom.
The next highest difference was obtained for FU13 (DWD+ =
16.83 %).
FIG. 4 Dominant Wavelength of the instrumentally measured vials and filter combina-
tions.
Figure 5 shows the saturation percentage for both the vialsand the filters. It can be noticed that FU1 has the highest satu-ration of all the FU colours, after which it decreases until FU8,where it increases again until FU11, and stays stable for therest of the FU numbers. The highest difference in saturation(SD %) was obtained for FU8, which showed a 12.18 % lesssaturation of the filters’ colours with respect to the vials. Therest of the FU colours showed a difference in saturation below10 %, except for FU6 and FU12 (10.62 % and 10.92 %, respec-
FU Number FU vials FU Filters % Difference
x yDW S
x yDW S DWD + DWD - SD
(nm) (%) (nm) (%) (%) (% ) (%)AP D65 0.31 0.33
1 0.16 0.10 470.30 81.86 0.16 0.10 469.70 82.90 10.71 0.00 1.272 0.16 0.15 475.90 74.37 0.16 0.15 475.10 72.28 15.38 14.29 2.813 0.16 0.20 481.10 66.15 0.17 0.20 481.20 62.66 1.89 1.92 5.284 0.17 0.26 486.40 56.92 0.18 0.25 485.80 55.38 12.77 11.32 2.715 0.18 0.31 491.10 47.93 0.19 0.32 491.30 45.86 4.17 4.26 4.326 0.20 0.36 495.90 39.51 0.21 0.36 496.90 35.31 14.71 20.83 10.627 0.22 0.41 502.70 30.85 0.22 0.40 503.50 28.49 6.50 11.76 7.648 0.25 0.45 515.00 25.05 0.26 0.43 517.00 22.00 9.95 16.26 12.189 0.27 0.48 535.10 33.74 0.27 0.48 535.30 35.20 1.23 1.00 4.3210 0.31 0.50 551.40 49.06 0.31 0.50 551.30 49.99 1.25 0.61 1.9011 0.35 0.52 559.40 62.16 0.35 0.51 559.40 62.61 0.00 0.00 0.7312 0.36 0.51 561.80 62.76 0.36 0.49 561.50 58.44 10.71 12.50 6.8913 0.37 0.49 564.60 61.67 0.37 0.49 564.00 62.02 16.67 13.89 0.5714 0.39 0.48 568.20 62.03 0.39 0.48 568.20 62.24 0.00 0.00 0.3315 0.40 0.46 571.10 61.01 0.40 0.46 571.10 63.84 0.00 0.00 4.6316 0.41 0.44 575.20 60.83 0.42 0.44 575.50 62.54 9.68 7.32 2.8117 0.43 0.43 578.30 60.88 0.43 0.43 578.10 63.52 4.65 6.45 4.3418 0.44 0.41 582.60 60.49 0.43 0.40 582.20 56.07 11.76 9.30 7.3119 0.45 0.40 586.00 60.18 0.46 0.40 586.20 61.29 6.25 5.88 1.8420 0.46 0.39 589.20 58.87 0.48 0.39 589.70 65.30 15.63 15.62 10.9221 0.47 0.37 592.40 57.90 0.46 0.37 592.80 56.15 0.00 12.50 3.03
TABLE 2 Chromaticity values (x, y), Dominant Wavelength (DW) in nanometers (nm) and Saturation percentage (S %) for the measured FU vials and filter combinations. The
percent difference in dominant wavelength (DWD ± %) and in saturation (SD %). The chromaticity values of the achromatic point (AP) for the D65 illuminant are also presented.
14025- 5

J. Europ. Opt. Soc. Rap. Public. 9, 14025 (2014) S. Novoa, et al.
FIG. 5 Saturation percentage of the instrumentally measured vials and filter combina-
tions.
tively). The specific DW and S values for each FU number aresummarised in Table 2.
During the spectral measurements, it was noticed that the or-der of the filters affected the dominant wavelength, hence it isimportant to place the filters in the same order as in Table 1,the first filter specified on top, and the last at the bottom.
A total of 5 measurements were conducted for each vial andfilter combination shown in Figure 3. From these, the standarddeviation between measurements of each sample was estab-lished to be ±0.1 nm for the dominant wavelength and ±0.45% for the saturation measurements. The standard deviationfor chromaticity coordinates (x, y) measurements was ±0.003.Similar results were obtained when identical tests were con-ducted using the D75 light source. Just as in the case of D65conditions, higher DW deviations were obtained for FU6-8and FU12-13 colours under the D75 illuminant, but always be-low 20.83 %. Then, the visual colour match between vials andfilters was satisfactory, since the colours of the filters appearedvisually identical to the vials when placed side by side insidethe cabinet and observed under the D75 lamp.
The Munsell specifications corresponding to the FU vials arepresented in Table 3. Both the values estimated visually underthe D65 illuminant and the calculated values are provided.
4 PROTOCOL FOR THE ASSEMBLAGE OFTHE SCALE AND ITS USE
The filters should be cut with a rectangular shape of dimen-sions 85 x 10 mm. The white frame, with a white backgroundfor the filters, could be of Perspex (Acrylox), PVC materialor white painted wood; it should be as white as possibleand not too glossy. The frame should have an A4 format(297 x 210 mm) and the 21 FU colours should be displayedin two rows, unlike the original scale that was divided in twoparts (Figure 6). There should be a spacing in between the fil-ters and the white background of 0.4 mm. In this case, whitepins were used to hold the filters to the frame, but any other
FU Number Munsell H V/CVisual Measurement Calculated
D65 illuminant1 6.25 PB 3/12 6.55 PB 3.38/17.82 5 PB 3/10 4.66 PB 2.92/10.83 10 B 3/8 9.14 B 2.55/7.04 2.5 B 3/8 1.67 B 3.96/6.75 7.5 BG 3/8 5.24 BG 2.20/ 6.26 2.5 BG 3/8 1.4 BG 2.21/6.57 10 G 3/8 6.89 G 2.27/6.68 5G 4/8 4.24 G 2.35/6.89 2.5 G 4/8 1.08 G 2.92/6.9
10 10 GY 5/8 8.92 GY 3.47/6.911 7.5 GY 6/10 6.82 GY 4.16/ 7.512 6.25 GY 6/10 6.11 GY 3.96/6.813 5 GY 5/8 5.12 GY 3.78/6.114 2.5 GY 5/8 2.95 GY 3.65/5.315 10Y 5/8 0.88 GY 3.43/4.716 7.5Y 4/6 7.31 Y 3.26/4.317 2.5Y 4/6 4.35 Y 3.21/4.218 10 YR 4/4 0.76 Y 2.88/4.219 7.5 YR 3/6 8.34 YR 2.74/4.320 5 YR 3/6 6.25 YR 2.47/4.221 2.5 YR 3/4 4.59 YR 2.25/4.2
TABLE 3 Munsell notations corresponding to FU numbers, estimated visually and calcu-
lated from the FU tristimulus values, through the ’colour2drop’ software and the ASTM
D1535 publication. The notations are specified as Hue (H), Value (V) and Chroma (C).
secure method could be used. As mentioned previously, theorder of the filters, as shown in Table 1 is important.
The Modern FU scale should be used to estimate the colourof the water together with a Secchi disk [20] (white disk of ap-prox. 30 cm in diameter attached to a rope), in the same way asthe original scale developed by Forel and Ule was used. TheSecchi disk is lowered vertically until it disappears from sight,this is the Secchi disk depth. Next, to determine the FU num-ber, the disk is lifted to half this depth and the scale is heldabove the submerged Secchi disk. The operator then matchesthe colours of the scale filters in front of the white background,to the colour observed on top of the submerged Secchi disk,through one of the observation windows next to each FU plas-tic filters (Figure 6). To reduce the effect of direct sunlight’s re-flection on the filters, the operator should stand in the shadowor under a black umbrella, as Forel himself advised.
5 DISCUSSION
The industrial production of standardised plastic filters hasprovided the means to construct a simple colour comparatorscale for natural waters. In this article, we have provided therecipe to combine filters so that they closely mimic the originalFU scale. The plastic filters have the advantage that the colouris identical for all positions, while the thickness of the vial andthe glass itself have an effect on the colour perception [28]. Theglass produces differences in tristimulus values when mea-sured at slightly different angles, so even if the colour of theobjects was matched by visual comparison, the measurements
14025- 6

J. Europ. Opt. Soc. Rap. Public. 9, 14025 (2014) S. Novoa, et al.
FIG. 6 Diagrams of the Modern FU plastic scale. The dimensions correspond to a format A4 (297 x 210 mm). There should be a spacing of 0.4 mm between the filters and the
white background; c) Original Forel-Ule scale composed of coloured liquids in vials.
did not provide an exact chromaticity (x, y) match. For thatreason, the measurements had to be conducted at the exactsame angle and position, for both the vials and the filters. Themost stable position for the spectral measurements is achievedby placing the objects flat on the bottom of the cabinet, sincea very slight horizontal or vertical shift of the measurementangle would output different values. The spectral measure-ment of both, filters and vials, provided a basis for the instru-mental match between them. The measurement of the domi-nant wavelength (DW) of these objects (Figure 4) determinedtheir hue while the saturation (S) (Figure 5) provided infor-mation on the intensity of the hue. A maximum 20.83 % devi-ation in DW and 12.18 % in saturation between vials and fil-ters were considered satisfactorily accurate, since the coloursof the matching FU number (vial and filter) appeared visuallyidentical under the controlled conditions inside the cabinet.
We observed that the angle spacing between the different FUcolours is not constant for the entire scale, in the bluer partof the scale (FU1-11) the average spacing is greater than in thebrowner part of it (FU12-21), providing less room for error andmaking it more difficult to exactly match the colours of the fil-ters to the vials in this second part of the scale (Figure 4). Par-ticularly, the DW spacing noticeably decreased between theFU16 and FU21 (Table 2), and, in the case of FU20, there is aDW difference of 3.5 nm with respect to the previous adjacentcolour, FU19. This caused a greater difficulty to find closelya matching filter combination for this colour, and therefore agreater DWD. In the case of the FU6 color-match, the DWDresulted to be the highest (20.83 %) of all, simply because a fil-ter combination with a closer chromaticity could not be found
after numerous trials. A problem was encountered as well forFU 12 and FU13. The chromaticity coordinates of these twovials are very near, as shown in Table 2, indicating a greaterdifficulty in discriminating them. Although the deviations arestill smaller than the relative changes in DW and S betweenthese two FU numbers, the DWD % between vials and filtersis the highest together with FU6 and FU20, when compared tothe other matches.
Regarding the saturation, there is also a clear variation be-tween FU numbers that also created difficulties when select-ing the most accurate filter combinations. In some cases, suchas FU6, an exact hue (DW) match was obtained between vialsand specific filter combinations, but the saturation was muchhigher or lower, so the present filter combination for thiscolour was selected.
Two types of light sources, D65 and D75, were chosen toconduct colour-matching measurements, which correspond totwo types of daylight simulators commonly used in colour-matching tests. The results showed that the colours were sta-ble under these two different illuminations, since the coloursof the selected filters matched the colours of the vials wheninspected visually under the two types of illuminants (D65and D75) in the lighting cabinet. Also, when comparing thefilter combinations selected to the adjacent filter combinations(FU11 or FU14) they appeared to be obviously different incolour, proving that in case of doubt, the right colour wouldbe selected by an observer. It was also considered to match thecolours of the vials and filters under a D50 illuminant, alsocalled ‘horizon light’. It is a near white light source used in
14025- 7

J. Europ. Opt. Soc. Rap. Public. 9, 14025 (2014) S. Novoa, et al.
the evaluation of graphic arts and imaging applications, withsimilar amounts of red, green, and blue energy and it neitheraccentuates nor subdues colour. However, it has been relatedto the sunrise and the sunset light [34], a period of the day inwhich this scale should not be used. During twilight, the lightintensity and spectral properties can change rapidly, affectingthe colour of the water [40]. Colour-matching measurementsof natural waters using this scale should be conducted at a so-lar zenith angle above 60° (90° – zenith; 0° - horizon), as it hasbeen shown that the sun angle affects the water-leaving radi-ance [41, 42]. This is also to ensure enough light is availableand that the measurements are conducted under comparablelight conditions, corresponding with the D65 CIE standard il-lumination, which represents the average daylight.
The final objective of this study was to reproduce the coloursof the vials as identically as possible using the lighting filters,so that an observer would select the same colour in both for-mats when looking at a body of water. The authors can pos-itively state that this objective was achieved, since when in-specting the filter-vial combinations individually and all to-gether, obvious colour-matches between the correspondentvials and filters could be made. The colours of the selected fil-ter combinations were certainly different between them, butmatching the colours of each corresponding vial.
In general, the Munsell values calculated matched closely thevalues estimated visually, but in some cases the lightness val-ues (V) and the chroma (C) of the chips were higher whenestimated visually, compared to the calculations made usingthe reflectance spectra. In general, the hue values remainedsimilar, the closest chip value available in the book with re-spect to the calculated values were selected. Except for FU12,where neither of the Munsell chips available from the ‘Mun-sell book’ exactly matched its colour. There was an obviousvisual colour difference between FU12 and FU13, so the FU12colour was estimated to be allocated in between 7.5 GY 6/10and 5 GY 6/10, since the colour of the vial (FU12) fell right inbetween both of these chips when compared simultaneously.For that reason, the Munsell value presented in Table 3 forFU12 (6.25 GY 6/10) was not actually determined visually,but deduced. Also, the ‘chroma’ of FU1 did not completelymatch the chips available in the book, the maximum chromavalue available was 12, but it could be inferred that a highervalues was necessary to match the colour of the vial. Thesedifferences between calculated values from instrumental andvisual measurements were also encountered by Davies-Colleyet al. (1988, 1997) [22, 43], who attributed these differences tothe difficulty of interpolation between widely-spaced satura-tion levels for each hue. Since this is a scale meant to comparecolours by means of the human eye, we recommend to use thevalues estimated visually rather than mathematically.
Most of the Munsell values attributed to the FU indexes, co-incide with Munsell specifications found in natural waters ac-cording to the chromaticity coordinates and the Munsell spec-ifications published [22], [43]–[45]. The interesting part aboutconnecting the FU scale to the Munsell system is to includeadditional information in monitoring the water environment.For example, the Munsell system is composed of more huesthan the FU scale. Also, the FU index provides information on
variable hues (blue to brown, FU1 to FU21), but only providesone specific saturation value for each FU index. The Mun-sell system provides variable saturation values for the samehue, being able to distinguish between whitish blue, greyishblue or pure blue. For example, the whitish content in the wa-ter caused by a particular type of sediment or organism (e.g.chalk, coccoliths) does not affect the hue, but affects the sat-uration. In addition, the variability of the saturation from theMunsell system, as well as the brightness component (V), canhelp the observer better match the colour of the water body.The inclusion of these two components will be of special inter-est for the development of a smartphone application, as partof the Citclops project (www.citclops.eu), based on the sameprinciple of colour comparison as the FU scale, but using dig-ital images. The user could scroll down the different hues aswell as different lightness values and chromas to more accu-rately match the colour of a picture taken by a smartphone.
In any case, the hue component remains the most impor-tant feature of water colour, since it has been proven to becorrelated with chlorophyll-a concentration and CDOM ab-sorbance [4], and has been acknowledged to be the most im-portant colour attribute that can be accurately specified [22].In fact, the different hues of the water are used by governmen-tal agencies to define the quality of bathing waters based onhues and have also established that waters should not changeby more than 5 points on the Munsell scale.
To get a reliable natural water colour comparator scale, therecommendations for the assemblage stated in this documentshould be followed. Hence, the frame of the scale should be ofthe recommended size, since a previous prototype of the scale(1/2 of an A4) complicated the colour comparison in the field.The background of the filters has to be white, over air, so thatthe colour does not differ from the original FU scale. The filtersshould be in the right order, as minor changes in dominantwavelengths could be measured when this order was altered.The filters should also be placed as tight and flat as possible,avoiding any bending, as it could complicate the reading. Fil-ters are made of a highly reflective plastic, making it difficultto see the colour when observed under direct sunlight, for thatreason the observations should be achieved in the shade, asrecommended by the traditional FU measurement protocols[46].
The Citclops consortium plans to initially manufacture 50 ofthese scales and freely distribute them among specific envi-ronmental volunteering groups. Depending on the success ofthis initiative, more scales will be manufactured and perhapsdistributed as a kit, constituted by a frame and all the cut andnumbered filters. The user would only need to assemble allthe parts. To give the reader an idea of the costs to manufac-ture a single sacle: 1 coloured filter sheet (Lee, 0.5 x 1.2 m) costs10 Euro, a total of 30 different colour effect filter sheets are re-quired, and each sheet can be cut into approximately 100 partsof 10 x 85 mm (so each part costs around 0.1 Euros). Then, atotal of 52 filter parts are necessary for each scale (some colourparts are used for several FU colours), thus, the cost of all thefilters necessary for one scale totals 5.2 Euros. The frame wasmanufactured for around 40 Euros. The authors are in con-
14025- 8
J. Europ. Opt. Soc. Rap. Public. 9, 14025 (2014) S. Novoa, et al.
tact with possible professional manufacturers to facilitate themake of a low-cost Forel-Ule scale.
In addition, the Citclops consortium is working on the devel-opment of a smartphone application (or APP) that will includea digitalised version of the Forel-Ule scale. This applicationwill make it easier for users to estimate the colour of the wa-ters and provide more data to the consortium, since it could bedistributed easily and at no cost. Work is been undertaken onthe transformation of the FU colours of the original scale to adigital format using similar colorimetric methods to the onesused in this document. A first ‘APP’ prototype was developed,but the details on this work are beyond the scope of this inves-tigation. Due to the different smartphone screen displays andcamera characteristics, the plastic FU scale could be used as away of validating the colours selected by the users via the ap-plication. The APP includes an option where the user can in-troduce the FU number measured with the Modern FU scale,the comparison of both estimates (FU from the APP, and FUfrom the scale) would give information on the accuracy of thedigital colours.
6 CONCLUSIONS
This manuscript presents specifications on the developmentof a ‘Do-it-Yourself’ Forel-Ule scale, manufactured usinglighting filters and a white frame. This modern scale is animprovement with respect to the original scale developedby the creators Forel and Ule, and other commercially avail-able scales, as it is light-weighted, inexpensive and easy toproduce. It is also safe (no chemicals nor breaking glass) toassemble and use by observers of any age, willing to partic-ipate in water quality monitoring. The filter combinationsselected match accurately the colours estimated throughspectral reflectance measurements of the FU vials and visualcomparisons, undertaken in a controlled environment. Thelaboratory set-up and the protocols followed for the colour-matching exercises are commonly used in the industry todetermine colours under different illuminations and to matchcolours of objects. The filters employed are standardised,highly stable (able to stand high temperatures) and not proneto colour change over time. The format of the scale wasspecifically designed to easily estimate the colours of naturalwaters by anyone without colour vision deficiencies, using aSecchi disk. The FU numbers are expressed also as Munsellcolour notations, a system used by governmental agencies formonitoring water quality. These notations were measured inthe laboratory and calculated from reflectance measurements.The authors foresee as future research the association ofchlorophyll-a concentration, CDOM absorbance and TSMconcentration with these colour indexes, FU and Munsell. Inthis way, the FU index could be used by local and govern-mental authorities to determine the quality of water bodies ata local and global scale.
7 ACKNOWLEDGEMENTS
The authors wish to thank Jasper Hofstede of Controllux B.V.(The Netherlands), the provider of the colour effect filters, for
his help on selecting the filters. We like to thank Edwin Kei-jzer, Roel Bakker and Johan van Heerwaarden, highly skilledengineers of the instrumental department of the NetherlandsInstitute for Sea Research and responsible for the FU framedesign and first filter cuttings. The research described in thispaper is partly supported by the Citclops European project(FP7-ENV-308469; www.citclops.eu). The opinions expressedin this paper are those of the authors and are not necessarilythose of Citclops projects partners or the European Commis-sion.
References
[1] W. Ule, “Die Bestimmung der Wasserfarbe in den Seen, KleinereMittheilungen,” Dr. A. Petermanns Mitth. aus Justus. Perthes Ge-ogr. Anstalt 38(70)-(71) (1892).
[2] G. E. Hutchinson, A treatise on limnology. Vol. I, Geography,physics, and chemistry (John Wiley & Sons, Haboken, 1957).
[3] F. A. Forel, Le Léman, Monographie Limnologique II (Librairie del’Université, Lausanne, 1904).
[4] M. R. Wernand, H. J. Van Der Woerd, and W. W. C. Gieskes, “Trendsin Ocean Colour and Chlorophyll Concentration from 1889 to 2000,Worldwide,” PLOS One 8(6), (2013).
[5] Y. Huot, M. Babin, F. Bruyant, C. Grob, M. S. Twardowski, and H.Claustre, “Relationship between photosynthetic parameters anddifferent proxies of phytoplankton biomass in the subtropicalocean,” Biogeosciences 4, 853–868 (2007).
[6] IOCCG, “Remote Sensing of Ocean Colour in Coastal, and OtherOptically-Complex Waters,” in Reports of the International OceanColour Coordinating Group No. 3, S. Sathyendranath, ed., p. 144(IOCCG, Darmouth, 2000).
[7] J. T. O. Kirk, “Optical water quality, what does it mean andhow should we measure it?,” Water Pollut. Control 60, 194–197(1988).
[8] D. G. Smith, G. F. Croker, and K. McFarlane, “Human perception ofwater appearance,” New Zeal. J. Mar. Fresh. 29(1), 29–43 (1995).
[9] D. G. Smith, A. M. Cragg, and G. F. Croker, “Water clarity criteriafor bathing waters based on user perception,” J. Environ. Manage.33(3), 285–299 (1991).
[10] P. A. Del Giorgio, and R. H. Peters, “Patterns in planktonic P:Rratios in lakes: Influence of lake trophy and dissolved organiccarbon,” Limnol. Oceanogr. 39(4), 772–787 (1994).
[11] D. L. Christensen, S. R. Carpenter, K. L. Cottingham, S. E. Knight, N.LeBouton, J. P. Schindler, D. E. Voichick, et al., “Pelagic responsesto changes in dissolved organic carbon following division of aseepage lake,” Limnol. Oceanogr. 41, 553–559 (1996).
[12] B. Wissel, W. J. Boeing, and C. W. Ramcharan, “Effects of watercolor on predation regimes and zooplankton assemblages in fresh-water lakes,” Limnol. Oceanogr. 48(5), 1965–1976 (2003).
[13] L. M. Juarez, K.-H. Holtschmit, J. J. Salmeron, and M.K. Smith, “The effects of chemical and visual communi-cation, space availability, and substratum color on growthof the juvenile freshwater prawn Macrobrachium rosen-bergii (De Man),” J. Exp. Mar. Bio. Ecol. 110(3), 285–295(1987).
[14] A. Kullberg, “Benthic macroinvertebrate community structure in20 streams of varying pH and humic content,” Environ. Pollut.78(1)-(3), 103–106 (1992).
14025- 9

J. Europ. Opt. Soc. Rap. Public. 9, 14025 (2014) S. Novoa, et al.
[15] T. A. Haines, V. T. Komov, V. E. Matey, and C. H. Jagoe, “Perch mer-cury content is related to acidity and color of 26 Russian lakes,”Water Air Soil Poll. 85, 823–828 (1995).
[16] A. Nilsson, and L. Håkanson, “Relationships between mercuryin lake water, water colour and mercury in fish,” Hydrobiologia235/236, 675–683 (1992).
[17] J. Bøgestrand, P. Kristensen, and B. Kronvang, “Source apportion-ment of nitrogen and phosphorus inputs into the aquatic environ-ment,” Report 7, 48 (European Environment Agency, Copenhagen,2005).
[18] D. R. J. Moore, P.-Y. Caux, “Ambient Water Quality Criteria forColour in British Columbia: Technical Appendix” Ministry of En-vironment. Water Quality Branch (1997).http://www.env.gov.bc.ca/wat/wq/BCguidelines/colour
[19] W. Preisendorfer, “Secchi disk science: Visual optics of naturalwaters,” Limnol. Oceanogr. 3, 909–926 (1986).
[20] P. A. Secchi, “Relazione delle esperienze fatte a bordo della pon-tificia pirocorvetta l’Immacolata concezione per determinare latrasparenza del mare,” Il Nuovo Cimento 20, 205–238 (1864).
[21] I. D. Cuthbert, and P. a. Del Giorgio, “Toward a standard methodof measuring color in freshwater,” Limnol. Oceanogr. 37(6), 1319–1326 (1992).
[22] R. J. Davies-colley, Smith, D.G, D. J. Speed, and J. W. Nagels,“Matching natural water colors to Munsell standards,” J. Am. Wa-ter Resour. As. 33(6), 1351–1361 (1997).
[23] R. J. Davies-Colley, W. N. Vant, and D. G. Smith, Colour and Clarityof Natural waters (Ellis Horwood Limited, Chicheste, 1993).
[24] T. Y. Crowell Company, The Science of Color (Optical Society ofAmerica, Washington D. C, 1966).
[25] A. H. Munsell, “A Pigment Color System and Notation,” Am. J.Psychol. 23, 236–244 (1912).
[26] R. J. Davis-Colley, and D. Ballantine “Suitability of NZ Rivers forcontact recreation,” NIWA, National Institute of Water and Atmo-spheric Research, Report 133, 19 (2010).
[27] Ministry for the Environment Manatu Mo Te Taiao, “Guidelines forthe Management of Water Colour and Clarity, No. 2,” p. 77 (1994).
[28] S. Novoa, M. R. Wernand, and H. J. van der Woerd, “The Forel-Ule scale revisited spectrally: preparation protocol, transmissionmeasurements and chromaticity,” J. Europ. Opt. Soc. Rap. Public8, 13057 (2013).
[29] D. Lison, M. De Boeck, V. Verougstraete, and M. Kirsch-Volders,“Update on the genotoxicity and carcinogenicity of cobalt com-pounds,” Occup. Environ. Med. 58(10), 619–625 (2001).
[30] J. H. Jerome, R. P. Bukata, P. H. Whitfield, and N. Rousseau,“Colours of natural waters: 1. Factors controlling the dominantwavelength,” Northwest Sci. 68, 43–52 (1994).
[31] J. H. Jerome, R. P. Bukata, P. H. Whitfield, and N. Rousseau,“Colours of natural waters: 2. Observations of spectral variationsin British Columbia,” Northwest Sci. 68, 53–64 (1994).
[32] R. S. Berns, “Principles of color technology,” F. W. Billmeyer, andM. Saltzman, ed., 247 (John Wiley & Sons, Haboken, 2000).
[33] D. Farnsworth, “The Farnsworth-Munsell 100-Hue and Dichoto-mous Tests for Color Vision,” J. Opt. Soc. Am. 33, 568–574. (1943).
[34] HunterLab, “Equivalent White Light Sources and CIE Illuminants,”Appl. Notes 17(5), 1–5 (2008).
[35] ASTM Standard E1164, “Standard Practice for Obtaining Spectro-metric Data for Object-Color Evaluation,” American Society for Test-ing and Materials (ASTM) International (2003).
[36] ASTM Standard E179-12, “Standard Guide for Selection of GeometricConditions for Measurement of Reflection and Transmission Prop-erties of Materials,” American Society for Testing and Materials(ASTM) International (2012).
[37] ASTM Standard E308, “Standard Practice for Computing the Colorsof Objects by Using the CIE System,” American Society for Testingand Materials (ASTM) International (2013).
[38] G. Wyszecki, and W. S. Stiles, Colour Science: Concepts and Meth-ods, Quantitative Data and Formulae (John Wiley & Sons, Haboken,1982).
[39] ASTM Standard D1535, “Standard Method of Specifying Color bythe Munsell System,” American Society for Testing and Materials(ASTM) International (2013).
[40] W. N. McFarland, and F. W. Munz, “Part II: The photic environmentof clear tropical seas during the day,” Vision Res. 15(10), 1063–1070 (1975).
[41] J. L. Mueller, G. S. Fargion, C. R. Mcclain, J. L. Mueller, R. R. Bidi-gare, C. Trees, W. M. Balch, et al., “NASA/TM-2003- Ocean OpticsProtocols For Satellite Ocean Color Sensor Validation,” Revision5, Volume V: Biogeochemical and Bio-Optical Measurements andData Analysis Protocols NASA (2003).http://oceancolor.gsfc.nasa.gov/
[42] M. Wang, “Effects of ocean surface reflectance variation with so-lar elevation on normalized water-leaving radiance,” Appl. Optics45(17), 4122–4128 (2006).
[43] R. J. Davies-Colley, W. N. Vant, and R. J. Wilcock, “Lake water color:Comparison of direct observations with underwater spectral irra-diance,” Water Resour. Bull. 24(1), 11–18 (1988).
[44] S. Q. Duntley, R. W. Austin, W. H. Wilson, C. F. Edgerton, and S. E.Moran, Ocean Color Analysis (NTiS 7420, 1974).
[45] R. C. Smith, and K. S. Baker, “Optical classification of naturalwaters,” Visibility Laboratory. Scripps Institution of Oceanography.La Jolla, California., p. 20 (1977).http://misclab.umeoce.maine.edu/education/VisibilityLab/reports/SIO_77-4.pdf
[46] M. R. Wernand, Poseidon’s paintbox historical archives of oceancolour in global change (PhD Thesis, Utrecht University, 2010).
14025- 10