the mississippi river as a link to global trade
TRANSCRIPT

The Mississippi River as a Link to
Global Trade
Bruce Lambert
ITTS

Who benefits from transportation improvements?
• Carriers
• Ports
• Governments and other local industries
• Shippers
• Economic Development Agencies
• Who does not benefit?

Outline
• Mississippi River Trade
• Domestic Trade and the Lower River
• Global Trade Support’s the Nation’s Economy
• Where Do We Go From Here?

Mississippi River Trade

Top Trading Partners – Exports (millions in vessel value)
-
10,000
20,000
30,000
40,000
50,000
60,000
2003 2004 2005 2006 2007 2008 2009 2010 2011
Africa
Asia
Western Europe
Canada
Mexico
Middle East
South America
Central America
Caribbean
Oceania
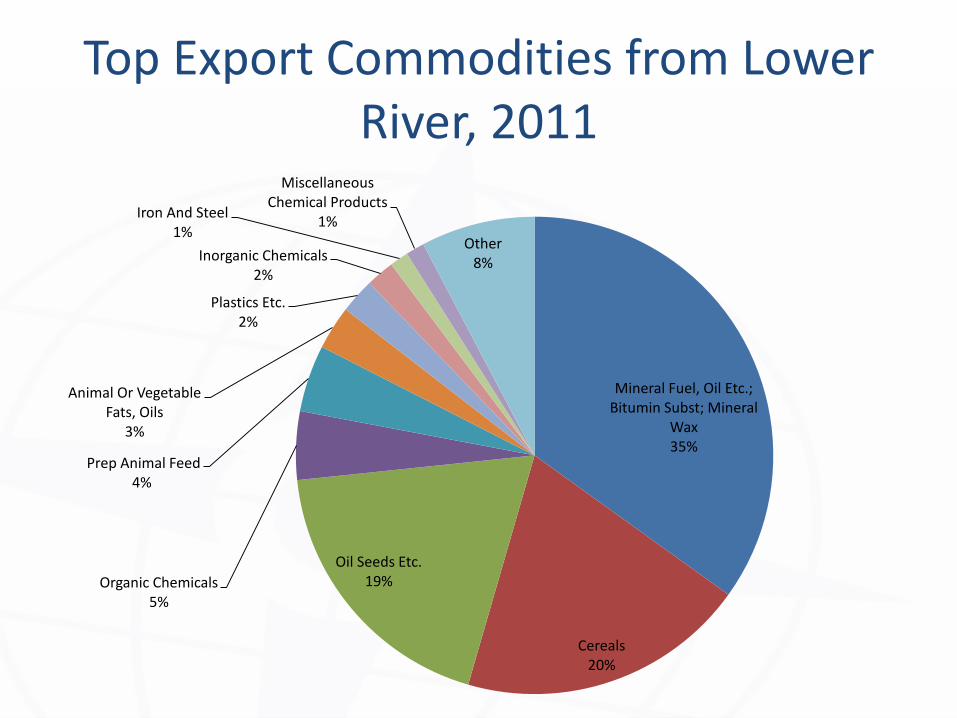
Top Export Commodities from Lower River, 2011
Mineral Fuel, Oil Etc.; Bitumin Subst; Mineral
Wax 35%
Cereals 20%
Oil Seeds Etc. 19% Organic Chemicals
5%
Prep Animal Feed 4%
Animal Or Vegetable Fats, Oils
3%
Plastics Etc. 2%
Inorganic Chemicals 2%
Iron And Steel 1%
Miscellaneous Chemical Products
1%
Other 8%

Top Trading Partners – Imports (millions in vessel value)
-
10,000
20,000
30,000
40,000
50,000
60,000
2003 2004 2005 2006 2007 2008 2009 2010 2011
Africa
Asia
Western Europe
Canada
Mexico
Middle East
South America
Central America
Caribbean
Oceania

Top Import Commodities, 2011
Mineral Fuel, Oil 57%
Iron And Steel 9%
Fertilizers 6%
Organic Chemicals 3%
Rubber And Articles Thereof
3%
Inorg Chem; 3%
Copper 3%
Coffee, Tea, Mate & Spices
3%
Animal Or Vegetable Fats 3%
Salt; Sulfur; Earth & Stone; Lime & Cement
Plaster 1% Other
9%

Domestic Tonnage on River

Competing Corridors to Baton Rogue/New Orleans (FAF, 2010)
Air (include truck-air) 0%
Multiple modes & mail 5%
No domestic mode 1%
Other and unknown 1%
Pipeline 34%
Rail 7%
Truck 28%
Water 24%
Air (include truck-air) 0%
Multiple modes & mail 15%
No domestic mode 0%
Other and unknown 1% Pipeline
3%
Rail 8%
Truck 6%
Water 67%
Northbound 107,396
Southbound 390,459
10

Trade Patterns- Domestic Waterway Tonnage to/from Louisiana (2010)
-
5
10
15
20
25
30
35
40
Mill
ion
s
Northbound
Southbound
11

Top Commodities Moved on the River (2010)
-
10
20
30
40
50
60
70
Northbound Southbound
Mill
ion
s to
ns
Unknown and Not Elsewhere ClassifiedProducts
Manufactured Goods
Food and Food Products
Primary Metal Products
Primary Non-Metal Products
Iron Ore, Iron, and Steel Waste and Scrap
Sand, Gravel, Shells, Clay, Salt, and Slag
Chemicals excluding Fertilizers
Chemical Fertilizers
Petroleum Products
12

Global Maritime Exports Supports Nation’s Economy

International Maritime Trade as Share of State GDP, 2012 (all ports)

Mississippi River and Its Relationship to State Exports (2011)
Shading Indicates Ranking of MS River Traffic based on Share of Export Tonnage
% represents share of Total State exports through the Miss River Corridor (maritime tonnage)

Where do we go from here…

Two Directions of Development
• What is your market?
• What facility/services are needed?
• Develop densities and services
• Equipment balances • Workforce training • Public-Private
partners
Terminal
Port Port
Terminal
1. Inside-Out 2. Outside-In

Freight Access and Mobility
May Create Transformative
Opportunities

Terminal Operations
Transportation Infrastructure
Utilities Workforce
Development Business Climate Incentives
Cargo Density Business Clusters
Transportation services
Intermediaries
Pri
vate
Sec
tor
Pu
blic
Sec
tor
Who is Responsible for What?

Partnerships are critical...
• Must have interest
• Must have right tools
• Can communicate expected outcomes “champion”
• Must commit for the entire project
• Requires some “skin in the game”

If I gave you one dollar…
How would you invest it in your area?

Three Questions…
1. Mississippi River’s Greatest Advantage – Has worked, does work, and will continue to do so
2. Significant obstacles to developing trade – Get businesses to see river as “highway” (domestic
and global)
– Support\fund startups
– WRRDA
3. What Can You Do – Get firms to the river before picking winners/losers
– Educate others on benefits of waterway development