the minimum wage in - acadia universityeconomics.acadiau.ca/tl_files/sites/economics/resources...the...
TRANSCRIPT

The Minimum Wage 1
The Minimum Wage in
Canada’s Provinces
Keith Francis Walsh
Mount Allison University

The Minimum Wage 2
Abstract
The minimum wage and its effects on employment, participation, and poverty rates in Canada’s
provinces from 1987 to 2007 is the primary focus of this study. The goal of studying these rates is
to determine the consequences of reinstating the federal minimum wage in Canada. Other factors
such as GDP per capita and the generosity of government benefits will also be considered to see
if they are greater determinants of employment, participation, and poverty rates than the
minimum wage. Specific focus will also be given to the lowest paying occupations, the
occupations that traditionally are the most influenced by the minimum wage.
Key words: minimum wage, relative minimum wage, nine occupations, employment

The Minimum Wage 3
The Minimum Wage in Canada’s Provinces
After letting the federal minimum wage erode away to inflation, Jean Chrétien’s Liberal
government essentially abolished the federal minimum wage in 1996 by setting it equal in each
province to their provincial minimum wages (Battle, 2003, p. 3). This decision had little impact
on most Canadians since the federal minimum wage only applies to the 10% of occupations
falling under federal jurisdiction. Most federally regulated occupations are generally well paying
and so only about 0.1% of Canadian jobs were directly affected by the federal minimum wage
(Gunderson, 2005, p. 47).
In 2006 Peggy Nash, a New Democratic Party MP, introduced a private member’s bill
that is still supported by the NDP. This bill would reset the federal minimum wage at $10 per
hour and be indexed to inflation. (Canada. House of Commons, February 20, 2007, p. 7032; New
Democratic Party of Canada, 2009). Recognizing that the federal minimum wage only applies to
a small share of workers, the goal of this bill was to set a minimum wage precedent for the other
provinces to follow.
Minimum wage legislation has been applauded in both the political and academic arenas
for many years. Winston Churchill supported implementing minimum wage laws in the United
Kingdom saying, “It is a serious national evil that any class of His Majesty’s subjects should
receive less than a living wage (…) the good employer is undercut by the bad, and the bad
employer by the worst.” (Campbell, 1995 as cited in Eyraud and Saget, 2005, p. 40). Furthering
this, Article 23 in the United Nations Declaration of Human Rights states that workers have the
right to a “favourable remuneration” for their labours (Schenk, 2001, p. 19). Others support high

The Minimum Wage 4
minimum wages because, “wage rates below a certain level are incompatible with human
dignity” (Heath, 2009, p. 250).
There are numerous reasons why some advocate for high minimum wages. One often
touted advantage is that they are an effective anti-poverty tool that can help many of the working
poor and reduce income inequality (Waltman, 2004; Luce, 2004). The wages of those who
already earn slightly above the minimum wage may also increase as minimum wage rise, a
process that is known as the spillover effect (Card and Krueger, 1995, p. 3; Hamermesh, 1993, p.
186). On top of this, a higher minimum wage will give minimum wage earners a greater feeling
of self worth and demonstrates that their labours are valued by society.
There are even advantages to employers if minimum wages are high. One such advantage
is reduced shirking and turnover by employees (Hamermesh 1993, p. 243-244; Raff and
Summers, 1987, p. S79). Indeed, Adam Smith observed this tendency saying, “Where wages are
high, accordingly, we shall always find the workmen more active, diligent, and expeditious, than
where they are low.” (Smith, 1776 as cited in Waltman, 2004, p. 84). Another possible benefit to
employers and firms if minimum wages are raised is an increase in aggregate demand. This could
occur because higher minimum wages give more disposable income to low-income earners, and
low-income earners tend to spend most of their incomes which would result in the overall
demand for goods and services to increase and in further economic growth (Prasch, 1996, p. 3).
All of these benefits may be gained from increasing the minimum wage but they could
come at a cost. Basic economic theory dictates that higher minimum wages force employers up
along their downward sloping labour demand curves and result in a lower quantity of labour
being demanded than before minimum wages were implemented (McConnell et al. 2005b, p.

The Minimum Wage 5
114). Some detractors of the minimum wage feel this disemployment effect outweighs any
potential gains. In a 2008 book by Neumark and Wascher, the authors found overall, from a
variety of studies, that minimum wages have an adverse effect on employment and are a
“relatively ineffective social policy for aiding the poor” (2008, p. 249).
One explanation for minimum wages supposed inability to reduce poverty is that wages
are paid on an individual basis and do not take into account varying family and financial
circumstances. Indeed, even if minimum wages were set at a level where a single person working
full time was not living in poverty, this level of income certainly would be lower than the income
needed to keep a family of five above the poverty line. Another reason that higher minimum
wages do not tend to help the poorest is there is a weak link between low-income and low-wages.
This is because many of the poor do not work and so would not be helped by a higher minimum
wage and that many low-wage earners live in high income homes (Benjamin et al., 2007, p. 229).
Higher minimum wages also may not increase aggregate demand. Since wages just
transfer income from an employer to an employee, a higher minimum wage simply results in less
income for an employer and more income for employees. The employee, who probably earns less
than an employer, may very well have greater propensity to consume than the employer but any
disemployment effect created by the minimum wage could offset any additional expenditures by
the now wealthier employees.
The raging debate between academics about the advantages and disadvantages of
minimum wages will be covered extensively in the literature review below. The real question for
this paper is whether minimum wages have a significant influence on employment, participation,
and poverty rates in Canada’s provinces between 1987 and 2007. A further question to be

The Minimum Wage 6
answered is whether minimum wages or other determinants are the greatest influences of these
rates.
The measure of employment in this project will be the ratio of those employed in a variety
of occupations to the labour force. One specific measure of employment that is especially
important to minimum wage earners is the ratio of those employed in the nine occupations paying
the lowest median hourly wages to the labour force. These nine occupations were specifically
chosen since they include many of the occupations that traditionally pay the minimum wage and
their median hourly wages are below the Canadian median (Statistics Canada, No date h).
Participation rates will be measured in the normal fashion, while “poverty rates”, which lack an
authoritative definition, will be estimated by the percentage of various family types with incomes
below the Low Income Cut Off (LICO).
There are three different measures of the minimum wage that will be used in this study.
The first measure is the average real minimum wage for each province in each year while the
other two are relative measures of the minimum wage. One such relative measure is the percent
difference between the minimum wage and the median hourly wage for each province in each
year. This will determine how a “relatively” high minimum wage compared with other wages
influences employment, participation, and low-income rates. Another relative measure of the
minimum wage will be the percent difference between the minimum wage and the hourly wage
needed to earn the Market Basket Measure (MBM) for each province’s largest city. The MBM is
a measure of poverty created by Human Resources Development Canada that calculates the cost
of a basket of goods and services for a family of any size (HRDC, 2003).

The Minimum Wage 7
Another major determinant of the dependent variables may be the generosity of
government transfer payments to individuals, notably in the form of social assistance,
employment insurance, and child tax benefits. It will be especially interesting to include
government transfers for their disincentive effects towards employment seeking but also for their
poverty reducing capabilities.
GDP per capita’s influence on employment, poverty, and low-income rates will also be of
interest in this study. It is expected that the level of GDP per capita will be the main cause of
fluctuations in employment, participation, and low-income rates.
A variable that will only be included while focusing on low-income rates will be the
unemployment rate. As seen in Figure 1, these two rates tend to be heavily associated with each
other (Picot and Myles, 2005, p. 16). Another variable that will only be used in low-income
regressions is the median income of a province during a year. The median level of income is a
better reflection of the “average” income for a province, as opposed to the mean income which
becomes exaggerated because of the inclusion of very high incomes. It is also a better measure of
family income than GDP per capita since it actually measures incomes received by families
instead of a province’s output.
It may be the case that the minimum wage is an overrated and uninfluential policy
instrument, one whose effects on employment, participation, and poverty rates are dwarfed in
comparison to other factors. Certainly, the minimum wage is not a silver bullet for improving the
economic and social health of Canada, but a higher minimum wage is only one choice from many
potential poverty reducing and economy enhancing policy options.

The Minimum Wage 8
The rest of the report is divided into six sections. The following section is a summary of
the statistics concerning minimum wage and low-wage earners and their occupations. Following
that section is a review of the literature and sources used in the creation of this report. After the
literature review is a detailed explanation of the dependent and independent variables focused on
in this report, along with a description of the data and methodology used in the econometric
models. The next section presents the results of the econometric models. The results are quite
lengthy since employment, participation, and low-income rates were all broken down into various
age and sex categories. Conclusions and explanations of the results are then subsequently
provided. The report closes with a brief section about possible policy implications for
governments.
Statistical Profile of Minimum Wage Earners and Occupations
In 2004 almost 550,000 Canadians, 4.1% of the workforce, earned the minimum wage,
down from 5.7% in 1997. The percentage of the workers earning the minimum wage is highest in
Newfoundland and Labrador at 8.5% of employees and lowest in Alberta at 1.1% (Sussman and
Tabi, 2004, p. 6). Women make up a larger share of minimum wage earners than men at 62.1%,
despite only comprising 48.1% of the workforce. In accordance with stereotypes, most minimum
wage earners are young, with teenagers making up 47.1% of minimum wage workers while those
over 45 comprise only 13.4%. Adult women cover 34.4% of minimum wage earners, followed by
teenage girls at 27.7%, then teenage boys at 19.3%, and finally adult men at 18.5% (Battle 2003,
pp. 36, 37).
Minimum wage workers are most overrepresented in the accommodation and food service
industry where 19.4% of employees earn minimum wages. Following this is agriculture and then

The Minimum Wage 9
trades at 15.4% and 8.8% respectively. Trade is the industry where the most minimum wage
workers are employed at 30.2%, followed by accommodation and food services at 28.9% (Battle,
2003, p. 45). Sixty percent of minimum wage workers are part time workers, defined as working
less than 30 hours per week. Throughout the entire workforce, only 20% of workers are part time
(Sussman and Tabi, 2004, p. 10).
Unsurprisingly, minimum wage earners tend to be concentrated at the lower end of the
educational spectrum. Sixty-three point four percent of minimum wage earners have at most a
high school diploma but 5.5% do have a university degree (Battle, 2003, pp. 40, 41).
The nine lowest paying occupations in Canada (Table 1) specifically focused on in this
report made up about 40% of Canadian employees in 2008 (Statistics Canada, No date f). About
45% of employees in these occupations are male and 55% are female. Within these nine jobs,
there are some that employ mostly one sex. For example, childcare and home support workers are
93% female while trades helpers are 88% male (Table 2). Some occupations employ far more full
time employees than part time, such as machine operators where 96% of workers are full time, as
opposed to retail salespeople where only about 54% of employees work 30 hours or more per
week (Table 3).
Real minimum wages in Canada have not consistently increased or decreased since 1965.
The average minimum wage in Canada (in 2001 dollars) rose during the late 1960s to the mid-
1970s, hitting a peak of $8.58 in 1976. After that, it began to fall until it bottomed out at $5.96 in
1986 and then leveled off until the early 1990s. The average minimum wage in Canada rose until
the end of the 1990s but started to decrease again in the early 21st century, sinking to $6.76 in
2001 (Battle, 2003, p. 6). In the very recent past, provincial governments have shown renewed

The Minimum Wage 10
enthusiasm for raising the minimum wage, especially in Ontario and Newfoundland and Labrador
where the minimum wages will be at least $10 per hour by July 2010 (HRSDC, 2009). See Figure
2 for a graph of the real provincial minimum wages in 2002 dollars between 1987 and 2007.
Literature Review
Minimum Wages
Perhaps one of the most influential and frequently cited works on the minimum wage is
the 1995 book by Card and Krueger, Myth and Measurement. The principle study in this book is
the effects of an increase in New Jersey’s minimum wage on teenage fast-food employment in
New Jersey and Eastern Pennsylvania. Using this survey and a host of others, the authors
concluded that higher minimum wages have a negligible if not positive effect on employment,
contrary to what is predicted by economic theory (Card and Krueger, 1995, p. 1). Card and
Krueger also found that minimum wages were a powerful policy option that could help to reduce
poverty, decrease income inequality, raise the wages of many via spillover effects, and they may
also benefit employers by reducing turnover and increasing worker productivity.
The following two reports were both published by the Canadian Centre for Policy
Alternatives. “The Case for a Strong Minimum Wage Policy” proposed that higher minimum
wages will not only help to reduce poverty but are also a medium for every worker to live and
participate in the community with dignity (Black and Shaw, 1998, p. 3). Other potential benefits
of high minimum wages were also lauded, such as more productive workers and efficient firms
(Black and Shaw, 1998, pp. 9, 10). Michael Goldberg and David Green also released a report for
the Canadian Centre for Policy Alternatives titled, “Raising the Floor”. This report included an
empirical analysis of employment and minimum wages in Ontario, Québec, Alberta, and British

The Minimum Wage 11
Columbia. The authors found that minimum wages only had a negative and significant effect on
the employment of 20 to 24 year old males but were statistically insignificant for all other groups
studied (Goldberg and Green, 1999, p. 17, 18). The authors also felt that labour demand was
inelastic and minimum wage increases would be beneficial by raising the overall wage bill for
employees (Goldberg and Green, 1999, p. 20).
Jerold Waltman published The Case for the Living Wage in 2004. This book was a
passionate plea not just for higher minimum wages, but instead for “living wages” that would
give all workers a respectable level of income and decrease income inequality (Waltman 2004, p.
117). Citing studies that found insignificant or positive employment effects after minimum wage
increases, Waltman believed that paying living wages could also result in more productive
workers and reduced turnover (2004, p. 133). While setting the living wage rate, Waltman argues,
relative incomes should be taken into account. Waltman proposed setting the living wage at 20%
of the top vigintile’s income which, according to his calculations, would set the minimum wage
at $17.84 per hour (2004, pp. 124, 125).
Published by the International Labour Office, The Fundamentals of Minimum Wage
Fixing took an international perspective on the minimum wage. One major section covered in this
book was the way that minimum wages are set and altered around the world. Several countries
have regulations that dictate when minimum wages should be raised based on inflation, while
others tend to look at the overall economic conditions while altering theirs (Eyraud and Saget,
2005, pp. 31-39). Further regard was also given to the connection between minimum wage
increases and further wage increases in occupations that are not associated with the minimum
wage (Eyraud and Saget, 2005, pp. 62, 63). This book considered the possible negative
employment effects caused by the minimum wage, but it concluded that minimum wages are

The Minimum Wage 12
beneficial since the vast majority of gains from their increases minimum wages go towards lower
income families (Eyraud and Saget, 2005, p. 99).
Another international perspective on minimum wages that specifically focused on Latin
America is Minimum Wages and Social Policy, published by the World Bank. This book
specifically explored the issue of introducing minimum wages and their effects on poverty in
some of South and Central America’s poorest countries. Just like in developed countries, policy
makers have to walk a fine line between improving the welfare of the poorest while not creating
unemployment. Cunningham found that especially vulnerable workers are hurt the most if
minimum wage are increased, especially if there is only one earner in a household (2008, p. 3).
Similar to developed countries, minimum wages do not tend to help many of the poorest since
they are already unemployed, but they do help those with incomes marginally below the poverty
line (Cunningham, 2008, p. 53).
Daniel Hamermesh’s 1993 book, Labor Demand provided useful insights into a
previously underexplored field. A major topic covered in this book was the elasticity of labour
demand. Labour demand was found to be generally inelastic, with elasticities somewhere
between -0.15 and -0.75, but -0.30 is probably the best estimate (Hamermesh, 1993, p. 135).
Hamermesh also included a section on labour demand and minimum wages. Several topics
receiving attention in this section were the impact of minimum wages on the uncovered sector,
spillover effects and the elasticity of labour demand in minimum wage occupations (Hamermesh
1993, pp. 182-187). Hamermesh joins the chorus of authors who think that minimum wages will
only have a slight disemployment effect on adult workers since it is much lower than most wages
(1993, p. 191).

The Minimum Wage 13
Neumark and Wascher presented arguments against the minimum wage in Minimum
Wages. Supporting traditional economic theory, the authors argued that an increased minimum
wage will either cause capital and other means of production to be substituted for labour causing
disemployment or for price increases to be passed along to the consumer (Neumark and Wascher,
2008, p. 39). The minimum wage was also debunked for other reasons, notably because it causes
some students to drop out of school and reduces on the job training (2008, pp. 192, 199). Overall,
the authors concluded that minimum wages were a “relatively ineffective social policy for aiding
the poor” (Neumark and Wascher, 2008, pp. 249).
Baker, Benjamin, and Stranger (1999) gave yet another perspective on the effects of
minimum wage legislation that could settle some of the debate surrounding the subject. By taking
low frequency samples, these authors found that there tends to be a long run rather than
immediate adjustment in teenage employment after minimum wages are increased (Baker et al.,
1999, p. 320). In the long run, there is a negative elasticity of about 0.25 for teenage employment
(Baker et al., 1999, p. 320). A 2.5% disemployment effect for a 10% increase in the minimum
wage has been cited by the Canadian Chamber of Commerce as a reason to keep the minimum
wage low (CCC, 2005, p. 8). Negative elasticities for teen labour may mean that teens are
substituted for adult labour or other factors of production in the longer run.
Morley Gunderson, on behalf of Human Resources and Skills Development Canada,
created a summary of American and Canadian minimum wage research along with a discussion
about many of the issues surrounding minimum wages. Several Canadian reports that were
summarized include that of Fortin and Maki from the late 1970s. These authors found a small and
sometimes significant disemployment effect caused by the minimum wage, as did Gruebel and
Maki, and Schaafsma and Walsh in the early 1980s (Gunderson, 2005, pp. 33-36). Later on in the
The Minimum Wage 14
1980s, Mercier established that there were negative elasticities in the -0.1 to -0.3 range for
teenage labour in Québec (1985 as cited in Gunderson, 2005, p. 37). Around the beginning of the
21st century, several other studies generally concluded that disemployment effects were greater
for youth than adults and that the minimum wage is not an ideal anti-poverty tool, although most
gains from minimum wage increases flow towards lower income households (Shannon and
Beach, 1995, Fortin and Lemieux, 2000, Baker, 2005, and Fortin and Lemieux, 2002, as cited in
Gunderson, 2005, pp. 38-47). Gunderson finished his report with a profile of the federal
minimum wage that focused on the political aspects of its possible reintroduction (2005, pp. 47-
49).
Another issue usually associated with the minimum wage is the topic of efficiency wages.
“Did Henry Ford Pay Efficiency Wages?” chronicled the decision made by Ford Motor Co. in
1914 to raise its wages from $2.34 to $5 per day, approximately double the daily wages of most
workers at that time (Raff and Summers, 1987, p. S59, S69). Annual labour costs at Ford rose by
about half of the previous year’s profits after this increase, but Ford’s profits still soared by over
$10 million (in real 1910 dollars) from 1913 to 1915 (Nevins, 1954 as cited in Raff and Summers,
1987, pp. S68, S75). This profit increase can be largely attributed to decreased turnover, which
dropped from 370% in 1913 to 16% in 1915 for very repetitious and monotonous assembly line
jobs (Raff and Summers, 1987, p. S78). Henry Ford boasted about his decision to increase wages
saying:
There was…no charity in any way involved…We wanted to pay these wages so that the business would be on a lasting foundation. We were building for the future. A low wage business in always insecure… The payment of five dollars a day for an eight-hour day was one of the finest cost cutting moves we ever made. (1922 as cited in Raff and Summers, 1987, p. S59)

The Minimum Wage 15
An interesting perspective by David Green and Kathryn Harrison on minimum wage
setting practices by provincial governments was presented in “Racing to the Middle”. This report
demonstrated that provincial governments strive to set minimum wages in the middle of the
provincial minimum wage distribution. Governments make an effort to remain in the middle of
the minimum wage range in an attempt to show that both the interests of employees and
employers are taken into account while minimum wages are being altered. Indeed, the word
“balance” is frequently used in press releases regarding changes in the minimum wage (Green
and Harrison, 2006, p. 10). The notion of finding a balance between competing groups was
exemplified further by a Manitoba public servant who said that, “The minimum wage is mostly
symbolic.”: a symbol of how government is trying to be fair to both employers and employees by
balancing their interests (Green and Harrison, 2006, p. 25). Ideologically extreme parties tend to
resist the allure of setting minimum wages in the middle of the range and instead aim for either
extreme (Green and Harrison, 2006, p. 9, 10).
Relative Wages
Robert Frank gave an interesting perspective on relative and nominal wages in his 2007
book, Falling Behind. Frank argues that relative, not absolute, income is a better predictor of
individual happiness (p. 21). This is readily exemplified in all communities, where everyone is
trying to keep up with what is deemed “normal” consumption patterns (Frank, 2007, p. 52).
Relative wages pertain to the study of the minimum wages since workers and employers may
decide to provide their services or hire based on whether minimum wages are relatively ‘‘high’’
or ‘‘low’’.

The Minimum Wage 16
Low-Income and Government Assistance
Reports by Human Resources Development Canada and Statistics Canada were useful for
demonstrating the ambiguity that surrounds the definition of the word ‘‘poverty’’. HRDC
introduced the Market Basket Measure (MBM) approach to measuring poverty in 2003, an
approach that calculates the cost of a basket of goods and services going beyond the essentials of
food, clothing, and shelter to include footwear, transportation, personal and household needs,
furniture, telephone, and modest amounts of reading, recreation, and entertainment (HRDC, 2003,
p. 4). This measure also emphasizes the returns to scale for expenses as family size increases.
HRDC, however, explained that the MBM or any other single low-income indicator cannot
determine what constitutes a poverty line (2003, p. 2). The Chief Statistician of Canada, Ivan
Fellegi, was also unyielding in stating that LICO has never been considered as a poverty line by
Statistics Canada (2005). The LICO is a measure of poverty that considers a family to be living in
“low-income” if 63.6% or more of their after-tax income is spent on food, clothing, and shelter
(Statistics Canada, No date d).
Written in 1974, Peter H. MacRae created a report for the Council of Maritime Premiers
titled, “Social Assistance and Work Effort”. Although this report is now slightly dated, it
discussed the timeless topic of whether social assistance recipients legitimately need assistance or
are deliberately cheating the system. Since 75% of social assistance recipients in the time period
studied were considered unemployable, MacRae concluded that there was no mass abuse of the
program (1974, pp. 9, 158). The social assistance system also does not create a “leisure inducing
bonanza” since its benefit payments are actually quite small. However, some will always be lured
away from participating in the labour force and towards social assistance benefits, especially

The Minimum Wage 17
those with the lowest education and skills whose salaries minus childcare and travel costs are less
than what would be received through social assistance (MacRae, 1974, pp. 158-160).
Two reports about social assistance usage by Canadians include those by Card and Robins
in 1996, and Lemieux and Milligan in 2006. Both studies concluded that there is an incentive for
those receiving social assistance to not work. Card and Robins found that only 20% of single
parents receiving social assistance in New Brunswick and British Columbia reported any
additional income. However, many of those receiving social assistance face limited work
opportunities and low-wages which could result in their family incomes decreasing if they find
employment, an undesirable outcome for a single parents (Card and Robins, 1996, pp. vii, 1).
Lemieux and Milligan found further evidence of higher social assistance benefits acting as a
disincentive towards potential employees. Using Census data, the authors found that increasing
social assistance benefits in 1980s by a few hundred dollars as recipients reach age 30 reduced
employment rates by between three and five percent (Lemieux and Milligan, 2006, pp. 14, 15).
Christofides, Stengos, and Swidinsky gave another interesting perspective on the
relationship between social assistance usage and employment. The authors found that it is not just
the gross amount of social assistance payments given to recipients that determine whether
someone seeks employment or not, but the level of exempt earnings are important too (Bailey,
1994, Charette and Meng, 1994 as cited in Christofides et al., 1997, pp. 596-597). Exempt
earnings are the amount of private sector income that a social assistance recipient can earn before
benefits start to be deducted. Raising the level of exempt earnings may actually lead to an
increase in the labour supply, while the magnitude of basic allowances did not have a significant
effect on labour force participation at the 95% significance level (Christofides et al. 1997, pp.
609-611).

The Minimum Wage 18
Baker and Tippin (1999) wrote a book that focused on the employability of mothers. The
most relevant aspect of the book to this report was the relationship between the minimum wage
and social assistance. Several sources found that many mothers will be made worse off
financially if they work for the minimum wage rather than receive benefits (Lord 1994,
Armstrong 1996, and Lewis, 1997 as cited in Baker and Tippin, 199, p. 14). Baked and Tippin
lauded a possible alternative to choosing between employment and social benefits used in the
United Kingdom. Both the government and private sector participate in this solution, with
government benefits being added on top of market earned wages to boost earnings for a single
mother working full time from the minimum wage of £3.60 per hour to the equivalency of £6.00
per hour (Guardian, 1998 as cited in Baker and Tippin, 1999, p. 202).
Low-income mobility was an especially important topic covered by Picot and Myles in a
2005 report for Statistics Canada. In Canada, 38% those who find themselves earning low-
incomes will generally escape the predicament after one year but 24% of low-income earners will
be in the same situation five years later (Corak et al., 2003 as cited in Picot and Myles, 2005, p.
22). About half of those who experience low-income for five years or more have some sort of
work-limiting disability, which partially accounts low-income’s persistence in Canada (Hatfield,
2003 as cited in Picot and Myles, 2005, p. 25). Overall, the authors found that low-income
incidence generally follows the unemployment rate; with an obvious exception in the mid-1990s
where the low-income rate kept climbing as unemployment fell (2005, p. 16).
Data, Variables, and Methodology
Data for this project was acquired primarily from Statistics Canada’s CANSIM tables.
Employment, labour forces, populations, median incomes, low-income rates, participation rates,

The Minimum Wage 19
GDP, average social assistance, child tax benefits, employment insurance benefits,
unemployment rates, and inflation rates were all gained directly from these tables. HRSDC’s
minimum wage database was the source for the federal, provincial, and territorial minimum
wages in Canada since 1965.
Dependant Variables
A central dependent variable in this study is employment rates from 1987 to 2007. All
measures of employment are a ratio of employment in a group of workers to some subsection of
the labour force. The size of the labour force depends on whether both sexes, women, men, those
between ages 15 and 24, 25 to 54, or 15 to 64 are being studied. The broadest measure of
employment used in this study is the ratio of all employed workers each year in each province to
the labour force between ages 15 and 64 from 1987 to 2007.
A more focused measure of employment pertaining to the lowest wage earners was also
used in this study. The sum of those employed in the nine lowest paying occupations (Table 1)
was divided by the labour force between ages 15 and 64 in each province from 1987 to 2007.
This variable was also broken down by sex and type of worker.
The different effects that the minimum wage has on youth and adults was found by
measuring the ratio of those employed in the four NAICS occupations that employ the most
minimum wage workers (agriculture, trade, retail trade, accommodation and food services) to the
labour force from 1987 to 2007. This measure was broken down by sex and ages 15 to 24, and 25
to 54. The nine NOC-S occupations only had data divided by age and sex from 1997 to 2007, and
so they were substituted for the four NAICS occupations in regressions involving different age
groups.

The Minimum Wage 20
Several regressions involving the nine NOC-S or the four NAICS occupations had issues
with data suppression. Statistics Canada suppresses Labour Force Survey data in order to
maintain respondent confidentiality if it does not project that there will be a sufficient amount of
employees in a particular occupation (Statistics Canada, No date f). For example, in Prince
Edward Island if the Labour Force Survey finds that there are less than two hundred employees
working in a particular occupation in a given year, then that data is suppressed. In Ontario,
Québec, Alberta, and British Columbia fifteen hundred employees are needed to ensure data
availability. Newfoundland and Labrador, Nova Scotia, New Brunswick, Manitoba, and
Saskatchewan require five hundred (Statistics Canada, 2008, No date f). For the purposes of this
study, two different regressions were performed when data was suppressed. Maximum possible
values were substituted for suppressed data in the first regression. That is, for Prince Edward
Island, all suppressed data was denoted as two hundred, in the four most populous provinces they
were denoted as fifteen hundred and the remaining provinces had suppressed values denoted as
five hundred. The subsequent regression had all suppressed values given a value of zero. Exact
estimates are therefore not available for regressions using suppressed data, but a range that the
estimates will fall into is presented. The author is more confident in the estimates that used
maximum values since it is more likely that the number of actual respondents was closer to the
maximum values than zero. For example, in Alberta it is probably more likely that there were
between 750 and 1499 male childcare and home support workers in 2005 than zero, since in the
following year Alberta had 1700 male childcare and home support workers (Statistics Canada,
No date f).
An alternative perspective to measuring employment was given by including the average
weekly hours worked by members of the labour force as an independent variable. This was a

The Minimum Wage 21
similar study to Michel (1999) which focused on hours worked by minimum wage employees
rather than the amount of people employed. Average weekly hours worked by each member of
the labour force was calculated by summing the products of the average weekly hours worked by
employees in each NOC-S occupation as found by the Labour Force Survey by the number of
employed persons in that occupation, and then dividing that sum by the labour force aged 15 to
64. This procedure was done for all occupations and the nine NOC-S occupations for both sexes.
Breakdowns by each sex were also included, but men had childcare and home support workers
dropped from the nine occupations while women excluded trades helpers, occupations unique to
primary industry, and machine operators. These occupations were dropped because of the data
withholding issues mentioned above. Withheld values were not replaced with maximum or
minimum values as was done in previous regressions because this would introduce an even wider
range for estimates to fall into, since the dependent variable is a product of the number of
employees by the average hours worked over the labour force rather than just the number of
employees over the labour force.
Provincial participation rates from 1987 to 2007 are another dependent variable in this
study. NDP MP Peggy Nash claimed while introducing her private member’s bill on the federal
minimum wage that, “It (the minimum wage) increases labour market participation.” (Canada.
House of Commons, February 20, 2007, p. 7032). Christofides et al. found evidence to support
this statement when they found that higher wage rates provided a significant incentive for single
men, single women, and lone mothers to re-enter the labour force (1997, p. 610). However,
participation rates may decrease when the minimum wage is raised if a significant
disemployment effect is created, which could discourage even more people from trying to find a
job. Participation rates were measured in the usual fashion by Statistics Canada and were broken

The Minimum Wage 22
down into age and sex groups. Age breakdowns were from 15 to 19, 20 to 24, 25 and up, and 15
to 64.
Low-income rates were included as a proxy variable for poverty rates. A proxy variable
for poverty rates was required because, as previously discussed, there is significant ambiguity
that surrounds the term “poverty line”. Low-income incidence for all families, families with a
male head or major earner under 65, families with a female head or major earner under 65, and
families with the family head 24 years of age or less were measured for the years of 1987 to 2006.
Independent Variables
The principal independent variable of this project is the minimum wage. The minimum
wage was defined as the average minimum wage each year in each province adjusted for inflation
by the CPI to 2002 dollars. Two other measures of the minimum wage were also included. One
other measure was the percent difference between the minimum wage and the median hourly
family income for all family types. The median hourly family income was calculated by dividing
the median family income adjusted for inflation to 2002 dollars by 2000 hours per year (40 hours
per week, 50 weeks per year). Comparing the minimum wage to the median hourly wage reflects
the tendency for workers, as emphasized by Tobin, to be “more concerned with relative than
absolute real wages” (1972, p. 2).
Another measure of the minimum wage is the percent difference between the minimum
wage and the hourly wage needed for a single adult to earn the MBM requirements for a
province’s largest city. The hourly wage needed to earn the MBM was calculated by dividing the
MBM for a reference family by two and adjusting to 2002 dollars, and then divided by 2000
hours per year. This measure will be especially interesting for regressions concerning low-income

The Minimum Wage 23
rates since it involves a direct comparison between what a worker must earn to achieve the MBM
income level, which is a measure of poverty, and the minimum wage. For the two alternative
measures of the minimum wage, a negative percent difference means that the minimum wage is
less than its comparison, while a positive percent difference means that the minimum wage is the
greater of the two.
Another variable that may have a greater effect on employment, participation, and low-
income rates than the minimum wage is the average government transfer payments to recipients,
all adjusted to 2002 dollars. This is not only an attempt to determine whether government
benefits create employment disincentives to potential employees, but also to monitor the extent of
their poverty mitigating abilities. The main government transfer included is the natural logarithm
of the average social assistance benefits. Another included government transfer is the average
child tax benefits paid per recipient. The natural logarithm of this variable may be especially
important to the employment decisions and incomes of females, who are the heads of 80% of
single parent families (Bergman, 2007). A final government transfer that will only be included in
low-income regressions is the average employment insurance (EI) benefits paid to individuals. EI
will not be included in employment or participation rate regressions since EI benefits are based
upon employment during the previous 52 weeks. Employment and participation data is annual
and EI benefits last less than a year, therefore someone receiving EI benefits would have had to
work either sometime during the year before receiving benefits or after benefits expire, and so the
level of EI benefits would not make a difference in employment and participation rates (Service
Canada, 2009). Other government transfers such as GST and HST credits, and provincial and
territorial tax credits were excluded since they usually only amounted to a few hundred dollars
and raised significant issues with withheld data (Statistics Canada, No date b).

The Minimum Wage 24
The variable that may have the greatest influence on employment, participation, or low-
income rates is the natural logarithm of GDP per capita, adjusted to 2002 dollars. When an
economy is going through a recession it is characterized by declining output, reduced
employment and participation rates, and increasing low-income incidence. A recovering
economy has increasing output, employment and participation rates which should then reduce the
amount of people in low-income (McConnell et al., 2005a, p. 131). Cyclical fluctuations in the
economy, as approximated by a rising or falling GDP per capita, is probably the principal
determinant of the dependent variables.
Another independent variable that may be useful while studying low-income rates is the
natural logarithm of the median income for all families in a province, adjusted to 2006 dollars.
This variable was included for two reasons: one is that it is better than GDP per capita at
measuring the actual income received by a family rather than just measuring the output of a
province. If families are receiving, on average, more income then low-income rates should
decrease. The second is that the percent difference between the hourly minimum wage and the
median hourly family income might be large not because the minimum wage is so low but rather
because the median family income is so high.
A final independent variable included in this report is the unemployment rate.
Unemployment rates will only be included in regressions focusing on low-income rates. They are
not included when studying employment and poverty rates since if the unemployment rate is
increasing then the employment and participation rates are most certainly decreasing, which
makes this variable uninteresting to include in those regressions. Picot and Myles found that
unemployment and low-income rates tend to closely follow each other, except during the mid-
1990s when low-income rates were rising as unemployment rates fell (Picot and Myles, 2005, p.

The Minimum Wage 25
16-17; Figure 1). This general trend may mean that unemployment rates are a major determinant
of low-income rates in Canada.
See Table 4 for a summary of the data used in this report.
Methodology
An Arellano and Bond estimator was used for all regressions. This estimator is a type of
dynamic panel model that permits lagged values of the dependent variable to be used as right-
hand side variables, all the while still controlling for fixed effects (Arellano and Bond, 1991 as
cited in Baltagi, 2005, pp. 136, 137). One lag of the dependent variable was included for each
regression to allow for delayed responses in the dependent variables. A generic example of the
Arellano and Bond model for this report resembles:
yi,t = α1yi,t-1 + xβ + ai + ui,t
The models for the employment regressions included the independent variables of a
year’s lag of the dependent variable, a measure of the minimum wage along with a year’s lag of
that measure, and the natural logarithms of social assistance, child tax benefit, and GDP per
capita. Regressions were performed three times: once with each definition of the minimum wage.
The employment model resembles the following:
Employmentx,i,t/Labour Forcex,i,t=β0 + α1Employmentx,i,t-1/Labour Forcex,i,t-1 + β1minimumWagex,i,t + β2minimumWagex,i,t-1 + β3ln(socialAssistancei,t) + β4ln(childTaxBenefiti,t)
+ β5ln(GDPi,t/Populationi,t) + ai + ui,t
Models with participation rates as the dependent variable almost mirrored the
employment models:
Participationx,i,t=β0 + α1Participationx,i,t-1 + β1minimumWagex,i,t + β2ln(socialAssistancei,t) + β3ln(childTaxBenefiti,t) + β4ln(GDPi,t/Populationi,t) + ai + ui,t

The Minimum Wage 26
However, lags of previous minimum wages were not included in participation regressions
because previous levels of the minimum wage should have no influence on present decisions to
participate in the labour force. Deciding to participate in the labour force should depend upon the
present’s and not the past’s possible earnings. Regressions were again performed for each
definition of the minimum wage.
For low-income rate regressions, the independent variables that were included in the
participation regression were used but also included were the additional regressors of the natural
logarithms of average EI benefits and median family incomes, and the unemployment rate. The
model was:
LowIncomex,i,t=β0 + α1LowIncomex,i,t-1 + β1minimumWagex,i,t + β2ln(socialAssistancei,t) + β3ln(childTaxBenefiti,t) + β4 ln(EI) + β5ln(GDPi,t/Populationi,t) + β6ln(medianIncomei,t) +
β7UnemploymentRatex,i,t + ai + ui,t
Past values of the minimum wage were not considered since many minimum wage earners spend
most of their incomes and cannot afford to have savings. Therefore, even if minimum wages were
high in the past, all earnings would be spent by the next year and so only the present minimum
wage would have any effect on present low-income levels. Regressions with the regressand of
low-income levels for families with a head of household 24 years of age and under involved
minor changes in the regressors: one used the unemployment rate for 15 to 24 year olds and
another used the unemployment rate for all ages. This was done to determine whether it is the
overall unemployment rate or the unemployment rate only for 15 to 24 year olds that matters for
low-income levels in this age group.

The Minimum Wage 27
Results
The results are divided into six sections. The first section’s results are from regressions
involving employment in all occupations. These occupations are then broken down by sex and
type of worker to determine how the minimum wage affects different workers. Following that is
the results for regressions focusing on the nine lowest paying occupations. These, too, were
broken down by sex and type of worker. The third section presents the results of the regressions
involving the four NAICS occupations. The final employment section pertains to the regressions
focusing on hours worked by members of the labour force. Following the employment results are
the results for the participation rates. Participation rates were also broken down by age and sex.
The results section of this report closes with low-income rate regressions.
Employment: All Occupations
The ratio of employment in all occupations to the labour force between ages 15 and 64
was negatively correlated with the minimum wage, especially in the short run (Table 5). However,
as will be seen throughout the results, one year’s lag of the minimum wage had a positive and
statistically significant coefficient. This may mean that there are excessive immediate firings or
layoffs after the minimum wage is raised but over time hirings and replacements occur which
result in a smaller long run than short run elasticity. The overall employment to labour force ratio
had a short run elasticity from the minimum wage of about -0.04, but after a year the elasticity
diminished to -0.0026. The short run elasticity for the percent difference between the minimum
wage and the median hourly wage was also very small at -0.0018, but a year’s lag for this
variable was not significant at the 90% significance level. GDP per capita was the most
economically and statistically significant variable with a coefficient of approximately 0.3 in each

The Minimum Wage 28
regression, which yields an elasticity of about 0.34. Government transfers were not statistically
significant determinants of overall employment.
Past levels of employment are very strong indicators of the present. As seen in Table 5,
with all else held equal the employment to labour force ratio will be about 55% of its level in the
previous year.
Tables 6 and 7 show the results for the regressions with the ratio of employment in all
occupations for male and female workers to the male and female labour forces between ages 15
and 64 as the dependent variable. Men have a greater coefficient on the lagged value for the
dependant variable, possibly meaning that male employment is more stable than female. The
percent difference between the minimum wage and the median hourly wage was slightly negative
for both men and women, but the other measures of the minimum wage had a positive influence
on male employment but they were statistically insignificant for women.
Not surprisingly, the social assistance and child tax benefits are more important to women
than men. Government benefits, especially the child tax benefit, had a great influence on
women’s employment with elasticities of around -0.05 and -1.23 for social assistance and the
child tax benefit respectively. The extra few thousand dollars of income required to support a
child rather than the larger social assistance benefits are very important to some mothers’
employment decisions. Women also seemed to be more susceptible to job losses than men when
the economy starts to decline.
There is considerable discrepancy between the determinants of employment for full and
part time workers (Tables 8 and 9). Notably, there is more consistency in the level of part time
employment than full time, signified by the larger coefficient for a year’s lag of part time

The Minimum Wage 29
employment. Another opposite effect for the two types of work is the impact of the minimum
wage. Full time occupations have a short term negative elasticity of around 0.07 for the minimum
wage itself, but in the longer run the elasticity diminishes to about -0.028. The percent difference
between the minimum wage and the median hourly wage had a short term elasticity of
approximately -0.05 and lacked a statistically significant lagged value. For part time employment,
only the minimum wage relative to the median hourly wage had a statistically significant
relationship at the 90% significance level but this relationship was actually positive. A small
positive impact on part time employment as full time employment decreases may represent that
some employees are not necessarily laid off after the minimum wage increases, but rather that
their hours are cut below 30 hours per week.
Full and part time occupations also differed in their relationship with GDP per capita.
GDP per capita had an elasticity of about 0.42 for full time employment, making it a far more
influential factor of employment than the minimum wage. Part time employment, on the other
hand, had a statistically insignificant relationship with GDP per capita. Child tax benefits also
were a significant determinant of full time employment, with a coefficient of about -0.13. As
average child tax benefits increase, parents can afford to cut down their working hours and spend
more time with their families. Alternatively, higher child tax benefits could persuade some to not
work full time and thus not earn the higher incomes which could disqualify them from receiving
child tax benefits. No form of government assistance had a statistically significant relationship
with part time employment.
Based on the lagged coefficient of the dependent variable, female full time employment
appears to be more stable than men’s (Tables 10 and 11). However, the minimum wage had
approximate short term elasticities of -0.075 for women as compared to -0.05 for men. No lags

The Minimum Wage 30
for any definition of the minimum wage for either sex were statistically significant. Men were
also more dependent than women on the state of the economy to determine whether they found
full time employment.
Minimum wages were not a significant influence of male part time employment at the
90% significance level, but they may have a positive effect on women’s (Table 12 and 13). This
seems to run contrary to the findings of McKee and West (1984) who found that minimum wages
disproportionately affect part time workers (as cited in Gunderson, 2005, pp. 36, 37). Indeed, the
elasticity for the percent difference between the minimum wage and the median hourly wage is -
0.15 for women’s part time employment.
Surprisingly, male part time employees were more prone to be influenced by social
assistance and child tax benefits than women. Since there is no relationship between government
benefits and male full time employment and there is a negative and significant relationship
between part time employment and government benefits, this may mean that some men choose
unemployment over part time employment if they have dependents. Women, on the other hand,
still seem to choose part time employment over just government benefits as a means of
supporting their families.
Employment: Nine Occupations
For employees in the nine lowest paying occupations there is an immediate negative
influence on employment after the minimum wage is increased, with a short term elasticity
around -0.092 (Table 14). Surprisingly for these low paying occupations, the elasticity becomes a
positive 0.03 after a year. On top of this, the two other minimum wage measures both have
positive long run elasticities. Predictably, employment in these nine occupations has a more

The Minimum Wage 31
pronounced negative relationship with social assistance payments than did all occupations. These
occupations are also more pro-cyclical too, with GDP per capita having the greatest elasticity of
all the variables at approximately 1.05, while social assistance had a statistically significant
elasticity of almost -0.2.
There are differences between the influences of men’s and women’s employment in these
nine occupations (Tables 15 and 16). In the short run, men’s employment has a negative reaction
to minimum wage increases, but in the long run this relationship becomes positive. Women,
however, do not have a statistically significant relationship between any measure of the minimum
wage and employment in these nine occupations. Males display some sensitivity to changes in
GDP per capita, but females are even more reactive to economic fluctuations and government
transfers. Also, as denoted by the year lags of the dependent variable, there is more stability in
these nine jobs for males than females. This can probably be attributed to higher stability in the
occupations that are heavily male dominated and lower stability in female-centric jobs.
Full and part time workers also react differently to the minimum wage in these nine
occupations (Tables 17 and 18). The immediate negative elasticity of -0.17 caused by the
minimum wage for both sexes’ full time employment is eventually offset for a long run elasticity
of about -0.018. For part time employment in these jobs, there is an immediate positive impact
for both sexes, and a year’s lag of the minimum wage is statistically insignificant at the 90%
significance level for all definitions of the minimum wage. Part time employees also have a more
statistically and economically significant relationship with social assistance benefits than full
time workers, possibly because government benefits can yield higher incomes than what could be
earned working part time for the minimum wage.

The Minimum Wage 32
The short run impact of the minimum wage on male full time employment in these nine
occupations is quite uncertain based on these results (Table 19). Only for the percent difference
between the minimum wage and the hourly MBM income are both the maximum and minimum
estimates of employment significant at the 90% significance level, while only the minimum
values of the real minimum wage are significant at this level, too. There is more certainty in the
long run, with the lagged values of both the real minimum wage and the MBM measure being
positive and significant at over the 99% significance level. GDP per capita has a significant and
positive relationship with male full time employment, the opposite of its relationship with part
time (Tables 19 and 20). Part time male employment may also have (at low levels of significance)
a negative relationship with the natural logarithm of GDP per capita. This would certainly not
mean that part time workers are laid off as an economy expands, but rather that their hours are
increased to 30 hours or more per week. Government transfers have no statistically significant
relationship with male full time employment, but social assistance benefits do have a negative
relationship with male part time employment that is significant between the 90 and 95 percent
significance levels. To a less significant degree, child tax benefits have the same effect on male
part time employment.
Minimum wages have opposite impacts on female full and part time employment within
the nine jobs (Tables 21 and 22). The elasticity of the minimum wage for female full time
employment in these nine jobs is around -0.19, while part time employment has a positive
elasticity of about 0.22. This may mean that some women working in these nine occupations have
their hours cut below 30 hours per week after minimum wage is increased. Lags for any
definition of the minimum wage are not statistically significant to women. Higher child tax
benefits and a shrinking economy also decrease female full time employment in these jobs, while

The Minimum Wage 33
part time employment tends to be more so influenced by social assistance benefits, but not at a
level of significance greater than 95%.
Age Comparisons
Switching from the nine NOC-S occupations to the four NAICS occupations,
comparisons could be made between youth and adult workers. The most striking initial finding
about the employment of youths between ages 15 and 24 is the small coefficient on the lag of the
dependent variable (Table 23). This small coefficient demonstrates that young adult and teen
employment is very dynamic and unstable. However, the minimum wage did not have a
statistically significant relationship with this measure of employment at the 90% significance
level, while social assistance benefits were the only statistically significant independent variable.
Teens and young adults may not be the actual recipients of social assistance themselves, but if
their parents or relatives are receiving high levels of social assistance benefits then dependents
are less obliged to seek employment. This may be the case since about 74% of those aged 15 to
24 live with their parents or another relative (Statistics Canada, 2009).
Adults between ages 25 and 54 (Table 24) employed in the four NAICS occupations
behave in a different fashion. There is considerably more stability in these occupations when
compared with their younger co-workers, but no other independent variables are significant at the
90% significance level. The differences in employment stability could mean that young workers
are not substituted for older workers because of minimum wage increases, but any sort of shock
or change that occurs in these industries will likely result in young workers bearing the brunt of
its effects, while older workers are more likely to continue being employed.

The Minimum Wage 34
A degree of ambiguity still exists about the determinants of young adult employment for
either sex in the four NAICS occupations (Tables 25 and 26). The level of stability in these
occupations is about the same for both men and women, while the minimum wage is not
statistically significant in any case. Young males’ employment in these occupations is more
dependent on social assistance benefits than females’, while females are possibly more influenced
by levels of child tax benefits. Child tax benefits, however, lacked consistent statistical
significance for females.
As seen in Tables 27 and 28, older (especially male) adults employed in the four NAICS
occupations exercise more stability in employment than their younger counterparts. Men may
actually be more inclined to be employed in these occupations after the minimum wage increases,
but women’s employment is still largely uninfluenced by the minimum wage. Women’s
employment has a more statistically and economically significant relationship with GDP per
capita than men’s.
Hours Worked
Average weekly hours worked per member of the labour force tends to decrease as the
minimum wage increases (Tables 29-31). For all occupations, there is an immediate downturn in
hours worked as the minimum wage is raised, but after a year this effect is mostly offset. There
are other, greater determinates of weekly hours worked, especially GDP per capita and child tax
benefits.
Men, a year after the minimum wage is increased, may actually be working more hours
than before but women are definitely working less. Weekly hours worked by males tends to be

The Minimum Wage 35
more pro-cyclical than female’s, but women’s hours are heavily influenced by government
benefits.
Surprisingly for the nine occupations, minimum wages have a long term positive effect on
average weekly hours (Tables 32-34). As seen in Table 33, this effect may be largely driven by
males who, after an increase in the minimum wage, certainly are working more hours in the long
run in their eight occupations while women are working fewer hours in their six occupations. Not
surprisingly for these low-wage occupations, social assistance benefits are an important factor
when deciding how many hours to work. Men’s hours of employment in these nine occupations
seem to be even more reliant upon social assistance benefits than women’s, but women are more
sensitive to child tax benefits. Men’s hours are also very pro cyclical with an average elasticity of
about 1.1 for GDP per capita, while there is not a statistically significant relationship between
GDP per capita and weekly hours worked by women employed in the six occupations.
Participation
The results do not signal a significant positive relationship between the participation rate
and the minimum wage, contrary to the statements made by former MP Peggy Nash (Canada.
House of Commons, February 20, 2007, p. 7032; Table 35). The largest influence of overall
participation is GDP per capita, which had an approximate elasticity of 0.9. Males are actually
negatively influenced by increases in the minimum wage, while women who do not seem to be
significantly influenced by the minimum wage at all (Tables 36 and 37). Men’s participation is
susceptible to changes in the state of the economy and their participation is unresponsive to
government transfers. Women, on the other hand, are significantly affected by the level of social
assistance payments and to a lesser extent, the state of the economy.

The Minimum Wage 36
Higher minimum wages create the most severe disincentives to participate in the labour
force among the youngest workers, especially of the male variety (Table 38-40). Teenage males
are more reactive to social assistance benefits than teenage women, but teenage women are more
heavily influenced by child tax benefits. Child tax benefits may be significant for females since
more females are single parents than males, even at a young age. Overall, teens are the most
susceptible to make their participation decisions based on the state of the economy.
As teenagers become young adults the participation situation changes slightly (Tables 41-
43). The minimum wage is no longer a significant determinant for 20 to 24 year olds’ overall
participation but it still is a significant deterrent for male participation at the 90% significance
level. This age group is less responsive to fluctuations in GDP per capita than teenagers, but the
coefficients of GDP per capita are still large and significant in all situations. Unlike teenagers,
women are now more reactive to changes in GDP per capita than men. None of the regressions
involving young adults yielded statistical significance for the government benefit variables.
For adults over age 25, participation stabilizes as seen by the large coefficient for lagged
values of the participation rate (Tables 44-46). As workers age, a year’s lag of the dependant
variable becomes larger, representing that workers are more inclined to consistently participate in
the labour force, probably because older workers generally have more stable employment than
younger ones. The minimum wage is no longer a significant deterrent or incentive for either sex
to participate in the labour force while the state of the economy has become a less significant but
still important indicator of participation. For older women, higher social assistance benefits
become a significant deterrent to participate in the labour force.

The Minimum Wage 37
Low-Income
Low-income abatement is a hotly contested point when it comes to minimum wage
discussions. The results with low-income rates for all family types as the regressand (Table 47)
solidify the statement by Neumark and Wascher that, “the minimum wage is a relatively
ineffective social policy for aiding the poor” (2008, p. 249). Indeed, the results in Tables 47 to 51
show that minimum wages are not in any way significant to low-income reduction. What does
seem to be important for overall low-income rates is the prevalence of low-income in the
previous year. The lagged values of the dependant variable show that there is a persistent level of
low-income in Canada, which may partially consist of people with disabilities (Hatfield, 2003 as
cited in Picot and Myles, 2005, p. 25). Surprisingly, although Figure 2 demonstrates a connection
between the unemployment rate and the low-income rate, the unemployment rate was not
significant at the 90% significance level. However, there is definitely a correlation between the
natural logarithm of the median income and the low-income level for all families in a province,
since this variable had an elasticity of almost -8, possibly demonstrating that a rising tide raises
all ships.
As expected, there are differences between the determinants of low-income in households
with male or female heads or major earners. As shown in Tables 48 and 49, households with a
male head under 65 tend to have less persistent low-income incidence than households with
female heads, which may indicate that there are more opportunities for men to escape poverty.
More women than men acting as single parents may also create this trend. Social assistance
programs also are more effective in reducing male than female low-income rates. Women’s low-
income has a much more pro-cyclical relationship with low-income rates, but overall the greatest

The Minimum Wage 38
reducer of low-income rates was the median income which has an elasticity around -10 for both
sexes.
Low-income rates for households with a head or major earner less than or equal to 24
years of age have the least persistent poverty of any age group (Tables 50 and 51). New
opportunities are always developing for youths as they age, notably in the form of work
experiences and pay raises which may lift a family with a relatively young head out of poverty. It
was also interesting to note that the unemployment rate for those between ages 15 and 24 was not
statistically significant but the unemployment rate for all ages was. The unemployment rate for
those aged 15 to 24 may be insignificant since it represents the unemployment of youths who live
independently and youths who live with parents or relatives. Since 74% of those between 15 and
24 live with parents or relatives, unemployment rates for this age group may not be heavily
associated with low-income rates for households with a head or major earner under 24 (Statistics
Canada, 2009). Another possible explanation for the insignificance of youth unemployment rates
and the significance of overall unemployment rates is that household heads in this age group
could receive substantial financial contributions from parents or relatives. If the unemployment
rate for all ages increases, parents and relatives may have less means to support youths that have
recently moved out and so the low-income rates for youths increases.
Employment insurance benefits were also significant at the 90% significance level, but
had the opposite impact than expected. This could mean that there are instances where youths or
their supportive parents work for a period of time and then seek EI. EI benefits are presently only
worth 55% of previous earnings, a level of income which could leave many below the low-
income threshold (Service Canada, 2009). Therefore, EI benefits may create disincentives to

The Minimum Wage 39
work the full year for these young adults or their relatives, and after seeking EI benefit their
incomes are below the LICO.
Conclusion and Explanations
Employment
As demonstrated by the results, the minimum wage does appear to have an overall
disemployment effect throughout the economy, but this effect is quite small and has possibly
been excessively emphasized in the past. It was consistently found that a small initial decrease in
employment created by raising the minimum wage would be largely offset after a year. Although
only 4.1% of the workforce earns the minimum wage, these disemployment effects may seep to
other sectors of the economy that are not directly affected by the minimum wage. Wage
negotiations occurring after minimum wages increase can spread disemployment outside of the
minimum wage realm if other wages go up by an even greater proportion than the minimum
wage. This is best exemplified in Brazil where up to 20% of employees receive wage increases as
a multiple of the minimum wage (Lemos, 2003 as cited in Eyraud and Saget, 2004, pp. 62, 63).
The actual effects of the minimum wage are complicated further as employment is broken
down by sex and type of worker. As minimum wages rise, the results found that there is a
tendency for minimum wage workers to have their hours cut below 30 hours per week. For all
occupations, females are mostly unresponsive to the minimum wage, but more males may
actually be working after the minimum wage is raised.
One of the more surprising results of this project was that the minimum wage had a
positive employment effect in the long run for the nine occupations, but for all occupations it had
a long run negative impact. This could be caused by minimum wage paying entry level jobs in

The Minimum Wage 40
otherwise well paying occupations that are still classified as an occupation paying wages, on
average, far above the median. Another possible explanation is that the lower paying occupations
become more appealing to potential employees once the minimum wage is raised, and so there is
more employment in the lower paying occupations than before.
Although there is a slight employment gain in the nine lowest paying occupations as the
minimum wage increases, these gains are primarily made by males, while women and full time
workers face most of the job losses. This could mean that male dominated industries paying low
wages are less inclined to lay off workers as minimum wages increase, but some largely female
occupations such as clerical work or childcare may face higher layoffs as minimum wages rise.
The results also do not indicate a systemic firing of younger workers as the minimum
wage increases. Lagged values of youth employment in the four NAICS occupations were very
small, indicating that there is significant fluidity in this age group’s employment that may not be
correlated with the minimum wage. The substitution of adult labour for youth labour is not based
solely upon minimum wages increases, but this substitution is caused by all sorts of shocks and
occurrences in an industry.
Average weekly hours worked by members of the labour force gave another interesting
insight into the repercussions of the minimum wage. The real minimum wage and its one year lag
were statistically significant but it only had a long term elasticity of about -0.015 for all
occupations. This small elasticity mirrors the findings of Michl (1999), where a 17% increase in
the minimum wage caused a 5% decrease in hours worked by teenage fast food employees in
New Jersey. An overall decrease in working hours may mean more people switch from full to
The Minimum Wage 41
part time status as the minimum wage increases, which was a prominent trend especially in the
nine lowest paying occupations.
A possible explanation for the tendency of short term disemployment to be largely offset
in the longer run as minimum wages increase is proposed by Figure 3. This figure models the
labour market with frictions. Hansen (1970) proposed including frictions alongside the supply
and demand curves, stating that “actual employment is never on the supply curve, or the demand
curve, but, let us assume, to the left of both the demand and supply curve” (p. 6). These curves
represent the ever present frictions that exist in the labour market since it takes time for
employees to move from job to job and for employers to fill vacancies. These frictions never
become infinitely small (Hansen, 1970, p. 6). Frictions diminish as time passes, represented by
the shift from the short run (SR) to the long run (LR) friction curves. The equilibrium price for
labour in this market is PA with the corresponding quantity demanded of QA found along the long
run frictions curve. However, as argued by Shapiro and Stiglitz (1984) price PA*, which is
slightly above the original equilibrium, PA, is the equilibrium price in reality, and so QA* units of
labour are demanded at the real equilibrium (as cited in Akerlof and Shiller, 2009, p. 104). PA* is
the equilibrium price rather than PA since the equilibrium wage, PA*, will always be above the
wage that yields close to zero unemployment, PA. This occurs in order to encourage workers to
give effort while at work. If wages were at the level that yields zero unemployment, workers
would shirk while working knowing that if they are fired they can immediately find another job,
since there is zero unemployment. Paying slightly higher wages causes some unemployment to
develop and so encourages workers to give effort while working (Shapiro and Stiglitz, 1984 as
cited in Akerlof and Shiller, 2009, p. 104). As a minimum wage is implemented, in the short run
the price of labour will move from PA* to PB and the quantity demanded will move from QA* to

The Minimum Wage 42
QB. Workers will then see that higher minimum wages increased the opportunity cost of not
working, and as frictions to diminish over time the quantity of labour purchased in the market
will move towards QC. As mirrored in the results for this paper, the initial quantity demanded will
be greater than the long run quantity demanded after a minimum wage is implemented, but this
quantity will be greater than the intermediate quantity demanded, therefore QA*>QC>QB.
There is a slightly different explanation for the effects of the minimum wage on full time
employment. The results of this project indicate that there is a tendency for employers to cut
workers’ hours and demand less full time employees as minimum wages increase. In Figure 4, if
the minimum wage were to increase the demand curve for full time labour would shift backwards
from D0 to D1. Equilibrium prices and quantities will move from the original point (QA*,PA*) to
(QB,PB). Once again, as frictions diminish in the long run, the new long run equilibrium quantity
demanded at PB will be QC, with QA*>QC>QB.
The demand for part time employment shifts in the opposite direction of full time as
minimum wages grow. Employers are inclined to offer more part time employment when the
price of labour is forced to move from PA* to PB. The quantity of part time labour demanded
increases as the demand curve, D0, shifts outwards to D1. In the part time labour market there is
no long run frictions curve since there tends to be an ever-present level of turnover in part time
employment, largely because the opportunity cost of not taking a part time job is lower than that
of a full time job and so employees would move more freely in and out of the market as their
financial and family circumstances change. After a minimum wage is implemented, the quantity
of part time labour demanded moves from QA* to QB.

The Minimum Wage 43
The principal finding in the results is that the minimum wage is not the greatest
determinant of employment in an economy and its influence may be highly overrated. Although
weekly hours worked may decrease and some employees may be laid off as the minimum wage
increases, other factors like GDP per capita and government benefits were consistently more
significant (both economically and statistically) for determining employment in low paying and
all occupations.
Participation
Overall, participation rates are largely uninfluenced by the minimum wage. It was
originally thought that higher minimum wages will encourage more people to participate in the
labour market since the opportunity cost of not finding a job would increase as the minimum
wage increased. However, higher minimum wages cause a slight disemployment effect which
could increase the number of discouraged workers. Young men are not as inclined to join the
labour force when the minimum wage is higher, while women of any age are uninfluenced by the
minimum wage when deciding whether to participate in the labour force.
Other factors than the minimum wage were the greatest determinants of participation rates
and its fluctuations. Unsurprisingly, the state of the economy was the most important indicator of
whether someone joined the labour force.
One conclusion that may be drawn from employment and participation regressions is that
there is no systemic abuse of the government benefits programs. Social assistance and child tax
benefits decreased employment in some circumstances, especially within the lowest paying
occupations, but only women between ages 15 and 64 and women aged 25 and over had a
negative and statistically significant relationship between social assistance benefits and

The Minimum Wage 44
participation rates. Some women may choose to not participate in the labour force out of
necessity and not to abuse the system, simply because their families would receive less income if
they worked for the minimum wage. Overall though, people may choose to not work based on
government benefits that could be received, but they still are looking for work and participating
in the labour force.
Low-Incomes
Finally the minimum wage proved to be an ineffective piece of social policy for reducing
low-income levels. However, it would be ludicrous to think that many families could be brought
out of poverty if the minimum wage were to increase simply because wages are paid to
individuals and do not take into account the size of a family or its financial needs. Teenagers
living with relatives without dependents and single mothers with two children hardly have the
same financial needs and so would require drastically different wages to enjoy similarly
comfortable existences. A minimum wage that is a few dollars higher will not be an effective
means of bringing a single earner with dependents out of poverty. Only those who were
previously marginally below the poverty line could possibly be brought above it after a minimum
wage increase. Benjamin et al. explained that a minimum wage cannot significantly decrease
poverty largely because there is a weak correlation between low-income and low-wages
(Benjamin et al., 2007, p. 229).
Other variables seemed to be much more effective policy options for poverty reduction.
The median income of a province had the greatest influence on low income rates of all the
independent variables, but higher social assistance benefits, lower unemployment and a higher

The Minimum Wage 45
GDP are other avenues that are more worthwhile exploring than minimum wages in the field of
poverty reduction.
Policy Implications
The NDP still continues to support the reintroduction of the federal minimum wage.
Reinstating the federal minimum wage is not so much about raising the wages of the 0.1% of
employees that earn it, but rather to use it as a precedent for the other provinces to follow. This
strategy was effective in the past where from 1965 to the mid-1980s the federal minimum wage
was generally higher than any province’s, but the provinces usually matched the federal level
soon thereafter (HRSDC, 2009). However, from the mid-1980s until the federal minimum wage
was essentially abolished in 1996, the federal minimum wage suffered from a lack of political
will to increase it as inflation rose and so it languished away to irrelevance. If the NDP were to
bring back the federal minimum wage it is unlikely that it will have any great influence outside of
the political arena. When the bill to reinstate the federal minimum wage was introduced in
February 2007, the highest minimum wage in a Canadian province was $8.00 per hour in Ontario.
In the August 2009, Ontario once again had the highest minimum wage at $9.50 per hour. By
July 2010, the minimum wages of both Newfoundland and Labrador and Ontario will be at least
$10.00 per hour and the other provinces will surely be following suit in the near future (HRSDC,
2009). This renders the NDP’s usage of the federal minimum wage as a signal essentially useless
since the most populous province has already almost achieved the desired level and the other
provinces will increase theirs soon too, lest their governments be viewed as socially irresponsible.
The NDP also claimed that it will keep the federal minimum wage indexed to inflation if
it was reinstated, but in the two years since its own bill was first read the NDP has failed to keep

The Minimum Wage 46
its proposed new federal minimum wage from already declining in real terms (New Democratic
Party of Canada, 2009). All minimum wages should be indexed to some measure of inflation.
Card and Krueger opposed indexing the minimum wage to the CPI, since this measure tends to
rise faster than the wages of many occupations that pay wages above the minimum wage (1995,
pp. 394, 395). Some employers may also be more influenced by changes in the GDP deflator than
the CPI. Therefore, in the interest of finding a balance between employers and employees (which
is quite popular among those setting minimum wages), some sort of weighted average of the two
measures of inflation may be ideal for annual increases (or even decreases) of the minimum wage.
This would make minimum wage increases more predictable and they would also not be as
influenced by political meddling, benefitting both employers and employees.
The results of this project seem to indicate that the minimum wage is unimportant, but a
higher minimum wage may still have many benefits that are impossible to quantify. It would
instill feelings of self worth into many employees and shows them that their labours are valued
by the rest of society. Paying higher minimum wages may also increase worker productivity and
decrease turnover, increasing firms’ profits as demonstrated by Ford Motor Co. in the early 20th
century (Raff and Summers, 1987). Wages are also not paid merely to make an employee come
to work but instead to give effort and show enthusiasm while there. Paying minimum wage
workers a fair wage will create benefits in the form of workplace morale and better motivation
(Akerlof and Shiller, 2009, pp. 98, 99)
A relatively high minimum wage in comparison to other incomes would have benefits to
minimum wage workers in a society where everyone is always “trying to keep up with the
Joneses”. Minimum wage earners will achieve similar levels of consumption as their peers if their
wages are relatively higher. Indeed, Adam Smith noted that people need not only essentials to

The Minimum Wage 47
live and enjoy life but instead they require similar goods and services as their neighbours, saying,
“By necessities I understand, not only the commodities necessary for the support of life, but
whatever the country renders it indecent for credible people, even of the lowest order, to be
without” (Smith, 1776 as cited in Waltman, 2004, p. 20).
However, in terms of having an effect on employment, participation, and low-income
rates, the minimum wage may not be of much value. For many low-income earners with little
education or skill, the employment opportunities afforded at the minimum wage are sometimes
insufficient to replace social assistance or other government transfers as a form of income (Battle,
2003, pp. 27-32). One possible solution to this problem would be for the social assistance system
to play a more active role in the lives of more working poor. A major drawback to the social
assistance system is the dollar-for-dollar deduction of social assistance payments as earnings rise
above the earnings exemption level, essentially a 100% tax rate. In many of Canada’s provinces,
the level of exempt earnings only amounts to, at most, a few hundred dollars per month (National
Council of Welfare, 2008, pp. 32, 33). Christofides et al. found that a more gradual deduction of
social assistance benefits from private incomes may actually increase labour force participation
and employment (1997, p. 609-611). Topping up wages with government subsidies tailored to
family circumstances, as seen in the UK, may be another policy option for governments to
explore (Guardian, 1998 as cited in Baker and Tippin, 1999, p. 202). This policy could be altered
in Canada to keep the minimum wage at a low but dignified level, but to increase via social
assistance the incomes of those actually needing additional income, such as single parents.
Author Joseph Heath supports actions such as these saying, “Often it is better to give people
money (typically through the tax system) than to fiddle around with the wage that they’re paid.”
(2009, p. 230). A measure similar to the above approach is the followed by the Working Income

The Minimum Wage 48
Tax Benefit (WITB), introduced in Canada in 2009. Although the WITB may seem like a paltry
sum, only amounting to at most a $1044 annual tax credit for families in most Canadian
provinces compared with the £2.40 per hour wage top-up for a single mother in the UK in 1998,
it is a first step in the right direction for getting extra income to the working poor that reflects
their financial circumstances. This tax credit requires candidates to make incomes in the
workforce and fall into an income bracket between $3,000 and $13,403 for single people and
$3,000 and $22,105 for a family (CRA, 2009). Further pursuit of strategies such as this by
governments will result in the minimum wage not being a blunt instrument for poverty reduction,
alleviate employers from bearing the burden of poverty reduction, and could decrease the stigma
associated with receiving government benefits.
Although reinstating the federal minimum wage will hardly have any positive influences
on Canadians, abolishing minimum wages would be a mistake. Removing the minimum wage
could (although unlikely) bring about a return of Dickensian workhouse conditions or create an
economy where some workers are paid embarrassingly low wages. Indeed, although the
minimum wage has its defects, it is still one policy option of many for improving the social and
economic well being of Canada’s provinces.

The Minimum Wage 49
References and Works Cited
Akerlof, George A., & Shiller, Robert J. (2009). Animal spirits: How human psychology drives
the economy, and why it matters for global capitalism. Princeton, NJ: Princeton
University Press.
Baker, Maureen, & Tippin, David. (1999). Poverty, social assistance, and the employability of
mothers: Restructuring the welfare states. Toronto: University of Toronto Press.
Baker, Michael, Benjamin, Dwayne, & Stranger, Shuchita. (1999). The highs and lows of the
minimum wage effect: A time-series cross-section study of the Canadian law. Journal of
Labor Economics, 17(2), 318-350.
Baltagi, Badi H. (2005). Econometric analysis of panel data, (3rd ed.). Chichester, UK: John
Wiley & Sons, Ltd.
Battle, Ken. (2003). Minimum wages in Canada: A statistical portrait with policy implications.
Ottawa, ON: Caledon Institute of Social Policy.
Benjamin, Dwayne, Gunderson, Morley, & Lemieux, Thomas. (2007). Labour market economics
(6th ed.). Toronto: McGraw-Hill Ryerson.
Bergman, Mike. (2007). Single-parent households showed little variation since 1994, census
bureau reports. Retrieved July 15, 2009 from U.S. Census Bureau Web site:
http://www.census.gov/Press-
Release/www/releases/archives/families_households/009842.html.
Black, Errol, & Shaw, Lisa. (1998). The case for a strong minimum wage policy. Winnipeg, MB:
Canadian Centre for Policy Alternatives.

The Minimum Wage 50
Canada. House of Commons. (2007). House of Commons debates (Hansard). Retrieved January
30, 2009 from http://www2.parl.gc.ca/content/hoc/House/391/Debates/114/HAN114-
E.PDF.
Canada Revenue Agency. (2009). Working income tax benefit (WITB). Retrieved August 24,
2009 from Canada Revenue Agency Web site: http://www.cra-arc.gc.ca/bnfts/wtb/menu-
eng.html.
Card, David, & Krueger, Alan B. (1995). Myth and measurement: The new economics of the
minimum wage. Princeton, NJ: Princeton University Press.
Card, David, & Robins, Philip K. (1996). Do financial incentives encourage welfare recipients to
work? Initial 18-month findings from the self-sufficiency project. Vancouver, BC: The
Social Research and Demonstration Corporation.
Christofides, Louis N., Stengos, Thanasis, & Swidinsky, Robert. (1997). Welfare participation
and labor market behaviour in Canada. The Canadian Journal of Economics/Revue
canadienne d'Economique, 30(3), 595-621.
Cunningham, Wendy. (2007). Minimum wages and social policy: Lessons from developing
countries. Washington, DC: The World Bank.
Eyraud, François, & Saget, Catherine. (2005). The fundamentals of minimum wage fixing.
Geneva, Switzerland: International Labour Office.
Fellegi, Ivan P. (2005). On poverty and low income. Retrieved June 3, 2009 from Statistics
Canada Web site: http://www.statcan.gc.ca/pub/13f0027x/13f0027x1999001-eng.htm.

The Minimum Wage 51
Frank, Robert H. (2007). Falling behind: How rising inequality harms the middle class. Berkeley,
CA: University of California Press.
Goldberg, Michael, & Green, David. (1999). Raising the floor: The social and economic benefits
of minimum wages in Canada. Vancouver: Canadian Centre for Policy Alternatives.
Green, David, & Harrison, Kathryn. (2006). Racing to the middle: Minimum wage setting and
standards of fairness. Vancouver, BC: University of British Columbia.
Gunderson, Morley. (2005). Minimum wage in Canada: Theory, evidence and social policy.
Ottawa: Canada: Human Resources and Skills Development Canada.
Hamermesh, Daniel S. (1993). Labor demand. Princeton, NJ: Princeton University Press.
Hansen, Bent. (1970). Excess demand, unemployment, vacancies and wages. The Quarterly
Journal of Economics, 84(1), 1-23.
Heath, Joseph. (2009). Filthy lucre: Economics for people who hate capitalism. Toronto:
HarperCollins Publishers Ltd.
Human Resources and Skills Development Canada. (2009). Hourly minimum wages in Canada
for adult workers. Retrieved January 30, 2009 from Human Resources and Skills
Development Canada Web site: http://srv116.services.gc.ca/dimt-wid/sm-
mw/rpt2.aspx?dec=1.
Human Resources and Skills Development Canada. (2008). Low income in Canada: 2000-2006
using the market basket measure. Retrieved June 3, 2009 from Human Resources and
Skills Development Canada Web site:

The Minimum Wage 52
http://www.hrsdc.gc.ca/eng/publications_resources/research/categories/inclusion/2008/sp-
864-10-2008/page01.shtml.
Human Resources Development Canada. (2003). Understanding the 2000 low income statistics
based on the market basket measure. Hull, PQ: Applied Research Branch, Strategic
Policy, Human Resources Development Canada.
Lemieux, Thomas, & Milligan, Kevin. (2006). Incentive effects of social assistance: A regression
discontinuity approach. Analytical Studies Branch. Research Paper Series. Catalogue no.
11F0019MIE2006280. Ottawa, ON: Statistics Canada.
Luce, Stephanie. (2004). Fighting for a living wage. Ithica, NY: Cornell University Press.
MacRae, Peter H. (1974). Social assistance and work effort. Fredericton, NB: The Council of
Maritime Premiers and the Economic Council of Canada.
McConnell, Campbell R., Brue, Stanley L., & Barbiero, Thomas P. (2005a). Macroeconomics,
(10th Canadian ed.). Toronto: McGraw-Hill Ryerson.
McConnell, Campbell R., Brue, Stanley L., & Barbiero, Thomas P. (2005b). Microeconomics,
(10th Canadian ed.). Toronto: McGraw-Hill Ryerson.
Michl, Thomas. (1999). Can rescheduling explain the New Jersey minimum wage study? (JLEI
Working Paper 271). Hamilton, NY: The Jerome Levy Economics Institute.
Moffitt, Robert. (2002). Welfare programs and labor supply (NBER Working Paper 9168).
Cambridge, MA: National Bureau of Economic Research.

The Minimum Wage 53
National Council of Welfare. (2008). Welfare incomes, 2006 and 2007. Ottawa, ON: National
Council of Welfare.
Neumark, David, & Wascher, William L. (2008). Minimum wages. Cambridge, MA: The MIT
Press.
New Democratic Party of Canada. (2009). NDP platform. Retrieved June 22, 2009 from New
Democratic Party of Canada Web site:
http://www.ndp.ca/platform/jobsandaffordability/employmentstandards.
Picot, Garnett, & Myles, John. (2005). Income inequality and low income in Canada: An
international perspective. Analytical Studies Branch. Research Paper Series. Catalogue
no. 11F0019MIE2005240. Ottawa, ON: Statistics Canada.
Prasch, Robert E. (1996). In defense of the minimum wage. Journal of Economic Issues, 30(2),
391-397.
Raff, Daniel M.G., & Summers, Lawrence H. (1987). Did Henry Ford pay efficiency wages?.
Journal of Labor Economics, 5(4, Part 2), S57-S86.
Schenk, Christopher. (2001). From poverty wages to a living wage. Toronto: The CSJ Foundation
for Research and Education, & The Ontario Federation of Labour.
Service Canada. (2009). Employment insurance (EI). Retrieved July 18 from Service Canada
Web site: http://www.servicecanada.gc.ca/eng/ei/menu/eihome.shtml.
Statistics Canada. (2009). "Table CD2T03an Labour force estimates by economic
family status, age group, sex, Canada, province, annual average" (table).

The Minimum Wage 54
Labour Force Historical Review 2008 (R). CD2. Statistics Canada Catalogue no.
714F0004XCB. CD-ROM.
Statistics Canada. (No date a). Table 051-0001 Estimates of population, by age group and sex for
July 1, Canada, provinces and territories, annual (persons unless otherwise noted) (table).
CANSIM (database). Using E-STAT (distributor). Last updated July 2007.
http://estat.statcan.gc.ca/cgi-win/CNSMCGI.EXE (accessed June 2, 2009).
Statistics Canada. (No date b). Table 202-0407 Income of individuals, by sex, age group, and
income source, 2006 constant dollars, annual (table). CANSIM (database). Using E-
STAT (distributor). Last updated July 2008. http://estat.statcan.gc.ca/cgi-
win/CNSMCGI.EXE (accessed June 2, 2009).
Statistics Canada. (No date c). Table 202-0702 Market income, government transfers, total
income, income tax and after-tax income, by economic family type, 2006 constant dollars,
annual (table). CANSIM (database). Using E-STAT (distributor). Last updated July 2008.
http://estat.statcan.gc.ca/cgi-win/CNSMCGI.EXE (accessed June 2, 2009).
Statistics Canada. (No date d). Table 202-0803 Families in low-income before and after tax, by
age and sex of major income earner, annual (table). CANSIM (database). Using E-STAT
(distributor). Last updated July 2008. http://estat.statcan.gc.ca/cgi-win/CNSMCGI.EXE
(accessed June 2, 2009).
Statistics Canada. (No date e). Table 282-0002 Labour force survey estimates (LFS), by sex and
detailed age group, annual (persons unless otherwise noted) (table). CANSIM (database).
Using E-STAT (distributor). Last updated July 2008. http://estat.statcan.gc.ca/cgi-
win/CNSMCGI.EXE (accessed June 2, 2009).

The Minimum Wage 55
Statistics Canada. (No date f). Table 282-0010 Labour force survey estimates (LFS), by National
Occupation Classification for Statistics (NOC-S) and sex, annual (persons unless
otherwise noted) (table). CANSIM (database). Using E-STAT (distributor). Last updated
July 2008. http://estat.statcan.gc.ca/cgi-win/CNSMCGI.EXE (accessed June 2, 2009).
Statistics Canada. (No date g). Table 282-0026 Labour force survey estimates (LFS), by actual
hours worked, class of worker, National Occupation Classification for Statistics (NOC-S)
and sex, annual (persons unless otherwise noted) (table). CANSIM (database). Using E-
STAT (distributor). Last updated July 2008. http://estat.statcan.gc.ca/cgi-
win/CNSMCGI.EXE (accessed June 2, 2009).
Statistics Canada. (No date h). Table 282-0070 Labour force survey estimates (LFS), wages of
employees by type of work, National Occupations Classification for Statistics (NOC-S),
sex and age group (persons unless otherwise noted) (table). CANSIM (database). Using
E-STAT (distributor). Last updated July 2008. http://estat.statcan.gc.ca/cgi-
win/CNSMCGI.EXE (accessed June 1, 2009).
Statistics Canada. (No date i). Table 326-0021 Consumer Price Index (CPI) 2005 basket, annual
(table). CANSIM (database). Using E-STAT (distributor). Last updated July 2008.
http://estat.statcan.gc.ca/cgi-win/CNSMCGI.EXE (accessed June 2, 2009).
Statistics Canada. (No date j). Table 383-0022 Multifactor productivity, gross output, value-
added, capital, labour and intermediate inputs at a detailed industry level, by North
American Industry Classification System (NAICS), annual (index 2002=100 unless
otherwise noted) (table). CANSIM (database). Using E-STAT (distributor). Last updated
July 2008. http://estat.statcan.gc.ca/cgi-win/CNSMCGI.EXE (accessed June 2, 2009).
The Minimum Wage 56
Statistics Canada. (No date k). Table 384-0002 Gross domestic product (GDP), expenditure-
based provincial economic accounts, annual (dollars) (table). CANSIM (database). Using
E-STAT (distributor). Last updated July 2008. http://estat.statcan.gc.ca/cgi-
win/CNSMCGI.EXE (accessed June 2, 2009).
Sussman, Deborah, & Tabi, Martin. (2004). Minimum Wage Workers. Perspectives on Labour
and Income, 5(3), 5-14.
The Canadian Chamber of Commerce. (2005). Canada Labour Code Part III review: Developing
a labour code for a competitive economy. Ottawa, ON: The Canadian Chamber of
Commerce.
Tobin, James. (1972). Inflation and unemployment. The American Economic Review, 62(1/2), 1-
18.
Waltman, Jerold L. (2004). The case for the living wage. New York: Algora Publishing.

The Minimum Wage 57
Appendix
Figure 1: Low Income and Unemployment in Canada, 1980-2002
Survey of Consumer Finances, Survey of Labour and Income Dynamics, and the Labour Force Survey as cited in Picot and Myles, 2005, p. 17.

The Minimum Wage 58
Figure 2: Real Provincial Minimum Wages, 1987-2007

The Minimum Wage 59
Figure 3: Supply and demand for labour
Pric
e
P
A P
A*
PB
QB QC QA*QA
LR SR
D0
S0
Quantity

The Minimum Wage 60
Figure 4: Supply and demand for full time labour
QB QC QA*
Pric
e
P
A*
P
B
D1D0
S0 LR0
LR1
SR1
Quantity

The Minimum Wage 61
Figure 5: Supply and demand for part time labour
Pric
e P A
*
P
B
SR0
QA* QB
D0
D1
S0
SR1
Quantity
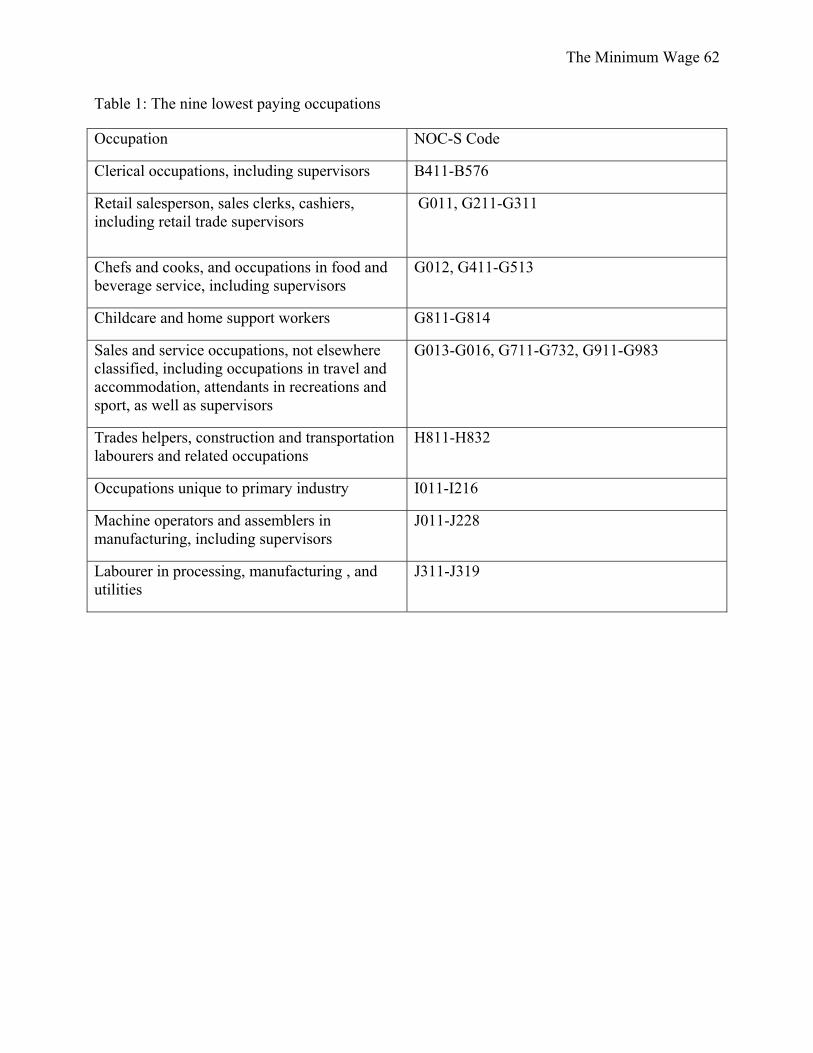
The Minimum Wage 62
Table 1: The nine lowest paying occupations
Occupation NOC-S Code
Clerical occupations, including supervisors B411-B576
Retail salesperson, sales clerks, cashiers, including retail trade supervisors
G011, G211-G311
Chefs and cooks, and occupations in food and beverage service, including supervisors
G012, G411-G513
Childcare and home support workers G811-G814
Sales and service occupations, not elsewhere classified, including occupations in travel and accommodation, attendants in recreations and sport, as well as supervisors
G013-G016, G711-G732, G911-G983
Trades helpers, construction and transportation labourers and related occupations
H811-H832
Occupations unique to primary industry I011-I216
Machine operators and assemblers in manufacturing, including supervisors
J011-J228
Labourer in processing, manufacturing , and utilities
J311-J319

The Minimum Wage 63
Table 2: The nine occupations and their breakdown by sex
Occupation Percent Men Percent Women
All occupations 53 47
Nine occupations 45 55
Clerical occupations, including supervisors
29 71
Retail salesperson, sales clerks, cashiers, including retail trade supervisors
32 68
Chefs and cooks, and occupations in food and beverage service, including supervisors
39 61
Childcare and home support workers
7 93
Sales and service occupations, not elsewhere classified, including occupations in travel and accommodation, attendants in recreations and sport, as well as supervisors:
44 56
Trades helpers, construction and transportation labourers and related occupations
88 12
Occupations unique to primary industry
82 18
Machine operators and assemblers in manufacturing, including supervisors
71 29
Labourer in processing, manufacturing , and utilities
58 42

The Minimum Wage 64
Table 3: The nine occupations and their breakdown by type of worker
Occupation Percent Full Time Percent Part Time
All occupations 82 18
Nine occupations 73 27
Clerical occupations, including supervisors
83 17
Retail salesperson, sales clerks, cashiers, including retail trade supervisors
54 46
Chefs and cooks, and occupations in food and beverage service, including supervisors
58 42
Childcare and home support workers
60 40
Sales and service occupations, not elsewhere classified, including occupations in travel and accommodation, attendants in recreations and sport, as well as supervisors:
60 40
Trades helpers, construction and transportation labourers and related occupations
88 12
Occupations unique to primary industry
87 13
Machine operators and assemblers in manufacturing, including supervisors
96 4
Labourer in processing, manufacturing , and utilities
91 9

The Minimum Wage 65
Table 4: Summary of the data
Variable Name Number of Observations
Mean* Standard* Deviation
Minimum * Maximum*
Employment, All occupations/Labour Force, 15-64
210 .916842 .0431844 .8034826 .9926805
Employment, All Male Occupations/Male Labour Force, 15-64
210 .9167698 .0473357 .7940252 1.002973
Employment, All Female Occupations/Female Labour Force, 15-64
210 .9167765 .0391993 .8105561 .9813796
Full time employment/Labour Force, both sexes, 15-64
210 .7499898 .0292065 .67868 .8311996
Full time male employment/Male Labour force
210 .8228046 .03941 .7083333 .9097781
Full time female employment/Female
Labour force
210 .6634084 .0288419 .6074458 .7382774
Part time employment/labour force, both sexes
210 .1668747 .0246288 .0998697 .223617
Part time employment/labour force, male
210 .0939562 .015249 .0531682 .1302911

The Minimum Wage 66
Part time employment/labour force, female
210 .2533636 .0378552 .1633508 .3383388
9 Occupations/Lf, both sexes both times
210 .4094905 .0311981 .3548253 .4942966
9 Occupations/Lf, Male both times
210 .3621338,
.3609284
.039556,
.0392858
.3068862,
.3068095
.4729159,
.4729159
9 Occupations/Lf, Female Both times
210 .4662172,
.4655566
.0273766,
.0275708
.4014575,
.4014575
.5354746,
.5354746
9 Jobs/lf full time, both sexes
210 .3041564 .0234436 .2591829 .3655738
9 jobs/lf full time, male
210 .3020465,
.300404
.0323594,
.0320673
.2447969,
.2434217
.3830031,
.3810976
9 jobs/lf full time, female
210 .3080917,
.3068654
.0232161,
.0228264
.2543728,
.2543728
.3674242,
.3631436
9 jobs/lf part time, both sexes
210 .1058995,
.1045703
.0158603,
.016285
.0664351,
.0664351
.153617,
.1523628
9 jobs/lf part time, male
210 .0647683,
.0576044
.0116109,
.0123997
.0415771,
.0215134
.1035826,
.0977414
9 jobs/lf part time, female
210 .1631572,
.1556441
.0215907,
.0235677
.1204188,
.104712
.2238734,
.2166826
4 jobs/lf, 15-24 both sexes
210 .6041059,
.6030456
.0417169,
.0429812
.4576271,
.4482109
.704642,
.704642
4 jobs/lf, 25-54 both sexes
210 .2981536 .0339031 .2427958 .4262091

The Minimum Wage 67
4 jobs/lf, 15-24 male
210 .5618497,
.5595883
.0422902,
.044249
.4379562,
.419708
.6721992,
.6721992
4 jobs/lf, 25-54 male
210 .2774113,
.2773138
.0464864,
.0466041
.1861167,
.1861167
.4395604,
.4395604
4 jobs/lf 15-24 female
210 .655283,
.6473815
.0593104,
.0618068
.4939271,
.4736842
.8428571,
.8142857
4 jobs/lf, 25-54 210 .3231678,
.3225553
.0301606,
.0298847
.2614679,
.2614679
.4086643,
.4086643
All jobs, both sexes, hours
210 33.07648 1.532622 29.22293 37.62759
All jobs, male, hours
210 36.15954 1.962234 31.5393 41.34625
All jobs, females, hours
210 29.69253 1.218702 26.42413 33.41959
9 jobs, both sexes, hours
210 14.02767 1.23176 11.90225 17.3691
8 jobs, male, hours 210 13.77592 1.756595 10.89575 18.8
6 jobs, female, hours
210 13.23922 .8931706 11.41335 15.22015
Participation, both sexes, 15-19
210 52.1119 8.366606 23.6 65.2
Participation, both sexes, 20-24
210 77.73333 5.117322 59.5 84.5
Participation, both sexes, 25+
210 64.84667 4.312773 54 74.5
Participation, both sexes, 15-64
210 75.10762 5.172707 59.4 82.5

The Minimum Wage 68
Participation, male, 15-19
210 52.70333 8.536314 25.8 66.1
Participation, male, 20-24
210 80.89524 5.406993 63.3 89.8
Participation, male, 25+
210 73.12619 4.492027 61.5 83.2
Participation, male, 15-64
210 81.32619 4.994459 65.6 88.2
Participation, female, 15-19
210 51.46667 8.569889 21.8 64.1
Participation, female, 20-24
210 74.4819 5.216743 54.4 83
Participation, female, 25+
210 56.98333 4.839407 44.5 67.2
Participation, female, 15-64
210 68.88857 5.895117 50.7 77.6
Low income rates, all ages
200 15.8795 3.155967 8.5 24.8
Low income rates, male head under 65
200 12.324 2.657917 6.2 20
Low income rates, female head under 65
200 27.3215 5.137829 11.5 38.4
Low income rates, head 24 or under
200 47.6805 8.4437 21.4 71.6
Minimum Wage 210 6.318078 .6371628 5.337079 8
Percent Difference, Minimum Wage and Median Wage
200 -87.55558 12.37313 -119.1919 -60.40419

The Minimum Wage 69
Percent Difference, Minimum Wage and MBM
210 -3.364924 10.31799 -29.67025 21.65509
Ln(Average Social Assistance Payments)
200 8.648385 .3097714 7.600903 9.071078
Ln(Average Child Tax Benefit Payments)
200 7.61353 .2625584 7.090077 8.34284
Ln(Average EI Benefit Payments)
200 8.678222 .1739119 8.34284 9.047821
Unemployment rate, all ages
200 9.896 3.755261 3.4 20.1
Unemployment rate, ages 15-24
200 15.6135 4.794014 6.8 30.8
Ln(GDP per capita) 210 10.29233 .2292045 9.813859 10.90668
Ln(Median Income) 200 10.38003 .1832427 9.925247 10.80452
* If more than one value is given for a variable, this represents the maximum and minimum possible values used for the variable.

The Minimum Wage 70
Table 5: Independent variable: Ratio of employment for both sexes, both types of work in all occupations to the labour force aged 15-64
Lag of Independent .5609576*** (.0604226)
.5371274*** (.0620575)
.5629281*** (.0604079)
MinWage -.0060619*** (.002215)
--- ---
LagMinWage .0056855*** (0.0021206)
--- ---
DiffMedian --- -.0002578** (.0001063)
---
lagDiffMedian --- .0001572 (.0001001)
---
DiffMBM --- --- -.0003776*** (.0001408)
lagDiffMBM --- --- .0003422** (.0001347)
lnSA -.0026741 (.0019747)
-.002901 (.0019957)
-.0027385 (.0019757)
lnCTB -.0073368 (.0058295)
-.0054617 (.0059014)
-.0073707 (.0058243)
lnGDP .0300349*** (.0095528)
.027032*** (.0095881)
.0299638*** (.0095121)
Constant .000401 (.0003234)
.0003969 (.000322)
.0004036 (.0003234)
Time dummies Yes Yes Yes * Statistical significance at the 90% level ** Statistical significance at the 95% level *** Statistical significance at the 99% level () Standard error

The Minimum Wage 71
Table 6: Independent variable: Ratio of employment for males, both types of work in all occupations to the male labour force aged 15-64
Lag of Independent .5772033*** (.0616721)
.5706705*** (.064983)
.5797128*** (.0617395)
MinWage -.0086563*** (.0029734)
--- ---
LagMinWage .0090792*** (.0028291)
--- ---
DiffMedian --- -.0002742* (.0001474)
---
lagDiffMedian --- .0002665* (.0001367)
---
DiffMBM --- --- -.0005303*** (.0001892)
lagDiffMBM --- --- .0005402*** (.0001799)
lnSA -.0007468 (.0026234)
-.0010925 (.0026892)
-.0008651 (.0026301)
lnCTB -.0028116 (.0077893)
-.0011792 (.0080622)
-.0027868 (.0077966)
lnGDP .0278312** (.0127992)
.023907* (.0131763)
.0275591** (.0127639)
Constant -.000077 (.0004185)
-.0001223 (.0004237)
-.000072 (.0004194)
Time dummies Yes Yes Yes * Statistical significance at the 90% level ** Statistical significance at the 95% level *** Statistical significance at the 99% level () Standard error

The Minimum Wage 72
Table 7: Independent variable: Ratio of employment for females, both types of work in all occupations to the female labour force aged 15-64
Lag of Independent .4702462*** (.0723798)
.4327183*** (.0721183)
.4730949*** (.072339)
MinWage -.0031265 (.0025541)
--- ---
LagMinWage .0007335 (.0024359)
--- ---
DiffMedian --- -.0002299* (.0001186)
---
lagDiffMedian --- -.0000222 (.0001125)
---
DiffMBM --- --- -.000202 (.0001626)
lagDiffMBM --- --- .0000469 (.0001549)
lnSA -.0047949** (.0023533)
-.0051749** (.002322)
-.0048092** (.0023552)
lnCTB -.0147525** (.0067624)
-.0126076* (.0066632)
-.0149956** (.0067659)
lnGDP .0330259*** (.0114866)
.0336122*** (.01125)
.033486*** (.011479)
Constant .0012635*** (.0003807)
.0012544*** (.0003683)
.0012584*** (.0003809)
Time dummies Yes Yes Yes * Statistical significance at the 90% level ** Statistical significance at the 95% level *** Statistical significance at the 99% level () Standard error

The Minimum Wage 73
Table 8: Independent variable: Ratio of employment for both sexes, full time work in all occupations to the labour force aged 15-64
Lag of Independent .71343*** (.0491881)
.6806708*** (.0514896)
.7137919*** (.0489611)
MinWage -.0083495*** (.0027176)
--- ---
LagMinWage .005019* (.0026398)
--- ---
DiffMedian --- -.0004206*** (.0001285)
---
lagDiffMedian --- .000129 (.0001235)
---
DiffMBM --- --- -.0005442*** (.0001721)
lagDiffMBM --- --- .0003096* (.0001669)
lnSA -.0024539 (.0024466)
-.0022824 (.0024288)
-.0025385 (.0024432)
lnCTB -.017383** (.0070141)
-.014004** (.0070258)
-.0177051** (.0069963)
lnGDP .0389195*** (.0119433)
.0346168*** (.0118496)
.0394516*** (.0118716)
Constant .0003941 (.0003618)
.0003023 (.0003521)
.0004073 (0.260)
Time dummies Yes Yes Yes * Statistical significance at the 90% level ** Statistical significance at the 95% level *** Statistical significance at the 99% level () Standard error

The Minimum Wage 74
Table 9: Independent variable: Ratio of employment for both sexes, part time work in all occupations to the labour force aged 15-64
Lag of Independent .7864758*** (.0531222)
.7632111*** (.0540524)
.7882136*** (.052948)
MinWage .002651 (.0020912)
--- ---
LagMinWage -.0004756 (.0020829)
--- ---
DiffMedian --- .0002454** (.0000963)
---
lagDiffMedian --- -.0000327 (.0000955)
---
DiffMBM --- --- .0001851 (.0001324)
lagDiffMBM --- --- -.0000422 (.0001316)
lnSA -.0025052 (.0019549)
-.002826 (.0019124)
-.0024531 (.0019556)
lnCTB .0075383 (.0054167)
.0053105 (.0053675)
.0078137 (.0054028)
lnGDP -.0037066 (.0089898)
-.0021018 (.0088672)
-.0041491 (.0089505)
Constant -.000296 (.0002864)
-.000204 (.0002777)
-.0003043 (.0002867)
Time dummies Yes Yes Yes * Statistical significance at the 90% level ** Statistical significance at the 95% level *** Statistical significance at the 99% level () Standard error

The Minimum Wage 75
Table 10: Independent variable: Ratio of employment for males, full time work in all occupations to the male labour force aged 15-64
Lag of Independent .6073757*** (.0608995)
.578146*** (.0639332)
.6072674*** (.0608612)
MinWage -.0069383** (.0035152)
--- ---
LagMinWage .0055953 (.0034037)
--- ---
DiffMedian --- -.0002846* (.0001709)
---
lagDiffMedian --- .0001018 (.0001618)
---
DiffMBM --- --- -.0004266* (.0002235)
lagDiffMBM --- --- .0003171 (.0002162)
lnSA .0033876 (.0032591)
.002951 (.00325)
.003237 (.0032615)
lnCTB -.013132 (.0094987)
-.0116561 (.009569)
-.0132988 (.0094995)
lnGDP .0456294*** (.0154122)
.0431885*** (.0154034)
.045571*** (.0153467)
Constant -.0004914 (.000485)
-.0005296 (.000476)
-.0004757 (.0004856)
Time dummies Yes Yes Yes * Statistical significance at the 90% level ** Statistical significance at the 95% level *** Statistical significance at the 99% level () Standard error

The Minimum Wage 76
Table 11: Independent variable: Ratio of employment for females, full time work in all occupations to the female labour force aged 15-64
Lag of Independent .7017111*** (.0589607)
.6729376*** (.0589374)
.7042387*** (.0586063)
MinWage -.0078926* (.0042817)
--- ---
LagMinWage .0041692 (.0041033)
--- ---
DiffMedian --- -.0006043*** (.000195)
---
lagDiffMedian --- .0001728 (.0001864)
---
DiffMBM --- --- -.0005486** (.000271)
lagDiffMBM --- --- .000303 (.000259)
lnSA -.0067774* (.0037266)
-.0049535 (.0036204)
-.0068089* (.0037196)
lnCTB -.0173036 (.0108122)
-.0120963 (.0105874)
-.0179464* (.0107885)
lnGDP .0409877** (.0191293)
.0323216* (.0186754)
.0420547** (.018994)
Constant .0012353** (.000567)
.0012056** (.0005365)
.0012435** (.0005667)
Time dummies Yes Yes Yes * Statistical significance at the 90% level ** Statistical significance at the 95% level *** Statistical significance at the 99% level () Standard error

The Minimum Wage 77
Table 12: Independent variable: Ratio of employment for males, part time work in all occupations to the male labour force aged 15-64
Lag of Independent .6047047*** (.0673464)
.5709022*** (.0685983)
.6074683*** (.0672219)
MinWage -.0013908 (.0020865)
--- ---
LagMinWage .0029485 (.0020252)
--- ---
DiffMedian --- .0000559 (.0000964)
---
lagDiffMedian --- .0001471 (.0000927)
---
DiffMBM --- --- -.0000906 (.0001327)
lagDiffMBM --- --- .000187 (.0001279)
lnSA -.0034743* (.0019106)
-.0033569* (.0018848)
-.0034507* (.0019137)
lnCTB .0127559** (.0053773)
.0114306** (.005358)
.0128354** (.0053767)
lnGDP -.0132989 (.0086128)
-.0125074 (.0085319)
-.0135818 (.0085854)
Constant .0001902 (.0002774)
.0002189 (.0002699)
.000191 (.000278)
Time dummies Yes Yes Yes * Statistical significance at the 90% level ** Statistical significance at the 95% level *** Statistical significance at the 99% level () Standard error

The Minimum Wage 78
Table 13: Independent variable: Ratio of employment for females, part time work in all occupations to the female labour force aged 15-64
Lag of Independent .6670488*** (.0658617)
.6457494*** (.0659327)
.6692073*** (.0656335)
MinWage .0056341 (.0037586)
--- ---
LagMinWage -.0009425 (.0035981)
--- ---
DiffMedian --- .0004303** (.0001682)
---
lagDiffMedian --- -.0000684 (.0001628)
---
DiffMBM --- --- .000399* (.0002365)
lagDiffMBM --- --- -.000086 (.0002266)
lnSA -.0034442 (.0032614)
-.0038629 (.0031821)
-.0034097 (.003259)
lnCTB .0053037 (.0092799)
.0016083 (.0091925)
.0058791 (.0092448)
lnGDP -.0015896 (.0157428)
.0030874 (.0154819)
-.0027074 (.0156564)
Constant -.0007447 (.0004851)
-.0006267 (.0004659)
-.0007572 (.0004851)
Time dummies Yes Yes Yes * Statistical significance at the 90% level ** Statistical significance at the 95% level *** Statistical significance at the 99% level () Standard error
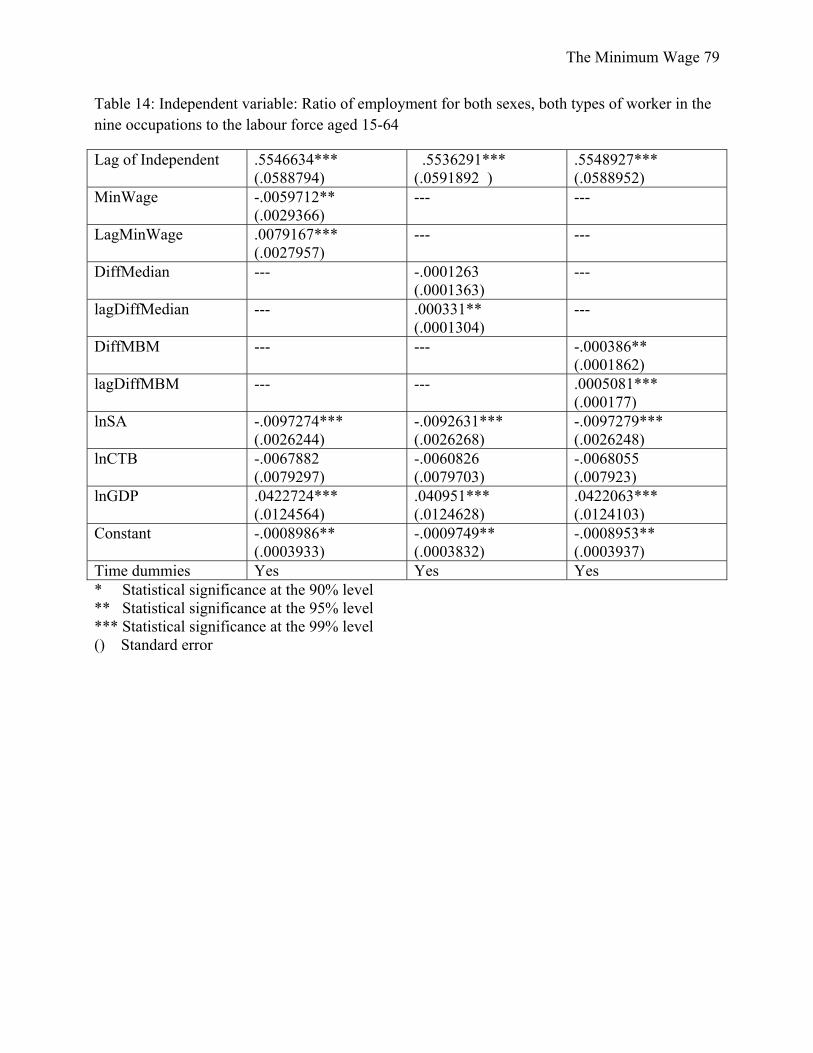
The Minimum Wage 79
Table 14: Independent variable: Ratio of employment for both sexes, both types of worker in the nine occupations to the labour force aged 15-64
Lag of Independent .5546634*** (.0588794)
.5536291*** (.0591892 )
.5548927*** (.0588952)
MinWage -.0059712** (.0029366)
--- ---
LagMinWage .0079167*** (.0027957)
--- ---
DiffMedian --- -.0001263 (.0001363)
---
lagDiffMedian --- .000331** (.0001304)
---
DiffMBM --- --- -.000386** (.0001862)
lagDiffMBM --- --- .0005081*** (.000177)
lnSA -.0097274*** (.0026244)
-.0092631*** (.0026268)
-.0097279*** (.0026248)
lnCTB -.0067882 (.0079297)
-.0060826 (.0079703)
-.0068055 (.007923)
lnGDP .0422724*** (.0124564)
.040951*** (.0124628)
.0422063*** (.0124103)
Constant -.0008986** (.0003933)
-.0009749** (.0003832)
-.0008953** (.0003937)
Time dummies Yes Yes Yes * Statistical significance at the 90% level ** Statistical significance at the 95% level *** Statistical significance at the 99% level () Standard error

The Minimum Wage 80
Table 15: Independent variable: Ratio of employment for males, both types of work in the nine occupations to the male labour force aged 15-64
Lag of Independent
.5052251*** (.063019)
.5449772*** (.0613508)
.5207407*** (.0654097)
.5589217*** (.0641981)
.5084936*** (.063059)
.5469106*** (.0614214)
MinWage -.0078973** (.0032942)
-.0077331** (.0032222)
--- --- --- ---
LagMin Wage
.0120802*** (.0030781)
.012406*** (.0030543)
--- --- --- ---
DiffMedian
--- --- .0000287 (.0001569)
.0000603 (.0001539)
--- ---
lagDiff Median
--- --- .0003044** (.0001466)
.0002993** (.0001459)
--- ---
Diff MBM
--- --- --- --- -.0005182** (.0002083)
-.0005148** (.0002038)
lagDiff MBM
--- --- --- --- .0007829*** (.0001943)
.0008133*** (.0001929)
lnSA -.0087742*** (.0029037)
-.0077855*** (.0028136)
-.0081052*** (.0029725)
-.0072869** (.0028913)
-.00871*** (.0029037)
-.0077684*** (.0028103)
lnCTB .0037211 (.0083771)
.0017085 (.0082328)
.0035712 (.0087586)
.0009144 (.0086479)
.0039332 (.0083453)
.0017964 (.0082001)
lnGDP .0404714*** (.0136163)
.0453602*** (.0453602)
.0389677*** (.0140916)
.044536*** (.0142062)
.0400506*** (.0135171)
.045093*** (.0134976)
Constant -.0014123*** (.0004298)
-.0014837*** (.0004286)
-.0014593*** (.0004308)
-.0015132*** (.000432)
-.0014089*** (.0004302)
-.0014784*** (.0004284)
Time dummies
Yes Yes Yes Yes Yes Yes
† Note: Leftmost values for the same independent variables are for the maximum values of the dependent variable, rightmost values are for the minimum values of the dependent variable. * Statistical significance at the 90% level ** Statistical significance at the 95% level *** Statistical significance at the 99% level () Standard error

The Minimum Wage 81
Table 16: Independent variable: Ratio of employment for females, both types of work in the nine occupations to the female labour force aged 15-64
Lag of Independent
.3588621*** (.0737968)
.3804898*** (.0734188)
.369508*** (.0737393)
.3873983*** (.0733253)
.3597347*** (.0738003)
.3812141*** (.0734026)
MinWage -.0036758 (.0042137)
-.0030407 (.0042672)
--- --- --- ---
LagMin Wage
.0014049 (.0039113)
.0011715 (.0040021)
--- --- --- ---
DiffMedian
--- --- -.0002721 (.000198)
-.0002216 (.0002011)
--- ---
lagDiff Median
--- --- .0001643 (.0001814)
.0001091 (.0001848)
--- ---
Diff MBM
--- --- --- --- -.0002313 (.000268)
-.0001881 (.0002715)
lagDiff MBM
--- --- --- --- .0000935 (.0002477)
.0000779 (.0002536)
lnSA -.0107715*** (.0037746)
-.0107334*** (.0038574)
-.0104353*** (.0038115)
-.0105225*** (.0038837)
-.0107491*** (.0037772)
-.0107056*** (.0038607)
lnCTB -.0301535*** (.0109363)
-.0321296*** (.0112089)
-.02778** (.0110417)
-.0295365*** (.0113069)
-.0304245*** (.0109402)
-.0323251*** (.0112208)
lnGDP .0528317*** (.0187599)
.0493657** (.0190957)
.0497263*** (.0189554)
.0465003** (.0192871)
.0534033*** (.018742)
.049879*** (.0190889)
Constant -.0003799 (.0005466)
-.0002395 (.0005573)
-.0004599 (.0005328)
-.0003166 (.0005434)
-.0003836 (.0005479)
-.0002463 (.0005586)
Time dummies
Yes Yes Yes Yes Yes Yes
† Note: Leftmost values for the same independent variables are for the maximum values of the dependent variable, rightmost values are for the minimum values of the dependent variable. * Statistical significance at the 90% level ** Statistical significance at the 95% level *** Statistical significance at the 99% level () Standard error

The Minimum Wage 82
Table 17: Independent variable: Ratio of employment for both sexes, full time work in the nine occupations to the labour force aged 15-64
Lag of Independent .5640192*** (.0615399)
.5429064*** (.0628633)
.5637965*** (.0613786)
MinWage -.0083204*** (.0029937)
--- ---
LagMinWage .0074753*** (.0028161)
--- ---
DiffMedian --- -.0002129 (.0001407)
---
lagDiffMedian --- .0001873 (.0001324)
---
DiffMBM --- --- -.0005551*** (.0001892)
lagDiffMBM --- --- .0004986*** (.0001775)
lnSA -.0051321* (.0026649)
-.0051058* (.0026985)
-.005154* (.0026586)
lnCTB -.010349 (.0076974)
-.0074189 (.0078815)
-.0106977 (.0076614)
lnGDP .0420582*** (.012143)
.037524*** (.0121594)
.0427291*** (.0120496)
Constant -.0006108 (.0003919)
-.0007406* (.0003868)
-.0006055 (.0003914)
Time dummies Yes Yes Yes * Statistical significance at the 90% level ** Statistical significance at the 95% level *** Statistical significance at the 99% level () Standard error

The Minimum Wage 83
Table 18: Independent variable: Ratio of employment for both sexes, part time work in the nine occupations to the labour force aged 15-64
Lag of Independent
.7617385*** (.0593003)
.7152777*** (.0640107)
.715828*** (.0602965)
.675091*** (.0644874)
.7625652*** (.0590554)
.7170688*** (.063786)
MinWage .0029829* (.0017295)
.0038247** (.0018077)
--- --- --- ---
LagMin Wage
-.0017232 (.0017267)
-.0021023 (.0017848)
--- --- --- ---
DiffMedian
--- --- .0001259 (.0000807)
.0001434* (.0000846)
--- ---
lagDiff Median
--- --- .0000203 (.0000784)
6.29e-06 (.0000815)
--- ---
Diff MBM
--- --- --- --- .0002002* (.0001094)
.0002589** (.0001142)
lagDiff MBM
--- --- --- --- -.0001191 (.000109)
-.0001466 (.0001125)
lnSA -.0035853** (.0015874)
-.0036217** (.0016526)
-.0038863** (.001569)
-.0037901** (.0016465)
-.0035681** (.0015861)
-.0035847** (.00165)
lnCTB .0011541 (.0044548)
.0002747 (.0046098)
-.0005573 (.0044778)
-.001510 (.0046643)
.0013776 (.004437)
.0005656 (.0045872)
lnGDP -.0031079 (.0075404)
-.0025602 (.007833)
-.0007833 (.0075478)
-.0003205 (.0078716)
-.003553 (.0074883)
-.0030845 (.0077719)
Constant -.0001617 (.0002311)
-.000127 (.0002397)
-.0001081 (.000225)
-.0000543 (.0002355)
-.0001639 (.0002311)
-.0001321 (.0002396)
Time dummies
Yes Yes Yes Yes Yes Yes
† Note: Leftmost values for the same independent variables are for the maximum values of the dependent variable, rightmost values are for the minimum values of the dependent variable. * Statistical significance at the 90% level ** Statistical significance at the 95% level *** Statistical significance at the 99% level () Standard error

The Minimum Wage 84
Table 19: Independent variable: Ratio of employment for males, full time work in the nine occupations to the male labour force aged 15-64
Lag of Independent
.4949833*** (.0656864)
.4992169*** (.0661005)
.5011898*** (.0664348)
.4963326*** (.066723)
.4939454*** (.0657786)
.4975337*** (.0662172)
MinWage -.0055043 (.0034132)
-.0057175* (.0034606)
--- --- --- ---
LagMin Wage
.0085078*** (.0031869)
.0087671*** (.0032487)
--- --- --- ---
DiffMedian
--- --- .0000556 (.0001588)
0000894 (.00016)
--- ---
lagDiff Median
--- --- .0001613 (.0001482)
.0001544 (.0001512)
--- ---
Diff MBM
--- --- --- --- -.0003659* (.0002154)
-.0003847* (.0002185)
lagDiff MBM
--- --- --- --- .0005637*** (.0002011)
.0005864*** (.0002053)
lnSA -.0032037 (.0030441)
-.003002 (.0030151)
-.0028283 (.0030996)
-.0026507 (.0030523)
-.0031937 (.0030399)
-.003008 (.0030101)
lnCTB -.0020367 (.0087835)
-.0029323 (.0087484)
-.0011838 (.0090428)
-.0021866 (.0089494)
-.0020319 (.0087494)
-.0029847 (.0087074)
lnGDP .0432304*** (.0134047)
.0455928*** (.0139048)
.0393236*** (.0134474)
.0440671*** (.0139958)
.0432163*** (.0132823)
.0456668*** (.013781)
Constant -.0014031*** (.0004543)
-.0014413*** (.0004635)
-.0014096*** (.0004479)
-.001502*** (.0004545)
-.0014039*** (.000454)
-.0014413*** (.0004632)
Time dummies
Yes Yes Yes Yes Yes Yes
† Note: Leftmost values for the same independent variables are for the maximum values of the dependent variable, rightmost values are for the minimum values of the dependent variable. * Statistical significance at the 90% level ** Statistical significance at the 95% level *** Statistical significance at the 99% level () Standard error

The Minimum Wage 85
Table 20: Independent variable: Independent variable: Ratio of employment for males, part time work in the nine occupations to the male labour force aged 15-64
Lag of Independent
.6224853*** (.0657548)
.5690981*** (.0670245)
.5917992*** (.0670501)
.5455619*** (.0682848)
.6247072*** (.0656712)
.5699512*** (.0668425)
MinWage -.0007918 (.0016549)
-.000324 (.0017862)
--- --- --- ---
LagMin Wage
.0024905 (.0016501)
.0018787 (.0017854)
--- --- --- ---
DiffMedian
--- --- .0000101 (.0000775)
.000026 (.0000843)
--- ---
lagDiff Median
--- --- .0001528** (.0000747)
.0001361* (.0000823)
--- ---
Diff MBM
--- --- --- --- -.0000527 (.0001054)
-.00002 (.0001134)
lagDiff MBM
--- --- --- --- .0001595 (.0001046)
.000121 (.000113)
lnSA -.002954* (.0016507)
-.0041932** (.0016277)
-.002893* (.0016213)
-.004081** (.0016078)
-.0029508* (.0016531)
-.0041716** (.00163)
lnCTB .0086831* (.0045076)
.0048832 (.004943)
.0077666* (.0044878)
.0042443 (.0049199)
.0087568* (.0045108)
.0049394 (.0049455)
lnGDP -.0122619* (.0072581)
-.0105408 (.007852)
-.0120768* (.0071824)
-.0103052 (.0078198)
-.0125557* (.0072417)
-.0107486 (.0078415)
Constant -.000051 (.0002247)
.0000559 (.0002438)
-.0000262 (.0002164)
.000071 (.000236)
-.0000479 (.0002251)
.0000561 (.0002441)
Time dummies
Yes Yes Yes Yes Yes Yes
† Note: Leftmost values for the same independent variables are for the maximum values of the dependent variable, rightmost values are for the minimum values of the dependent variable. * Statistical significance at the 90% level ** Statistical significance at the 95% level *** Statistical significance at the 99% level () Standard error
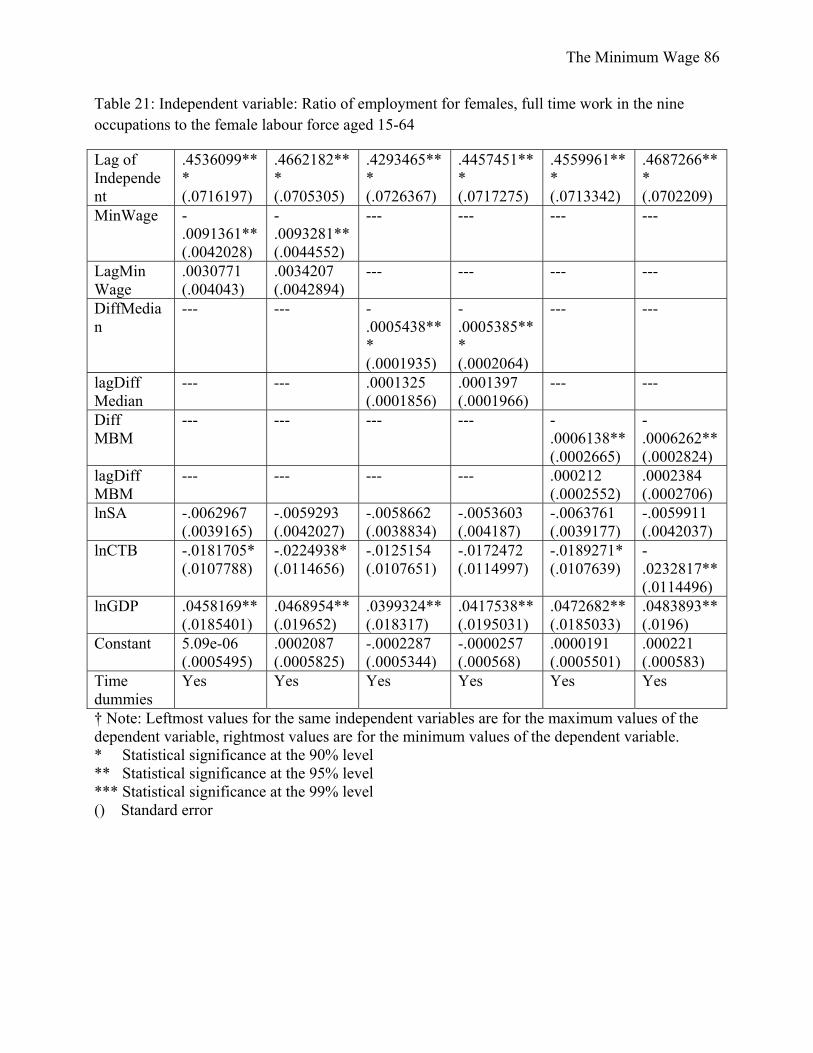
The Minimum Wage 86
Table 21: Independent variable: Ratio of employment for females, full time work in the nine occupations to the female labour force aged 15-64
Lag of Independent
.4536099*** (.0716197)
.4662182*** (.0705305)
.4293465*** (.0726367)
.4457451*** (.0717275)
.4559961*** (.0713342)
.4687266*** (.0702209)
MinWage -.0091361** (.0042028)
-.0093281** (.0044552)
--- --- --- ---
LagMin Wage
.0030771 (.004043)
.0034207 (.0042894)
--- --- --- ---
DiffMedian
--- --- -.0005438*** (.0001935)
-.0005385*** (.0002064)
--- ---
lagDiff Median
--- --- .0001325 (.0001856)
.0001397 (.0001966)
--- ---
Diff MBM
--- --- --- --- -.0006138** (.0002665)
-.0006262** (.0002824)
lagDiff MBM
--- --- --- --- .000212 (.0002552)
.0002384 (.0002706)
lnSA -.0062967 (.0039165)
-.0059293 (.0042027)
-.0058662 (.0038834)
-.0053603 (.004187)
-.0063761 (.0039177)
-.0059911 (.0042037)
lnCTB -.0181705* (.0107788)
-.0224938* (.0114656)
-.0125154 (.0107651)
-.0172472 (.0114997)
-.0189271* (.0107639)
-.0232817** (.0114496)
lnGDP .0458169** (.0185401)
.0468954** (.019652)
.0399324** (.018317)
.0417538** (.0195031)
.0472682** (.0185033)
.0483893** (.0196)
Constant 5.09e-06 (.0005495)
.0002087 (.0005825)
-.0002287 (.0005344)
-.0000257 (.000568)
.0000191 (.0005501)
.000221 (.000583)
Time dummies
Yes Yes Yes Yes Yes Yes
† Note: Leftmost values for the same independent variables are for the maximum values of the dependent variable, rightmost values are for the minimum values of the dependent variable. * Statistical significance at the 90% level ** Statistical significance at the 95% level *** Statistical significance at the 99% level () Standard error

The Minimum Wage 87
Table 22: Independent variable: Ratio of employment for females, part time work in the nine occupations to the female labour force aged 15-64
Lag of Independent
.6348524*** (.0710057)
.5849611*** (.0739263)
.597285*** (.0708558)
.5385728*** (.0729117)
.6367399*** (.0707701)
.5868185*** (.0737303)
MinWage .0057315* (.0030411)
.0057688* (.0029759)
--- --- --- ---
LagMin Wage
-.0031236 (.00299)
-.0029508 (.002951)
--- --- --- ---
DiffMedian
--- --- .0001809 (.0001421)
.000203 (.0001404)
--- ---
lagDiff Median
--- --- .0000486 (.0001361)
.0000598 (.0001328)
--- ---
Diff MBM
--- --- --- --- .0003859** (.0001923)
.0003915** (.0001883)
lagDiff MBM
--- --- --- --- -.0002157 (.000189)
-.0002061 (.0001867)
lnSA -.0046891* (.0027666)
-.0048425* (.0026613)
-.0048308* (.0027542)
-.00527** (.0026404)
-.0046328* (.0027636)
-.0047943* (.0026571)
lnCTB -.0032099 (.0077285)
-.0011111 (.0075601)
-.0061116 (.0078344)
-.0046662 (.0076375)
-.0027535 (.0076973)
-.0006425 (.0075236)
lnGDP -.0044908 (.0130729)
-.0012793 (.0128748)
-.0013851 (.013162)
.0004857 (.0128617)
-.0054564 (.0129923)
-.0022018 (.0128052)
Constant -.0002805 (.0003998)
-.0004889 (.0003915)
-.0001878 (.0003928)
-.0003449 (.0003838)
-.0002839 (.0003997)
-.000495 (.0003914)
Time dummies
Yes Yes Yes Yes Yes Yes
† Note: Leftmost values for the same independent variables are for the maximum values of the dependent variable, rightmost values are for the minimum values of the dependent variable. * Statistical significance at the 90% level ** Statistical significance at the 95% level *** Statistical significance at the 99% level () Standard error

The Minimum Wage 88
Table 23: Independent variable: Ratio of employment for both sexes aged 15-24 in the four NAICS occupations to the labour force aged 15-24
Lag of Independent
.3185066*** (.0762725)
.300895*** (.0768819)
.3135728*** (.0757613)
.2970191*** (.0763323)
.3192376*** (.0763205)
.3015821*** (.0769282)
MinWage .0049812 (.0100641)
.0045758 (.0100842)
--- --- --- ---
LagMin Wage
-.0054362 (.0097227)
-.0050447 (.0097474)
--- --- --- ---
DiffMedian
--- --- .0000435 (.0004664)
.0000366 (.0004675)
--- ---
lagDiff Median
--- --- .0000368 (.0004455)
-9.57e-06 (.0004467)
--- ---
Diff MBM
--- --- --- --- .0002957 (.0006393)
.0002674 (.0006407)
lagDiff MBM
--- --- --- --- -.0003746 (.0006159)
-.0003463 (.0006175)
lnSA -.0279503*** (.0089508)
-.0266264*** (.0089732)
-.0278207*** (.0089103)
-.0267066*** (.0089293)
-.0280217*** (.0089535)
-.0266926*** (.0089761)
lnCTB -.0018007 (.0265628)
-.0016589 (.0266531)
-.0045762 (.0268805)
-.0035854 (.0269435)
-.0014293 (.0265168)
-.001312 (.0266081)
lnGDP -.0154072 (.0423835)
-.0196012 (.0424105)
-.015124 (.042148)
-.0208049 (.0421228)
-.0160974 (.042164)
-.0202511 (.0421945)
Constant .0032585** (.0013768)
.0033737** (.001385)
.0033918** (.0013581)
.0035128** (.001366)
.0032792** (.0013772)
.0033947** (.0013854)
Time dummies
Yes Yes Yes Yes Yes Yes
† Note: Leftmost values for the same independent variables are for the maximum values of the dependent variable, rightmost values are for the minimum values of the dependent variable. * Statistical significance at the 90% level ** Statistical significance at the 95% level *** Statistical significance at the 99% level () Standard error

The Minimum Wage 89
Table 24: Independent variable: Ratio of employment for both sexes aged 25-54 in the four NAICS occupations to the labour force aged 25-54
Lag of Independent .6597355*** (.0597609)
.637073***(.060926)
.6585999***(.0597185)
MinWage -.0010555 (.0045511)
--- ---
LagMin Wage
.0052218 (.0044365)
--- ---
DiffMedian --- .0000828 (.0002085)
---
lagDiff Median
--- .0003219 (.0002007)
---
Diff MBM
--- --- -.0000658 (.0002881)
lagDiff MBM
--- --- .0003572 (.000281)
lnSA -.003446 (.0040672)
-.0028612 (.0040096)
-.0034052 (.0040634)
lnCTB .0060438 (.0123853)
.0033863 (.0122218)
.0062213 (.0123815)
lnGDP .0208766 (.0214176)
.0298207 (.0215605)
.0205428 (.0213102)
Constant -.0008686 (.00064)
-.0009825 (.0006227)
-.0008804 (.0006408)
Time dummies Yes Yes Yes * Statistical significance at the 90% level ** Statistical significance at the 95% level *** Statistical significance at the 99% level () Standard error

The Minimum Wage 90
Table 25: Independent variable: Ratio of employment for males aged 15-24 in the four NAICS occupations to the male labour force aged 15-24
Lag of Independent
.259207*** (.0774474)
.2491928*** (.0776488)
.2517943*** (.0762032)
.241652*** (.0764117)
.2605824*** (.0776164)
.2505473*** (.077808)
MinWage .001733 (.012667)
.0010546 (.0125857)
--- --- --- ---
LagMin Wage
-.0063028 (.0120301)
-.0057982 (.0119374)
--- --- --- ---
DiffMedian
--- --- .0002951 (.0005829)
.0002338 (.0005784)
--- ---
lagDiff Median
--- --- -.0005335 (.0005456)
-.0004966 (.0005413)
--- ---
Diff MBM
--- --- --- --- .0000773 (.0008048)
.0000401 (.0007993)
lagDiff MBM
--- --- --- --- -.0004402 (.0007618)
-.0004136 (.000756)
lnSA -.0388129*** (.0109912)
-.0386074*** (.0109894)
-.039254*** (.0109248)
-.0390256*** (.0109258)
-.0387844*** (.0109931)
-.0385796*** (.0109928)
lnCTB .0377062 (.0323124)
.0356708 (.0320489)
.039354 (.0326464)
.0372952 (.0323717)
.0379964 (.0322116)
.0359707 (.0319559)
lnGDP -.0035475 (.0544131)
.0046492 (.0533193)
-.0067231 (.0541432)
.001263 (.0528869)
-.0039774 (.0540801)
.0042367 (.0529869)
Constant -.0000692 (.0016411)
-.0001725 (.0016304)
-.0000895 (.0016071)
-.0001926 (.0015961)
-.0000399 (.001643)
-.0001451 (.0016323)
Time dummies
Yes Yes Yes Yes Yes Yes
† Note: Leftmost values for the same independent variables are for the maximum values of the dependent variable, rightmost values are for the minimum values of the dependent variable. * Statistical significance at the 90% level ** Statistical significance at the 95% level *** Statistical significance at the 99% level () Standard error

The Minimum Wage 91
Table 26: Independent variable: Ratio of employment for females aged 15-24 in the four NAICS occupations to the female labour force aged 15-24
Lag of Independent
.24023*** (.0774073)
.2420908*** (.0781879)
.2407266*** (.0774162)
.2444974*** (.0783555)
.2407531*** (.0774174)
.2426164*** (.0781954)
MinWage .006008 (.01506)
.0082249 (.0153145)
--- --- --- ---
LagMin Wage
.0022753 (.0143924)
.0011141 (.0145892)
--- --- --- ---
DiffMedian
--- --- .000069 (.0006911)
.0000818 (.0006994)
--- ---
lagDiff Median
--- --- .0006401 (.0006546)
.0005636 (.0006617)
--- ---
Diff MBM
--- --- --- --- .000396 (.000953)
.0005281 (.0009686)
lagDiff MBM
--- --- --- --- .0001308 (.0009097)
.0000581 (.0009212)
lnSA -.0186972 (.013831)
-.0214581 (.0140137)
-.0181145 (.0139208)
-.0214265 (.0141226)
-.018559 (.0138381)
-.021312 (.0140235)
lnCTB -.0636334* (.0381777)
-.0602851 (.0386633)
-.0698144* (.0388863)
-.0644758 (.0393872)
-.0625555 (.0381052)
-.0698144 (.0388863)
lnGDP -.0386643 (.0629571)
-.0491062 (.0632998)
-.0421186 (.0631502)
-.0564758 (.0636269)
-.0409762 (.0628067)
-.0421186 (.0631502)
Constant .0084155*** (.0020487)
.0083057*** (.0020802)
.0087621*** (.0020233)
.0087171*** (.0020567)
.0084119*** (.0020518)
.0087621*** (.0020233)
Time dummies
Yes Yes Yes Yes Yes Yes
† Note: Leftmost values for the same independent variables are for the maximum values of the dependent variable, rightmost values are for the minimum values of the dependent variable. * Statistical significance at the 90% level ** Statistical significance at the 95% level *** Statistical significance at the 99% level () Standard error

The Minimum Wage 92
Table 27: Independent variable: Ratio of employment for males aged 25-54 in the four NAICS occupations to the male labour force aged 25-54
Lag of Independent
.5809119*** (.0637877)
.5767177*** (.0639887)
.5291013*** (.0617312)
.5290429*** (.061867)
.5793198*** (.0638099)
.5752077*** (.0640157)
MinWage -.0041563 (.005344)
-.0042895 (.0053488)
--- --- --- ---
LagMin Wage
.0100166* (.0052323)
.0102481* (.0052359)
--- --- --- ---
DiffMedian
--- --- -.0001401 (.000236)
-.0001777 (.000237)
--- ---
lagDiff Median
--- --- .0008808*** (.0002239)
.0009008*** (.0002239)
--- ---
Diff MBM
--- --- --- --- -.0002703 (.0003392)
-.0002781 (.0003395)
lagDiff MBM
--- --- --- --- .0006715** (.0003326)
.0006851** (.0003329)
lnSA -.0033948 (.0048561)
-.003735 (.0048787)
-.0019849 (.0045086)
-.0021975 (.0045355)
-.0033426 (.0048569)
-.0036835 (.0048804)
lnCTB .0062686 (.0144621)
.0078859 (.0144725)
.0046225 (.0134229)
.0061246 (.0134402)
.0066479 (.0144461)
.0082755 (.0144578)
lnGDP .0258106 (.0237917)
.0289752 (.0238657)
.0345298 (.0224028)
.0370137 (.0224907)
.0252923 (.0236229)
.0284099 (.0236994)
Constant -.001246* (.0007549)
-.0013561* (.0007558)
-.0014859** (.0006845)
-.0015735** (.0006853)
-.0012612* (.0007558)
-.0013707* (.0007568)
Time dummies
Yes Yes Yes Yes Yes Yes
† Note: Leftmost values for the same independent variables are for the maximum values of the dependent variable, rightmost values are for the minimum values of the dependent variable. * Statistical significance at the 90% level ** Statistical significance at the 95% level *** Statistical significance at the 99% level () Standard error

The Minimum Wage 93
Table 28: Independent variable: Ratio of employment for females aged 25-54 in the four NAICS occupations to the female labour force aged 25-54
Lag of Independent
.4455571*** (.0791019)
.4475519*** (.0788218)
.442042*** (.0781868)
.4429431*** (.0778984)
.4455388*** (.0789447)
.4475893*** (.0786688)
MinWage .0009632 (.0063605)
.0009053 (.0063627)
--- --- --- ---
LagMin Wage
.0065246 (.0060435)
.0064624 (.0060404)
--- --- --- ---
DiffMedian
--- --- .0004842* (.0002915)
.0004811* (.0002912)
--- ---
lagDiff Median
--- --- -.0000272 (.0002775)
-.0000261 (.0002773)
--- ---
Diff MBM
--- --- --- --- .000099 (.0004028)
.0000953 (.000403)
lagDiff MBM
--- --- --- --- .0004373 (.0003826)
.0004334 (.0003824)
lnSA -.0055636 (.0056907)
-.0052242 (.0057052)
-.0065453 (.0056524)
-.006189 (.0056646)
-.0054877 (.0056876)
-.0051524 (.0057021)
lnCTB .0146399 (.0167453)
.0146175 (.0167472)
.0123298 (.0166539)
.0123976 (.016645)
.0151626 (.0167263)
.0151351 (.0167295)
lnGDP .0533963* (.0279625)
.0538399* (.0281194)
.0553213** (.0276886)
.0557865** (.0278335)
.0521273* (.0278215)
.0525851* (.0279825)
Constant -.0019297** (.0008496)
-.0019335** (.0008506)
-.0018129** (.0008313)
-.0018245** (.0008321)
-.0019553** (0.021)
-.001959** (.0008509)
Time dummies
Yes Yes Yes Yes Yes Yes
† Note: Leftmost values for the same independent variables are for the maximum values of the dependent variable, rightmost values are for the minimum values of the dependent variable. * Statistical significance at the 90% level ** Statistical significance at the 95% level *** Statistical significance at the 99% level () Standard error

The Minimum Wage 94
Table 29: Independent variable: Average weekly hours worked by each member of the labour force aged 15-64, all occupations
Lag of Independent . .4892162*** (.0729072)
.4482203*** (.0749675)
.490555*** (.0725097)
MinWage -.4073309*** (.1344762)
--- ---
LagMinWage .3265375** (.1307736)
--- ---
DiffMedian --- -.0184756*** (.0063788)
---
lagDiffMedian --- .0086124 (.0060271)
---
DiffMBM --- --- -.0257118*** (.0085261)
lagDiffMBM --- --- .0200381** (.008292)
lnSA -.0782574 (.1193436)
-.0704428 (.118072)
-.0817362 (.1192228)
lnCTB -.880668** (.3557678)
-.7791605** (.3549091)
-.8916587** (.3551611)
lnGDP 2.960456*** (.6397543)
2.927483*** (.6402047)
2.97328*** (.6378506)
Constant -.0123825 (.0182593)
-.3799414*** (.0375578)
-.0441337** (.0219828)
Time dummies Yes Yes Yes * Statistical significance at the 90% level ** Statistical significance at the 95% level *** Statistical significance at the 99% level () Standard error

The Minimum Wage 95
Table 30: Independent variable: Average weekly hours worked by each male member of the labour force aged 15-64, all occupations
Lag of Independent .479635*** (.0743807)
.4673153*** (.0765971)
.4807148*** (.0742604)
MinWage -.3667868* (.1922766)
--- ---
LagMinWage .4425084** (.1846442)
--- ---
DiffMedian --- -.0125852 (.0092879)
---
lagDiffMedian --- .0108719 (.0086076)
---
DiffMBM --- --- -.0218735* (.0122113)
lagDiffMBM --- --- .0263055** (.0117082)
lnSA .0093851 (.1665635)
.007 (.1673605)
.0080538 (.1667744)
lnCTB -.7913765 (.5059329)
-.7249696 (.5137121)
-.7914402 (.5060315)
lnGDP 3.901223*** (.8851529)
3.830781*** (.8921412)
3.879895*** (.884314)
Constant -.0526726** (.0255835)
-.054278** (.0253067)
-.0524585** (.0256045)
Time dummies Yes Yes Yes * Statistical significance at the 90% level ** Statistical significance at the 95% level *** Statistical significance at the 99% level () Standard error
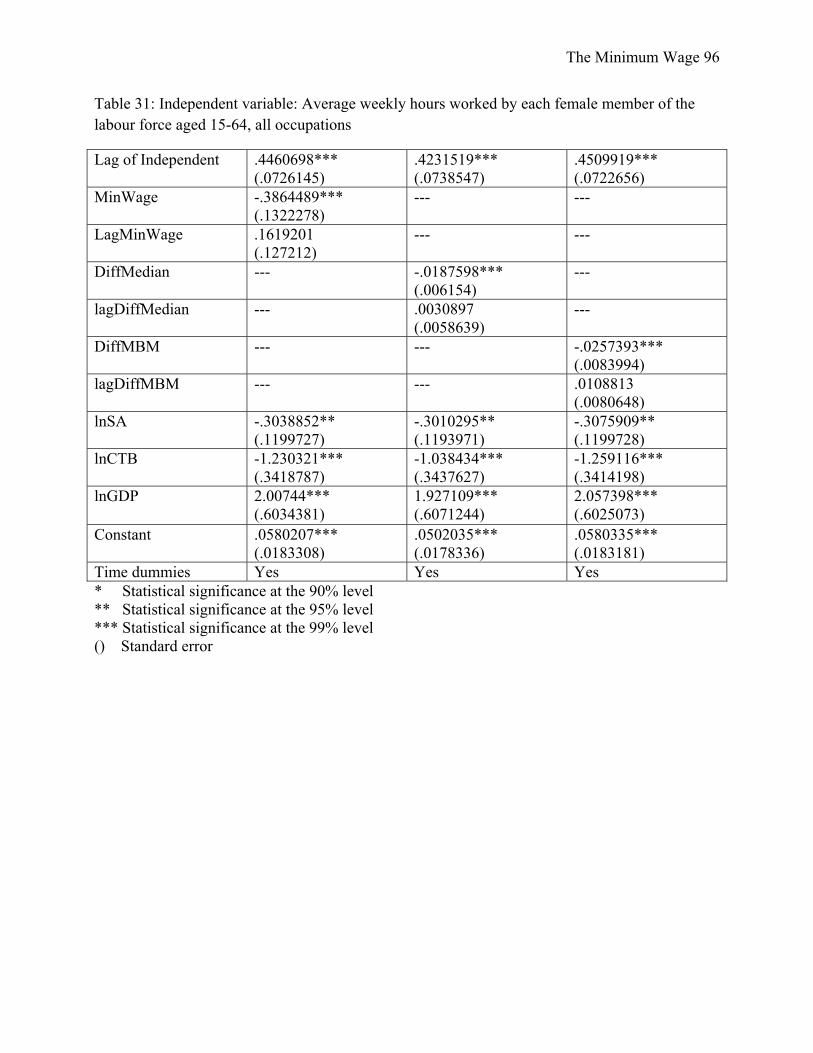
The Minimum Wage 96
Table 31: Independent variable: Average weekly hours worked by each female member of the labour force aged 15-64, all occupations
Lag of Independent .4460698*** (.0726145)
.4231519*** (.0738547)
.4509919*** (.0722656)
MinWage -.3864489*** (.1322278)
--- ---
LagMinWage .1619201 (.127212)
--- ---
DiffMedian --- -.0187598*** (.006154)
---
lagDiffMedian --- .0030897 (.0058639)
---
DiffMBM --- --- -.0257393*** (.0083994)
lagDiffMBM --- --- .0108813 (.0080648)
lnSA -.3038852** (.1199727)
-.3010295** (.1193971)
-.3075909** (.1199728)
lnCTB -1.230321*** (.3418787)
-1.038434*** (.3437627)
-1.259116*** (.3414198)
lnGDP 2.00744*** (.6034381)
1.927109*** (.6071244)
2.057398*** (.6025073)
Constant .0580207*** (.0183308)
.0502035*** (.0178336)
.0580335*** (.0183181)
Time dummies Yes Yes Yes * Statistical significance at the 90% level ** Statistical significance at the 95% level *** Statistical significance at the 99% level () Standard error

The Minimum Wage 97
Table 32: Independent variable: Average weekly hours worked by each member of the labour force aged 15-64, nine occupations
Lag of Independent .479932*** (.0648861)
.4777766*** (.0651503)
.4796001*** (.0648711)
MinWage -.3231009** (.133251)
--- ---
LagMinWage .3725989*** (.1265323)
--- ---
DiffMedian --- -.0046153 (.0062294)
---
lagDiffMedian --- .0125422** (.0058923)
---
DiffMBM --- --- -.0211913** (.0084438)
lagDiffMBM --- --- .0244678*** (.0080071)
lnSA -.4093061*** (.1189662)
-.3820515*** (.1192339)
-.4097152*** (.1187967)
lnCTB -.6074293* (.3432903)
-.6173266* (.3483308)
-.6140758* (.3418162)
lnGDP 2.323652*** (.5692265)
2.266927*** (.5688335)
2.335988*** (.564985)
Constant -.0404277** (.0177494)
-.0438639** (.0173463)
-.0403731** (.017742)
Time dummies Yes Yes Yes * Statistical significance at the 90% level ** Statistical significance at the 95% level *** Statistical significance at the 99% level () Standard error

The Minimum Wage 98
Table 33: Independent variable: Average weekly hours worked by each male member of the labour force aged 15-64, eight occupations
Lag of Independent .5270313*** (.0632792)
.5311311*** (.0636644)
.5273697*** (.0634525)
MinWage -.2774286* (.1617342)
--- ---
LagMinWage .4332675*** (.1520085)
--- ---
DiffMedian --- .0047645 (.007524)
---
lagDiffMedian --- .0106768 (.0070544)
---
DiffMBM --- --- -.0182232* (.0102262)
lagDiffMBM --- --- .0284562** (.0096146)
lnSA -.4107688*** (.143027)
-.3660718** (.1449376)
-.4109488*** (.1428733)
lnCTB -.0174956 (.4091205)
-.0044074 (.4177412)
-.0150383 (.4075928)
lnGDP 2.39236*** (.6506545)
2.335994*** (.6539498)
2.383275*** (.6449638)
Constant -.070542*** (.0215603)
-.0739948*** (.0211146)
-.07048*** (.0215729)
Time dummies Yes Yes Yes * Statistical significance at the 90% level ** Statistical significance at the 95% level *** Statistical significance at the 99% level () Standard error

The Minimum Wage 99
Table 34: Independent variable: Average weekly hours worked by each female member of the labour force aged 15-64, six occupations
Lag of Independent .338385*** (.0771991)
.3160073*** (.078163)
.3419295*** (.0768788)
MinWage -.2791567* (.1546168)
--- ---
LagMinWage -.0314592 (.1525986)
--- ---
DiffMedian --- -.0174106** (.0073191)
---
lagDiffMedian --- -.0014151 (.0069319)
---
DiffMBM --- --- -.0197419** (.0097958)
lagDiffMBM --- --- -.0010274 (.0096351)
lnSA -.3250639** (.1428428)
-.3330256** (.1422071)
-.3275745** (.1429027)
lnCTB -.9650551** (.4098498)
-.8103044** (.412073)
-.9967969** (.4095761)
lnGDP .932322 (.724321)
.8001724 (.7269134)
.9785503 (.7231778)
Constant .020673 (.0199079)
.0123898 (.0194065)
.0217352 (.0199333)
Time dummies Yes Yes Yes * Statistical significance at the 90% level ** Statistical significance at the 95% level *** Statistical significance at the 99% level () Standard error
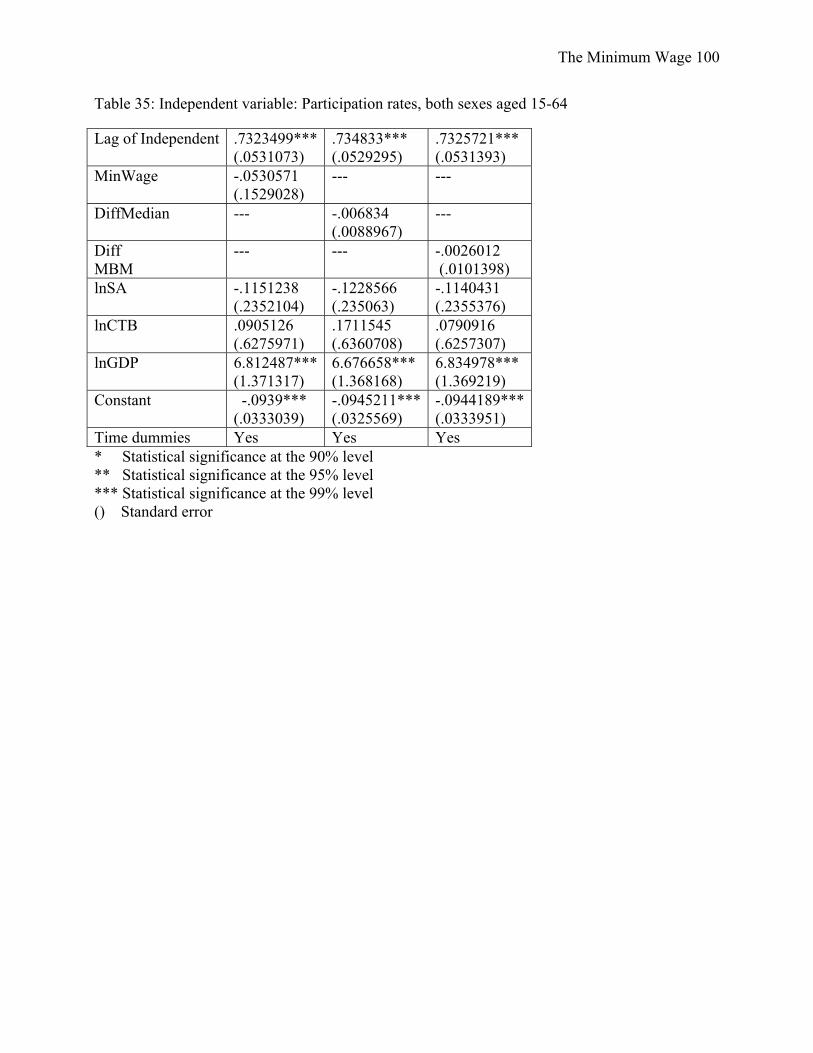
The Minimum Wage 100
Table 35: Independent variable: Participation rates, both sexes aged 15-64
Lag of Independent .7323499*** (.0531073)
.734833*** (.0529295)
.7325721*** (.0531393)
MinWage -.0530571 (.1529028)
--- ---
DiffMedian --- -.006834 (.0088967)
---
Diff MBM
--- --- -.0026012 (.0101398)
lnSA -.1151238 (.2352104)
-.1228566 (.235063)
-.1140431 (.2355376)
lnCTB .0905126 (.6275971)
.1711545 (.6360708)
.0790916 (.6257307)
lnGDP 6.812487*** (1.371317)
6.676658*** (1.368168)
6.834978*** (1.369219)
Constant -.0939*** (.0333039)
-.0945211***(.0325569)
-.0944189***(.0333951)
Time dummies Yes Yes Yes * Statistical significance at the 90% level ** Statistical significance at the 95% level *** Statistical significance at the 99% level () Standard error

The Minimum Wage 101
Table 36: Independent variable: Participation rates, males aged 15-64
Lag of Independent .5853339*** (.0612342)
.5701968*** (.0617794)
.5878382***(.0612263)
MinWage -.3376576** (.1686156)
--- ---
DiffMedian --- -.0252761** (.0099819)
---
Diff MBM
--- --- -.0215439* (.0111998)
lnSA .1936877 (.2524276)
.1892169 (.2517284)
.1888225 (.2529714)
lnCTB -.0607366 (.6740046)
.1330437 (.6829654)
-.1072515 (.6726906)
lnGDP 9.145486*** (1.588466)
9.410325*** (1.586315)
9.19529*** (1.590938)
Constant -.2000228*** (.0435923)
-.2172026***(.0435866)
-.1990515 (.0437252)
Time Dummies Yes Yes Yes * Statistical significance at the 90% level ** Statistical significance at the 95% level *** Statistical significance at the 99% level () Standard error

The Minimum Wage 102
Table 37: Independent variable: Participation rates, females aged 15-64
Lag of Independent .7319869*** (.0617112)
.7322845***(.0623045)
.7312116***(.0617209)
MinWage .101034 (.2159317)
--- ---
DiffMedian --- .0013172 (.0120829)
---
Diff MBM
--- --- .008204 (.0142838)
lnSA -.6082784** (.3078261)
-.6266976** (.3085494)
-.6052222** (.3077141)
lnCTB .2737315 (.8896046)
.2738869 (.8993889)
.2776448 (.8873732)
lnGDP 7.459294*** (1.752499)
7.473613***(1.77637)
7.474798***(1.747563)
Constant -.0440109 (.0433726)
-.0409316 (-.0409316)
-.0450695 (.04338)
Time Dummies Yes Yes Yes * Statistical significance at the 90% level ** Statistical significance at the 95% level *** Statistical significance at the 99% level () Standard error

The Minimum Wage 103
Table 38: Independent variable: Participation rates, both sexes aged 15-19
Lag of Independent .5873611*** (.0580435)
.5799872*** (.0570119)
.5915574***(.057696)
MinWage -.8171055* (.4588535)
--- ---
DiffMedian --- -.052284** (.0253817)
---
Diff MBM
--- --- -.0515077* (.0302408)
lnSA -.4700287 (.6283878)
-.5501028 (.6192662)
-.4740187 (.6304282)
lnCTB -2.598052 (1.821594)
-2.158193 (1.822314)
-2.686929 (1.825275)
lnGDP 20.00432*** (3.485685)
20.42481*** (3.459721)
20.08522***(3.498779)
Constant -.2205894** (.0916694)
-.2555886***(.0902662)
-.2194279** (.0920466)
Time dummies Yes Yes Yes * Statistical significance at the 90% level ** Statistical significance at the 95% level *** Statistical significance at the 99% level () Standard error

The Minimum Wage 104
Table 39: Independent variable: Participation rates, males aged 15-19
Lag of Independent .4102515*** (.0653777)
.4070797*** (.0653999)
.4153378*** (.0651368)
MinWage -1.377807** (.5418629)
--- ---
DiffMedian --- -.0783927** (.0304509)
---
Diff MBM
--- --- -.0894133** (.0359291)
lnSA -1.343703* (.7690424)
-1.313972* (.7625241)
-1.355527* (.7717122)
lnCTB -1.509711 (2.199599)
-.9853015 (2.218878)
-1.639575 (2.201866)
lnGDP 27.62327*** (4.234083)
27.92998*** (4.219043)
27.77955*** (4.244082)
Constant -.4244672*** (.1152219)
-.4752323***(.1141255)
-.4211977***(.1157577)
Time dummies Yes Yes Yes * Statistical significance at the 90% level ** Statistical significance at the 95% level *** Statistical significance at the 99% level () Standard error

The Minimum Wage 105
Table 40: Independent variable: Participation rates, females aged 15-19
Lag of Independent .4848707*** (.0681309)
.4782229***(.0661756)
.4878194***(.0678419)
MinWage -.0683752 (.5981719)
--- ---
DiffMedian --- -.0249437 (.0343432)
---
Diff MBM
--- --- -.0003895 (.0393512)
lnSA -.430664 (.8116714)
-.5055855 (.8078904)
-.4191256 (.8122117)
lnCTB -4.512727** (2.249484)
-4.3242* (2.265846)
-4.55753** (2.249599)
lnGDP 21.94717*** (4.109315)
22.63424***(4.107683)
21.91523***(4.116839)
Constant -.1377636 (.1124682)
-.1493952 (.1106661)
-.1387176 (.1127214)
Time Dummies Yes Yes Yes * Statistical significance at the 90% level ** Statistical significance at the 95% level *** Statistical significance at the 99% level () Standard error

The Minimum Wage 106
Table 41: Independent variable: Participation rates, both sexes aged 20-24
Lag of Independent .5299231*** (.069821)
.5342477***(.0693583)
.5312079***(.5312079)
MinWage -.5094054 (.3950281)
--- ---
DiffMedian --- -.027967 (.0222581)
---
Diff MBM
--- --- -.0334311 (.0259532)
lnSA -.1457148 (.5521375)
-.1344022 (.5541581)
-.1499976 (.5525977)
lnCTB -1.652644 (1.618435)
-1.457471 (1.655183)
-1.705401 (1.616674)
lnGDP 11.37836*** (2.855932)
11.45008***(2.87339)
11.47322***(2.855973)
Constant -.1450335 (.0880847)
-.1628453* (.0879886)
-.1441886 (.0882448)
Time dummies Yes Yes Yes * Statistical significance at the 90% level ** Statistical significance at the 95% level *** Statistical significance at the 99% level () Standard error

The Minimum Wage 107
Table 42: Independent variable: Participation rates, males aged 20-24
Lag of Independent .4687223*** (.0714303)
.4757464***(.0713014)
.4708572***(.0713777)
MinWage -.7568965* (.4270982)
--- ---
DiffMedian --- -.0417001* (.024621)
---
Diff MBM
--- --- -.0489184* (.0281905)
lnSA -.0402407 (.5895779)
-.0579359 (.5917453)
-.0500105 (.5900795)
lnCTB -2.06326 (1.714722)
-1.759014 (1.747297)
-2.141477 (1.713531)
lnGDP 12.38502*** (3.223001)
12.38894***(3.244968)
12.51933***(3.220569)
Constant -.1803142* (.0981674)
-.2040477** (.0976354)
-.1790861* (.0984183)
Time dummies Yes Yes Yes * Statistical significance at the 90% level ** Statistical significance at the 95% level *** Statistical significance at the 99% level () Standard error

The Minimum Wage 108
Table 43: Independent variable: Participation rates, females aged 20-24
Lag of Independent .2883762*** (.0807367)
.2921027***(.0796522)
.2886894***(.0805936)
MinWage -.3619484 (.5786684)
--- ---
DiffMedian --- -.016136 (.0318905)
---
Diff MBM
--- --- -.0242332 (.0381841)
lnSA -.6254235 (.8325378)
-.6547041 (.8321391)
-.6279194 (.8323292)
lnCTB .0095018 (2.290694)
.0770985 (2.345949)
-.031149 (2.279513)
lnGDP 14.87104*** (3.779851)
15.10299***(3.793774)
14.94723***(3.766697)
Constant -.2546212** (.121696)
-.2688753** (.1210589)
-.2539056** (.1218672)
Time Dummies Yes Yes Yes * Statistical significance at the 90% level ** Statistical significance at the 95% level *** Statistical significance at the 99% level () Standard error

The Minimum Wage 109
Table 44: Independent variable: Participation rates, both sexes aged 25 and over
Lag of Independent .68287*** (.0589727)
.6859811***(.059091)
.6819503***(.0591798)
MinWage -.05682 (.1448598)
--- ---
DiffMedian --- -.0058906 (.0083673)
---
Diff MBM
--- --- -.0020739 (.0096095)
lnSA -.2382307 (.207211)
-.2282028 (.2076382)
-.2360979 (.207386)
lnCTB .3242136 (.5539623)
.389169 (.5626432)
.3133219 (.5527455)
lnGDP 3.418035*** (1.012055)
3.30774*** (1.011835)
3.453803***(1.007539)
Constant -.0479623* (.0281605)
-.0492076* (.0274887)
-.0489755* (.0281983)
Time dummies Yes Yes Yes * Statistical significance at the 90% level ** Statistical significance at the 95% level *** Statistical significance at the 99% level () Standard error

The Minimum Wage 110
Table 45: Independent variable: Participation rates, males aged 25 and over
Lag of Independent .5244629*** (.0662165)
.5183595*** (.066409)
.5254809*** (.0662957)
MinWage -.1774096 (.158434)
--- ---
DiffMedian --- -.0106916 (.0093355)
---
Diff MBM
--- --- -.0101826 (.0104957)
lnSA .2520261 (.2530269)
.2840579 (.25413)
.2509702 (.2534385)
lnCTB .1856718 (.6298216)
.2628567 (.6422693)
.1573582 (.6283541)
lnGDP 3.736033*** (1.13323)
3.724706*** (1.127292)
3.793685*** (1.128577)
Constant -.1620382*** (.0380211)
-.1691202***(.0375185)
-.1625723***(.0381168)
Time Dummies Yes Yes Yes * Statistical significance at the 90% level ** Statistical significance at the 95% level *** Statistical significance at the 99% level () Standard error

The Minimum Wage 111
Table 46: Independent variable: Participation rates, females aged 25 and over
Lag of Independent .6675573*** (.0614009)
.6710895***(.0627921)
.6649742***(.0616966)
MinWage .0488499 (.1953184)
--- ---
DiffMedian --- .0004925 (.0111598)
---
Diff MBM
--- --- .0055792 (.0129251)
lnSA -.5695925** (.263994)
-.5640307** (.2651976)
-.5697465** (.2637086)
lnCTB .5417766 (.7516507)
.5251448 (.7568709)
.5545841 (.7517658)
lnGDP 5.122298*** (1.407228)
5.074698***(1.425209)
5.140963***(1.404271)
Constant .0078908 (.0386317)
.0091443 (.0383194)
.0069658 (.0385651)
Time Dummies Yes Yes Yes * Statistical significance at the 90% level ** Statistical significance at the 95% level *** Statistical significance at the 99% level () Standard error

The Minimum Wage 112
Table 47: Independent variable: Low-income rates, all families
Lag of Independent .4133247*** (.0699234)
.4136815*** (.0698728)
.4127734*** (.0698733)
MinWage -.064121 (.2901988)
--- ---
DiffMedian --- -.0052746 (.024748)
---
Diff MBM
--- --- -.0017585 (.0192252)
lnSA -.2951528 (.449083)
-.2969762 (.449222)
-.2948543 (.4487365)
lnCTB -.3614253 (1.197758)
-.3705452 (1.197225)
-.3689326 (1.196092)
lnEI 2.129518 (1.520529)
2.096684 (1.523935)
2.09708 (1.522202)
lnGDP 1.897898 (2.105201)
1.920913 (2.104053)
1.945032 (2.098427)
Unemployment, all ages .1949377 (.1288222)
.1941207 (.1287214)
.1936624 (.1286404)
lnMedian Income -12.11514***(2.262641)
-12.52045***(3.234721)
-12.06302***(2.262051)
Constant .003934 (.0622897)
.1321406* (.0755472)
.0016584 (.0623234)
Time Dummies Yes Yes Yes * Statistical significance at the 90% level ** Statistical significance at the 95% level *** Statistical significance at the 99% level () Standard error

The Minimum Wage 113
Table 48: Independent variable: Low-income rates, families with a male head or major earner under 65 years of age
Lag of Independent .2968778***(.0745361)
.2967326***(.074417)
.2960093*** (.0743947)
MinWage .2900674 (.3363141)
--- ---
DiffMedian --- .0250921 (.0287492)
---
Diff MBM
--- --- .0225455 (.0221724)
lnSA -1.202259** (.5124193)
-1.200212** (.5113135)
-1.195076** (.5115082)
lnCTB -1.484956 (1.392869)
-1.465785 (1.393281)
-1.448189 (1.390911)
lnEI 2.190547 (1.74322)
2.082589 (1.743524)
2.124921 (1.74355)
lnGDP -4.182288* (2.396069)
-4.194736* (2.393903)
-4.219649* (2.390231)
Unemployment, all ages .1040311 (.1521572)
.1079524 (.1518527)
.1028252 (.1518855)
lnMedian Income -10.87031***(2.50545)
-8.870108** (3.67605)
-10.81508***(2.501755)
Constant .3369318***(.0941436)
.3359895***(.0940981)
.3354727*** (.0939713)
Time Dummies Yes Yes Yes * Statistical significance at the 90% level ** Statistical significance at the 95% level *** Statistical significance at the 99% level () Standard error

The Minimum Wage 114
Table 49: Independent variable: Low-income rates, families with a female head or major earner under 65 years of age
Lag of Independent .3751616***(.0688504)
.377316*** (.0687514)
.375738*** (.0688186)
MinWage -.921853 (.6589701)
--- ---
DiffMedian --- -.0734384 (.0558902)
---
Diff MBM
--- --- -.0590021 (.0436489)
lnSA -.5155171 (.9128145)
-.5219153 (.9141712)
-.528055 (.9138338)
lnCTB 1.770458 (2.699584)
1.641891 (2.707573)
1.690416 (2.702973)
lnEI 1.960372 (3.20142)
1.899563 (3.203713)
1.969252 (3.207546)
lnGDP 5.035702 (4.437393)
5.112509 (4.438648)
5.203483 (4.434199)
Unemployment, all ages .0349448 (.2765663)
.0277231 (.276357)
.0287511 (.276513)
lnMedian Income -24.85228***(4.960927)
-30.7956*** (7.372143)
-24.82637***(4.966486)
Constant -.1392623 (.1372098)
-.1634724 (.1651911)
-.1630313 (.164911)
Time Dummies Yes Yes Yes * Statistical significance at the 90% level ** Statistical significance at the 95% level *** Statistical significance at the 99% level () Standard error

The Minimum Wage 115
Table 50: Independent variable: Low-income rates, families with a head or major earner under 24 years of age
Lag of Independent .2129742***(.0754882)
.2115509***(.0754652)
.2136833*** (.0754598)
MinWage .0772256 (.1098344)
--- ---
DiffMedian --- .1126287 (.1418487)
---
Diff MBM
--- --- .0772256 (.1098344)
lnSA -2.736346 (2.412804)
-2.739341 (2.410269)
-2.736346 (2.412804)
lnCTB -4.423126 (7.110556)
-4.36592 (7.103365)
-4.423126 (7.110556)
lnEI 14.43823* (8.562265)
14.251* (8.551387)
14.43823* (8.562265)
lnGDP 8.29619 (12.88485)
8.597627 (12.88298)
8.29619 (12.88485)
Unemployment, 15-24 .3945917 (.4570521)
.3949018 (.4569909)
.3945917 (.4570521)
lnMedian Income -49.59854***(12.97806)
-40.56463** (18.10908)
-49.59854***(12.97806)
Constant .9381555** (.4756085)
.9327359* (.4750141)
.9381555** (.4756085)
Time Dummies Yes Yes Yes * Statistical significance at the 90% level ** Statistical significance at the 95% level *** Statistical significance at the 99% level () Standard error

The Minimum Wage 116
Table 51: Independent variable: Low-income rates, families with a head or major earner under 24 years of age
Lag of Independent .1753206** (.0763627)
.1735127** (.0763356)
.1759161** (.0763415)
MinWage 1.2041 (1.610101)
--- ---
DiffMedian --- .1147582 (.137822)
---
Diff MBM
--- --- .0777378 (.1069233)
lnSA -3.428294 (2.386401)
-3.40796 (2.385632)
-3.403304 (2.388481)
lnCTB -4.177578 (6.941518)
-4.040088 (6.927713)
-4.103228 (6.936987)
lnEI 11.88056 (8.49219)
11.53534 (8.505685)
11.74156 (8.517315)
lnGDP 10.09141 (11.62551)
10.18169 (11.60173)
9.82591 (11.58469)
Unemployment, all ages 1.775443** (.7757585)
1.78803** (.7741638)
1.776706** (.7760062)
lnMedian Income -46.42874***(12.80639)
-37.14198** (17.81682)
-46.42507***(12.81402)
Constant .9200539** (.4650465)
.9142869** (.4647065)
.9204208** (.4652798)
Time Dummies Yes Yes Yes * Statistical significance at the 90% level ** Statistical significance at the 95% level *** Statistical significance at the 99% level () Standard error