the mineral industry of minnesota - usgs · pdf fileparle d-g d-g cs t rav e sg clear water...
TRANSCRIPT

SG
MINERAL SYMBOLS
Crushed stone/sand and gravel districts
County boundary
City
Capital
LEGEND
(Major producing areas)
D-L
Industrial sandIS
Iron
Dimension limestone
Fe
1
Dimension granite
Crushed stone
D-G
Clay
CS
Common clay
Concentration of mineral operations
Construction sand and gravel
Peat
Lime
Peat
SG
WINONA
HOUSTONFILLMORECS
CS
D-LSGCS
St. Paul
CS
WABASHA
OLMSTED
CS
Rochester
SG
GOODHUE
DODGE
CS
SG
MOWER
CS
CS
6
SG
SG
Peat
Duluth
CS
WASHINGTON
CARLTON
PINE
SG
Peat
Per
2Peat
PeatPeatPeat
S-o
CHISAGO
SG
CSSteel
IS
LAKE
D-G
SGPeat
CS ST LOUIS
Fe
COOK
CS
Lime plant
Steel
Per Perlite plant
S-o Sulfur (oil)
Steel plant
CS
LE
SG
STEELEWASECA
SG
CS
RICED-L
SGCS
SG
FARIBAULTMARTIN FREEBORN
SUEURClayIS SG
Peat
WATONWAN
BLUEEARTH
SG CS
NICOLLET
BROWN SGCS
CS
SG
COTTON-WOOD
JACKSON
ClayD-G
4 Clay
LimeMEDICINE Clay
SGCS
REDWOODLINCOLN LYONSG
STONEPIPE-
MURRAY
ROCK NOBLESSG
CS
SEYSG
5RAM-
HENNEPINMinneapolis
KANABEC
BENTON
WINGCROW
Peat
ISANTI
ANOKAPeat
ITASCA
SG
Fe
CS
CS
CS
KOOCHICHING
Peat
MILLE
AITKIN
SG
Peat
Peat
SGPeat
SG
HUBBARD CASS
BELTRAMI
THE WOODS
TODD
WADENA
LAKEOF
DAKOTA
SCOTT
CARVER
SIBLEY
McLEODRENVILLEYELLOW
LACS
D-G
WRIGHT
SG
SG SGPeat
SHERBURNE
SGPeat
MORRISONSG
MEEKER
D-G
STEARNS SGCS
KANDIYOHI
SG
3
POPE
DOUGLAS
CHIPPEWA
SWIFT
GRANT
SG
STEVENSBIGSTONE
LAC QUIPARLE
D-G
D-GCS
TRAVERSE
SG
CLEARWATER
ROSEAU
BECKER
OTTER TAIL
SG
Peat
PENNINGTON
Peat
RED LAKE
MAHNOMEN
1
WILKIN
CLAY
Lime
SG
Lime
POLK
NORMANSG
SG
KITTSON
MARSHALL
SG
100 Kilometers0
MINNESOTA
Source: Minnesota Department of Natural Resources, Division of Lands and Minerals/U.S. Geological Survey (2004)

MINNESOTA—2004 25.1
THE MINERAL INDUSTRY OF MINNESOTA In 2004, Minnesota’s nonfuel raw mineral production was valued1 at $1.89 billion, based upon annual U.S. Geological Survey
(USGS) data. This was a nearly 43% increase from that of 20032 and followed a 1.5% increase from 2002 to 2003. The State rose to 7th from 10th in rank among the 50 States in total nonfuel mineral production value, of which Minnesota accounted for about 4.1% of the U.S. total. (Because data for industrial sand and gravel and lime have been withheld to protect company proprietary data, the actual total values for 2002-04 are somewhat higher than those reported in table 1.)
Minnesota continued to be the Nation’s leading iron ore-producing State in 2004; based upon value, iron ore continued to be the State’s leading nonfuel raw mineral, followed by construction sand and gravel, crushed stone, industrial sand and gravel, dimension stone, and lime (descending order of value). The State’s substantial increase in nonfuel raw mineral production value largely resulted from iron ore’s considerably higher average price per metric ton in 2004 as compared with that of 2003. With a 22% increase in production shipments, the commodity’s value rose by more than $530 million, more than 50% from that of 2003. Other particularly significant increases were those of crushed stone, the value of which was up by $6.5 million, construction sand and gravel, value up $24 million, and industrial sand and gravel, up more than $10 million. There were no decreases in production or related value for any of Minnesota’s nonfuel minerals for the year.
In 2003, a $37 million increase in the value of construction sand and gravel and a more than $4 million increase in crushed stone more than offset a $20 million decrease in the value of iron ore, in part resulting from lowered production shipments of iron ore (table 1). Additionally, with significantly increased production, industrial sand and gravel value was up about $8 million, and although with a slight drop in crushed stone production, its value increased by more than $4 million. Lime had a small increase in production, but its value was down slightly.
In 2004, Minnesota continued to rank first in the quantities of iron ore produced, third in peat, and fifth in construction sand and gravel among other producing States. The State increased to 9th from 10th in the production of industrial sand and gravel and significant quantities of dimension stone were produced in the State.
The following narrative information was provided by the Minnesota Department of Natural Resources’ (DNR) Division of Lands and Minerals (DLM).3 Production data in the following text are those reported by the DLM, based upon its own surveys and estimates. The data may differ from some production figures reported by the USGS.
Exploration and Nonferrous Metallic Leasing Activities
Advanced stage exploration continued in 2004 at three copper-nickel-platinum-group metal (PGM) deposits located near the western margin of late-Proterozoic mafic intrusions collectively referred to as the Duluth Complex. The three deposits were the NorthMet deposit, being explored by Polymet Mining Corp.; the Birch Lake deposit, being explored by Franconia Minerals Corp.; and the Mesaba deposit, held by Teck Cominco Ltd.
Polymet has formally begun the permitting process for the NorthMet deposit, and in early 2005, announced a 27,000-meter (m) infill drilling in the deposit area designed to add to the existing 56,000 m of existing drill core. A second large-diameter core sampling campaign was to provide raw materials for a second pilot test of Polymet’s processing technology. Additional program information was available on the Internet at URL http://www.polymetmining.com.
The Birch Lake project, according to a 2004 technical report released by Franconia Minerals Corp., was at an advanced exploration stage. Drilling (40 holes and 49 wedges totaling 33,339 m) has outlined a large-tonnage, low-grade copper-nickel-PGE deposit in a resource area of approximately 260 hectares (ha). The deposit is in the upper portion of an ultra-mafic unit within the South Kawishiwi intrusive, at a depth of 350 m to 750 m in the resource area. The vertical thickness of the unit averages 53 m with mineralization consisting of disseminated sulfides. The palladium-to-platinum ratio is typically 2 to 1 in drill-core analyses. A 2002 estimate of inferred mineral resources (using a hydrometallurgical case and net smelter return cutoff of U.S. $25.35 per metric ton) described 51 million metric tons (Mt) of inferred resources at a grade of 0.675% copper, 0.211% nickel, 0.01% cobalt, 216 parts per billion (ppb) gold, 972 ppb palladium, 460 ppb platinum, and 2.60 parts per million silver. Additional information was available on the company’s Web site at URL http://www.franconiaminerals.com.
The Mesaba deposit being explored near Babbitt, MN, had been dormant since Polymet announced that it had reached an agreement with Cliffs-Erie LLC for use of the former LTV Steel mining and plant facilities at nearby Hoyt Lakes. The metals were to have been recovered using Teck Cominco’s hydrometallurgical process. Additional information was available on the company’s Web site at URL http://www.teckcominco.com/research/index.htm.
In other exploration activities, Kennecott Minerals drilled 11 holes totaling 3,600 m in mafic-ultramafic features outside the Duluth complex, in Aitkin, Carlton, Morrison, and Stearns Counties. WMC Exploration Inc. drilled one hole in Renville County totaling 370
1The terms “nonfuel mineral production” and related “values” encompass variations in meaning, depending upon the mineral products. Production may be measured
by mine shipments, mineral commodity sales, or marketable production (including consumption by producers) as is applicable to the individual mineral commodity. All 2004 USGS mineral production data published in this chapter are those available as of December 2005. All USGS Mineral Industry Surveys and USGS Minerals
Yearbook chapters—mineral commodity, State, and country—also can be retrieved over the Internet at URL http://minerals.usgs.gov/minerals. 2Values, percentage calculations, and rankings for 2003 may differ from the Minerals Yearbook, Area Reports: Domestic 2003, Volume II, owing to the revision of
preliminary 2003 to final 2003 data. Data and rankings for 2004 are considered to be final and are not likely to change significantly. 3Maryanna Harstad, Senior Planner, authored the text of the State mineral industry information provided by the Minnesota Department of Natural Resources’
Division of Lands and Minerals.

25.2 U.S. GEOLOGICAL SURVEY MINERALS YEARBOOK—2004
m. There were 143 active State metallic minerals leases covering 18,900 ha as of December 31, 2004. A State metallic minerals lease sale was held on October 13, 2004, that resulted in 37 new leases. Fifteen of these were in Kanabec County (all by Kennecott Exploration Co., covering a total of 2,490 ha), 18 were in Mille Lacs County (all by Kennecott Exploration Co., covering a total of 2,540 ha), and four were in the Archean greenstone belts of St. Louis County (all by Lehmann Exploration Management, Inc., covering a total of 450 ha).
Five more metallic minerals leases were issued in 2004 through the negotiated lease process. Two of these (issued to Lehmann Exploration Management, Inc. and covering 146 ha) were in St. Louis County, and the other three (issued to Kennecott Exploration Company and covering 453 ha) were in Kanabec County.
A total of 90 leases (covering a total of 11,500 ha) was terminated in 2004. These included 10 leases (covering 1,270 ha) in Lake County and 80 leases (covering 10,200 ha) in St. Louis County.
Commodity Review
Industrial Minerals
The industrial mineral and construction materials mining industry in Minnesota produced commodities in seven general categories: aggregate, clays, granite, limestone, peat, quartzite, and industrial silica sand. Resources exist for the potential development of additional mine sites for most of these commodities. Minnesota’s population continued to grow. At the 2000 census, Minnesota’s population was 4,919,000. During the period 1990 to 2000, Minnesota’s population grew an average of 54,000 per year. Minnesota was the fastest growing State in the Midwest and the Northeast during that period. The Greater Twin Cities Metropolitan Area, including collar counties, surpassed the 3 million population level in 1998. The Twin Cities area itself is clearly a large market even at the national scale. There are choices for modes of transportation: barge on the Mississippi River to the Gulf of Mexico, ports on the Great Lakes, rail to either coast, and truck via interstate highways to move industrial minerals to various markets. All of these factors created opportunities to develop industrial mineral resources in Minnesota.
Clay and Shale.— Since 1995, four new mines have opened. Clay production in 2004 was derived from seven mines for two general purposes. Kaolin was mined for use in portland cement production and also for making bricks and tiles. Common clay and shale were also mined for bricks and tiles.
Crushed Stone and Sand and Gravel.—Aggregate production in Minnesota was composed of three general categories: sand and gravel mined from glacial deposits or alluvial deposits, crushed dolomite or limestone mined from bedrock in southeastern Minnesota, and crushed rock mined elsewhere from diabase, gabbro, gneiss, granite, quartzite, rhyolite, taconite, or traprock. The materials are used for many construction purposes: asphalt pavement, landscape stone, precast concrete products, railroad ballast, ready mixed concrete, riprap, road base, and other fill material. Some of the same quarries that produce crushed carbonate rocks also produce granular carbonate (limestone or dolomite) rock, which is used for soil amendment or for cement.
Aggregate has been or is currently being mined in all of the State’s 87 counties. The USGS conducts an annual survey whereby aggregate producers are requested to respond on a voluntary basis. This survey is the only available tool that portrays the general statewide trends. The survey data for year 2004 are available on the USGS minerals information Web site at URL http://minerals.usgs.gov/minerals/pubs/commodity/stone_crushed/csmis4q04.pdf.
The following aggregate resource information is available on the DNR Web site at URL http://www.dnr.state.mn.us/lands_minerals/aggregatemaps.html in a PDF file format: aggregate resource maps for 12 counties; the seven-county Minneapolis-St. Paul metropolitan area aggregate resource map with a related report by the Minnesota Geological Survey and the Metropolitan Council on projected availability of aggregate resources; and the final report to the legislature of the Aggregate Resources Task Force from February 1, 2000.
Various types of State-owned stockpile material were sold to local companies for use as construction aggregates, such as road base material. State leases continued to be available from many other stockpiles along the 145 kilometers of the Mesabi Iron Range.
Landscape stone products have become a popular and valuable commodity in the Twin Cities market area. Many dolomite quarries offered landscape stone products. The New Ulm Quartzite Quarry offers purple quartzite landscape stone products. Natural glacial boulders and smaller fieldstone were supplied from many sources from as far away as the Mesabi Iron Range. Cliffs Natural Stone sold a line of landscape stone products obtained from various sources on the eastern Mesabi Iron Range. Cliffs Natural Stone had a State lease for a stockpile of flagstone material near Hoyt Lakes.
The Minnesota Department of Agriculture (MDA) analyzed the granular carbonate soil amendment, commonly called ag-lime, to report the neutralization potential. The analytical data for every ag-lime producer were available on the MDA Web site, www.mda.state.mn.us, by searching for “Ag-lime analysis report.” The MDA compilation listed 2004 total sales of 741,000 metric tons (t) of ag-lime, of which 348,000 t (47%) was primary production from Minnesota quarries.
Dimension Stone.—Dimension stone production in Minnesota included three general commodities: granite, limestone, and quartzite. Two granite producers operated nine quarries within the State. The quarries are in the vicinity of Babbitt, Bellingham, Isle, Morton, Ortonville, and St. Cloud. Dimension stone end products generally fall into two categories, building stone and memorials. The building stone products include curbing and paving tile, exterior and interior facing, countertops, and furniture. The memorial stone products include crypt fronts, markers, mausoleums, and monuments.
Three limestone producers operated eight quarries within the State. The quarries are located in the vicinity of Mankato and Winona. The limestone was used more commonly for building stone products.
Quartzite was quarried near Jasper in southwestern Minnesota and was used for abrasive products and dimensional products. The abrasive products included grinding media cubes and pebbles. The dimensional products included acid-resistant blocks, building

MINNESOTA—2004 25.3
stone, chute and mill liners, and memorials. Cold Spring Granite Company’s green stone (Lake Superior Green) was used in the National D-Day Memorial in Bedford, VA, and its black stone (Mesabi Black) significantly increased in popularity. The National Museum of the American Indian, Washington, DC, which opened in September 2004, contains two types of stone from Minnesota—pipestone mined by Travis Erickson and Oneota dolomite provided by Vetter Stone Company under the trade name Kasota-Mankato stone.
Industrial Sand.—Silica sand from sandstone bedrock formations east of the Twin Cities and north of Mankato was used in the petroleum industry, in the construction industry, in foundries, in glassmaking, and for sandblasting.
Peat.—Nine companies held active leases for horticultural peat on State lands. Berger Peat Moss Ltd. obtained permits to develop a new peat mine at the Pine Island Peat Bog in Koochiching County. Michigan Peat Company closed its mine in 2004 on a State lease east of Cromwell.
Metals
Iron Ore.—Minnesota continued to rank first in the Nation in iron ore production, accounting for approximately 75% of the 2004 domestic iron ore shipments to the steel industry. Iron ore pellet production continued to rank among the State’s largest industries, contributing more than $1 billion annually to Minnesota’s economy.
Iron ore production in Minnesota increased from 36 Mt in 2003 to 41 Mt in 2004. It is estimated that production for 2005 was approximately 42 Mt.
The steel industry has undergone dramatic change, which has resulted in a restructuring of Minnesota’s taconite industry. U.S. Steel completed the purchase of National Steel Corp., which included National Steel Pellet Company (now operated by US Steel’s Minnesota Ore Operations as Keewatin Taconite). The majority owner in Hibbing Taconite was previously Bethlehem Steel, which was International Steel Group in 2004. Eveleth Taconite Mining Company (EVTAC) ceased operation and filed for Chapter 11 bankruptcy in May 2003. However, in November 2003, Cleveland-Cliffs Inc. and Laiwu Steel Corporation Limited of China obtained the assets of EVTAC, restarted the plant and mine, and began producing pellets during December 2003 as United Taconite Company.
Several improvements and expansions at Minnesota taconite facilities were undertaken. USS Keewatin Taconite constructed a wet scrubber, which resulted in increased pellet production. United Taconite restarted a pellet line that had been idle since 1999. This will increase their United Taconite’s pellet production by more than 1 million metric tons per year (Mt/yr). Northshore Mining had plans to restart a pellet line that has been idle for more than 20 years. This would increase Northshore pellet production by more than 1 Mt/yr. USS Minntac was in the planning stages to install a wet scrubber on its line 3 pellet furnace at Mountain Iron, which will result in increased pellet production.
Mesabi Nugget, LLC completed testing of its pilot demonstration plant (PDP) at Silver Bay, MN. The 25,000-metric-ton-per-year (t/yr) PDP was a joint venture between Cleveland Cliffs Inc., Kobe Steel of Japan, Steel Dynamics Inc., and Ferrometrics Inc. The PDP began operation in June 2003 and had several successful campaigns. Several metric tons of pig iron nuggets were shipped to Steel Dynamics in Butler, IN, where they were successfully converted into steel. Planning and permitting were underway for the construction of a 510,000 t/yr iron nugget facility near Hoyt Lakes, MN. Construction of this plant was planned for the beginning of summer 2005.
Environmental Issues and Government Programs
The Environmental Cooperative Research Program addressed environmental and land-use impacts associated with mining. Typical research projects were cosponsored by industry, Federal agencies, or other units of government on a cost-share or in-kind service basis. Projects undertaken in 2004 included the following: characterization and modeling of acid rock drainage, mercury removal from induration offgas by wet scrubbers, a hydrological and water-quality study on the in-pit disposal of taconite tailings, and the development of a hydrological database on mine hydrology. The State of Minnesota’s biennial appropriation (July 2003 through June 2005) for mineral cooperative environmental research was $172,000. Matching monies or in-kind contributions are required by the appropriation.
The Iron Ore Cooperative Research Program funded research supporting rapid improvements in iron ore and taconite processing. Research projects funded during the current biennium (July 2003 through June 2005) included dust suppression in iron ore processing plants, an improved pellet fines removal system, magnetically enhanced hydroseparation, greenball characterization, a Mesabi Range GIS workshop, utilization of hemicelluloses and cellulose as a pellet binder, taconite concentrator modeling, oxygen injection in a grate kiln, alternative fuels for traveling grate induration furnaces, accurate in-house ore characterization, iron ore greenball porosity measurements, mercury exchange mechanisms in taconite processing plants, and a tailings water study. The total biennial budget for iron ore cooperative research was $825,000. The State appropriation was $550,000, and the taconite companies’ investment was $275,000.
The Minerals Diversification Program funds research supporting the long-term health of the State’s mining economy. This is achieved through improvements to the existing industry and by encouraging environmentally sound exploration and development of new mineral resources. Research projects funded during the current biennium (July 2003 through June 2005) included: Bedrock and Quaternary Geology of the Mesabi Range, Follow-up Mapping and PGM Evaluation of Mafic Intrusions (excluding Duluth Complex), and Mapping Aggregate Resources in two Minnesota counties. The State biennial appropriation for this program was $344,000.
The Minnesota DNR, DLM, maintains an archive of drill-core and related exploration data at its Hibbing office. Scanned copies of these archives may be accessed through the DNR’s Web site at URL http://minarchive.dnr.state.mn.us.

25.4 U.S. GEOLOGICAL SURVEY MINERALS YEARBOOK—2004
In addition to the “Public Access to Minerals Information” at the DNR’s Web site, other information is available on the DNR’s Web site at URL http://www.dnr.state.mn.us, including monthly data releases, information on mineral lease availability, aggregate resource maps, a seven-county Minneapolis-St. Paul metropolitan area aggregate resource map and report on projected availability of aggregate resources, and many online documents pertaining to mineral and mining research and exploration.
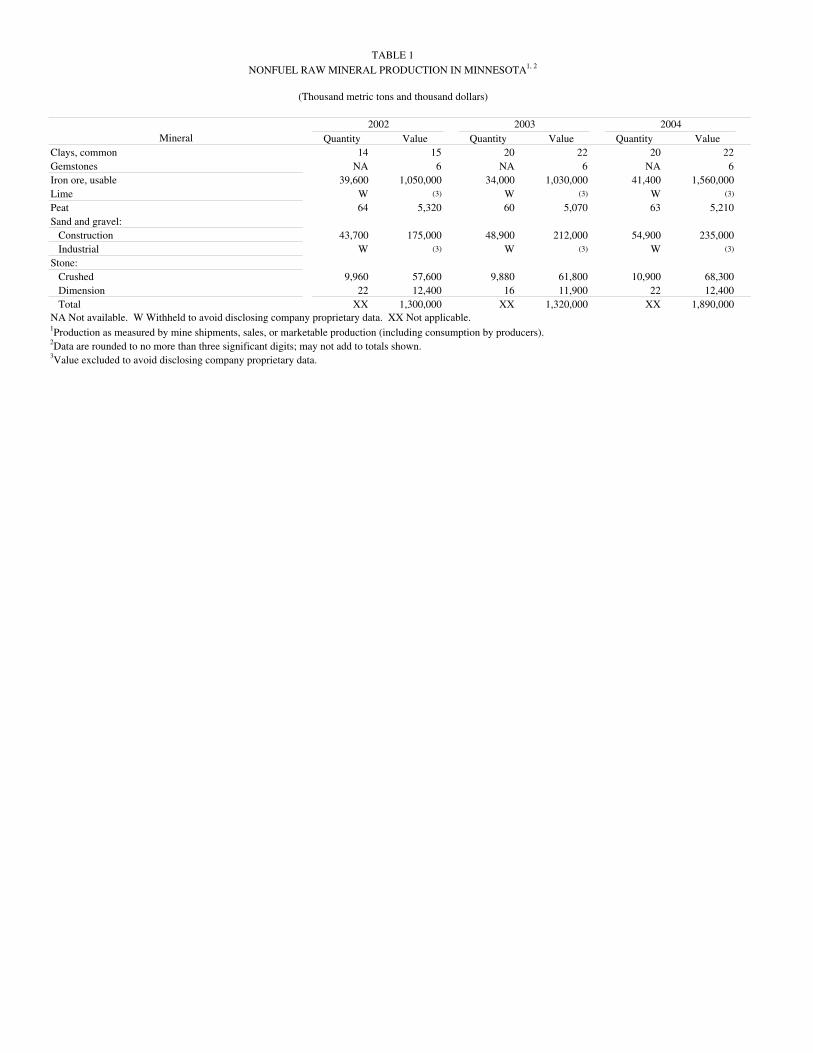
TABLE 1
NONFUEL RAW MINERAL PRODUCTION IN MINNESOTA1, 2
(Thousand metric tons and thousand dollars)
2002 2003 2004Mineral Quantity Value Quantity Value Quantity Value
Clays, common 14 15 20 22 20 22Gemstones NA 6 NA 6 NA 6Iron ore, usable 39,600 1,050,000 34,000 1,030,000 41,400 1,560,000Lime W (3) W (3) W (3)
Peat 64 5,320 60 5,070 63 5,210Sand and gravel:
Construction 43,700 175,000 48,900 212,000 54,900 235,000Industrial W (3) W (3) W (3)
Stone:Crushed 9,960 57,600 9,880 61,800 10,900 68,300Dimension 22 12,400 16 11,900 22 12,400Total XX 1,300,000 XX 1,320,000 XX 1,890,000
NA Not available. W Withheld to avoid disclosing company proprietary data. XX Not applicable.1Production as measured by mine shipments, sales, or marketable production (including consumption by producers).2Data are rounded to no more than three significant digits; may not add to totals shown.3Value excluded to avoid disclosing company proprietary data.
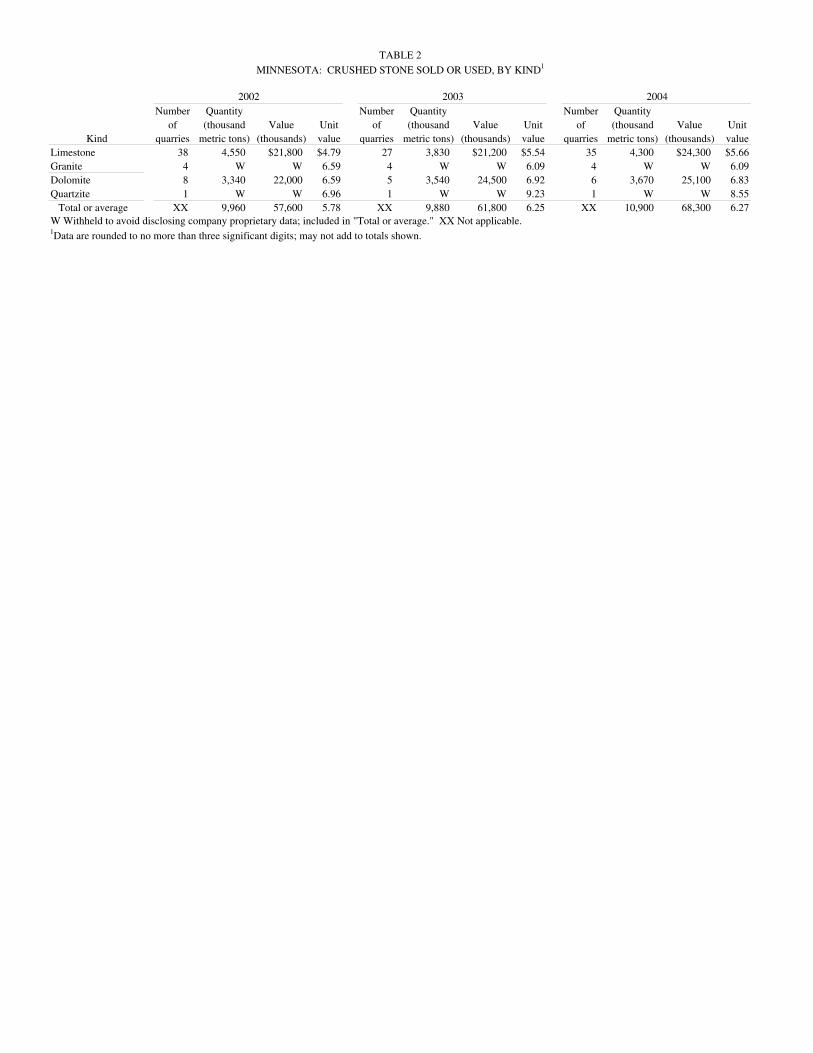
TABLE 2
MINNESOTA: CRUSHED STONE SOLD OR USED, BY KIND1
2002 2003 2004Number Quantity Number Quantity Number Quantity
of (thousand Value Unit of (thousand Value Unit of (thousand Value UnitKind quarries metric tons) (thousands) value quarries metric tons) (thousands) value quarries metric tons) (thousands) value
Limestone 38 4,550 $21,800 $4.79 27 3,830 $21,200 $5.54 35 4,300 $24,300 $5.66Granite 4 W W 6.59 4 W W 6.09 4 W W 6.09Dolomite 8 3,340 22,000 6.59 5 3,540 24,500 6.92 6 3,670 25,100 6.83Quartzite 1 W W 6.96 1 W W 9.23 1 W W 8.55
Total or average XX 9,960 57,600 5.78 XX 9,880 61,800 6.25 XX 10,900 68,300 6.27W Withheld to avoid disclosing company proprietary data; included in "Total or average." XX Not applicable.1Data are rounded to no more than three significant digits; may not add to totals shown.

TABLE 3a
MINNESOTA: CRUSHED STONE SOLD OR USED BY PRODUCERS IN 2003, BY USE1
Quantity(thousand Value Unit
Use metric tons) (thousands) valueConstruction:
Coarse aggregate (+1½ inch):Macadam W W $6.35Riprap and jetty stone 59 $853 14.46Filter stone W W 4.55Other coarse aggregates 21 477 22.51
Total or average 95 1,400 14.75Coarse aggregate, graded:
Concrete aggregate, coarse 41 222 5.44Bituminous aggregate, coarse W W 9.89Bituminous surface-treatment aggregate W W 12.97Railroad ballast W W 9.10Other graded coarse aggregates 983 9,140 9.30
Total or average 1,120 10,300 9.19Fine aggregate (-⅜ inch):
Stone sand, bituminous mix or seal W W 7.24Screening, undesignated W W 3.58Other fine aggregate 133 916 6.91
Total or average 221 1,560 7.05Coarse and fine aggregates:
Graded road base or subbase 119 469 3.96Unpaved road surfacing W W 3.96Crusher run or fill or waste 32 261 8.22Terrazzo and exposed aggregates W W 10.21Other coarse and fine aggregates 2,340 13,600 5.85
Total or average 2,650 15,100 5.68Agricultural:
Limestone 138 823 5.95Poultry grit and mineral food (2) (2) 35.07Other agricultural uses 4 24 6.00
Total or average 142 847 5.96Other miscellaneous uses and specified uses not listed 5 9 1.80
Unspecified:3
Reported 3,850 21,400 5.56Estimated 1,800 11,000 6.25
Total or average 5,650 32,700 5.78Grand total or average 9,880 61,800 6.25
W Withheld to avoid disclosing company proprietary data; included in "Total or average."1Data are rounded to no more than three significant digits, except unit value; may not add to totals shown.2Withheld to avoid disclosing company proprietary data; included in "Unspecified: Reported."3Reported and estimated production without a breakdown by end use.

TABLE 3b
MINNESOTA: CRUSHED STONE SOLD OR USED BY PRODUCERS IN 2004, BY USE1
Quantity(thousand Value Unit
Use metric tons) (thousands) valueConstruction:
Coarse aggregate (+1½ inch):Macadam W W $6.34Riprap and jetty stone 55 $872 15.85Filter stone 31 185 5.97Other coarse aggregates 56 916 16.36
Total or average 142 1,970 13.89Coarse aggregate, graded:
Concrete aggregate, coarse 77 386 5.01Bituminous aggregate, coarse (2) (2) 8.72Bituminous surface-treatment aggregate (2) (2) 7.89Railroad ballast (2) (2) 9.28Other graded coarse aggregates 1,020 8,580 8.41
Total or average 1,380 11,500 8.32Fine aggregate (-⅜ inch):
Stone sand, concrete (2) (2) 4.61Stone sand, bituminous mix or seal (2) (2) 2.48Screening, undesignated (2) (2) 1.54Other fine aggregates 126 898 7.13
Total or average 241 1,180 4.89Coarse and fine aggregates:
Graded road base or subbase 287 1,480 5.15Unpaved road surfacing (2) (2) 3.65Crusher run or fill or waste (2) (2) 8.23Terrazzo and exposed aggregates (2) (2) 14.17Other coarse and fine aggregates 2,340 14,100 6.06
Total or average 2,790 16,400 5.86Agricultural:
Limestone 152 849 5.59Poultry grit and mineral food (3) (3) 43.53Other agricultural uses 16 344 21.50
Total or average 168 1,190 7.10
Unspecified:4
Reported 4,000 22,200 5.56Estimated 2,200 14,000 6.39
Total or average 6,180 36,200 5.85Grand total or average 10,900 68,300 6.27
W Withheld to avoid disclosing company proprietary data; included with "Other coarse aggregates."1Data are rounded to no more than three significant digits, except unit value; may not add to totals shown.2Withheld to avoid disclosing company proprietary data; included in "Total or average."3Withheld to avoid disclosing company proprietary data; included with "Other agricultural uses."4Reported and estimated production without a breakdown by end use.

TABLE 4a
MINNESOTA: CRUSHED STONE SOLD OR USED BY PRODUCERS IN 2003, BY USE AND DISTRICT1, 2
(Thousand metric tons and thousand dollars)
District 2 District 3 District 4Use Quantity Value Quantity Value Quantity Value
Construction:
Coarse aggregate (+1½ inch)3 -- -- -- -- W W
Coarse aggregate, graded4 -- -- -- -- W W
Fine aggregate (-⅜ inch)5 -- -- -- -- W W
Coarse and fine aggregates6 -- -- -- -- W W
Agricultural7 -- -- -- -- (8) (8)
Other miscellaneous uses -- -- -- -- -- --
Unspecified:9
Reported -- -- 1,470 8,890 913 5,210Estimated 3 17 320 2,000 600 3,700
Total 3 17 1,780 10,900 1,750 11,000District 5 District 6
Quantity Value Quantity ValueConstruction:
Coarse aggregate (+1½ inch)3 59 1090 W W
Coarse aggregate, graded4 W W 40 191
Fine aggregate (-⅜ inch)5 W W W W
Coarse and fine aggregates6 W W 291 1,110
Agricultural7 W W W WOther miscellaneous uses -- -- 5 9
Unspecified:9
Reported 1,470 7,290 -- --Estimated 79 490 810 5,100
Total 5,110 33,000 1,240 6,880W Withheld to avoid disclosing company proprietary data; included in "Total." -- Zero.1Data are rounded to no more than three significant digits; may not add to totals shown.2No crushed stone produced in District 1.3Includes filter stone, macadam, riprap and jetty stone, and other coarse aggregates.4Includes bituminous aggregate (coarse), bituminous surface-treatment aggregate, concrete aggregate (coarse), railroad ballast, and other graded coarse aggregates.5Includes screening (undesignated), stone sand bituminous mix or seal, and other fine aggregate.6Includes crusher run (select material or fill), graded road base or subbase, terrazzo and exposed aggregate,unpaved road surfacing, and other coarse and fine aggregates.7Includes agricultural limestone, poultry grit and mineral food, and other agricultural uses.8Withheld to avoid disclosing company proprietary data; included in "Unspecified: Reported."9Reported and estimated production without a breakdown by end use.

TABLE 4b
MINNESOTA: CRUSHED STONE SOLD OR USED BY PRODUCERS IN 2004, BY USE AND DISTRICT1, 2
(Thousand metric tons and thousand dollars)
District 2 District 3 District 4Use Quantity Value Quantity Value Quantity Value
Construction:
Coarse aggregate (+1½ inch)3 -- -- -- -- W W
Coarse aggregate, graded4 -- -- -- -- W W
Fine aggregate (-⅜ inch)5 -- -- -- -- W W
Coarse and fine aggregates6 -- -- -- -- W W
Agricultural7 -- -- -- -- W W
Unspecified:8
Reported -- -- 1,610 9,770 948 5,310Estimated 3 17 360 2,300 680 4,300
Total 3 17 1,970 12,000 2,050 13,200District 5 District 6
Quantity Value Quantity ValueConstruction:
Coarse aggregate (+1½ inch)3 W W W W
Coarse aggregate, graded4 W W W W
Fine aggregate (-⅜ inch)5 W W W W
Coarse and fine aggregates6 W W W W
Agricultural7 W W W W
Unspecified:8
Reported 1,440 7,140 -- --Estimated 67 420 1,100 7,000
Total 5,210 33,600 1,670 9,530W Withheld to avoid disclosing company proprietary data; included in "Total." -- Zero.1Data are rounded to no more than three significant digits; may not add to totals shown.2No crushed stone produced in District 1.3Includes filter stone, macadam, riprap and jetty stone, and other coarse aggregates.4Includes bituminous aggregate (coarse), bituminous surface-treatment aggregate, concrete aggregate (coarse), railroad ballast, and other graded coarse aggregates.5Includes screening (undesignated), stone sand bituminous mix or seal, stone sand (concrete), and other fine aggregate.6Includes crusher run or fill or waste, graded road base or subbase, terrazzo and exposed aggregate,unpaved road surfacing, and other coarse and fine aggregates.7Includes agricultural limestone, poultry grit and mineral food, and other agricultural uses.8Reported and estimated production without a breakdown by end use.

TABLE 5aMINNESOTA: CONSTRUCTION SAND AND GRAVEL SOLD OR USED IN 2003,
BY MAJOR USE CATEGORY1
Quantity(thousand Value Unit
Use metric tons) (thousands) valueConcrete aggregate (including concrete sand) 8,460 $54,000 $6.39Plaster and gunite sands 135 1,670 12.34Concrete products (blocks, bricks, pipe, decorative, etc.) 177 2,090 11.79Asphaltic concrete aggregates and other bituminous mixtures 4,500 27,500 6.12Road base and coverings 7,780 25,000 3.22Road and other stabilization (cement and lime) 418 2,430 5.80Fill 4,150 8,640 2.08Snow and ice control 218 997 4.58
Other miscellaneous uses2 90 631 6.99
Unspecified:3
Reported 10,800 41,000 3.78Estimated 12,000 48,000 3.94
Total or average 48,900 212,000 4.331Data are rounded to no more than three significant digits, except unit value; may not add to totals shown.2Includes roofing granules, railroad ballast, and filtration.3Reported and estimated production without a breakdown by end use.

TABLE 5bMINNESOTA: CONSTRUCTION SAND AND GRAVEL SOLD OR USED IN 2004,
BY MAJOR USE CATEGORY1
Quantity(thousand Value Unit
Use metric tons) (thousands) valueConcrete aggregate (including concrete sand) 9,500 $61,200 $6.44Plaster and gunite sands 103 666 6.43Concrete products (blocks, bricks, pipe, decorative, etc.) 208 2,010 9.64Asphaltic concrete aggregates and other bituminous mixtures 4,520 22,300 4.93
Road base and coverings2 9,980 29,400 2.95Fill 4,540 10,900 2.39Snow and ice control 116 456 3.93Roofing granules 14 108 7.52
Other miscellaneous uses3 62 366 5.85
Unspecified:4
Reported 13,900 58,500 4.21Estimated 12,000 49,000 4.11
Total or average 54,900 235,000 4.281Data are rounded to no more than three significant digits; may not add to totals shown.2Includes road and other stabilization (cement and lime).3Includes filtration and railroad ballast.4Reported and estimated production without a breakdown by end use.

TABLE 6a
MINNESOTA: CONSTRUCTION SAND AND GRAVEL SOLD OR USED IN 2003, BY USE AND DISTRICT1
(Thousand metric tons and thousand dollars)
District 1 District 2 District 3Use Quantity Value Quantity Value Quantity Value
Concrete aggregate (including concrete sand) 961 5,450 436 2,230 2,130 11,000
Concrete products (blocks, bricks, pipe, decorative, etc.)2 W W W W 82 1,210Asphaltic concrete aggregates and other bituminous mixtures W W 143 450 1,830 6,830
Road base and coverings3 1,290 3,250 620 2,110 3,070 11,600Fill 308 743 111 235 1,230 1,940Snow and ice control W W 22 59 36 170
Other miscellaneous uses4 605 1,370 38 288 55 307
Unspecified:5
Reported 774 2,320 1,140 3,280 2,060 9,330Estimated 2,500 9,600 1,500 5,800 3,000 11,000
Total 6,480 22,700 3,980 14,500 13,500 53,800District 4 District 5 District 6
Quantity Value Quantity Value Quantity ValueConcrete aggregate (including concrete sand) 337 1,890 3,490 26,400 533 3,800
Concrete products (blocks, bricks, pipe, decorative, etc.)2 W W W W W WAsphaltic concrete aggregates and other bituminous mixtures 416 2,740 899 14,100 159 997
Road base and coverings3 1,230 3,650 522 2,740 281 1,160Fill 220 729 2,130 4,550 117 281Snow and ice control 8 31 W W 43 147
Other miscellaneous uses4 24 181 261 2,610 40 352
Unspecified:5
Reported 259 1,250 716 2,640 39 326Estimated 1,500 6,300 1,400 6,000 2,200 8,600
Total 3,970 16,800 9,460 59,000 3,370 15,700Unspecified district Quantity Value
Concrete aggregate (including concrete sand) 322 902
Concrete products (blocks, bricks, pipe, decorative, etc.)2 -- --Asphaltic concrete aggregates and other bituminous mixtures W W
Road base and coverings3 1,180 2,890Fill 1 6Snow and ice control -- --
Other miscellaneous uses4 463 1,040
Unspecified:5
Reported 5,860 21,900Estimated -- --
Total 7,820 26,700W Withheld to avoid disclosing company proprietary data; included in "Other miscellaneous uses." -- Zero. 1Data are rounded to no more than three significant digits; may not add to totals shown.2Includes plaster and gunite sands.3Includes road and other stabilization (cement and lime).4Includes filtration, roofing granules, and railroad ballast.5Reported and estimated production without a breakdown by end use.

TABLE 6b
MINNESOTA: CONSTRUCTION SAND AND GRAVEL SOLD OR USED IN 2004, BY USE AND DISTRICT1
(Thousand metric tons and thousand dollars)
District 1 District 2 District 3Use Quantity Value Quantity Value Quantity Value
Concrete aggregates (including concrete sand) 1,470 8,580 466 1,660 2,410 14,400
Concrete products (blocks, bricks, pipe, decorative, etc.)2 W W 30 269 W WAsphaltic concrete aggregates and other bituminous mixtures W W 405 1,420 1,970 8,260
Road base and coverings3 1,650 4,000 1,140 3,820 3,840 12,000Fill 470 1,050 69 269 1,330 3,440Snow and ice control W W 21 80 12 29
Other miscellaneous uses4 734 1,830 -- -- 140 737
Unspecified:5
Reported 3,580 14,900 971 4,250 4,590 20,100Estimated 2,100 8,400 3,000 11,000 2,200 9,400
Total 9,960 38,700 6,060 22,800 16,500 68,300District 4 District 5 District 6
Quantity Value Quantity Value Quantity ValueConcrete aggregates (including concrete sand) 463 2,610 3,560 26,900 945 6,560
Concrete products (blocks, bricks, pipe, decorative, etc.)2 18 111 W W W WAsphaltic concrete aggregates and other bituminous mixtures 713 5,150 590 4,900 W W
Road base and coverings3 805 2,570 637 3,220 276 1,160Fill 480 1,540 1,820 3,920 368 643Snow and ice control 7 24 W W 33 80
Other miscellaneous uses4 12 122 167 1,870 147 956
Unspecified:5
Reported 329 1,390 687 3,290 78 507Estimated 1,500 6,500 1,500 6,500 1,800 7,700
Total 4,300 20,000 8,960 50,600 3,670 17,600Unspecified districts Quantity Value
Concrete aggregates (including concrete sand) 183 403
Concrete products (blocks, bricks, pipe, decorative, etc.)2 -- --Asphaltic concrete aggregates and other bituminous mixtures 27 60
Road base and coverings3 1,630 2,690Fill -- --Snow and ice control -- --
Other miscellaneous uses4 -- --
Unspecified:5
Reported 3,640 14,000Estimated -- --
Total 5,480 17,200W Withheld to avoid disclosing company proprietary data; included in "Other miscellaneous uses." -- Zero. 1Data are rounded to no more than three significant digits; may not add to totals shown.2Includes plaster and gunite sands.3Includes road and other stabilization (cement and lime).4Includes filtration, railroad ballast, and roofing granules.5Reported and estimated production without a breakdown by end use.