the microbiology of safe food || microbiological risk assessment
TRANSCRIPT
MICROBIOLOGICAL RISK
ASSESSMENT
Changes in food processing techniques, food distribution and the emer- gence of new foodborne pathogens will change the epidemiology of foodborne diseases. Therefore new strategies are required for evaluating and managing food safety risks. Microbiological Risk Assessment (MRA) generates models which will enable the changes in food processing, dis- tribution and consumption to be assessed with regard to their influence on food poisoning potential.
Food safety must be ensured by the proper design of the food pro- duct and the production process. This means that the optimal interac- tion needs to be assured between intrinsic and extrinsic parameters (which are appropriate for the product’s shelf life) as well as condi- tions for handling, storage, preparation and use. As previously out- lined the assured method of controlling hazards is HACCP (Section 7.3). This should not be confused with MRA which is principally a reg- ulatory activity. MRA is the stepwise analysis of hazards that may be associated with a particular type of food product, permitting an estima- tion of the probability of occurrence of adverse effects on health from consuming the product in question (Notermans & Mead 1996). It is sometimes referred to as ‘Quantitative Microbial Risk Assessment’ (Haas et al. 1999).
MRA is not designed to be performed by food companies, although they will be able to contribute data and experience to some of the steps. The primary role of the food companies is to manage the manufacture of safe foods by applying the appropriate control measures. Safety concepts need to be built into the development of food products, for example through HACCP implementation. These in turn must be incorporated into Good Manufacturing Practices, Good Hygienic Practices and Total Quality Management (Sections 7.9 and 7.11). MRA should provide better infor- mation for the development of HACCP schemes.
The Microbiology of Safe FoodS.J. Forsythe
Copyright © 2000 by Blackwell Publishing Ltd
336 The Microbiology of Safe Food
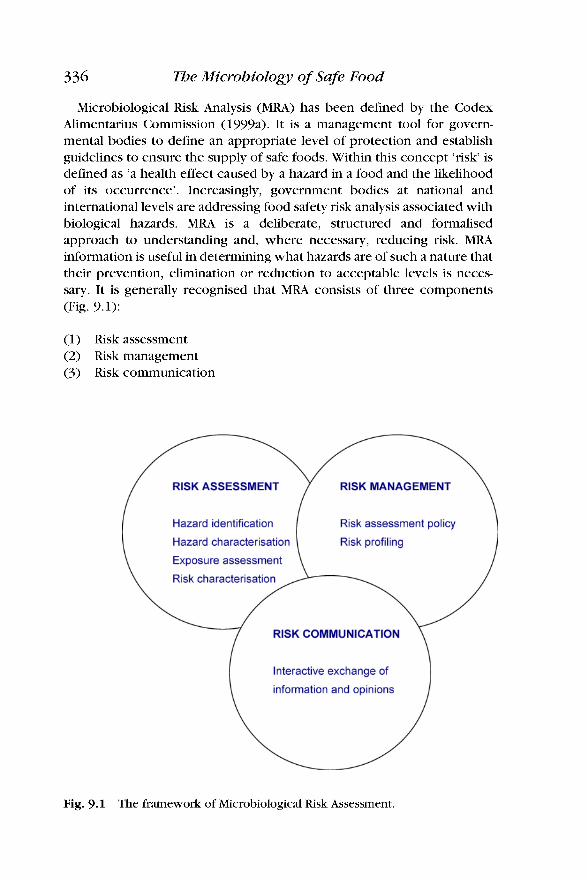
Microbiological Risk Analysis (MRA) has been defined by the Codex Alimentarius Commission (1999a). It is a management tool for govern- mental bodies to define an appropriate level of protection and establish guidelines to ensure the supply of safe foods. Within this concept ‘risk is defined as ‘a health effect caused by a hazard in a food and the likelihood of its occurrence’. Increasingly, government bodies at national and international levels are addressing food safety risk analysis associated with biological hazards. MRA is a deliberate, structured and formalised approach to understanding and, where necessary, reducing risk. MRA information is useful in determining what hazards are of such a nature that their prevention, elimination or reduction to acceptable levels is neces- sary. It is generally recognised that MRA consists of three components (Fig. 9.1):
(1) Risk assessment (2 ) Risk management (3) Risk communication
Fig. 9.1 The framework of Microbiological Risk Assessment.

Micro biological Risk Assessment 337
9.1 Risk assessment (RA)
Risk assessment is a scientific approach to estimating a risk and to understanding the factors that influence it. Starting with a statement of purpose or problem formulation, the process as defined by Codex is composed of elements:
Statement of purpose of risk assessment Hazard identification Exposure assessment Hazard characterisation (including a dose-response assessment) Risk characterisation Production of a formal report
Figure 9.2 shows the sequence of steps. The knowledge in each step is combined to represent a cause-and-effect chain from the prevalence and concentration of the pathogen to the probability and magnitude of health effects (Lammerding & Paoli 1997). In risk assessment, ‘risk consists of both the probability and impact of disease. Therefore risk reduction can be achieved either by reducing the probability of disease or by reducing its severity.
9.1.1 Statement of purpose
The specific purpose of the risk assessment should be clearly stated. The output form and possible output alternatives should be defined. This stage refers to problem formulation. During this stage, the cause of concern and the goals, breadth and focus of the risk assessment should be defined. The statement may also include data requirements, as they may vary depend- ing on the focus and use of the risk assessment and the questions relating to uncertainties that need resolving. Output might, for example, take the form of an estimate of an annual occurrence of illness, or an estimate of annual rate of illness per 100 000 population, or an estimate of the rate of human illness per eating occurrence.
9.1.2 Hazard identification
Hazard identification consists of the identification of biological, chemical and physical agents (microorganisms and toxins) capable of causing adverse health effects which may be present in a particular food or group of foods. The purpose of hazard identification is to identify the micro- organism or microbial toxin of concern and to evaluate whether the microorganism or the toxin is a potential hazard when present in food.

338 The Microbiology of Safe Food
STATEMENT OF PURPOSE
HAZARD IDENTlFlCATlON
Identification of microorganisms capable
of causing adverse health effects
+ EXPOSURE ASSESSMENT
Evaluation of the degree of
intake likely to occur
f HAZARD CHARACTERISATION
Evaluation of the nature of the
adverse effects associated with
microbiological hazards, which may
be present in food. A dose-response
assessment should be performed if
the data are obtainable
Estimate of the adverse effects likely
to occur in a given population, including
v
PRODUCTION OF A FORMAL REPORT
Fig. 9.2 Risk assessment flowchart (adapted from Notermans et al. 1996).
Information on potentially hazardous organisms can be obtained from government surveillance studies and similar sources (for example ICMSF publications). The information may describe growth and death conditions (pH, a,, D values, etc.). Microorganisms causing foodborne illness are given in Chapter 5 and their relevance in particular foods in Table 7.6. The key to hazard identification is the availability of public health data and a
Micro biological Risk Assessment 339
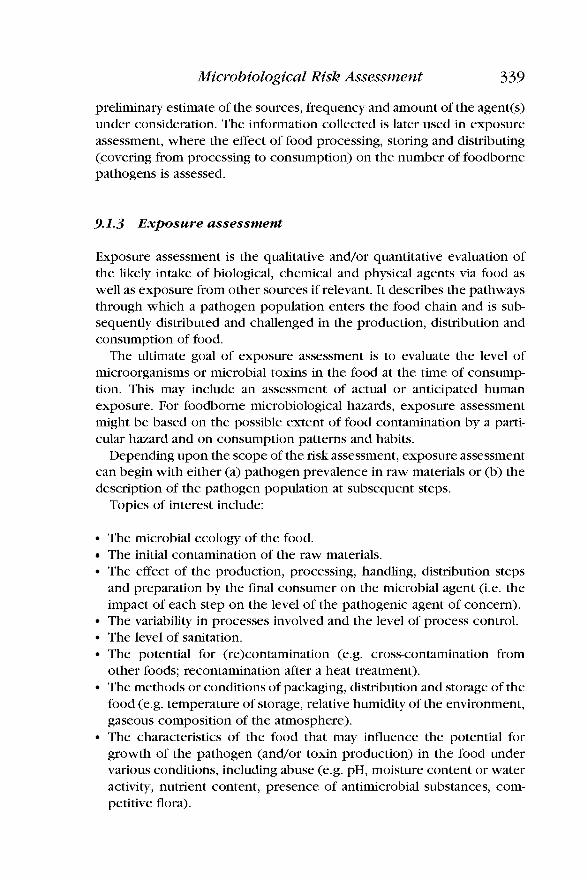
preliminary estimate of the sources, frequency and amount of the agent(s) under consideration. The information collected is later used in exposure assessment, where the effect of food processing, storing and distributing (covering from processing to consumption) on the number of foodborne pathogens is assessed.
9.1.3 Exposure assessment
Exposure assessment is the qualitative and/or quantitative evaluation of the likely intake of biological, chemical and physical agents via food as well as exposure from other sources if relevant. It describes the pathways through which a pathogen population enters the food chain and is sub- sequently distributed and challenged in the production, distribution and consumption of food.
The ultimate goal of exposure assessment is to evaluate the level of microorganisms or microbial toxins in the food at the time of consump- tion. This may include an assessment of actual or anticipated human exposure. For foodborne microbiological hazards, exposure assessment might be based on the possible extent of food contamination by a parti- cular hazard and on consumption patterns and habits.
Depending upon the scope of the risk assessment, exposure assessment can begin with either (a) pathogen prevalence in raw materials or (b) the description of the pathogen population at subsequent steps.
Topics of interest include:
The microbial ecology of the food. The initial contamination of the raw materials. The effect of the production, processing, handling, distribution steps and preparation by the final consumer on the microbial agent (i.e. the impact of each step on the level of the pathogenic agent of concern). The variability in processes involved and the level of process control. The level of sanitation. The potential for (re)contamination (e.g. cross-contamination from other foods; recontamination after a heat treatment). The methods or conditions of packaging, distribution and storage of the food ( e g temperature of storage, relative humidity of the environment, gaseous composition of the atmosphere). The characteristics of the food that may influence the potential for growth of the pathogen (and/or toxin production) in the food under various conditions, including abuse (e.g. pH, moisture content or water activity, nutrient content, presence of antimicrobial substances, com- petitive flora).
340 The Microbiology of Safe Food
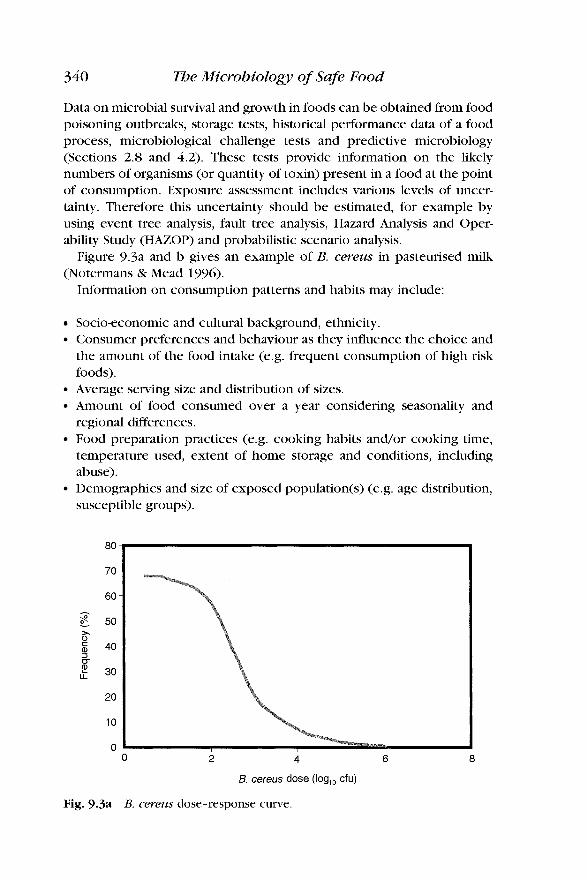
Data on microbial survival and growth in foods can be obtained from food poisoning outbreaks, storage tests, historical performance data of a food process, microbiological challenge tests and predictive microbiology (Sections 2.8 and 4.2). These tests provide information on the likely numbers of organisms (or quantity of toxin) present in a food at the point of consumption. Exposure assessment includes various levels of uncer- tainty. Therefore this uncertainty should be estimated, for example by using event tree analysis, fault tree analysis, Hazard Analysis and Oper- ability Study (HAZOP) and probabilistic scenario analysis.
Figure 9.3a and b gives an example of B. cereus in pasteurised milk (Notermans & Mead 1996).
Information on consumption patterns and habits may include:
Socio-economic and cultural background, ethnicity. Consumer preferences and behaviour as they influence the choice and the amount of the food intake ( e g frequent consumption of high risk foods). Average serving size and distribution of sizes. Amount of food consumed over a year considering seasonality and regional differences. Food preparation practices ( e g cooking habits and/or cooking time, temperature used, extent of home storage and conditions, including abuse). Demographics and size of exposed population(s) (e.g. age distribution, susceptible groups).
80
70
60
50
f 40
30
20
10
0
h
> 0
3 m
0 2 4 6 8
B. cereus dose (log,, cfu)
Fig. 9.3a B. cereus dose-response curve

Micro biological Risk Assessment 341
h s v
a, m m a, m 0 ._
90
80
70
60
50
40
30
20
10
0 0 2 4 6 8
B. cereus dose (log,, cfu)
Fig. 9.3b B. cereus disease response curve
9.1.4 Hazard characterisation
Hazard characterisation is the qualitative and/or quantitative evaluation of the nature of the adverse effects associated with biological, chemical and physical agents that may be present in food. It may include a dose- response assessment if data are available. The purpose of hazard char- acterisation is to provide an estimate of the nature, severity and duration of the adverse effects associated with harmful agents in food. Factors important to consider relate to the microorganisms, the dynamics of infection and the sensitivity of the host.
A dose-response assessment is used to translate the final exposure to a pathogen population into a health response in the population of con- sumers. Important factors are the physiology and the pathogenicity/ virulence of the microorganism, the dynamics of infection and the host susceptibility. There is currently a paucity of data concerning pathogen- specific responses and the effect of the host’s immunocompetence on the pathogen-specific responses. When data are obtainable, a dose-response assessment can be performed.
Factors relating to the microorganism may include:
Microbial replication; generation time Virulence factors; toxin production, attachment factors, antigenic
Microbial adaptation Antigenic variation
properties, immune evasion properties

342 The Microbiology of Safe Food
Tolerance to adverse conditions Acquisition of new traits through DNA uptake (i.e. antibiotic resistance)
Factors related to the microorganism's infectivity include:
Rate of infection Latency Disease pattern; incubation period, severity, persistence
Host-related factors include:
Immune status Susceptibility; use of antacids and antibiotics
Interactions between host, microorganism and food matrix include:
Stomach pH; increased due to age and use of antacids Stomach residence time; short residence time for liquids Acid tolerance; pre-exposure to stress conditions inducing stress response and increased acid resistance, entrapment in fatty material
A dose-response assessment determines the relationship between the magnitude of exposure (dose) to the pathogen and the severity and/or frequency of adverse health effects (response). Sources of information include:
(1) Foodborne disease analysis (2 ) Population characteristic surveys (3) Animal trials (4) Human volunteer studies
The dose-response relationship can be described using beta-Poisson distribution and exponential distribution. The beta-Poisson distribution is described by the equation:
pi = 1 -(l+N/B)-"
where: Pi is the probability of infection, Nis the exposure (pathogen level in colony-forming units) and a and p are coefficients specific to the pathogen.
This empirical model is particularly effective for describing dose- response relations when assessing low levels of bacterial pathogens. It generates a sigmoid dose-response relationship that assumes no threshold

Micro biological Risk Assessment 343
value for infection (Figs 9.3b and 9.4). Instead it assumes that there is a small but finite risk that an individual can become infected after exposure to a single cell of a bacterial pathogen. These values are different from the minimum infectious dose values commonly given (Table 7.7).
100 h s ._ 5 80 v
c 0 a, S
0 >
Q
Q
L
E 60
c ._ - ._ m 40 2 a
20
0 0 2 4 6
Salmonella dose (log,, cfu)
Fig. 9.4 Salmonella probability of infection curve.
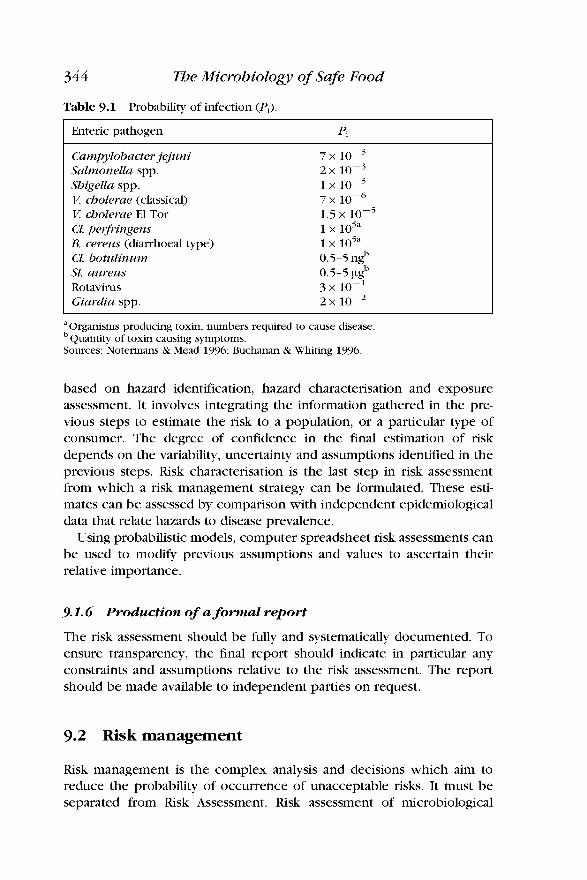
From the human volunteer studies probability of infection (Pi> values have been determined for a number of foodborne pathogens and related organisms (Table 9.1, cf Table 7.7).
Table 9.1 gives the Pi for various foodborne pathogens and other infectious organisms. For example there is a 1 in 2000 chance of an individual becoming infected from a single salmonella cell compared to a 1 in 7 million chance from 17. cholerae. The problem with human volunteer studies is that they are almost always conducted with healthy, young adults, usually men. These are not the most vulnerable members of society (elderly and very young). Since the minimum infective dose (MID) may vary widely from person to person, the MID concept may not be appropriate for risk assessment in a population. See also Section 9.5.3 concerning salmonella infectious dose estimates.
9.1.5 Risk characterisation
Risk characterisation is the quantitative and/or qualitative estimation including attendant uncertainties of the probability of occurrence and severity of known or potential adverse health effects in a given population
344 The Microbiology of Safe Food
Table 9.1 Probability of infection (Pd
I Enteric pathogen pi
Campylobacter jejuni Salmonella spp. Shigella spp. ‘v; cholerae (classical) ‘v; cholerae El Tor Cl. perfringens B. cereus (diarrhoea1 type) Cl. botulinum St. aureus Rotavirus Giardia spp.
7~ lor3 2 x lor3 1 x lor3 7 x lor6 1.5 x lor5 1 x 1 x
3 x lor1 2 x lor2
0.5-5 ng” 0.5-5 pg”
a Organisms producing toxin, numbers required to cause disease
Sources: Notermans & Mead 1996; Buchanan & Whiting 1996. Quantity of toxin causing symptoms.
based on hazard identification, hazard characterisation and exposure assessment. It involves integrating the information gathered in the pre- vious steps to estimate the risk to a population, or a particular type of consumer. The degree of confidence in the final estimation of risk depends on the variability, uncertainty and assumptions identified in the previous steps. Risk characterisation is the last step in risk assessment from which a risk management strategy can be formulated. These esti- mates can be assessed by comparison with independent epidemiological data that relate hazards to disease prevalence.
Using probabilistic models, computer spreadsheet risk assessments can be used to modify previous assumptions and values to ascertain their relative importance.
9.1.6 Production of a formal report
The risk assessment should be fuuy and systematically documented. To ensure transparency, the final report should indicate in particular any constraints and assumptions relative to the risk assessment. The report should be made available to independent parties on request.
9.2 Risk management
Risk management is the complex analysis and decisions which aim to reduce the probability of occurrence of unacceptable risks. It must be separated from Risk Assessment. Risk assessment of microbiological
Micro biological Risk Assessment 345
hazards is a scientific process aimed at identlfying and characterising a microbiological hazard and estimating the risk of that hazard to a popu- lation. Risk Management is a separate process aimed at identlfying options for action(s) needed to manage that risk and it has a policy function. If required, it may select and implement appropriate control options, including regulatory measures. It is required when epidemiological and surveillance data demonstrate that specific foods are a possible hazard factor towards consumer health due to the presence of hazardous microorganisms or toxic compounds from microbial origin. Governmental risk managers must decide on appropriate control options to manage this risk. In order to understand the risk for consumers more explicitly, the risk managers may ask expert food scientists to perform an MRA.
9.2.1 Risk assessment policy
Guidelines for value judgement and policy choices which may need to be applied at specific decision points in the risk assessment process are known as risk assessment policy. Risk assessment policy setting is risk management responsibility, which should be carried out in full colla- boration with risk assessors, and which serves to protect the scientific integrity of the risk assessment. The guidelines should be documented so as to ensure consistency and transparency. Examples of risk assessment policy setting are establishing the population(s) at risk, establishing criteria for ranking hazards and guidelines for application of safety factors.
9.2.2 Risk profiling
Risk profiling is the process of describing a food safety problem and its context, in order to identify those elements of the hazard or risk relevant to various risk management decisions. The risk profile would include identlfying aspects of hazards relevant to prioritising and setting the risk assessment policy and aspects of the risk relevant to the choice of safety standards and management options. A typical risk profile might include the following: a brief description of the situation, product or commodity involved; the values expected to be placed at risk, e.g. human health, economic concerns; potential consequences; consumer perception of the risks and the distribution of risks and benefits.
9.3 Risk communication
Risk communication is the interactive exchange of information and opinions concerning risk among risk assessors, risk managers, consumers and other interested parties. It also deals with communicating the out-

346 The Microbiology of Safe Food
come of the decision making process to the consumers using appropriate tools and channels.
9.4 Food Safety Objectives
MRA is primarily the prerogative of government bodies that have access to all necessary data and research findings. Although it is recognised that, with regard to food microbiology, the formalised approach to risk analysis is in its infancy, it is likely that in the near future MRA have a greater importance in the determination of the level of consumer protection that a government considers necessary and achievable. For practical imple- mentation in specific sectors of the food chain, it is the responsibility of governmental authorities to translate the expected level of protection into food safety objectives. Such objectives delineate the specific target(s) that any food operator concerned should endeavour to achieve through appropriate interventions.
Food safety objectives are a statement of the maximum level of a microbiological hazard in a food considered acceptable for human con- sumption. Whenever possible, food safety objectives should be quantita- tive and verifiable. Food safety objectives as defined by governmental authorities represent the minimum target on which food operators base their own approach (see Fig. 1.4). The government’s food safety objec- tives may be adopted as such in the form of a company’s food safety requirements. Alternatively, depending on commercial factors, a company may wish to establish more demanding food safety requirements. Food safety requirements provide input to the food safety programme. They direct product and process planning, design and implementation of GMP, GHP, HACCP and quality assurance systems with the aim of fulfilling the food safety requirements.
There are several factors that strongly affect consumer exposure but which are poorly understood. These factors are:
Incidence of different pathogens in raw materials. Effect of processing conditions (including alternative technologies). Effect of distribution conditions (e.g. chilled chain). Recontamination during handling. Abuse by the consumer. Heterogeneous distribution of microorganisms within a food. Person-to-person transmission. Host effects: age, pregnancy, nutritional status, concurrent or recent
Food vehicle effects. infections, use of medication, immunological status.

Micro biological Risk Assessment 347
The most thoroughly documented MRA is the shelled eggs MRA by the Food Safety and Inspection Service (1998), which is summarised in Sec- tion 9.5.3.
9.5 Application of MRA
There are a few detailed examples of complete MRA in the literature (see Appendix for Web site of references). The following are abridged exam- ples to give an indication of the process.
9.5.1 Salmonella spp. in cooked chicken (Buchanan C Whiting 1996)
A three-stage example concerning Salmonella spp. in cooked chicken is described. In this process raw chicken is stored at 10°C for 48 hours before being cooked at 60°C for 3 minutes and then stored at 10°C for 72 hours before consumption. The 10°C stored temperature is in the ‘Danger Zone’ and represents mild temperature abuse (Section 7.6.2).
(1) Number of Salmonella spp. in raw chicken before cooking. The number of salmonella cells on raw chicken will vary, however an expected level of contamination is given in Fig. 9.5. The con- tamination range varies from no salmonella cells in 75% of samples to
Fig. 9.5 Distribution of salmonella in raw foods (Buchanan & Whiting 1996).
348 The Microbiology of Safe Food
1% containing 100 cells per gram of meat. The amount of salmonella growth at 10°C for 48 hours before cooking can be determined using growth models (Section 2.8) by assuming the meat pH is pH 7.0 and the sodium chloride level is 0.5%.
(2) Effect of cooking (GO"C, 3 minutes) on salmonella numbers in chicken. The decimal reduction time (D value) at 60°C is 0.4 min- utes. The effect of heat treatment on salmonella numbers can be calculated using the equation:
log (N> = log (No) - (VD)
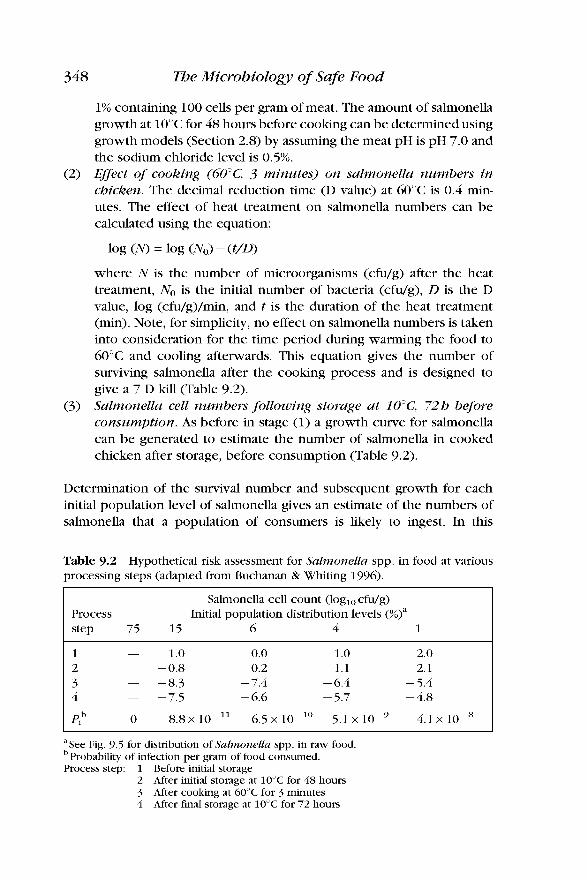
where N is the number of microorganisms (cfu/g) after the heat treatment, No is the initial number of bacteria (cfu/g), D is the D value, log (cfu/g)/min, and t is the duration of the heat treatment (min). Note, for simplicity, no effect on salmonella numbers is taken into consideration for the time period during warming the food to 60°C and cooling afterwards. This equation gives the number of surviving salmonella after the cooking process and is designed to give a 7 D kill (Table 9.2).
(3) Salmonella cell numbers following storage at lO"C, 72h before consumption. As before in stage (1) a growth curve for salmonella can be generated to estimate the number of salmonella in cooked chicken after storage, before consumption (Table 9.2).
Determination of the survival number and subsequent growth for each initial population level of salmonella gives an estimate of the numbers of salmonella that a population of consumers is likely to ingest. In this
Table 9.2 processing steps (adapted from Buchanan & Whiting 1996).
Hypothetical risk assessment for Salmonella spp. in food at various
Salmonella cell count (log,, cfu/g) Initial population distribution levels (%)" Process
step 75 15 6 4 1
1 - - 1.0 0.0 1.0 2.0 2 - -0.8 0.2 1.1 2.1
4 - -7.5 - 6.6 - 5.7 - 4.8 3 - -8.3 - 7.4 - 6.4 - 5.4
Pp 0 8 . 8 ~ 6.5 x lop1' 5.1 x lop9 4.1 x lops
aSee Fig. 9.5 for distribution of Salmonella spp. in raw food.
Process step: 1 Before initial storage Probability of infection per gram of food consumed.
2 After initial storage at 10°C for 48 hours 3 After cooking at 60°C for 3 minutes 4 After final storage at 10°C for 72 hours
Micro biological Risk Assessment 349
example, 1% of the chicken samples contained 100 salmonella cells per gram, giving a probability of infection (Pi) of 4.1 x lops& food consumed (see Section 9.1.4 for an explanation of Pi>. This means there was less than one cell surviving for every lOOOOg of food. Hence the salmonella risk associated with cooked chicken under these conditions of storage is minimal.
The above example can be used as a template to determine the effect of changing the cooking regime and storage conditions. For example, raising the initial storage temperature to 15°C and reducing the cooking time to 2 minutes (5 D kill) causes the probability of infectivity (Pi) to be unac- ceptably high (Table 9.3).
Table 9.3 Hypothetical risk assessment for Salmonella spp. in food at various processing steps after temperature abuse (adapted from Buchanan & Whiting 1996)
Salmonella cell count (log,, cfu/g) Initial population distribution levels (%)" Process
step 75 15 6 4 1
1 - - 1.0 0.0 1.0 2.0 2 - 1.6 2.6 3.6 4.6 3 - - 3.4 - 2.4 - 1.4 - 0.4 4 - 1.8 2.7 3.7 4.7
Pp 0 1.1 x lop1 4.1 x lop1 7 . 0 ~ lop1 8 . 6 ~ lop1
aSee Fig. 9.5 for distribution of Salmonella spp. in raw food
Process step: 1 Before initial storage Probability of infection per gram of food consumed.
2 After initial storage at 15°C for 48 hours 3 After cooking at 60°C for 2 minutes 4 After final storage at 15°C for 7 2 hours
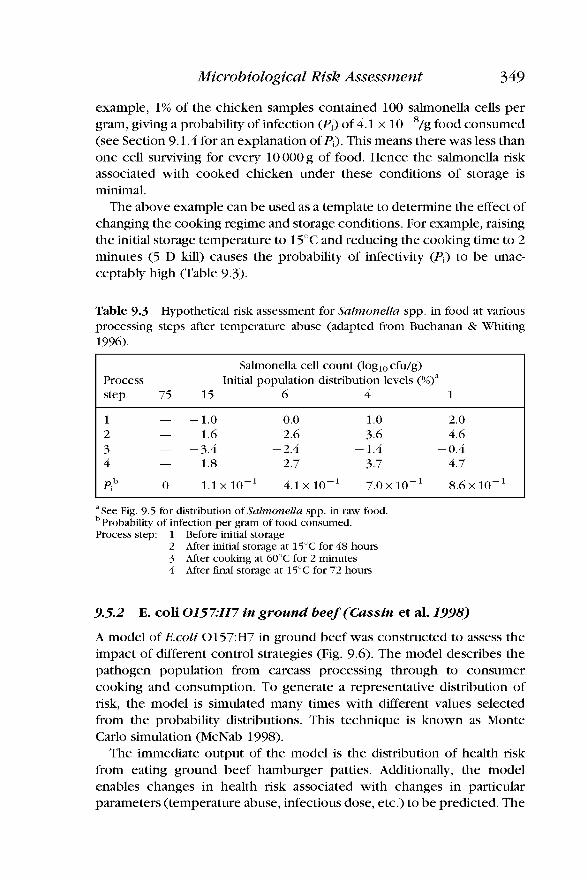
9.5.2 E . coli 0157H7 in ground beef (Cassin et al. 1998)
A model of E.coli 0157:H7 in ground beef was constructed to assess the impact of different control strategies (Fig. 9.6). The model describes the pathogen population from carcass processing through to consumer cooking and consumption. To generate a representative distribution of risk, the model is simulated many times with different values selected from the probability distributions. This technique is known as Monte Carlo simulation (McNab 1998).
The immediate output of the model is the distribution of health risk from eating ground beef hamburger patties. Additionally, the model enables changes in health risk associated with changes in particular parameters (temperature abuse, infectious dose, etc.) to be predicted. The

350 The Microbiology of Safe Food
Fig. 9.6 response for E. coli in hamburgers (adapted from Cassin et al. 1998).
Flow diagram for determining the exposure assessment and dose-

Micro biological Risk Assessment 35 1
model predicted a probability of haemolytic uraemic syndrome of 3.7 x lop6 and a probability of mortality of 1.9 x lop7 per meal for the very young. The average probability of illness was predicted to be reduced by 80% under a strategy of reducing microbial growth during the retail storage through a reduction in storage temperature (Table 9.4). This strategy was predicted to be more effective than the reduction in the concentration of the pathogen in cattle faeces.
Table 9.4 coli 0157:H7 following assumed compliance (Cassin et al. 1998).
Risk mitigation strategy, per cent reduction per meal illness from E.
Strategy Control variable Predicted reduction in illness (%)
(1) Storage temperature Maximum storage 80
(2 ) Pre-slaughter screening Concentration of E. 46
(3) Hamburger cooking Cooking temperature 16
temperature
coli 0157:H7 in faeces
Consumer information programme on cooking hamburgers
9.5.3
The Food Safety and Inspection Service (FSIS) have completed a 2-year comprehensive risk assessment of S. enteritidis in shell eggs which can be accessed from the Web (see Web pages Appendix for the URL). The model can also be downloaded from this site. It requires EXCEL (Micro- softm) and @RISK palisade Europe) to run.
S. enteritidis in shell eggs and egg products (FSIS)
The objectives were to:
Identify and evaluate potential risk reduction strategies Identify data needs Prioritise future data collection efforts
The risk assessment model consists of five modules (Fig. 9.7):
Eggproduction module: this estimates the number of eggs produced that are infected (or internally contaminated) with S. enteritidis. Shell eggprocessing and distribution module: this module follows the shell eggs from collection on the farm through processing, transporta- tion and storage. The eggs remain intact throughout this module. Therefore the primary factors affecting the S. enteritidis are the
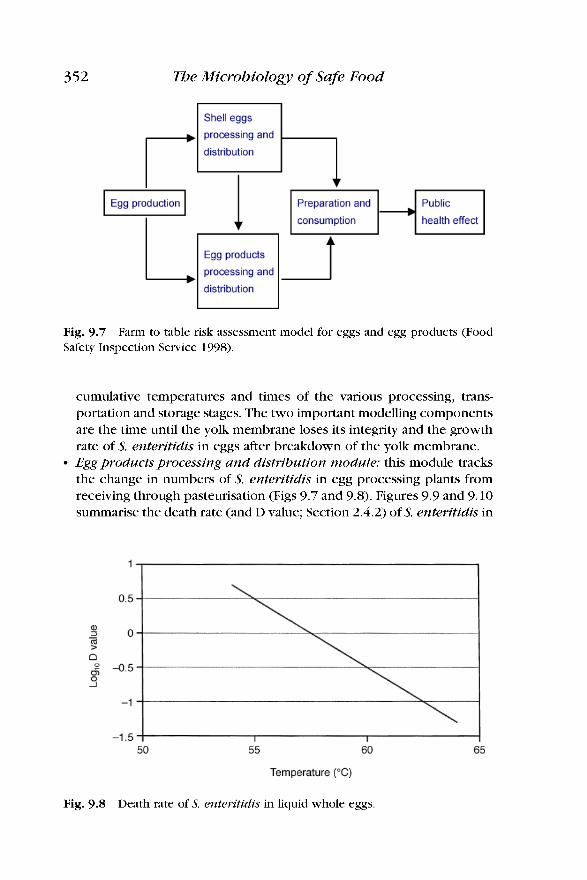
352 The Microbiology of Safe Food
Fig. 9.7 Farm to table risk assessment model for eggs and egg products (Food Safety Inspection Service 1998).
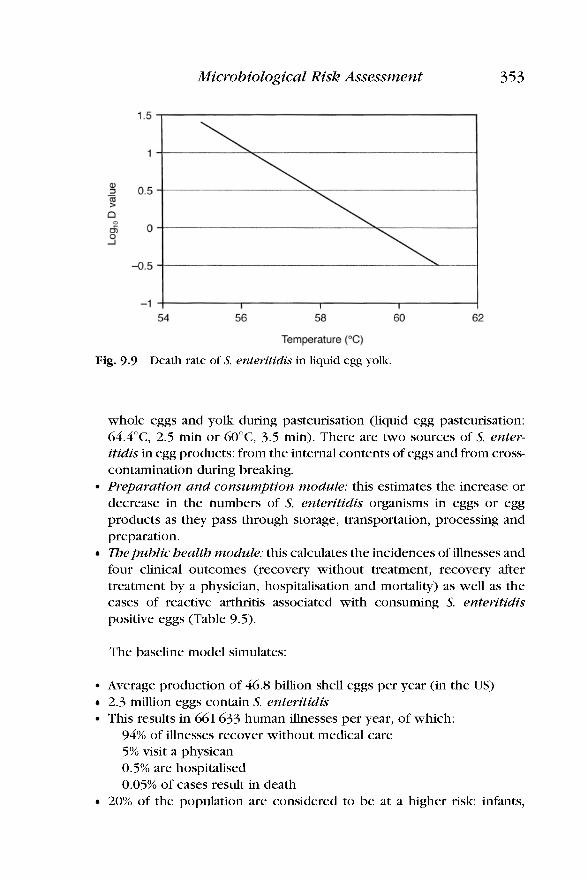
cumulative temperatures and times of the various processing, trans- portation and storage stages. The two important modelling components are the time until the yolk membrane loses its integrity and the growth rate of S. enteritidis in eggs after breakdown of the yolk membrane. Egg products processing and distribution module: this module tracks the change in numbers of S. enteritidis in egg processing plants from receiving through pasteurisation (Figs 9.7 and 9.8). Figures 9.9 and 9.10 summarise the death rate (and D value; Section 2.4.2) of S. enteritidis in
Fig. 9.8 Death rate of S. enteritidis in liquid whole eggs.
Micro biological Risk Assessment 353
Fig. 9.9 Death rate of S. enteritidis in liquid egg yolk.
whole eggs and yolk during pasteurisation (liquid egg pasteurisation: 64.4"C, 2.5 min or 60°C, 3.5 min). There are two sources of S. enter- itidis in egg products: from the internal contents of eggs and from cross- contamination during breaking. Preparation and consumption module: this estimates the increase or decrease in the numbers of S. enteritidis organisms in eggs or egg products as they pass through storage, transportation, processing and preparation. 7;bepublic health module: this calculates the incidences of illnesses and four clinical outcomes (recovery without treatment, recovery after treatment by a physician, hospitalisation and mortality) as well as the cases of reactive arthritis associated with consuming S. enteritidis positive eggs (Table 9.5).
The baseline model simulates:
Average production of 46.8 billion shell eggs per year (in the US) 2.3 million eggs contain S. enteritidis This results in 661 633 human illnesses per year, of which:
94% of illnesses recover without medical care 5% visit a physican 0.5% are hospitalised 0.05% of cases result in death
20% of the population are considered to be at a higher risk infants,

Fig
. 9.1
0
Liq
uid
egg
pro
duct
flo
w f
or
yea
r 19
96 (F
ood
Saf
ety
Insp
ecti
on
Ser
vice
199
8).

Micro biological Risk Assessment
Table 9.5 Public health module results
355
Category Mean
Normal population Exposed Ill Recover w/ no treatment Physician visit and recovery Hospitalised and recovered Death Reactive arthritis
Susceptible population Exposed Ill Recover w/ no treatment Physician visit and recovery Hospitalised and recovered Death Reactive arthritis
Total population Exposed Ill Recover w/ no treatment Physician visit and recovery Hospitalised and recovered Death Reactive arthritis
1 889 200 448 803 425 389
21 717 1 574
123 13 578
521 705 212 830 196 295
14491 1776
269 6 416
2 410 904 661 633 621 684
36 208 3 350
39 1 19 994
Source: Food Safety and Inspection Service (1998)
elderly, transplant patients, pregnant women, individuals with certain diseases.
The beta-Poisson model (Section 9.1.4) from Salmonella human volunteer feeding trials (1930- 1973) estimates a probability of infection of 0.2 from ingesting lo4 salmonella cells. Because an infectious dose does not necessarily lead to illness, the probability of infection is greater than the probability of illness. These data were obtained using serotypes other than S. enteritidis and hence may not be totally appropriate.
The baseline egg products model predicts that the probability is low that any cases of S. enteritidis will result from the consumption of pas- teurised egg products. However, the current FSIS time and temperature regulations do not provide sufficient guidance to the egg products industry for the large range of products the industry produces (Table 9.6). Time and temperature standards based on the amount of bacteria in the raw product, how the raw product will be processed and the intended use of the final product will provide greater protection to the consumers of egg products.

356 The Microbiology of Safe Food
Table 9.6 USDA minimum time and temperature requirements for three egg products.
Liquid egg Minimum temperature Minimum holding time product requirements ( O F ) requirements (minutes)
Albumen
Whole egg
Plain yolk
134 132 140
142 140
3.5 6.2
3.5
3.5 6.2
Source: Regulations Governing the Inspection of Eggs and Egg Products (7 CFR Part 59). May 1, 1991, USDA, FSIS, Washington, D.C. 20250.
The per cent reduction for total human illnesses was calculated for two scenarios differing from current practice within the shell egg processing and distribution module. The first scenario was that if all eggs were immediately cooled after lay to an internal temperature of 7.2"C (45"F), then maintained at this temperature, then a 12% reduction in human ill- nesses would be the result. Similarly, an 8% reduction in human illnesses would be the result if eggs were maintained at an ambient (i.e. air) tem- perature of 7.2"C (45°F) throughout shell egg processing and distribution.
9.5.4 L. monocytogenes (EC 1999)
The absence of agreed reference values for L. monocytogenes (except for dairy products) has led to controversy, especially intra-community trade of the EU where the lack of microbiological reference values has led to food products being declared unfit for human consumption because of non- quantified demonstration of L. monocytogenes contamination. Therefore MRA leading to the setting of food safety objectives was required and has been reported (EC 1999).
Although human listeriosis is mainly caused by a few serovars (4b and 1/ 2 a, b) it was concluded that a wide range of strains might cause serious disease. Additionally, since none of the typing methods discriminates pathogenic from nonpathogenic or less virulent strains, all L. mono- cytogenes should be regarded as potentially pathogenic.
The risk assessment of L. monocytogenes facilitates the classification of six food groupings relative to the organism's control (Table 9.7). Examples of products are:
Groups B and D: meat products such as cooked ham, wiener sausages or hot smoked fish, soft cheese made from pasteurised milk.

Micro biological Risk Assessment 357
Table 9.7 Grouping of ready-toeat food commodities relative to the control potential for Listeriu monocytogenes
A
B
Foods heat-treated to a listericidal level in the f i a l package
Heat-treated products that are handled after heat treatment. The products support growth of L. monocytogenes during the shelf life at the stipulated storage temperature
Lightly preserved products, not heat-treated. The products support growth of L. monocytogenes during the shelf life at the stipulated storage temperature
Heat-treated products that are handled after heat treatment. The products are stabilised against growth of L. monocytogenes during the shelf life at the stipulated storage temperature
Lightly preserved products, not heat-treated. The products are stabilised against growth of L. monocytogenes during the shelf life at the stipulated storage temperature
C
D
E
F Raw, ready-toeat foods
Groups C and E: cold smoked or gravid fish and meat, cheese made from
Group F: tartar, sliced vegetables and sprouts. unpasteurised milk.
Groups B and D, and C and E are separated according to the technology used.
A concentration of 100 L. monocytogenes cells& of food at the point of consumption is considered a low risk to consumers. However, due to the uncertainties related to this risk, levels lower than 100 cells& may be required for those foods in which listeria growth may occur. L. mono- cytogenes levels above 100 cfu/g can be achieved after in-food growth. Therefore, risk management should be focused on those foods which support L. monocytogenes growth.
Suggested levels of L. monocytogenes are:
(1)
(2 )
Food groups D, E and F: < 100 cfu/g throughout the shelf life and at point of consumption. Food groups A, B and C : not detectable in 25 g at time of production.
The food safety objective should be to keep the concentration of L. monocytogenes in food below lOOcfu/g and to reduce the fraction of foods with a concentration above 100 L. monocytogenes per gram sig- nificantly. In risk communication special attention should be addressed to consumer groups at increased risk (immunocompro-
358 The Microbiology of Safe Food
mised) which represent a considerable and growing section of the total population.
9.5.5 Salmonella spp. in cooked patty (Whiting 199 7)
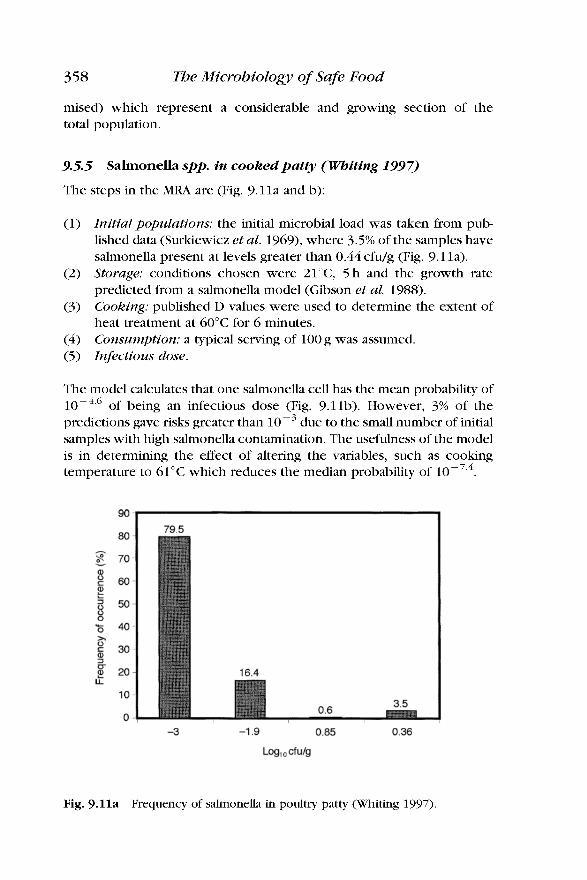
The steps in the MRA are (Fig. 9.1 la and b):
(1) Initial populations: the initial microbial load was taken from pub- lished data (Surkiewicz et al. 1969), where 3.5% of the samples have salmonella present at levels greater than 0.44 cfu/g (Fig. 9.1 la). Storage: conditions chosen were 21"C, 5 h and the growth rate predicted from a salmonella model (Gibson et al. 1988). Cooking: published D values were used to determine the extent of heat treatment at 60°C for 6 minutes. Consumption: a typical serving of 100 g was assumed.
(2)
(3)
(4) ( 5 ) Infectious dose.
The model calculates that one salmonella cell has the mean probability of of being an infectious dose (Fig. 9.11b). However, 3% of the
predictions gave risks greater than 10 due to the small number of initial samples with high salmonella contamination. The usefulness of the model is in determining the effect of altering the variables, such as cooking temperature to 61°C which reduces the median probability of
4.6
Fig. 9.11a Frequency of salmonella in poultry patty (Whiting 1997).

Micro biological Risk Assessment 359
Fig. 9.llb (adapted from Whiting 1997).
Risk-assessment model for salmonella in a cooked poultry patty
9.5.6 Cl. botulinum in ready-to-eat chill stored food (Baird-Parker 1994)
Given the equation:
P, = P, + Pa + Ppa + P,
where:
P, = probability of contamination with psychrotrophic spores P, = probability of contamination from the environment Pa = probability of contamination during assembly Ppa = probability of contamination from packaging P, = probability of contamination from product ingredients
the probability of contamination with psychrotrophic spores is:
360 The Microbiology of Safe Food
P, = < lops + < lop7 + < lop9 + 0.8 x lop6 P, = lop6
In other words, 1 in 1 million. This example showed that contamination of the ingredients will
probably determine the contamination level of the final product. There- fore, if an unacceptable level of end-product contamination is found then the microbiological quality of the ingredients should be re-evaluated.