the michigan public high school context and - mackinac center
TRANSCRIPT

By Michael Van Beek, Daniel Bowen and Jonathan Mills
The Michigan Public high School conTexT and PerforMance rePorT card
The Michigan Public H
igh School Context and Perform
ance Report C
ard
A MAckinAc center report
© 2012 by the Mackinac center for public policy, Midland, Michigan
iSBn: 978-1-890624-80-4 | S2012-05
140 West Main Street p.o. Box 568 Midland, Michigan 48640
989-631-0900 Fax 989-631-0964 www.mackinac.org [email protected]
the Mackinac center for public policy is a nonpartisan research and educational institute dedicated to improving the quality
of life for all Michigan citizens by promoting sound solutions to state and local policy questions. the Mackinac center assists
policymakers, scholars, businesspeople, the media and the public by providing objective analysis of Michigan issues. the goal
of all center reports, commentaries and educational programs is to equip Michigan citizens and other decision makers to better
evaluate policy options. the Mackinac center for public policy is broadening the debate on issues that have for many years
been dominated by the belief that government intervention should be the standard solution. center publications and programs,
in contrast, offer an integrated and comprehensive approach that considers:
All Institutions. the center examines the important role of voluntary associations,
communities, businesses and families, as well as government.
All People. Mackinac center research recognizes the diversity of Michigan citizens and treats
them as individuals with unique backgrounds, circumstances and goals.
All Disciplines. center research incorporates the best understanding of economics, science, law,
psychology, history and morality, moving beyond mechanical cost‑benefit analysis.
All Times. center research evaluates long-term consequences, not simply short-term impact.
committed to its independence, the Mackinac center for public policy neither seeks nor accepts any government funding. the
center enjoys the support of foundations, individuals and businesses that share a concern for Michigan’s future and recognize the
important role of sound ideas. The Center is a nonprofit, tax‑exempt organization under Section 501(c) (3) of the internal revenue
code. For more information on programs and publications of the Mackinac center for public policy, please contact:
Mackinac center for public policy 140 West Main Street p.o. Box 568 Midland, Michigan 48640
989-631-0900 Fax 989-631-0964 www.mackinac.org [email protected]
The Mackinac Center for Public Policy
Guarantee of Quality Scholarship
The Mackinac Center for Public Policy is committed to delivering the highest quality and most reliable research on Michigan issues. The Center guarantees that all original factual data are true and correct and that information attributed to other sources is accurately represented.
The Center encourages rigorous critique of its research. If the accuracy of any material fact or reference to an independent source is questioned and brought to the Center’s attention with supporting evidence, the Center will respond in writing. If an error exists, it will be noted in an errata sheet that will accompany all subsequent distribution of the publication, which constitutes the complete and final remedy under this guarantee.
©2012 by the Mackinac Center for Public PolicyMidland, Michigan
By Michael Van Beek, Daniel Bowen and Jonathan Mills
The Michigan Public High School Context and Performance
Report Card


ContentsExecutive Summary ............................................................................................. iiiIntroduction .......................................................................................................... 1Why Another Report Card? ................................................................................. 2Data and Methods................................................................................................. 3Classifying Schools ............................................................................................... 5Selected Results .................................................................................................... 6The Complete Report Card ................................................................................ 18
The Michigan Public High School CAP Report Card: Alphabetical .........................19
The Michigan Public High School CAP Report Card: Ranked By Score ...................35
The Michigan Public High School CAP Report Card: Sorted by Locale ...................49
Appendix A: Notes on Testing Other Variables and Data Integrity .............................................................................................. 63Appendix B: Calculating CAP Scores and Letter Grades .................................. 66
Calculating CAP Scores ..............................................................................................66
Assigning Letter Grades ..............................................................................................67
Appendix C: Free and Reduced-Price Lunch Weights ....................................... 69Appendix D: Regression Results ........................................................................ 70Appendix E: Filtering the List of Michigan Public High Schools ..................... 72Appendix F: Locale Code Definitions ................................................................ 73About the Authors .............................................................................................. 76Acknowledgments .............................................................................................. 76
The Michigan Public High School Context and Performance Report Card i
Mackinac Center for Public Policy
The Michigan Public High School Context and Performance Report Card ii
Mackinac Center for Public Policy

Executive Summary*
Assessing a high school’s effectiveness is not straightforward. Comparing a school’s standardized test scores to those of other schools is one approach to measuring effectiveness, but a major objection to this method is that students’ test scores tend to be related to students’ “socioeconomic” status — family household income, for example, or parents’ educational background. These factors, however, are outside a school’s control.
The Michigan Public High School Context and Performance Report Card is an attempt to provide a better “apples-to-apples” comparison of public high schools by adjusting their students’ average standardized test scores to account for disparities in the socioeconomic status of their student populations.
Socioeconomic status in the Context and Performance (“CAP”) Report Card is measured by the percentage of a school’s students who qualify for a free or reduced-price lunch under the federal government’s National School Lunch Program. The standardized tests used in the report card are from the Michigan Merit Examination — including the ACT® test — taken by the schools’ 11th-graders from 2008 through 2011.
We used regression analysis to measure the relationship between student test results and subsidized-lunch counts in Michigan’s general education public high schools (schools focused on special education or alternative education were excluded from our analysis). We then determined whether each school’s student population performed better or worse than projected based on the school’s subsidized-lunch counts.
The resulting “CAP Score” for a school was above 100 if the school exceeded its projected performance and below 100 if the school fell short (the statewide average CAP Score was set at 100). Grades were assigned using a standard bell curve, with 10 percent of the schools receiving an A, 20 percent receiving a B, 40 percent receiving a C, 20 percent receiving a D and 10 percent receiving an F.
Star International Academy, a public charter school in Dearborn Heights, received the state’s highest CAP Score at 140.8 (an A), while Detroit’s Finney High School had the lowest CAP Score at 70.8 (an F). North Huron School had the highest CAP Score among conventional district-run high schools: 123.3 (an A). City Middle/High School in Grand Rapids received the highest CAP Score — 130.5 (an A) — among schools that use a selective admissions policy.
Following guidelines established by the U.S. Census Bureau and the National Center for Education Statistics, the high schools were divided into four major “locales”: city, suburb, town and rural. Public high schools located in towns had the highest average CAP Score among the four locale groups — 101.5. They were followed by rural (101), suburban (100) and city (98.9) high schools.
* citations provided in the main text.
The Michigan Public High School Context and Performance Report Card iii
Mackinac Center for Public Policy

It is important to remember that these CAP Scores and grades are relative. Each high school is assessed based on its performance compared to other high schools in the state; CAP Scores do not indicate how well these high schools compare to those in other states or countries. Moreover, CAP Scores do not adjust for every factor that may lie outside a school’s control. Nevertheless, by accounting for a major factor that is substantially related to student achievement and outside a school’s control, the CAP Report Card improves the quality of information publicly available to Michigan parents, taxpayers, school officials and policymakers.
The Michigan Public High School Context and Performance Report Card iv
Mackinac Center for Public Policy

Introduction
There are many stakeholders concerned about the performance of Michigan’s public high schools. Parents of children attending these schools desire to know how their schools compare to others, especially since an increasing number of parents appear to be taking advantage of public school choice options.1 Moreover, high school is their children’s last stop before entering the workforce or starting college. High school education will have a significant impact on a child's future.
Many taxpayers also desire some level of accountability over how well schools spend their resources, and public schools are Michigan’s largest single state government expenditure.2 Policymakers have similar reasons to be interested, as do school district officials and employees themselves, since high schools are typically the most expensive schools in the district.
Unfortunately, judging high school performance is not a straightforward task. There are many ways to measure it, including graduation rates, college acceptance rates and standardized test results. Some of these data are not publicly available, while others are not standardized in a way that allows reliable comparisons between schools.3 Further, an individual high school’s performance can be impacted by a number of variables largely outside the school’s control, such as parental involvement and the achievement of the school’s students in their previous “feeder schools.”4
This report card measures academic performance by using publicly available average scores on the ACT® and the Michigan Merit Examination, two standardized tests that all public high schools in Michigan are required to administer every year. While the report card does not capture all the variables that might impact high school performance, it does control for what is typically found to be a key variable: student “socioeconomic status.”
A student’s socioeconomic status typically refers to such factors as his or her family’s household income and parents’ educational background. Students from low-income families or homes where the parents have not completed high school tend to have lower levels of academic achievement than those from well-educated, high-income households.5
This disparity is a major — and legitimate — reason many people resist the idea of comparing schools based solely on standardized test scores: One school may
5 For more information on the relevance of these variables, see: Pamela E. Davis‑Kean, “The Influence of Parent education and Family income on child Achievement: the indirect role of parental expectations and the Home environment,” Journal of Family Psychology, 19, no. 2 (2005); Sean F. reardon, “the Widening Academic Achievement Gap Between the rich and the poor: new evidence and possible explanations,” in G. Duncan & r. Murnane (eds.), Whither Opportunity? Rising Inequality and the Uncertain Life Chances of Low-Income Children, new York: russell Sage Foundation press (2011); Bethanne M. Schlee, Ann k. Mullis, and Michael Shriner, “parents social and resource capital: predictors of academic achievement during early childhood,” Children and Youth Services Review, 31, no. 2 (2009).
4 For more information on the relevance of these variables, see: eric Hanushek, “the impact of Differential expenditures on School performance,” Educational Researcher 18, no. 4 (1989); James Griffith, “Relation of Parental involvement, empowerment, and School traits to Student Academic performance,” The Journal of Educational Research 90, no. 1 (1996); endya B. Stewart, “School Structural characteristics, Student effort, peer Associations, and parental Involvement: The Influence of School‑ and Individual‑level Factors on Academic Achievement,” Education and Urban Society 40, no. 2 (2008).
5 [DANIEL AND JONATHON: CAN YOU PROVIDE A CITATION OR CITATIONS?]
1 the percentage of Michigan students enrolled in a public school other than the one assigned to them by the state grew from 6.3 percent in 2002 to 11.4 percent in 2008. Andrew Saultz and kathryn Summers, “explaining School choice” (Michigan Senate Fiscal Agency, 2009), 4, http://goo.gl/krGvL (accessed Jan. 11, 2011).
2 According to Michigan’s Senate Fiscal Agency, about 41 percent of state appropriations were spent on K‑12 public schools in fiscal 2012. Authors’ calculations based on: “State Spending From State resources Appropriation History,” (Michigan Senate Fiscal Agency, 2012), http://goo.gl/MGlSF (accessed April 10, 2012); “School Aid Fund Appropriation History,” (Michigan Senate Fiscal Agency, 2012), http://goo.gl/2WdXZ (accessed April 10, 2012).
3 examples of nonstandardized data are school grade point averages and graduation rates. A high average GpA could be the result of a school’s low standards, rather than its students’ actual achievements.
4 For more information on the relevance of these variables, see: eric Hanushek, “the impact of Differential expenditures on School performance,” Educational Researcher 18, no. 4 (1989); James Griffith, “Relation of Parental involvement, empowerment, and School traits to Student Academic performance,” The Journal of Educational Research 90, no. 1 (1996); endya B. Stewart, “School Structural characteristics, Student effort, peer Associations, and Parental Involvement: The Influence of School- and individual-level Factors on Academic Achievement,” Education and Urban Society 40, no. 2 (2008).
The Michigan Public High School Context and Performance Report Card 1
Mackinac Center for Public Policy

outperform another simply because its student population has a higher average socioeconomic status, not because the school is actually better at educating students. With this report card, we adjust the performance of a school’s students on standardized tests to recognize the school’s socioeconomic disadvantages.
We call the results the “Context and Performance Report Card.” It is designed to be simple and straightforward, relying on the best publicly available data. This study explains and presents the report card; it does not attempt to make policy recommendations or draw policy conclusions.
Like other school report cards, the Context and Performance Report Card will not provide an exhaustive or perfect measure of high school performance. We believe, however, that it does improve the quality of information that school officials, taxpayers, policymakers and parents have available to judge the performance of Michigan’s public high schools.
Why Another Report Card?
The Michigan Department of Education already measures and produces several different reports on school performance. Assessments include the federal “adequate yearly progress”6 measure, Education YES! — A Yardstick for Excellent Schools,7 Michigan School Report Card8 and the “Persistently Lowest Achieving Schools” top-to-bottom school ranking.9
Unfortunately, these assessments have several limitations. First, most of these school assessments are difficult to understand. For instance, it requires 29 pages to explain how schools are graded on the Michigan School Report Card. The Education YES! assessment comes with a 97-page description of the 40 different indicators it uses to measure school effectiveness.10
Second, some assessments rely heavily on subjective measures. For example, the 40 performance indicators used by the Education YES! assessment are self-reported by local school officials.11 Similarly, there is evidence that even the state school assessments based on standardized test results have not been particularly meaningful: Until recently, the “cut scores”12 chosen by state officials to determine whether a school’s performance would be graded as “adequate” appear to have been far too low.13
For instance, 91 percent of Michigan’s general education schools14 made “adequate yearly progress” based on their students’ state exam scores,15 and among the schools receiving a letter grade on the Michigan School Report Card,
14 Does not include “alternative” or “special education” schools.
15 “Adequate yearly progress” is a measure created by the U.S. no child Left Behind Act in 2002. An individual school’s AYp status is determined by its students’ performance on english language arts and mathematics standardized tests, as well as attendance and graduation rates. For more information, see: “purpose of AYp,” (Michigan Department of education, 2011), http://goo.gl/gkHqn (accessed March 29, 2011).
9 “persistently Lowest Achieving Schools,” (Michigan Department of education, 2011), http://goo.gl/FFrro (accessed March 29, 2011).10 “Guide to reading School report cards,” (Michigan 2010), http://goo.gl/pH8t7 (accessed March 29, 2011). “Michigan School improvement Framework rubrics,” (Michigan Department of education), http://goo.gl/UnMnp (accessed April 5, 2011).11 Tom Gantert, “State Gives Failing Schools Perfect Grades for Paperwork,”(Michigan Capitol Confidential, 2010), http://goo.gl/VmDp6 (accessed Mar. 1, 2012).12 cut scores are used to classify a range of scores into two or more categories. For example, cuts scores for the 2011 Michigan Merit examination determine that in mathematics a score between 1089 and 1099 means a student is “partially proficient,” and a score between 1100 and 1127 means a student is “proficient.” “Michigan Merit Examination (MMe): Score categories and Scale Score ranges “, (Michigan Department of education, 2011), http://goo.gl/2qii9 (accessed March 1, 2012).13 State officials have in fact recognized the problem of low cut scores, and in 2011, the State Board of Education raised the cut score for passing state standardized exams from 39 percent to 65 percent. See “State Board Gives nod to improved Standards for State Assessment Scores,” (Michigan Department of education, 2011), http://goo.gl/Snpzr (accessed June 26, 2012).
14 Does not include “alternative” or “special education” schools.15 AYP is a measure created by the U.S. No Child Left Behind Act in 2002. An individual’s school’s AYP status is determined by its student’s performance on English language arts and mathematics standardized tests as well as at-tendance and graduation rates. For more information, see: “Purpose of AYP,” (Michigan Department of Education, 2011), http://goo.gl/gKHqn (accessed March 29, 2011).
6 “purpose of AYp,” (Michigan Department of education, 2011), http://goo.gl/gkHqn (accessed March 29, 2011).
7 “Standards for Accreditation: education YeS! – A Yardstick for excellent Schools,” (Michigan State Board of education, 2003), http://goo .gl/ossmj (accessed March 28, 2011).
8 “Welcome to the 2010-2011 Michigan School report card!” (Michigan Department of education, 2011), http://goo.gl/4oor7 (accessed March 29, 2011).
9 “2011 persistently Lowest Achieving Schools,” (Michigan Department of education, 2011), http://goo.gl/xqmrJ (accessed July 13, 2012).
10 “2011-2012 Guide to reading the Michigan School report cards,” (Michigan Department of education, 2012), http://goo.gl/pH8t7 (accessed July 13, 2012). “Michigan School improvement Framework rubrics,” (Michigan Department of education), http://goo.gl/UnMnp (accessed April 5, 2011).
11 tom Gantert, “State Gives Failing Schools perfect Grades for paperwork,” (Michigan capitol Confidential, 2010), http://goo.gl/VmDp6 (accessed Mar. 1, 2012).
12 cut scores are the boundaries for each achievement classification. For example, for the 2011 Michigan Merit examination in mathematics, a score between 1089 and 1099 means a student is “partially proficient,” and a score between 1100 and 1127 means a student is “proficient.” “Michigan Merit examination (MMe): Score categories and Scale Score ranges," (Michigan Department of education, 2011), http://goo.gl/2qii9 (accessed March 1, 2012).
13 State officials have in fact recognized the problem of low cut scores, and in 2011 the State Board of education raised the cut score for passing state standardized exams from 39 percent to 65 percent. See “State Board Gives nod to improved Standards for State Assessment Scores,” (Michigan Department of education, 2011), http://goo.gl/Snpzr (accessed June 26, 2012).
The Michigan Public High School Context and Performance Report Card 2
Mackinac Center for Public Policy

16 Authors' calculations based on state data. “2011 Adequate Yearly Progress (AYP) Results: Excel file of all 2011 AYp data,” (Michigan Department of education, 2011), http://goo.gl/bpker (accessed July 2, 2012).
17 ibid.
18 Michigan’s “proficient” students ranked 45th out of 48 states in fourth-grade reading, 36th out of 48 states in eighth-grade reading, 46th out of 48 states in fourth-grade math and 38th out of 47 states in eighth-grade math. Victor Bandeira de Mello, charles Blankenship, and Don McLaughlin, “Mapping State Proficiency Standards Onto NAEP Scales: 2005-2007,”(national center for education Statistics, 2009), 17, 20, http://goo.gl/eGMkV (accessed April 5, 2011). Additionally, Michigan received an “F” in math and a “D” in reading on its fourth- and eighth-grade proficiency standards in an Education next study. paul e. peterson and carlos Xabel Lastra-Anadon, “State Standards rise in reading, Fall in Math,” Education Next 10, no. 4 (2010) http://goo.gl/4QWFo (accessed June 28, 2012).
19 the foundational study on this subject is James S. coleman et al., Equality of Educational Opportunity (Washington, D.c.: United States Government Printing Office for the national center for education Statistics, 1966). Laura B. perry and Andrew Mcconney summarize the research this way: “it is well established in the research literature that socioeconomically disadvantaged students and schools do less well on standardized measures of academic achievement compared with their more advantaged peers.” Laura B. perry and Andrew Mcconney, “Does the SeS of the School Matter? An examination of Socioeconomic Status and Student Achievement Using piSA 2003,” Teacher College Record 112, no. 4 (2010).
20 For a summary of the research on this point, see: eric Hanushek, “the Failure of input-Based Schooling policies,” The Economic Journal 113, (February 2003), http://goo.gl/AyQHs (accessed April 10, 2012).
97 percent achieved an A, B or C in 2010.16 Only three of these schools — 0.1 percent — were labeled “unaccredited,” the equivalent of an “F.”17 Further, a study by the National Center for Education Statistics showed that fourth- and eighth-grade students labeled “proficient” in reading and math in Michigan ranked among the worst in the nation on national assessments.18
In addition to these shortcomings, none of these assessments adjusts for student socioeconomic status, which education researchers have consistently shown to have a significant impact on student achievement on standardized tests.19 This factor explains more variation among schools than any other variable, including per-pupil spending, pupil-teacher ratios, teacher salaries and teacher credentials.20
The Michigan Public High School Context and Performance Report Card is relatively easy to understand and controls for the impact student socioeconomic status has on standardized test scores. This allows for fairer comparisons among Michigan high schools, since a key factor outside the schools’ influence is taken into account.21
Data and Methods
The research methodology used for the CAP Scores is based on a 2006 University of Arkansas study.22 The Arkansas study used a regression analysis that enabled researchers to predict how well each school would perform given the socioeconomic makeup of their students.23 Schools were then ranked by how well they did relative to their predicted performance.
To capture the socioeconomic differences among Michigan high schools, we used headcounts of enrolled high school students who were eligible for free or reduced-price school lunches24 through the federal National School Lunch Program.25 FRL counts are commonly used as a proxy for
21 We tested other publicly available variables, including sex and ethnicity. These variables did not significantly improve the model. See “Appendix A: notes on testing other Variables and Data integrity” for more information.
22 Jay p. Greene et al., “the School performance index in Arkansas,”(University of Arkansas, 2006), http://goo.gl/oGlrQ (accessed March 1, 2012).
23 the Arkansas study tested several variables that are not incorporated in our model. these variables include measures of race, ethnicity, student population size and several additional district-level variables. only a few of these variables were ultimately incorporated into the Arkansas model, however; the others were found to be statistically insignificant. For further discussions of the variables used and excluded in drawing up our model, see “Appendix A: notes on testing other Variables and Data integrity.”
24 these data can be found through the center for educational performance and information: “Free and reduced Lunch counts,” (Michigan Department of education, 2011), http://goo.gl/tpcJf (accessed May 15, 2012).
25 currently, students from families with incomes equal to or below 185 percent of the federal poverty level are eligible for the program. “eligibility Manual For School Meals,” (U.S. Department of Agriculture, 2008), http://goo.gl/4ueXS (accessed March 22, 2011). For more information about the program, please see: “national School Lunch program,” (United States Department of Agriculture), http://goo.gl/7Ytpi (accessed March 22, 2011).
19 the foundational study on this subject is James S. coleman et al., Equality of Educational Opportunity (Washington, D.C.: United States Government Printing Office for the National Center for Education Statistics, 1966). Laura B. Perry and Andrew Mcconney summarize the research this way: “it is well established in the research literature that socioeconomically disadvantaged students and schools do less well on standardized measures of academic achievement compared with their more advantaged peers.” Laura B. perry and Andrew Mcconney, “Does the SeS of the School Matter? An examination of Socioeconomic Status and Student Achievement Using piSA 2003,” Teacher College Record 112, no. 4 (2010). 20 For a summary of the research on this point, see: eric Hanushek, “the Failure of input-Based Schooling policies,” The Economic Journal 113, no. February (2003) http://goo.gl/AyQHs (accessed April 10, 2012).21 We tested other publicly available variables, including sex and ethnicity. These variables did not significantly improve the model. See “Appendix D: notes on testing other Variables and Data integrity” for more information.22 Jay p. Greene et al., “the School performance index in Arkansas,”(University of Arkansas, 2006), http://goo.gl/oGlrQ (accessed March 1, 2012).
25 Currently, students from families with income less than 185 percent of the federal poverty level are eligible for the program. “Eligibility Manual For School Meals,” (U.S. Department of Agriculture, 2008), http://goo.gl/4uEXS (ac-cessed March 22, 2011). For more information about the program, please see: “National School Lunch Program,” (United States Department of Agriculture), http://goo.gl/7YtpI (accessed March 22, 2011).
The Michigan Public High School Context and Performance Report Card 3
Mackinac Center for Public Policy

26 one note concerning free and reduced-price lunch counts: it is theoretically possible that certain high schools are more successful at identifying and reporting students as being eligible for the national School Lunch program. if these schools also systematically tend to perform differently from other high schools, the inclusion of FrL eligibility in our model may lead to classification bias. the extent to which this happens is unknown. Ultimately, we chose FrL eligibility because it is the best available proxy for student socioeconomic status available.
27 Estimated coefficients range between -0.28 and -0.32. See Graphic 18 in “Appendix D: regression results.”
28 the weighting for students eligible for free lunches was double that for students eligible for reduced-price lunches. This approach is not firmly established in the research literature, but it does have advantages over an unweighted count of FrL students, since an unweighted count effectively assigns equal weights to students from households that may have significantly different income levels. See “Appendix c: Free and reduced-price Lunch Weights” for more information.
29 McL § 388.1704b. Districts must also administer the MMe to 12th- graders who did not take the test as 11th-graders.
30 For more information, see: “History of Act,” (Act inc., 2012), http://goo.gl/A4tjc (accessed April 10, 2012).
31 "Writing test Scores," (Act inc., 2012), http://goo.gl/ykW8e (accessed July 13, 2012); “Understand your scores,” (Act inc., 2012), http://goo.gl/nMt2j (accessed July 13, 2011).
32 “Michigan Merit examination: Guide to reports,” (Michigan Department of education, 2011), 8-9, http://goo.gl/0U8cg (accessed April 8, 2011).
33 the Act composite score is an average of a student’s english, mathematics, reading and science scores. “Understand your scores,” (Act inc., 2011), http://goo.gl/nMt2j (accessed April 8, 2011).
socioeconomic status in education research.26
Consistent with past studies of student achievement, the statistical results from our analysis show that FRL counts are negatively correlated to average academic achievement.27 In other words, the higher the percentage of a high school’s students eligible for a free or reduced lunch, the lower that high school’s average score on standardized tests tends to be.
Note that students qualifying for free lunches were weighted more heavily than students qualifying for reduced-price lunches in order to better capture disparities in socioeconomic status. This differential weighting did in fact improve the statistical model’s explanatory power.28
Academic performance was measured by average high school scores from the 2008 through 2011 Michigan Merit Examinations. State law requires that the MME be administered to all 11th-graders enrolled in public schools as a condition of receiving state aid.29 The MME is made up of five different subject tests and the ACT® test, a college admissions exam created by ACT Inc., an independent, nonprofit organization.30
Both the MME subject tests and ACT® test assess student achievement in math, reading, writing and science. The ACT® test also produces English, “English+Writing” and an overall composite score.31 The MME also includes subject tests in social studies, but does not produce an overall average composite score.32
There is a strong correlation between a high school’s average scores on MME subject tests and ACT® subject tests in math, reading, writing and science. For this reason, and in the interest of simplifying the model, we used only average ACT® composite scores33 and average MME subject scores in math, reading, science, writing and social studies.
Each school’s actual academic performance was compared to its predicted performance in the ACT® composite and in each of the five MME subject areas for each of the four years. The 24 results from these calculations were then averaged to produce an overall score for each school. These scores were multiplied by 100 to produce an easily comparable “Context and Performance Score” for each of the 592 high schools for which data were available. Through the remainder of the text, we will refer to this overall measure as the “CAP Score.”
Hence, a CAP Score below 100 indicates that a high school’s average score is below its predicted level based on FRL counts, while a CAP Score above 100 means a high school’s average score exceeds its predicted level based on FRL counts.34
34 even if a school’s overall average cAp Score was below 100, it’s possible that its cAp Score in some subject areas exceeded the predicted achievement based on the socioeconomic makeup of its students.
29 MCL 388.1704b. Districts muwst also administer the MME to 12th graders who did not take the test as 11th graders.30 For more information, see: “History of ACT,” (ACT, Inc., 2012), http://goo.gl/A4tjC (accessed April 10, 2012).31 “Michigan Merit Examination: Guide to Reports,” (Michigan Depart-ment of Education, 2011), 8, http://goo.gl/0U8Cg (accessed April 8, 2011).32 Ibid.33 The ACT composite score is an average of a student’s English, mathe-matics, reading and science scores. “Understand your scores,” (ACT Inc., 2011), http://goo.gl/NMt2j (accessed April 8, 2011). 34 Even if a school’s overall average CAP Score was below 100, it’s possible that it’s CAP Score in some subjects areas exceeded the predicted achievement based on the socioeconomic makeup of its students.
The Michigan Public High School Context and Performance Report Card 4
Mackinac Center for Public Policy

35 For more discussion of the process of calculating cAp Scores and letter grades, see “Appendix B: calculating cAp Scores and Letter Grades.”
36 the locale codes are based on U.S. Census Bureau classifications and assigned by the national center for education Statistics. See “Appendix F: Locale Code Definitions” for more information. tai phan and Mark Glander, “Documentation to the nceS common core of Data Local education Agency Locale code File: School Year 2005-06” (national center for education Statistics, 2007), http://goo.gl/xYuiY (accessed Feb. 22, 2011).
37 there are several other differences between charter public schools and district-run schools. charter schools can operate any grade configuration from kindergarten through 12th grade. they are often managed by private contractors and are exempt from the state’s requirement to grant teachers tenure.
Letter grades were assigned to each overall CAP Score. The letter grades were based on a standard bell curve distribution, with 10 percent of the schools receiving A’s, 20 percent receiving B’s, 40 percent receiving C’s, 20 percent receiving D’s and 10 percent receiving F’s.35
These grades and CAP Scores are relative — in other words, they are not based on an absolute standard of academic performance. Instead, they indicate how each high school compares to other high schools on standardized tests given the schools’ respective student populations. By definition, the average of the scores for all of the public high schools in the state will be 100, corresponding to a C.
Finally, a percentile rank was also calculated for each CAP Score. This rank shows what percentage of high schools had lower CAP Scores than any particular school. This, too, provides an easy method for comparing high schools.
Classifying Schools
As noted in the previous section, FRL counts are a significant predictor of a high school’s average academic performance. Nevertheless, a school’s “locale” — urban, suburban, town or rural — may be related to its performance. Hence, in the tables below, each school’s locale is included, and the four locale classifications are further subdivided into three subgroups apiece: large cities, midsize cities and small cities; large suburbs, midsize suburbs and small suburbs; fringe towns, distant towns and remote towns; and fringe rural, distant rural and remote rural. 36 The use of these locale classifications will help indicate any systematic achievement gaps that may arise among schools based on their type of community.
Some public high schools in Michigan use selective admissions policies that require students to meet certain academic requirements in order to enroll. Average test scores from these selective schools are often higher than those from schools without such policies. The names of such selective public high schools are listed as “selective” in our CAP Score tables.
Charter public high schools, known legally as public school academies, operate somewhat differently from conventional district-run high schools. Charter schools are individually managed and rely entirely on parents to choose to enroll their children there, rather than at conventional high schools.37 Charter public high schools are labeled “charter” in our CAP Score tables. Conventional district-run high schools, in contrast, are labeled “conventional.”
Not all high schools have four years of data publicly available in each standardized test subject. Average CAP Scores were still calculated for these schools, but their names are marked with a dagger.
The Michigan Public High School Context and Performance Report Card 5
Mackinac Center for Public Policy
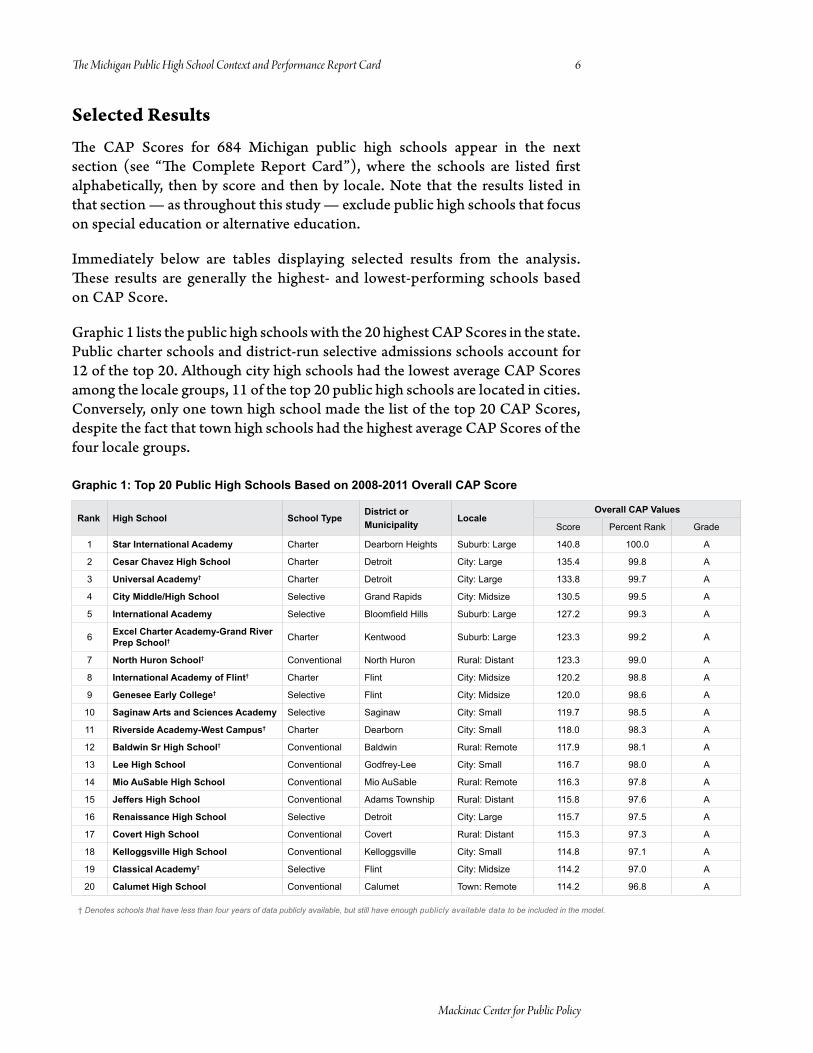
Graphic 1: Top 20 Public High Schools Based on 2008-2011 Overall CAP Score
Rank High School School TypeDistrict or Municipality
LocaleOverall CAP Values
Score percent rank Grade
1 Star International Academy charter Dearborn Heights Suburb: Large 140.8 100.0 A
2 Cesar Chavez High School charter Detroit city: Large 135.4 99.8 A
3 Universal Academy† charter Detroit city: Large 133.8 99.7 A
4 City Middle/High School Selective Grand rapids city: Midsize 130.5 99.5 A
5 International Academy Selective Bloomfield Hills Suburb: Large 127.2 99.3 A
6 Excel Charter Academy-Grand River Prep School† charter kentwood Suburb: Large 123.3 99.2 A
7 North Huron School† conventional north Huron rural: Distant 123.3 99.0 A
8 International Academy of Flint† charter Flint city: Midsize 120.2 98.8 A
9 Genesee Early College† Selective Flint city: Midsize 120.0 98.6 A
10 Saginaw Arts and Sciences Academy Selective Saginaw city: Small 119.7 98.5 A
11 Riverside Academy-West Campus† charter Dearborn city: Small 118.0 98.3 A
12 Baldwin Sr High School† conventional Baldwin rural: remote 117.9 98.1 A
13 Lee High School conventional Godfrey-Lee city: Small 116.7 98.0 A
14 Mio AuSable High School conventional Mio AuSable rural: remote 116.3 97.8 A
15 Jeffers High School conventional Adams township rural: Distant 115.8 97.6 A
16 Renaissance High School Selective Detroit city: Large 115.7 97.5 A
17 Covert High School conventional covert rural: Distant 115.3 97.3 A
18 Kelloggsville High School conventional kelloggsville city: Small 114.8 97.1 A
19 Classical Academy† Selective Flint city: Midsize 114.2 97.0 A
20 Calumet High School conventional calumet town: remote 114.2 96.8 A
† Denotes schools that have less than four years of data publicly available, but still have enough publicly available data to be included in the model.
Selected Results
The CAP Scores for 684 Michigan public high schools appear in the next section (see “The Complete Report Card”), where the schools are listed first alphabetically, then by score and then by locale. Note that the results listed in that section — as throughout this study — exclude public high schools that focus on special education or alternative education.
Immediately below are tables displaying selected results from the analysis. These results are generally the highest- and lowest-performing schools based on CAP Score.
Graphic 1 lists the public high schools with the 20 highest CAP Scores in the state. Public charter schools and district-run selective admissions schools account for 12 of the top 20. Although city high schools had the lowest average CAP Scores among the locale groups, 11 of the top 20 public high schools are located in cities. Conversely, only one town high school made the list of the top 20 CAP Scores, despite the fact that town high schools had the highest average CAP Scores of the four locale groups.
The Michigan Public High School Context and Performance Report Card 6
Mackinac Center for Public Policy

The list of the 20 lowest CAP Scores is disproportionately populated by city high schools — 17 of the 20 (see Graphic 2). More than half of the bottom 20 are in Detroit. Suburban, town and rural locales each had only one high school among the 20 lowest performers. Six of the lowest-performing high schools were charter public schools.
Graphic 2: Bottom 20 Public High Schools Based on 2008-2011 Overall CAP Score
Rank High School School TypeDistrict or Municipality
LocaleOverall CAP Values
Score percent rank Grade
1 Finney High School conventional Detroit city: Large 70.8 0.7‡ F
2 Detroit City High School† conventional Detroit city: Large 73.4 1.0 F
3 Dream Academy† charter Benton Harbor city: Small 74.4 1.2 F
4 Denby High School conventional Detroit city: Large 75.1 1.4 F
5 Cody College Preparatory Upper School of Teaching and Learning conventional Detroit city: Large 75.5 1.5 F
6 Pershing High School conventional Detroit city: Large 77.0 1.7 F
7 Creative Technologies Academy† charter cedar Springs town: Fringe 77.2 1.9 F
8 Kettering High School conventional Detroit city: Large 77.3 2.0 F
9 Northwestern High School conventional Flint city: Midsize 77.7 2.2 F
10 Central High School conventional Detroit city: Large 78.3 2.4 F
11 Mumford High School conventional Detroit city: Large 78.7 2.5 F
12 Osborn Upper School of Global Communications and Culture conventional Detroit city: Large 79.5 2.7 F
13 Bradford Academy† charter Southfield city: Small 79.6 2.9 F
14 Pontiac High School conventional pontiac city: Small 81.3 3.0 F
15 Conner Creek Academy East-Michigan Collegiate High charter Warren city: Midsize 81.5 3.2 F
16 Kensington Woods High School charter Howell Suburb: Midsize 81.7 3.4 F
17 Northern High School conventional Flint city: Midsize 81.9 3.6 F
18 Buena Vista High School conventional Buena Vista rural: Fringe 82.1 3.7 F
19 Detroit Academy of Arts and Sciences High School charter Detroit city: Large 82.2 3.9 F
20 Southwestern High School conventional Detroit city: Large 82.5 4.1 F
† Denotes schools that have less than four years of data publicly available, but still have enough publicly available data to be included in the model.
‡ As noted in Appendix E, several schools were erroneously listed in government tables as general education high schools and thus were originally included in the model. The subsequent removal of these schools from our graphics means that the percent rank of the school with the lowest CAP Score is not zero.
The Michigan Public High School Context and Performance Report Card 7
Mackinac Center for Public Policy
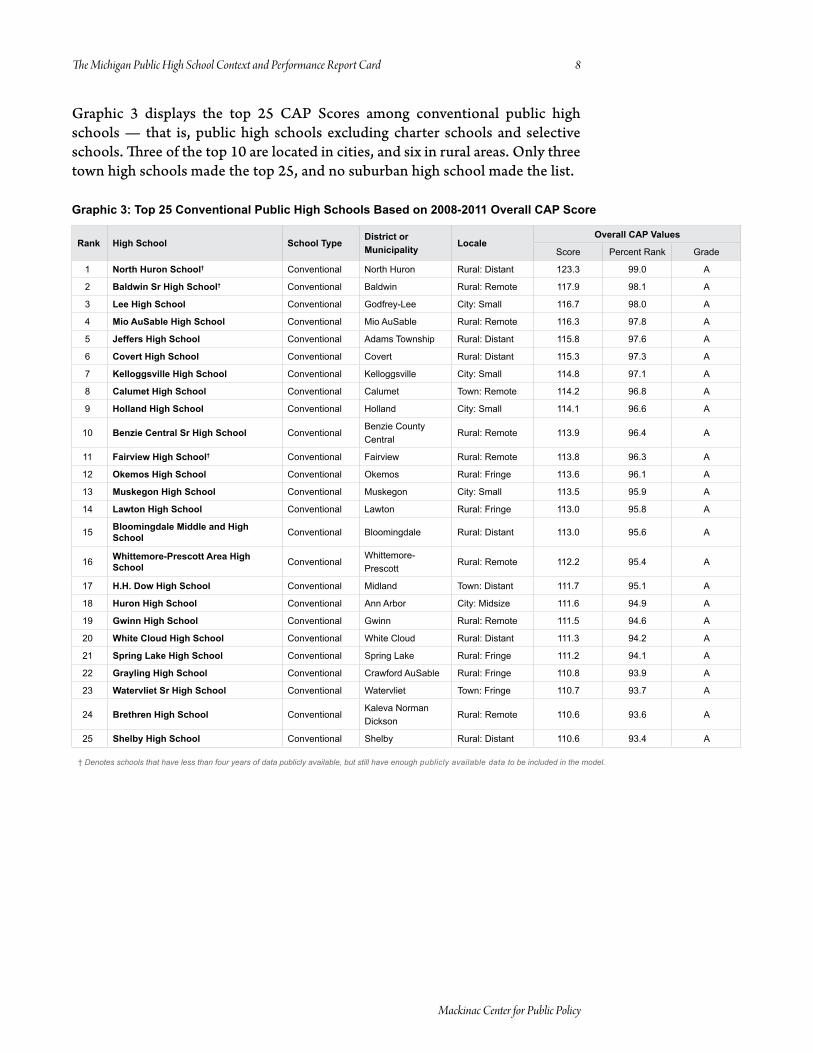
Graphic 3 displays the top 25 CAP Scores among conventional public high schools — that is, public high schools excluding charter schools and selective schools. Three of the top 10 are located in cities, and six in rural areas. Only three town high schools made the top 25, and no suburban high school made the list.
Graphic 3: Top 25 Conventional Public High Schools Based on 2008-2011 Overall CAP Score
Rank High School School TypeDistrict or Municipality
LocaleOverall CAP Values
Score percent rank Grade
1 North Huron School† conventional north Huron rural: Distant 123.3 99.0 A
2 Baldwin Sr High School† conventional Baldwin rural: remote 117.9 98.1 A
3 Lee High School conventional Godfrey-Lee city: Small 116.7 98.0 A
4 Mio AuSable High School conventional Mio AuSable rural: remote 116.3 97.8 A
5 Jeffers High School conventional Adams township rural: Distant 115.8 97.6 A
6 Covert High School conventional covert rural: Distant 115.3 97.3 A
7 Kelloggsville High School conventional kelloggsville city: Small 114.8 97.1 A
8 Calumet High School conventional calumet town: remote 114.2 96.8 A
9 Holland High School conventional Holland city: Small 114.1 96.6 A
10 Benzie Central Sr High School conventionalBenzie county central
rural: remote 113.9 96.4 A
11 Fairview High School† conventional Fairview rural: remote 113.8 96.3 A
12 Okemos High School conventional okemos rural: Fringe 113.6 96.1 A
13 Muskegon High School conventional Muskegon city: Small 113.5 95.9 A
14 Lawton High School conventional Lawton rural: Fringe 113.0 95.8 A
15 Bloomingdale Middle and High School conventional Bloomingdale rural: Distant 113.0 95.6 A
16 Whittemore-Prescott Area High School conventional
Whittemore-prescott
rural: remote 112.2 95.4 A
17 H.H. Dow High School conventional Midland town: Distant 111.7 95.1 A
18 Huron High School conventional Ann Arbor city: Midsize 111.6 94.9 A
19 Gwinn High School conventional Gwinn rural: remote 111.5 94.6 A
20 White Cloud High School conventional White cloud rural: Distant 111.3 94.2 A
21 Spring Lake High School conventional Spring Lake rural: Fringe 111.2 94.1 A
22 Grayling High School conventional crawford AuSable rural: Fringe 110.8 93.9 A
23 Watervliet Sr High School conventional Watervliet town: Fringe 110.7 93.7 A
24 Brethren High School conventionalkaleva norman Dickson
rural: remote 110.6 93.6 A
25 Shelby High School conventional Shelby rural: Distant 110.6 93.4 A
† Denotes schools that have less than four years of data publicly available, but still have enough publicly available data to be included in the model.
The Michigan Public High School Context and Performance Report Card 8
Mackinac Center for Public Policy

Graphic 4 shows that 17 of the 25 lowest-performing conventional public high schools based on CAP Scores are located in cities. Thirteen of these are in Detroit. No town high school made the list.
Graphic 4: Bottom 25 Conventional Public High Schools Based on 2008-2011 Overall CAP Score
Rank High School School TypeDistrict or Municipality
LocaleOverall CAP Values
Score percent rank Grade
1 Finney High School conventional Detroit city: Large 70.8 0.7‡ F
2 Detroit City High School† conventional Detroit city: Large 73.4 1.0 F
3 Denby High School conventional Detroit city: Large 75.1 1.4 F
4 Cody College Preparatory Upper School of Teaching and Learning conventional Detroit city: Large 75.5 1.5 F
5 Pershing High School conventional Detroit city: Large 77.0 1.7 F
6 Kettering High School conventional Detroit city: Large 77.3 2.0 F
7 Northwestern High School conventional Flint city: Midsize 77.7 2.2 F
8 Central High School conventional Detroit city: Large 78.3 2.4 F
9 Mumford High School conventional Detroit city: Large 78.7 2.5 F
10 Osborn Upper School of Global Communications and Culture conventional Detroit city: Large 79.5 2.7 F
11 Pontiac High School conventional pontiac city: Small 81.3 3.0 F
12 Northern High School conventional Flint city: Midsize 81.9 3.6 F
13 Buena Vista High School conventional Buena Vista rural: Fringe 82.1 3.7 F
14 Southwestern High School conventional Detroit city: Large 82.5 4.1 F
15 Southeastern High School conventional Detroit city: Large 82.7 4.4 F
16 Ford High School conventional Detroit city: Large 83.0 4.6 F
17 Northwestern High School conventional Detroit city: Large 84.4 4.9 F
18 Muskegon Heights High School conventional Muskegon Heights Suburb: Midsize 85.1 5.1 F
19 Highland Park Community High School conventional Highland park Suburb: Large 86.2 5.4 F
20 Ecorse Community High School† conventional ecorse Suburb: Large 86.3 5.6 F
21 Lincoln Sr High School conventional Lincoln rural: Fringe 86.7 5.8 F
22 Summerfield High School conventional Summerfield rural: Distant 86.8 6.1 F
23 Saginaw High School conventional Saginaw city: Small 87.1 6.3 F
24 Jefferson High School conventional Jefferson (Monroe) rural: Fringe 88.4 6.4 F
25 Whiteford High School conventionalWhiteford Agricultural
rural: Fringe 88.5 6.6 F
† Denotes schools that have less than four years of data publicly available, but still have enough publicly available data to be included in the model.
‡ As noted in Appendix E, several schools were erroneously listed in government tables as general education high schools and thus were originally included in the model. The subsequent removal of these schools from our graphics means that the percent rank of the school with the lowest CAP Score is not zero.
The Michigan Public High School Context and Performance Report Card 9
Mackinac Center for Public Policy

Graphic 5 displays the top 10 CAP Scores for charter public high schools. A town high school appears on the list, even though only four of Michigan’s charter public high schools are located in town and rural areas. There is a significant difference between CAP Scores of the top three charters and the next three, with a difference of 10.5 points in CAP Scores between the third- and fourth-best performing charter public high schools. Nevertheless, the top four charter schools had higher CAP Scores than any conventional public high school. Four of the top six charter public schools did not have a full four years of data, however.
Graphic 5: Top 10 Charter Public Schools Based on 2008-2011 Overall CAP Score
Rank High School School TypeDistrict or Municipality
LocaleOverall CAP Values
Score percent rank Grade
1 Star International Academy charter Dearborn Heights Suburb: Large 140.8 100.0 A
2 Cesar Chavez High School charter Detroit city: Large 135.4 99.8 A
3 Universal Academy† charter Detroit city: Large 133.8 99.7 A
4 Excel Charter Academy- Grand River Prep School† charter kentwood Suburb: Large 123.3 99.2 A
5 International Academy of Flint† charter Flint city: Midsize 120.2 98.8 A
6 Riverside Academy-West Campus† charter Dearborn city: Small 118.0 98.3 A
7 West Michigan Academy of Environmental Science† charter Grand rapids Suburb: Large 109.4 91.5 A
8 Crossroads Charter Academy charter Big rapids town: remote 108.7 89.7 B
9 Pontiac Academy for Excellence High School charter pontiac city: Small 108.3 88.5 B
10 Frontier International Academy charter Hamtramck Suburb: Large 107.4 86.3 B
† Denotes schools that have less than four years of data publicly available, but still have enough publicly available data to be included in the model.
Graphic 6 shows the 10 lowest CAP Scores among charter public high schools. Note that four of the schools on the list lacked the full four years of data.
Just as with the list of the top CAP Scores for charter schools, the list of lowest CAP Scores includes one of the four charter high schools located in town and rural areas. The charter public high schools with the six lowest CAP Scores were among the lowest-scoring public high schools overall (see Graphic 2).
The Michigan Public High School Context and Performance Report Card 10
Mackinac Center for Public Policy

Graphic 6: Bottom 10 Charter Public Schools Based on 2008-2011 Overall CAP Score
Rank High School School TypeDistrict or Municipality
LocaleOverall CAP Values
Score percent rank Grade
1 Dream Academy† charter Benton Harbor city: Small 74.4 1.2 F
2 Creative Technologies Academy† charter cedar Springs town: Fringe 77.2 1.9 F
3 Bradford Academy† charter Southfield city: Small 79.6 2.9 F
4 Conner Creek Academy East-Michigan Collegiate High charter Warren city: Midsize 81.5 3.2 F
5 Kensington Woods High School charter Howell Suburb: Midsize 81.7 3.4 F
6 Detroit Academy of Arts and Sciences High School charter Detroit city: Large 82.2 3.9 F
7 Plymouth Educational Center Preparatory High School† charter Detroit city: Large 83.4 4.7 F
8 Detroit Community Schools High School charter Detroit city: Large 86.0 5.2 F
9 Arts Academy in the Woods charter Fraser Suburb: Large 89.1 6.9 F
10 Summit Academy North High School charter romulus Suburb: Large 90.8 8.3 F
† Denotes schools that have less than four years of data publicly available, but still have enough publicly available data to be included in the model.
We identified only 11 selective public high schools — that is, schools that admit only those students who meet certain academic standards. The CAP Scores of these selective schools are listed in Graphic 7 below. These scores are among the highest in the state. Given the schools’ selective policies, this may be unsurprising; at the same time, however, the CAP Score attempts to correct for any socioeconomic advantage these schools may have gained through their selective admissions policies.
Based on CAP Scores, six charter public high schools and 31 conventional public high schools outperformed the 10th-best selective admissions school. Nine of the 11 selective public high schools are in city areas; only two are suburban schools; and none are located in towns or rural areas.
Graphic 7: 2008-2011 Overall CAP Scores for Selective Public High Schools
Rank High School School TypeDistrict or Municipality
LocaleOverall CAP Values
Score percent rank Grade
1 City Middle/High School Selective Grand rapids city: Midsize 130.5 99.5 A
2 International Academy Selective Bloomfield Hills Suburb: Large 127.2 99.3 A
3 Genesee Early College† Selective Flint city: Midsize 120.0 98.6 A
4 Saginaw Arts and Sciences Academy Selective Saginaw city: Small 119.7 98.5 A
5 Renaissance High School Selective Detroit city: Large 115.7 97.5 A
6 Classical Academy† Selective Flint city: Midsize 114.2 97.0 A
7 Cass Technical High School Selective Detroit city: Large 111.7 95.3 A
8 Davis Aerospace High School Selective Detroit city: Large 111.6 94.8 A
9 Henry Ford Early College† Selective Dearborn Suburb: Large 111.3 94.4 A
10 Mott Middle College High School† Selective Flint city: Midsize 109.8 92.2 A
11 University High School Academy† Selective Southfield city: Small 106.1 81.9 B
† Denotes schools that have less than four years of data publicly available, but still have enough publicly available data to be included in the model.
The Michigan Public High School Context and Performance Report Card 11
Mackinac Center for Public Policy

The remaining tables in the main text — Graphic 8 through Graphic 16 — discuss the CAP Scores of public high schools based on their locale. Of the four major locale groups, town high schools had the highest average CAP Score, followed closely by those in rural areas (see Graphic 8). On average, high schools in both of these locale groups exceeded their predicted performance based on their students’ socioeconomic status, while those in suburban and city locales did not.
Public high schools in remote rural areas had the highest average CAP Scores among the 12 locale subgroups, followed by remote town high schools. Although city public high schools had the lowest average CAP Score of these four groups, public high schools in small and midsize cities had average CAP Scores that exceeded not only their predicted performance (100), but the CAP Score averages for any of the suburban locale subgroups as well.
Graphic 8: Average 2008-2011 Overall CAP Score by Locale Group
Locale Number of Schools Overall CAP Score
city: Large 35 92.2
city: Midsize 22 103.0
city: Small 47 102.0
City: All 104 98.9
Suburb: Large 132 100.1
Suburb: Midsize 18 99.3
Suburb: Small 12 99.8
Suburb: All 162 100.0
town: Fringe 16 98.2
town: Distant 35 101.5
town: remote 28 103.3
Town: All 79 101.5
rural: Fringe 92 100.3
rural: Distant 110 100.5
rural: remote 38 103.9
Rural: All 240 101.0
Graphic 9 lists the top 10 percent of CAP Scores for city public high schools. Ten of these 13 schools are located in small or midsize cities. However, the top two schools are both in the only classified large city: Detroit. Both charters and selective admissions schools are more likely to be located in cities, and these types of schools dominate the top 10 percent of city high schools.
The Michigan Public High School Context and Performance Report Card 12
Mackinac Center for Public Policy

Graphic 9: Top 10 Percent of City Public High Schools Based on 2008-2011 Overall CAP Score
Rank High School School TypeDistrict or Municipality
LocaleOverall CAP Values
Score percent rank Grade
1 Cesar Chavez High School charter Detroit city: Large 135.4 99.8 A
2 Universal Academy† charter Detroit city: Large 133.8 99.7 A
3 City Middle/High School Selective Grand rapids city: Midsize 130.5 99.5 A
4 International Academy of Flint† charter Flint city: Midsize 120.2 98.8 A
5 Genesee Early College† Selective Flint city: Midsize 120.0 98.6 A
6 Saginaw Arts and Sciences Academy Selective Saginaw city: Small 119.7 98.5 A
7 Riverside Academy-West Campus† charter Dearborn city: Small 118.0 98.3 A
8 Lee High School conventional Godfrey-Lee city: Small 116.7 98.0 A
9 Renaissance High School Selective Detroit city: Large 115.7 97.5 A
10 Kelloggsville High School conventional kelloggsville city: Small 114.8 97.1 A
11 Classical Academy† Selective Flint city: Midsize 114.2 97.0 A
12 Holland High School conventional Holland city: Small 114.1 96.6 A
13 Muskegon High School conventional Muskegon city: Small 113.5 95.9 A
† Denotes schools that have less than four years of data publicly available, but still have enough publicly available data to be included in the model.
The lowest CAP Scores for city public high schools appear in Graphic 10. The majority of the schools on the list are in Detroit and are thus classified as large city schools. Two schools on this list are charter schools.
Graphic 10: Bottom 10 Percent of City Public High Schools Based on 2008-2011 Overall CAP Score
Rank High School School TypeDistrict or Municipality
LocaleOverall CAP Values
Score percent rank Grade
1 Finney High School conventional Detroit city: Large 70.8 0.7‡ F
2 Detroit City High School† conventional Detroit city: Large 73.4 1.0 F
3 Dream Academy† charter Benton Harbor city: Small 74.4 1.2 F
4 Denby High School conventional Detroit city: Large 75.1 1.4 F
5 Cody College Preparatory Upper School of Teaching and Learning conventional Detroit city: Large 75.5 1.5 F
6 Pershing High School conventional Detroit city: Large 77.0 1.7 F
7 Kettering High School conventional Detroit city: Large 77.3 2.0 F
8 Northwestern High School conventional Flint city: Midsize 77.7 2.2 F
9 Central High School conventional Detroit city: Large 78.3 2.4 F
10 Mumford High School conventional Detroit city: Large 78.7 2.5 F
11 Osborn Upper School of Global Communications and Culture conventional Detroit city: Large 79.5 2.7 F
12 Bradford Academy† charter Southfield city: Small 79.6 2.9 F
13 Pontiac High School conventional pontiac city: Small 81.3 3.0 F
† Denotes schools that have less than four years of data publicly available, but still have enough publicly available data to be included in the model.
‡ As noted in Appendix E, several schools were erroneously listed in government tables as general education high schools and thus were originally included in the model. The subsequent removal of these schools from our graphics means that the percent rank of the school with the lowest CAP Score is not zero.
The Michigan Public High School Context and Performance Report Card 13
Mackinac Center for Public Policy

Graphic 11 shows that just as with city public high schools, the suburban public high schools with the highest CAP Scores were charter schools and selective admissions schools. Three-quarters of the top 10 percent are in large suburbs, but 81 percent of suburban public high schools are in large suburbs, so this outcome is not surprising. The top three CAP Scores among suburban public high schools stand out compared to the CAP Scores of their peers: They are at least 12 points higher than those of any other suburban public high school.
Graphic 11: Top 10 Percent of Suburban Public High Schools Based on 2008-2011 Overall CAP Score
Rank High School School TypeDistrict or Municipality
LocaleOverall CAP Values
Score percent rank Grade
1 Star International Academy charter Dearborn Heights Suburb: Large 140.8 100.0 A
2 International Academy Selective Bloomfield Hills Suburb: Large 127.2 99.3 A
3 Excel Charter Academy-Grand River Prep School† charter kentwood Suburb: Large 123.3 99.2 A
4 Henry Ford Early College† Selective Dearborn Suburb: Large 111.3 94.4 A
5 West Michigan Academy of Environmental Science† charter Grand rapids Suburb: Large 109.4 91.5 A
6 North Muskegon High School conventional north Muskegon Suburb: Midsize 109.2 91.2 A
7 Comstock High School conventional comstock Suburb: Midsize 109.0 90.7 A
8 Grand Haven High School conventional Grand Haven Suburb: Midsize 108.9 90.5 A
9 Bendle High School conventional Bendle Suburb: Large 108.6 89.0 B
10 Skyline High School† conventional Ann Arbor Suburb: Large 108.5 88.7 B
11 Grosse Pointe South High School conventional Grosse pointe Suburb: Large 108.2 88.2 B
12 Central High School conventional Forest Hills Suburb: Large 107.9 87.3 B
13 West Ottawa High School Campus conventional West ottawa Suburb: Small 107.5 86.8 B
14 East Grand Rapids High School conventional east Grand rapids Suburb: Large 107.4 86.5 B
15 Frontier International Academy charter Hamtramck Suburb: Large 107.4 86.3 B
16 HEART Academy charter Harper Woods Suburb: Large 107.3 86.1 B
† Denotes schools that have less than four years of data publicly available, but still have enough publicly available data to be included in the model.
Graphic 12 shows the lowest 10 percent of CAP Scores for suburban public high schools. The schools with the two lowest scores on the list were in midsize suburbs. The rest of the low CAP Scores occurred in large suburbs. Two of the lowest scores came from public high schools in the Chippewa Valley school district.
The Michigan Public High School Context and Performance Report Card 14
Mackinac Center for Public Policy
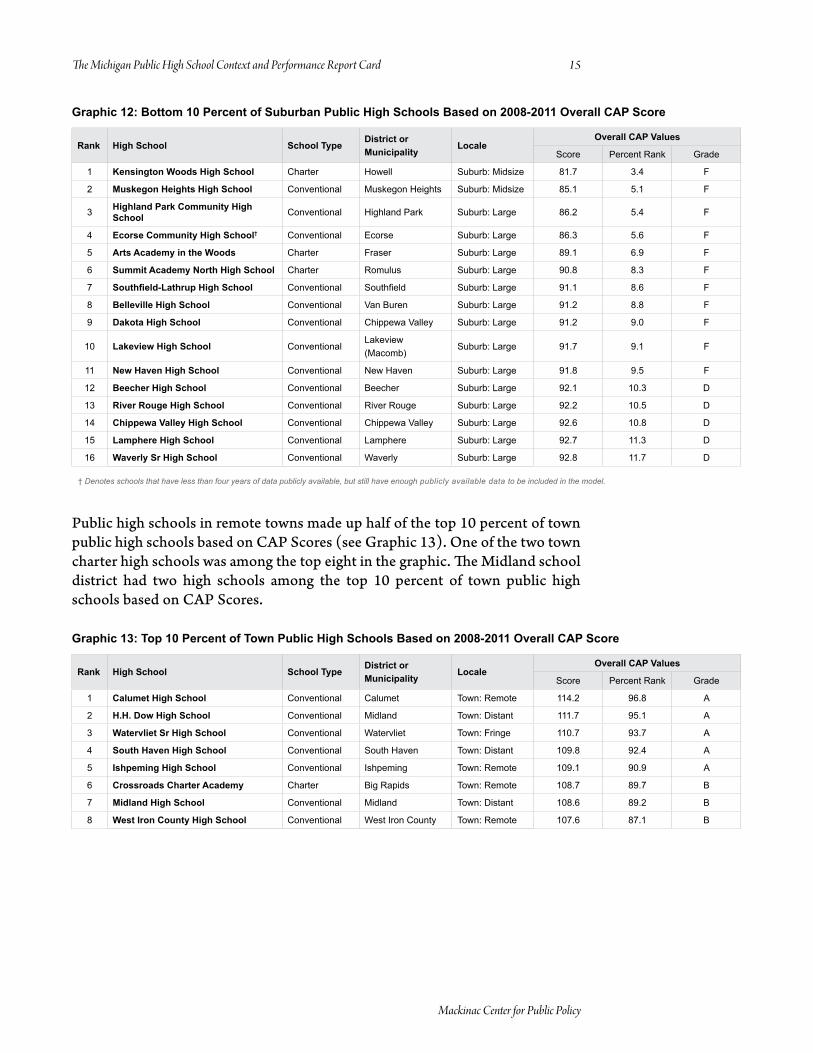
Graphic 12: Bottom 10 Percent of Suburban Public High Schools Based on 2008-2011 Overall CAP Score
Rank High School School TypeDistrict or Municipality
LocaleOverall CAP Values
Score percent rank Grade
1 Kensington Woods High School charter Howell Suburb: Midsize 81.7 3.4 F
2 Muskegon Heights High School conventional Muskegon Heights Suburb: Midsize 85.1 5.1 F
3 Highland Park Community High School conventional Highland park Suburb: Large 86.2 5.4 F
4 Ecorse Community High School† conventional ecorse Suburb: Large 86.3 5.6 F
5 Arts Academy in the Woods charter Fraser Suburb: Large 89.1 6.9 F
6 Summit Academy North High School charter romulus Suburb: Large 90.8 8.3 F
7 Southfield-Lathrup High School conventional Southfield Suburb: Large 91.1 8.6 F
8 Belleville High School conventional Van Buren Suburb: Large 91.2 8.8 F
9 Dakota High School conventional chippewa Valley Suburb: Large 91.2 9.0 F
10 Lakeview High School conventionalLakeview (Macomb)
Suburb: Large 91.7 9.1 F
11 New Haven High School conventional new Haven Suburb: Large 91.8 9.5 F
12 Beecher High School conventional Beecher Suburb: Large 92.1 10.3 D
13 River Rouge High School conventional river rouge Suburb: Large 92.2 10.5 D
14 Chippewa Valley High School conventional chippewa Valley Suburb: Large 92.6 10.8 D
15 Lamphere High School conventional Lamphere Suburb: Large 92.7 11.3 D
16 Waverly Sr High School conventional Waverly Suburb: Large 92.8 11.7 D
† Denotes schools that have less than four years of data publicly available, but still have enough publicly available data to be included in the model.
Public high schools in remote towns made up half of the top 10 percent of town public high schools based on CAP Scores (see Graphic 13). One of the two town charter high schools was among the top eight in the graphic. The Midland school district had two high schools among the top 10 percent of town public high schools based on CAP Scores.
Graphic 13: Top 10 Percent of Town Public High Schools Based on 2008-2011 Overall CAP Score
Rank High School School TypeDistrict or Municipality
LocaleOverall CAP Values
Score percent rank Grade
1 Calumet High School conventional calumet town: remote 114.2 96.8 A
2 H.H. Dow High School conventional Midland town: Distant 111.7 95.1 A
3 Watervliet Sr High School conventional Watervliet town: Fringe 110.7 93.7 A
4 South Haven High School conventional South Haven town: Distant 109.8 92.4 A
5 Ishpeming High School conventional ishpeming town: remote 109.1 90.9 A
6 Crossroads Charter Academy charter Big rapids town: remote 108.7 89.7 B
7 Midland High School conventional Midland town: Distant 108.6 89.2 B
8 West Iron County High School conventional West iron county town: remote 107.6 87.1 B
The Michigan Public High School Context and Performance Report Card 15
Mackinac Center for Public Policy
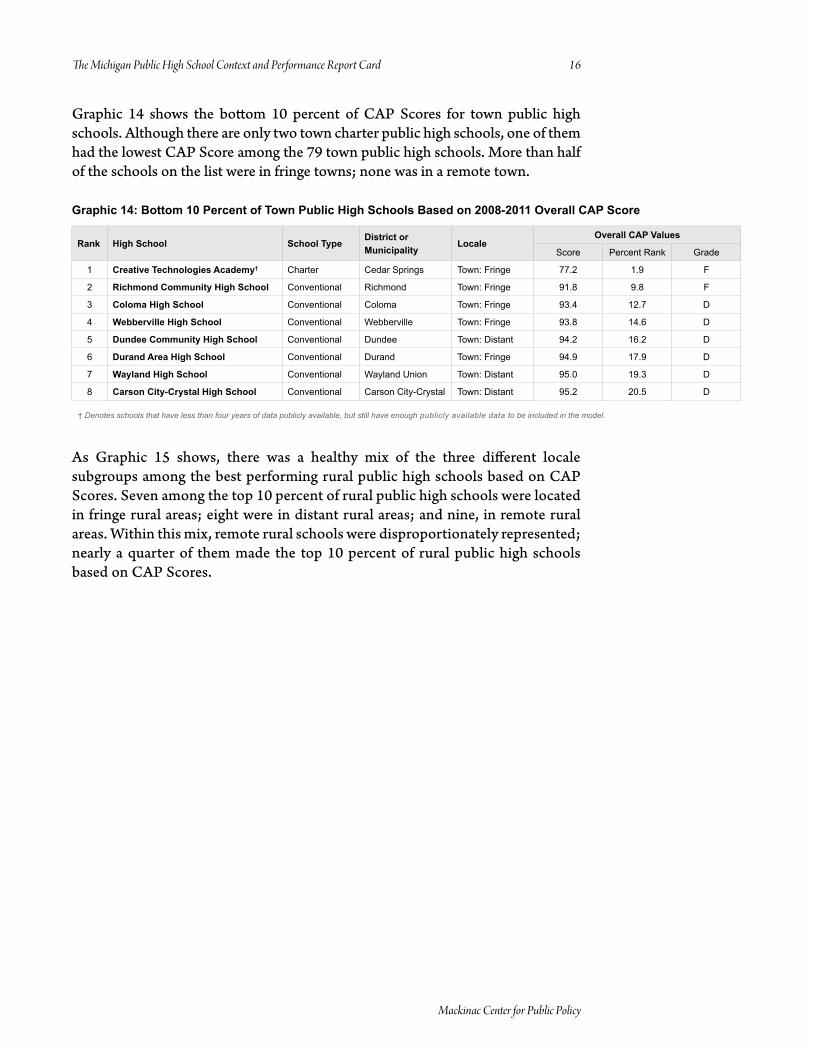
Graphic 14 shows the bottom 10 percent of CAP Scores for town public high schools. Although there are only two town charter public high schools, one of them had the lowest CAP Score among the 79 town public high schools. More than half of the schools on the list were in fringe towns; none was in a remote town.
Graphic 14: Bottom 10 Percent of Town Public High Schools Based on 2008-2011 Overall CAP Score
Rank High School School TypeDistrict or Municipality
LocaleOverall CAP Values
Score percent rank Grade
1 Creative Technologies Academy† charter cedar Springs town: Fringe 77.2 1.9 F
2 Richmond Community High School conventional richmond town: Fringe 91.8 9.8 F
3 Coloma High School conventional coloma town: Fringe 93.4 12.7 D
4 Webberville High School conventional Webberville town: Fringe 93.8 14.6 D
5 Dundee Community High School conventional Dundee town: Distant 94.2 16.2 D
6 Durand Area High School conventional Durand town: Fringe 94.9 17.9 D
7 Wayland High School conventional Wayland Union town: Distant 95.0 19.3 D
8 Carson City-Crystal High School conventional carson city-crystal town: Distant 95.2 20.5 D
† Denotes schools that have less than four years of data publicly available, but still have enough publicly available data to be included in the model.
As Graphic 15 shows, there was a healthy mix of the three different locale subgroups among the best performing rural public high schools based on CAP Scores. Seven among the top 10 percent of rural public high schools were located in fringe rural areas; eight were in distant rural areas; and nine, in remote rural areas. Within this mix, remote rural schools were disproportionately represented; nearly a quarter of them made the top 10 percent of rural public high schools based on CAP Scores.
The Michigan Public High School Context and Performance Report Card 16
Mackinac Center for Public Policy

Graphic 15: Top 10 Percent of Rural Public High Schools Based on 2008-2011 Overall CAP Score
Rank High School School TypeDistrict or Municipality
LocaleOverall CAP Values
Score percent rank Grade
1 North Huron School† conventional north Huron rural: Distant 123.3 99.0 A
2 Baldwin Sr High School† conventional Baldwin rural: remote 117.9 98.1 A
3 Mio AuSable High School conventional Mio AuSable rural: remote 116.3 97.8 A
4 Jeffers High School conventional Adams township rural: Distant 115.8 97.6 A
5 Covert High School conventional covert rural: Distant 115.3 97.3 A
6 Benzie Central Sr High School conventionalBenzie county central
rural: remote 113.9 96.4 A
7 Fairview High School† conventional Fairview rural: remote 113.8 96.3 A
8 Okemos High School conventional okemos rural: Fringe 113.6 96.1 A
9 Lawton High School conventional Lawton rural: Fringe 113.0 95.8 A
10 Bloomingdale Middle and High School conventional Bloomingdale rural: Distant 113.0 95.6 A
11 Whittemore-Prescott Area High School conventional
Whittemore-prescott
rural: remote 112.2 95.4 A
12 Gwinn High School conventional Gwinn rural: remote 111.5 94.6 A
13 White Cloud High School conventional White cloud rural: Distant 111.3 94.2 A
14 Spring Lake High School conventional Spring Lake rural: Fringe 111.2 94.1 A
15 Grayling High School conventional crawford AuSable rural: Fringe 110.8 93.9 A
16 Brethren High School conventionalkaleva norman Dickson
rural: remote 110.6 93.6 A
17 Shelby High School conventional Shelby rural: Distant 110.6 93.4 A
18 Forest Area High School conventional Forest rural: remote 110.4 93.2 A
19 Houghton Central High School conventionalHoughton- portage township
rural: Fringe 110.3 93.1 A
20 Harbor Beach Community High School conventional Harbor Beach rural: remote 109.7 92.0 A
21 Roscommon High School conventional roscommon rural: Distant 109.5 91.7 A
22 Lake City High School conventional Lake city rural: Distant 109.4 91.4 A
23 Cass City High School conventional cass city rural: Fringe 109.1 91.0 A
24 Hancock Central High School conventional Hancock rural: Fringe 108.9 90.4 A
† Denotes schools that have less than four years of data publicly available, but still have enough publicly available data to be included in the model.
Unlike the list of rural public high schools with high CAP Scores in Graphic 15, the list of rural public high schools with the lowest CAP Scores is dominated by fringe and distant rural schools (see Graphic 16). Only one remote rural high school made the list.
The Michigan Public High School Context and Performance Report Card 17
Mackinac Center for Public Policy

Graphic 16: Bottom 10 Percent of Rural Public High Schools Based on 2008-2011 Overall CAP Score
Rank High School School TypeDistrict or Municipality
LocaleOverall CAP Values
Score percent rank Grade
1 Buena Vista High School conventional Buena Vista rural: Fringe 82.1 3.7 F
2 Lincoln Sr High School conventional Lincoln rural: Fringe 86.7 5.8 F
3 Summerfield High School conventional Summerfield rural: Distant 86.8 6.1 F
4 Jefferson High School conventional Jefferson (Monroe) rural: Fringe 88.4 6.4 F
5 Whiteford High School conventionalWhiteford Agricultural
rural: Fringe 88.5 6.6 F
6 Morrice Area High School conventional Morrice rural: Fringe 89.0 6.8 F
7 Kent City High School conventional kent city rural: Fringe 89.2 7.1 F
8 Grass Lake High School conventional Grass Lake rural: Distant 89.7 7.4 F
9 Armada High School conventional Armada rural: Distant 90.1 7.6 F
10 Britton-Macon Area School† conventional Britton-Macon rural: Distant 90.2 7.8 F
11 Airport Sr High School conventional Airport rural: Fringe 90.3 8.0 F
12 Potterville High School conventional potterville rural: Fringe 90.5 8.1 F
13 Harper Creek High School conventional Harper creek rural: Fringe 91.8 9.3 F
14 Bellevue Jr/Sr High School conventional Bellevue rural: Distant 91.8 9.6 F
15 Milan High School conventional Milan rural: Fringe 92.6 10.7 D
16 Climax-Scotts High School conventional climax-Scotts rural: Fringe 92.6 11.0 D
17 Grant High School conventional Grant rural: Distant 92.7 11.2 D
18 Almont High School conventional Almont rural: Fringe 93.3 12.4 D
19 North Adams High School† conventionalnorth Adams-Jerome
rural: Distant 93.6 13.0 D
20 Sand Creek High School conventional Sand creek rural: Distant 93.7 14.0 D
21 Onsted Community High School conventional onsted rural: Distant 93.8 14.2 D
22 Northwest High School conventional northwest rural: Fringe 93.8 14.7 D
23 Marion High School conventional Marion rural: remote 93.9 15.1 D
24 Tri-Township School† conventional rapid river rural: Distant 94.0 15.4 D
† Denotes schools that have less than four years of data publicly available, but still have enough publicly available data to be included in the model.
The Complete Report Card
Below are the CAP Scores for all of Michigan’s general education public high schools for which data were publicly available. The schools are listed in alphabetical order.
Recall that CAP Scores above 100 indicate schools that have performed better than projected on standardized tests given their student population’s socioeconomic status; CAP Scores below 100 indicate schools that have performed worse than projected. Also recall that a school’s “percent rank” indicates the percentage of other schools that scored lower, and that grades were assigned to the schools’ CAP Scores based on a standard bell curve.
The Michigan Public High School Context and Performance Report Card 18
Mackinac Center for Public Policy

* Indicates not enough data were publicly available to include the school in the model.† Denotes schools that have less than four years of data publicly available, but still have enough publicly available data to be included in the model. ‡ As noted in Appendix E, several schools were erroneously listed in government tables as general education high schools and thus were originally included in the model. The subsequent removal of these schools from our graphics means that the percent rank of the school with the lowest CAP Score is not zero.
The Michigan Public High School CAP Report Card: Alphabetical
Rank High School School Type District or Municipality LocaleOverall CAP Values
Score percent rank Grade
132 A.D. Johnston Jr/Sr High School conventional Bessemer rural: Distant 105.1 77.8 B
364 Academy for Business and Technology High School charter Melvindale Suburb: Large 98.8 38.6 c
410 Addison Jr/Sr High School conventional Addison rural: Distant 97.3 30.8 c
* Adelante High School conventional Grand rapids city: Midsize * * *
461 Adlai Stevenson High School conventional Utica Suburb: Large 95.5 22.2 D
129 Advanced Technology Academy† charter Dearborn city: Small 105.2 78.3 B
400 AGBU Alex-Marie Manoogian School† charter Southfield city: Small 97.7 32.5 c
545 Airport Sr High School conventional Airport rural: Fringe 90.3 8.0 F
* Aisha Shule/WEB Dubois Prep. Academy School charter Detroit city: Large * * *
* Akron-Fairgrove Jr/Sr High School conventional Akron-Fairgrove rural: Distant * * *
* Alanson Public School conventional Alanson rural: Distant * * *
* Alba School conventional Alba rural: remote * * *
144 Albion High School conventional Albion town: Distant 104.3 75.8 B
247 Alcona Community High School conventional Alcona rural: Distant 101.6 58.4 c
347 Algonac High School conventional Algonac Suburb: Large 99.2 41.5 c
475 Allen Academy charter Detroit city: Large 95.1 19.8 D
456 Allen Park High School conventional Allen park Suburb: Large 95.7 23.0 D
325 Allendale High School conventional Allendale Suburb: Large 99.6 45.2 c
319 Alma Sr High School conventional Alma town: Distant 99.8 46.2 c
519 Almont High School conventional Almont rural: Fringe 93.3 12.4 D
242 Alpena High School conventional Alpena town: remote 101.8 59.2 c
489 Anchor Bay High School conventional Anchor Bay rural: Fringe 94.7 17.4 D
119 Annapolis High School conventional Dearborn Heights #7 Suburb: Large 105.7 80.0 B
* Arenac Eastern Middle/High School conventional Arenac eastern rural: remote * * *
547 Armada High School conventional Armada rural: Distant 90.1 7.6 F
137 Arthur Hill High School conventional Saginaw city: Small 104.7 77.0 B
551 Arts Academy in the Woods charter Fraser Suburb: Large 89.1 6.9 F
* Ashley High School conventional Ashley rural: Distant * * *
379 Athens High School conventional Athens rural: Distant 98.4 36.0 c
213 Athens High School conventional troy city: Small 102.5 64.1 c
415 Atherton High School conventional Atherton Suburb: Large 97.1 29.9 c
* Atlanta Community Schools conventional Atlanta rural: remote * * *
* Au Gres-Sims Middle and High School conventional Au Gres-Sims rural: Distant * * *
326 Avondale High School conventional Avondale Suburb: Large 99.6 45.0 c
107 Bad Axe High School conventional Bad Axe rural: Fringe 106.1 82.1 B
12 Baldwin Sr High School† conventional Baldwin rural: remote 117.9 98.1 A
135 Bangor High School conventional Bangor rural: Distant 104.9 77.3 B
356 Baraga Area High School conventional Baraga rural: remote 98.9 39.9 c
167 Bark River-Harris Jr/Sr High School conventional Bark river-Harris rural: remote 103.5 71.9 B
488 Bath High School conventional Bath rural: Fringe 94.7 17.6 D
275 Battle Creek Central High School conventional Battle creek city: Small 101.0 53.6 c
256 Bay City Central High School conventional Bay city city: Small 101.4 56.9 c
The Michigan Public High School CAP Report Card: Alphabetical
Mackinac Center for Public Policy
The Michigan Public High School Context and Performance Report Card 19
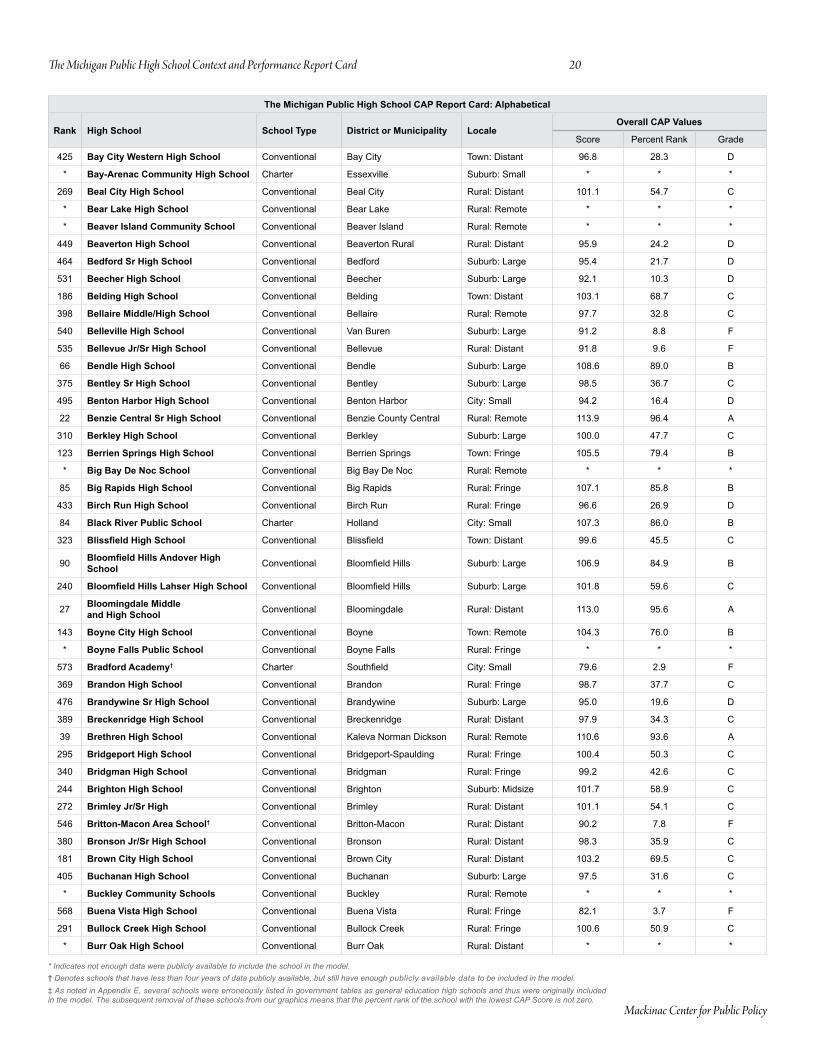
* Indicates not enough data were publicly available to include the school in the model.† Denotes schools that have less than four years of data publicly available, but still have enough publicly available data to be included in the model. ‡ As noted in Appendix E, several schools were erroneously listed in government tables as general education high schools and thus were originally included in the model. The subsequent removal of these schools from our graphics means that the percent rank of the school with the lowest CAP Score is not zero.
The Michigan Public High School CAP Report Card: Alphabetical
Rank High School School Type District or Municipality LocaleOverall CAP Values
Score percent rank Grade
425 Bay City Western High School conventional Bay city town: Distant 96.8 28.3 D
* Bay-Arenac Community High School charter essexville Suburb: Small * * *
269 Beal City High School conventional Beal city rural: Distant 101.1 54.7 c
* Bear Lake High School conventional Bear Lake rural: remote * * *
* Beaver Island Community School conventional Beaver island rural: remote * * *
449 Beaverton High School conventional Beaverton rural rural: Distant 95.9 24.2 D
464 Bedford Sr High School conventional Bedford Suburb: Large 95.4 21.7 D
531 Beecher High School conventional Beecher Suburb: Large 92.1 10.3 D
186 Belding High School conventional Belding town: Distant 103.1 68.7 c
398 Bellaire Middle/High School conventional Bellaire rural: remote 97.7 32.8 c
540 Belleville High School conventional Van Buren Suburb: Large 91.2 8.8 F
535 Bellevue Jr/Sr High School conventional Bellevue rural: Distant 91.8 9.6 F
66 Bendle High School conventional Bendle Suburb: Large 108.6 89.0 B
375 Bentley Sr High School conventional Bentley Suburb: Large 98.5 36.7 c
495 Benton Harbor High School conventional Benton Harbor city: Small 94.2 16.4 D
22 Benzie Central Sr High School conventional Benzie county central rural: remote 113.9 96.4 A
310 Berkley High School conventional Berkley Suburb: Large 100.0 47.7 c
123 Berrien Springs High School conventional Berrien Springs town: Fringe 105.5 79.4 B
* Big Bay De Noc School conventional Big Bay De noc rural: remote * * *
85 Big Rapids High School conventional Big rapids rural: Fringe 107.1 85.8 B
433 Birch Run High School conventional Birch run rural: Fringe 96.6 26.9 D
84 Black River Public School charter Holland city: Small 107.3 86.0 B
323 Blissfield High School conventional Blissfield town: Distant 99.6 45.5 c
90 Bloomfield Hills Andover High School conventional Bloomfield Hills Suburb: Large 106.9 84.9 B
240 Bloomfield Hills Lahser High School conventional Bloomfield Hills Suburb: Large 101.8 59.6 c
27 Bloomingdale Middle and High School conventional Bloomingdale rural: Distant 113.0 95.6 A
143 Boyne City High School conventional Boyne town: remote 104.3 76.0 B
* Boyne Falls Public School conventional Boyne Falls rural: Fringe * * *
573 Bradford Academy† charter Southfield city: Small 79.6 2.9 F
369 Brandon High School conventional Brandon rural: Fringe 98.7 37.7 c
476 Brandywine Sr High School conventional Brandywine Suburb: Large 95.0 19.6 D
389 Breckenridge High School conventional Breckenridge rural: Distant 97.9 34.3 c
39 Brethren High School conventional kaleva norman Dickson rural: remote 110.6 93.6 A
295 Bridgeport High School conventional Bridgeport-Spaulding rural: Fringe 100.4 50.3 c
340 Bridgman High School conventional Bridgman rural: Fringe 99.2 42.6 c
244 Brighton High School conventional Brighton Suburb: Midsize 101.7 58.9 c
272 Brimley Jr/Sr High conventional Brimley rural: Distant 101.1 54.1 c
546 Britton-Macon Area School† conventional Britton-Macon rural: Distant 90.2 7.8 F
380 Bronson Jr/Sr High School conventional Bronson rural: Distant 98.3 35.9 c
181 Brown City High School conventional Brown city rural: Distant 103.2 69.5 c
405 Buchanan High School conventional Buchanan Suburb: Large 97.5 31.6 c
* Buckley Community Schools conventional Buckley rural: remote * * *
568 Buena Vista High School conventional Buena Vista rural: Fringe 82.1 3.7 F
291 Bullock Creek High School conventional Bullock creek rural: Fringe 100.6 50.9 c
* Burr Oak High School conventional Burr oak rural: Distant * * *
Mackinac Center for Public Policy
The Michigan Public High School Context and Performance Report Card 20

* Indicates not enough data were publicly available to include the school in the model.† Denotes schools that have less than four years of data publicly available, but still have enough publicly available data to be included in the model. ‡ As noted in Appendix E, several schools were erroneously listed in government tables as general education high schools and thus were originally included in the model. The subsequent removal of these schools from our graphics means that the percent rank of the school with the lowest CAP Score is not zero.
The Michigan Public High School CAP Report Card: Alphabetical
Rank High School School Type District or Municipality LocaleOverall CAP Values
Score percent rank Grade
* Burt Township School conventional Burt township rural: remote * * *
431 Byron Area High School conventional Byron rural: Distant 96.7 27.2 D
* Byron Center Charter School charter Byron center rural: Fringe * * *
227 Byron Center High School conventional Byron center rural: Fringe 102.2 61.8 c
133 Cadillac Sr High School conventional cadillac town: remote 105.0 77.7 B
294 Caledonia High School conventional caledonia rural: Fringe 100.4 50.4 c
20 Calumet High School conventional calumet town: remote 114.2 96.8 A
384 Camden-Frontier High School† conventional camden-Frontier rural: remote 98.1 35.2 c
169 Canton High School conventional plymouth-canton Suburb: Large 103.5 71.6 B
371 Capac High School conventional capac rural: Distant 98.6 37.4 c
208 Carman-Ainsworth High School conventional carman-Ainsworth Suburb: Large 102.7 65.0 c
* Carney-Nadeau School conventional carney-nadeau rural: remote * * *
131 Caro High School conventional caro town: Distant 105.2 78.0 B
368 Carrollton High School conventional carrollton Suburb: Midsize 98.7 37.9 c
471 Carson City-Crystal High School conventional carson city-crystal town: Distant 95.2 20.5 D
75 Carsonville-Port Sanilac High School conventional carsonville-port Sanilac rural: Distant 108.0 87.5 B
* Casa Richard Academy charter Detroit city: Large * * *
* Caseville High School conventional caseville rural: remote * * *
54 Cass City High School conventional cass city rural: Fringe 109.1 91.0 A
29 Cass Technical High School Selective Detroit city: Large 111.7 95.3 A
219 Cedar Springs High School conventional cedar Springs town: Fringe 102.3 63.1 c
* Cedarville High School conventional Les cheneaux rural: remote * * *
163 Center Line High School conventional center Line Suburb: Large 103.7 72.6 B
* Central Academy charter Ann Arbor city: Midsize * * *
576 Central High School conventional Detroit city: Large 78.3 2.4 F
88 Central High School conventional traverse city town: remote 107.0 85.3 B
76 Central High School conventional Forest Hills Suburb: Large 107.9 87.3 B
63 Central High School conventional Grand rapids city: Midsize 108.7 89.5 B
145 Central Lake Public School† conventional central Lake rural: remote 104.3 75.6 B
238 Central Montcalm High School conventional central Montcalm rural: Distant 101.9 59.9 c
253 Centreville High School conventional centreville rural: Distant 101.5 57.4 c
2 Cesar Chavez High School charter Detroit city: Large 135.4 99.8 A
160 Chandler Park Academy High School† charter Harper Woods Suburb: Large 103.9 73.1 B
204 Charlevoix High School conventional charlevoix rural: Fringe 102.9 65.7 c
397 Charlotte Sr High School conventional charlotte town: Distant 97.7 33.0 c
* Charyl Stockwell Academy High School charter Hartland Suburb: Large * * *
* Chassell K-12 School conventional chassell township rural: Fringe * * *
73 Cheboygan Area High School conventional cheboygan rural: Fringe 108.2 87.8 B
154 Chelsea High School conventional chelsea town: Fringe 104.0 74.1 B
436 Chesaning Union High School conventional chesaning Union rural: Distant 96.4 26.4 D
146 Chippewa Hills High School conventional chippewa Hills rural: remote 104.3 75.5 B
528 Chippewa Valley High School conventional chippewa Valley Suburb: Large 92.6 10.8 D
308 Churchill High School conventional Livonia city: Small 100.1 48.1 c
4 City Middle/High School Selective Grand rapids city: Midsize 130.5 99.5 A
268 Clare High School conventional clare town: remote 101.2 54.8 c
Mackinac Center for Public Policy
The Michigan Public High School Context and Performance Report Card 21

* Indicates not enough data were publicly available to include the school in the model.† Denotes schools that have less than four years of data publicly available, but still have enough publicly available data to be included in the model. ‡ As noted in Appendix E, several schools were erroneously listed in government tables as general education high schools and thus were originally included in the model. The subsequent removal of these schools from our graphics means that the percent rank of the school with the lowest CAP Score is not zero.
The Michigan Public High School CAP Report Card: Alphabetical
Rank High School School Type District or Municipality LocaleOverall CAP Values
Score percent rank Grade
421 Clarenceville High School conventional clarenceville city: Small 96.9 28.9 D
321 Clarkston High School conventional clarkston Suburb: Large 99.6 45.9 c
19 Classical Academy† Selective Flint city: Midsize 114.2 97.0 A
484 Clawson High School conventional clawson Suburb: Large 94.9 18.3 D
527 Climax-Scotts High School conventional climax-Scotts rural: Fringe 92.6 11.0 D
441 Clinton High School conventional clinton rural: Distant 96.2 25.5 D
520 Clintondale High School conventional clintondale Suburb: Large 93.3 12.2 D
357 Clio Area High School conventional clio Suburb: Large 98.9 39.8 c
581 Cody College Preparatory Upper School of Teaching and Learning conventional Detroit city: Large 75.5 1.5 F
468 Coldwater High School conventional coldwater town: Distant 95.3 21.0 D
324 Coleman Jr/Sr High School conventional coleman rural: Distant 99.6 45.3 c
517 Coloma High School conventional coloma town: Fringe 93.4 12.7 D
164 Colon High School conventional colon rural: Distant 103.7 72.4 B
184 Columbia Central High School conventional columbia rural: Fringe 103.2 69.0 c
393 Communication and Media Arts High School conventional Detroit city: Large 97.8 33.7 c
56 Comstock High School conventional comstock Suburb: Midsize 109.0 90.7 A
260 Comstock Park High School conventional comstock park Suburb: Large 101.4 56.2 c
* Concord Academy-Boyne charter Boyne city rural: Fringe * * *
* Concord Academy-Petoskey charter petoskey rural: Fringe * * *
440 Concord High School conventional concord rural: Fringe 96.2 25.7 D
* Concord Montessori and Community School charter Mancelona rural: remote * * *
571 Conner Creek Academy East Michigan Collegiate High School charter Warren city: Midsize 81.5 3.2 F
267 Constantine High School conventional constantine town: Distant 101.3 55.0 c
302 Coopersville High School conventional coopersville town: Fringe 100.2 49.1 c
399 Corunna High School conventional corunna town: Distant 97.7 32.7 c
* Countryside Academy-High School charter Benton Harbor rural: Fringe * * *
512 Cousino Sr High School conventional Warren city: Midsize 93.7 13.5 D
17 Covert High School conventional covert rural: Distant 115.3 97.3 A
579 Creative Technologies Academy† charter cedar Springs town: Fringe 77.2 1.9 F
* Creston Community School conventional Grand rapids city: Midsize * * *
44 Creston High School conventional Grand rapids city: Midsize 110.1 92.7 A
106 Crestwood High School conventional crestwood Suburb: Large 106.1 82.2 B
524 Crockett High School conventional Detroit city: Large 92.7 11.5 D
62 Crossroads Charter Academy charter Big rapids town: remote 108.7 89.7 B
110 Croswell-Lexington High School conventional croswell-Lexington rural: Fringe 106.0 81.6 B
539 Dakota High School conventional chippewa Valley Suburb: Large 91.2 9.0 F
465 Dansville High School conventional Dansville rural: Distant 95.4 21.5 D
32 Davis Aerospace High School Selective Detroit city: Large 111.6 94.8 A
161 Davison High School conventional Davison Suburb: Large 103.8 72.9 B
114 Dearborn High School conventional Dearborn city: Small 105.9 80.9 B
59 Decatur High School conventional Decatur rural: Distant 108.9 90.2 A
94 Deckerville Community High School conventional Deckerville rural: Distant 106.5 84.3 B
* Deerfield Public Schools conventional Deerfield rural: Distant * * *
Mackinac Center for Public Policy
The Michigan Public High School Context and Performance Report Card 22

* Indicates not enough data were publicly available to include the school in the model.† Denotes schools that have less than four years of data publicly available, but still have enough publicly available data to be included in the model. ‡ As noted in Appendix E, several schools were erroneously listed in government tables as general education high schools and thus were originally included in the model. The subsequent removal of these schools from our graphics means that the percent rank of the school with the lowest CAP Score is not zero.
The Michigan Public High School CAP Report Card: Alphabetical
Rank High School School Type District or Municipality LocaleOverall CAP Values
Score percent rank Grade
421 Clarenceville High School conventional clarenceville city: Small 96.9 28.9 D
321 Clarkston High School conventional clarkston Suburb: Large 99.6 45.9 c
19 Classical Academy† Selective Flint city: Midsize 114.2 97.0 A
484 Clawson High School conventional clawson Suburb: Large 94.9 18.3 D
527 Climax-Scotts High School conventional climax-Scotts rural: Fringe 92.6 11.0 D
441 Clinton High School conventional clinton rural: Distant 96.2 25.5 D
520 Clintondale High School conventional clintondale Suburb: Large 93.3 12.2 D
357 Clio Area High School conventional clio Suburb: Large 98.9 39.8 c
581 Cody College Preparatory Upper School of Teaching and Learning conventional Detroit city: Large 75.5 1.5 F
468 Coldwater High School conventional coldwater town: Distant 95.3 21.0 D
324 Coleman Jr/Sr High School conventional coleman rural: Distant 99.6 45.3 c
517 Coloma High School conventional coloma town: Fringe 93.4 12.7 D
164 Colon High School conventional colon rural: Distant 103.7 72.4 B
184 Columbia Central High School conventional columbia rural: Fringe 103.2 69.0 c
393 Communication and Media Arts High School conventional Detroit city: Large 97.8 33.7 c
56 Comstock High School conventional comstock Suburb: Midsize 109.0 90.7 A
260 Comstock Park High School conventional comstock park Suburb: Large 101.4 56.2 c
* Concord Academy-Boyne charter Boyne city rural: Fringe * * *
* Concord Academy-Petoskey charter petoskey rural: Fringe * * *
440 Concord High School conventional concord rural: Fringe 96.2 25.7 D
* Concord Montessori and Community School charter Mancelona rural: remote * * *
571 Conner Creek Academy East Michigan Collegiate High School charter Warren city: Midsize 81.5 3.2 F
267 Constantine High School conventional constantine town: Distant 101.3 55.0 c
302 Coopersville High School conventional coopersville town: Fringe 100.2 49.1 c
399 Corunna High School conventional corunna town: Distant 97.7 32.7 c
* Countryside Academy-High School charter Benton Harbor rural: Fringe * * *
512 Cousino Sr High School conventional Warren city: Midsize 93.7 13.5 D
17 Covert High School conventional covert rural: Distant 115.3 97.3 A
579 Creative Technologies Academy† charter cedar Springs town: Fringe 77.2 1.9 F
* Creston Community School conventional Grand rapids city: Midsize * * *
44 Creston High School conventional Grand rapids city: Midsize 110.1 92.7 A
106 Crestwood High School conventional crestwood Suburb: Large 106.1 82.2 B
524 Crockett High School conventional Detroit city: Large 92.7 11.5 D
62 Crossroads Charter Academy charter Big rapids town: remote 108.7 89.7 B
110 Croswell-Lexington High School conventional croswell-Lexington rural: Fringe 106.0 81.6 B
539 Dakota High School conventional chippewa Valley Suburb: Large 91.2 9.0 F
465 Dansville High School conventional Dansville rural: Distant 95.4 21.5 D
32 Davis Aerospace High School Selective Detroit city: Large 111.6 94.8 A
161 Davison High School conventional Davison Suburb: Large 103.8 72.9 B
114 Dearborn High School conventional Dearborn city: Small 105.9 80.9 B
59 Decatur High School conventional Decatur rural: Distant 108.9 90.2 A
94 Deckerville Community High School conventional Deckerville rural: Distant 106.5 84.3 B
* Deerfield Public Schools conventional Deerfield rural: Distant * * *
The Michigan Public High School CAP Report Card: Alphabetical
Rank High School School Type District or Municipality LocaleOverall CAP Values
Score percent rank Grade
313 Delton-Kellogg High School conventional Delton-kellogg rural: Distant 99.9 47.2 c
582 Denby High School conventional Detroit city: Large 75.1 1.4 F
* DeTour High School conventional Detour rural: remote * * *
567 Detroit Academy of Arts and Sciences High School charter Detroit city: Large 82.2 3.9 F
584 Detroit City High School† conventional Detroit city: Large 73.4 1.0 F
560 Detroit Community Schools High School charter Detroit city: Large 86.0 5.2 F
532 Detroit International Academy for Young Women† conventional Detroit city: Large 91.9 10.2 D
518 Detroit Midtown Academy charter Detroit city: Large 93.4 12.5 D
457 Detroit School of Arts conventional Detroit city: Large 95.7 22.8 D
276 DeWitt High School conventional DeWitt Suburb: Large 100.9 53.5 c
170 Dexter High School conventional Dexter rural: Fringe 103.4 71.4 B
* Dollar Bay High School conventional Dollar Bay-tamarack city town: remote * * *
513 Douglass Academy for Young Men conventional Detroit city: Large 93.6 13.4 D
583 Dream Academy† charter Benton Harbor city: Small 74.4 1.2 F
497 Dryden High School conventional Dryden rural: Distant 94.1 16.1 D
496 Dundee Community High School conventional Dundee town: Distant 94.2 16.2 D
486 Durand Area High School conventional Durand town: Fringe 94.9 17.9 D
96 E.A. Johnson Memorial High School conventional Mt. Morris rural: Fringe 106.5 83.9 B
86 Early College Alliance† SelectiveWashtenaw intermediate School District
Suburb: Large 107.1 85.6 B
504 East Detroit High School conventional east Detroit Suburb: Large 93.8 14.9 D
81 East Grand Rapids High School conventional east Grand rapids Suburb: Large 107.4 86.5 B
451 East Jackson High School conventional east Jackson rural: Fringe 95.8 23.9 D
284 East Jordan High School conventional east Jordan rural: Distant 100.7 52.1 c
202 East Kentwood High School conventional kentwood Suburb: Large 102.9 66.0 c
67 East Lansing High School conventional east Lansing city: Small 108.5 88.8 B
223 Eastern High School conventional Lansing city: Midsize 102.3 62.4 c
103 Eastern High School conventional Forest Hills rural: Fringe 106.2 82.7 B
* Eastern Washtenaw Multicultural Academy charter Ann Arbor rural: Fringe * * *
* Eaton Academy charter eastpointe Suburb: Large * * *
312 Eaton Rapids Sr High School conventional eaton rapids town: Fringe 99.9 47.4 c
480 Eau Claire High School conventional eau claire rural: Fringe 95.0 19.0 D
558 Ecorse Community High School† conventional ecorse Suburb: Large 86.3 5.6 F
104 Edsel Ford High School conventional Dearborn city: Small 106.1 82.6 B
222 Edwardsburg High School conventional edwardsburg Suburb: Large 102.3 62.6 c
346 Eisenhower High School conventional Utica Suburb: Large 99.2 41.6 c
197 Elk Rapids High School conventional elk rapids rural: Distant 103.0 66.8 c
* Ellsworth Community School conventional ellsworth rural: Distant * * *
112 Ernest W. Seaholm High School conventional Birmingham Suburb: Large 105.9 81.2 B
209 Escanaba Area Public High School conventional escanaba town: remote 102.6 64.8 c
314 Evart High School conventional evart rural: remote 99.9 47.0 c
335 Everett High School conventional Lansing city: Midsize 99.4 43.5 c
* Ewen-Trout Creek Consolidated School conventional ewen-trout creek rural: remote * * *
Mackinac Center for Public Policy
The Michigan Public High School Context and Performance Report Card 23

* Indicates not enough data were publicly available to include the school in the model.† Denotes schools that have less than four years of data publicly available, but still have enough publicly available data to be included in the model. ‡ As noted in Appendix E, several schools were erroneously listed in government tables as general education high schools and thus were originally included in the model. The subsequent removal of these schools from our graphics means that the percent rank of the school with the lowest CAP Score is not zero.
The Michigan Public High School CAP Report Card: Alphabetical
Rank High School School Type District or Municipality LocaleOverall CAP Values
Score percent rank Grade
6 Excel Charter Academy Grand River Prep School† charter kentwood Suburb: Large 123.3 99.2 A
23 Fairview High School† conventional Fairview rural: remote 113.8 96.3 A
355 Farmington High School conventional Farmington Suburb: Large 98.9 40.1 c
178 Farwell High School conventional Farwell rural: Distant 103.3 70.1 B
195 Fennville Public High School conventional Fennville rural: Distant 103.0 67.2 c
231 Fenton Sr High School conventional Fenton Suburb: Large 102.2 61.1 c
322 Ferndale High School conventional Ferndale Suburb: Large 99.6 45.7 c
585 Finney High School conventional Detroit city: Large 70.8 0.7‡ F
236 Fitzgerald Sr High School conventional Fitzgerald city: Midsize 102.0 60.2 c
427 Flat Rock Community High School conventional Flat rock Suburb: Large 96.7 27.9 D
353 Flushing High School conventional Flushing Suburb: Large 99.0 40.4 c
564 Ford High School conventional Detroit city: Large 83.0 4.6 F
49 Fordson High School conventional Dearborn city: Small 109.7 91.9 A
41 Forest Area High School conventional Forest rural: remote 110.4 93.2 A
279 Forest Park School conventional Forest park rural: remote 100.9 53.0 c
403 Fowler High School conventional Fowler rural: Distant 97.6 32.0 c
460 Fowlerville High School conventional Fowlerville town: Fringe 95.5 22.3 D
140 Frankenmuth High School conventional Frankenmuth rural: Fringe 104.5 76.5 B
177 Frankfort High School conventional Frankfort-elberta rural: remote 103.3 70.2 B
429 Franklin High School conventional Livonia city: Small 96.7 27.6 D
470 Fraser High School conventional Fraser Suburb: Large 95.3 20.6 D
373 Freeland Middle School/High School conventional Freeland rural: Fringe 98.6 37.1 c
338 Fremont High School conventional Fremont town: Distant 99.3 43.0 c
82 Frontier International Academy charter Hamtramck Suburb: Large 107.4 86.3 B
288 Fruitport High School conventional Fruitport Suburb: Midsize 100.6 51.4 c
333 Fulton High School conventional Fulton rural: Distant 99.4 43.8 c
150 Galesburg-Augusta High School conventional Galesburg-Augusta rural: Fringe 104.1 74.8 B
257 Garber High School conventional essexville-Hampton Suburb: Small 101.4 56.7 c
491 Garden City High School conventional Garden city Suburb: Large 94.6 17.1 D
130 Gaylord High School conventional Gaylord rural: Fringe 105.2 78.2 B
9 Genesee Early College† Selective Flint city: Midsize 120.0 98.6 A
522 Genesee High School conventional Genesee Suburb: Large 92.9 11.8 D
* George Crockett Consortium High School charter Detroit city: Large * * *
286 Gladstone Area High School conventional Gladstone rural: Fringe 100.7 51.8 c
149 Gladwin High School conventional Gladwin town: Distant 104.2 75.0 B
165 Gobles High School conventional Gobles rural: Distant 103.6 72.3 B
72 Godwin Heights Sr High School conventional Godwin Heights city: Small 108.2 88.0 B
337 Goodrich High School conventional Goodrich rural: Fringe 99.3 43.1 c
99 Grand Blanc Community High School conventional Grand Blanc Suburb: Large 106.3 83.4 B
57 Grand Haven High School conventional Grand Haven Suburb: Midsize 108.9 90.5 A
402 Grand Ledge High School conventional Grand Ledge Suburb: Large 97.6 32.1 c
* Grand Rapids Montessori Public School conventional Grand rapids city: Midsize * * *
396 Grand Traverse Academy† charter traverse city rural: Fringe 97.8 33.2 c
Mackinac Center for Public Policy
The Michigan Public High School Context and Performance Report Card 24

* Indicates not enough data were publicly available to include the school in the model.† Denotes schools that have less than four years of data publicly available, but still have enough publicly available data to be included in the model. ‡ As noted in Appendix E, several schools were erroneously listed in government tables as general education high schools and thus were originally included in the model. The subsequent removal of these schools from our graphics means that the percent rank of the school with the lowest CAP Score is not zero.
The Michigan Public High School CAP Report Card: Alphabetical
Rank High School School Type District or Municipality LocaleOverall CAP Values
Score percent rank Grade
6 Excel Charter Academy Grand River Prep School† charter kentwood Suburb: Large 123.3 99.2 A
23 Fairview High School† conventional Fairview rural: remote 113.8 96.3 A
355 Farmington High School conventional Farmington Suburb: Large 98.9 40.1 c
178 Farwell High School conventional Farwell rural: Distant 103.3 70.1 B
195 Fennville Public High School conventional Fennville rural: Distant 103.0 67.2 c
231 Fenton Sr High School conventional Fenton Suburb: Large 102.2 61.1 c
322 Ferndale High School conventional Ferndale Suburb: Large 99.6 45.7 c
585 Finney High School conventional Detroit city: Large 70.8 0.7‡ F
236 Fitzgerald Sr High School conventional Fitzgerald city: Midsize 102.0 60.2 c
427 Flat Rock Community High School conventional Flat rock Suburb: Large 96.7 27.9 D
353 Flushing High School conventional Flushing Suburb: Large 99.0 40.4 c
564 Ford High School conventional Detroit city: Large 83.0 4.6 F
49 Fordson High School conventional Dearborn city: Small 109.7 91.9 A
41 Forest Area High School conventional Forest rural: remote 110.4 93.2 A
279 Forest Park School conventional Forest park rural: remote 100.9 53.0 c
403 Fowler High School conventional Fowler rural: Distant 97.6 32.0 c
460 Fowlerville High School conventional Fowlerville town: Fringe 95.5 22.3 D
140 Frankenmuth High School conventional Frankenmuth rural: Fringe 104.5 76.5 B
177 Frankfort High School conventional Frankfort-elberta rural: remote 103.3 70.2 B
429 Franklin High School conventional Livonia city: Small 96.7 27.6 D
470 Fraser High School conventional Fraser Suburb: Large 95.3 20.6 D
373 Freeland Middle School/High School conventional Freeland rural: Fringe 98.6 37.1 c
338 Fremont High School conventional Fremont town: Distant 99.3 43.0 c
82 Frontier International Academy charter Hamtramck Suburb: Large 107.4 86.3 B
288 Fruitport High School conventional Fruitport Suburb: Midsize 100.6 51.4 c
333 Fulton High School conventional Fulton rural: Distant 99.4 43.8 c
150 Galesburg-Augusta High School conventional Galesburg-Augusta rural: Fringe 104.1 74.8 B
257 Garber High School conventional essexville-Hampton Suburb: Small 101.4 56.7 c
491 Garden City High School conventional Garden city Suburb: Large 94.6 17.1 D
130 Gaylord High School conventional Gaylord rural: Fringe 105.2 78.2 B
9 Genesee Early College† Selective Flint city: Midsize 120.0 98.6 A
522 Genesee High School conventional Genesee Suburb: Large 92.9 11.8 D
* George Crockett Consortium High School charter Detroit city: Large * * *
286 Gladstone Area High School conventional Gladstone rural: Fringe 100.7 51.8 c
149 Gladwin High School conventional Gladwin town: Distant 104.2 75.0 B
165 Gobles High School conventional Gobles rural: Distant 103.6 72.3 B
72 Godwin Heights Sr High School conventional Godwin Heights city: Small 108.2 88.0 B
337 Goodrich High School conventional Goodrich rural: Fringe 99.3 43.1 c
99 Grand Blanc Community High School conventional Grand Blanc Suburb: Large 106.3 83.4 B
57 Grand Haven High School conventional Grand Haven Suburb: Midsize 108.9 90.5 A
402 Grand Ledge High School conventional Grand Ledge Suburb: Large 97.6 32.1 c
* Grand Rapids Montessori Public School conventional Grand rapids city: Midsize * * *
396 Grand Traverse Academy† charter traverse city rural: Fringe 97.8 33.2 c
The Michigan Public High School CAP Report Card: Alphabetical
Rank High School School Type District or Municipality LocaleOverall CAP Values
Score percent rank Grade
237 Grandville High School conventional Grandville Suburb: Large 102.0 60.1 c
526 Grant High School conventional Grant rural: Distant 92.7 11.2 D
548 Grass Lake High School conventional Grass Lake rural: Distant 89.7 7.4 F
* Grattan Academy Middle/ High School charter Greenville rural: Fringe * * *
37 Grayling High School conventional crawford AuSable rural: Fringe 110.8 93.9 A
* Great Lakes Academic Center conventional Boyne city rural: Distant * * *
233 Greenville Sr High School conventional Greenville town: Distant 102.1 60.7 c
243 Grosse Ile High School conventional Grosse ile township Suburb: Large 101.7 59.1 c
248 Grosse Pointe North High School conventional Grosse pointe Suburb: Large 101.6 58.2 c
71 Grosse Pointe South High School conventional Grosse pointe Suburb: Large 108.2 88.2 B
316 Gull Lake High School conventional Gull Lake rural: Fringe 99.8 46.7 c
33 Gwinn High School conventional Gwinn rural: remote 111.5 94.6 A
30 H.H. Dow High School conventional Midland town: Distant 111.7 95.1 A
159 Hale High School conventional Hale rural: remote 103.9 73.3 B
453 Hamady Community High School conventional Westwood Heights Suburb: Large 95.8 23.5 D
118 Hamilton High School conventional Hamilton rural: Distant 105.8 80.2 B
120 Hamtramck High School conventional Hamtramck Suburb: Large 105.7 79.9 B
58 Hancock Central High School conventional Hancock rural: Fringe 108.9 90.4 A
445 Hanover-Horton High School conventional Hanover-Horton rural: Distant 96.1 24.9 D
48 Harbor Beach Community High School conventional Harbor Beach rural: remote 109.7 92.0 A
139 Harbor Springs High School conventional Harbor Springs rural: Distant 104.5 76.6 B
537 Harper Creek High School conventional Harper creek rural: Fringe 91.8 9.3 F
514 Harper Woods High School conventional Harper Woods Suburb: Large 93.6 13.2 D
171 Harrison Community High School conventional Harrison rural: Fringe 103.4 71.2 B
477 Harrison High School conventional Farmington city: Small 95.0 19.5 D
70 Hart High School conventional Hart rural: remote 108.2 88.3 B
187 Hartford High School conventional Hartford town: Distant 103.1 68.5 c
352 Hartland High School conventional Hartland Suburb: Large 99.0 40.6 c
136 Haslett High School conventional Haslett Suburb: Large 104.8 77.2 B
367 Hastings High School conventional Hastings rural: Fringe 98.8 38.1 c
434 Hazel Park High School conventional Hazel park Suburb: Large 96.6 26.7 D
83 HEART Academy charter Harper Woods Suburb: Large 107.3 86.1 B
483 Hemlock High School conventional Hemlock rural: Fringe 94.9 18.4 D
542 Henry Ford Academy charter Dearborn city: Small 91.1 8.5 F
34 Henry Ford Early College† Selective Dearborn Suburb: Large 111.3 94.4 A
378 Henry Ford II High School conventional Utica Suburb: Large 98.4 36.2 c
198 Heritage High School conventional Saginaw township city: Small 103.0 66.7 c
172 Hesperia High School conventional Hesperia rural: Distant 103.4 71.1 B
559 Highland Park Community High School conventional Highland park Suburb: Large 86.2 5.4 F
235 Hillman Community Jr/Sr High School† conventional Hillman rural: remote 102.1 60.4 c
282 Hill-McCloy High School conventional Montrose rural: Fringe 100.8 52.5 c
155 Hillsdale High School conventional Hillsdale town: Distant 104.0 73.9 B
21 Holland High School conventional Holland city: Small 114.1 96.6 A
Mackinac Center for Public Policy
The Michigan Public High School Context and Performance Report Card 25

* Indicates not enough data were publicly available to include the school in the model.† Denotes schools that have less than four years of data publicly available, but still have enough publicly available data to be included in the model. ‡ As noted in Appendix E, several schools were erroneously listed in government tables as general education high schools and thus were originally included in the model. The subsequent removal of these schools from our graphics means that the percent rank of the school with the lowest CAP Score is not zero.
The Michigan Public High School CAP Report Card: Alphabetical
Rank High School School Type District or Municipality LocaleOverall CAP Values
Score percent rank Grade
190 Holly High School conventional Holly rural: Fringe 103.1 68.0 c
334 Holt Sr High School conventional Holt Suburb: Large 99.4 43.7 c
278 Holton High School conventional Holton rural: Distant 100.9 53.1 c
317 Homer Community High School conventional Homer rural: Distant 99.8 46.5 c
* Hope of Detroit Academy Consortium High School charter Detroit city: Large * * *
330 Hopkins High School conventional Hopkins rural: Distant 99.5 44.3 c
42 Houghton Central High School conventionalHoughton- portage township
rural: Fringe 110.3 93.1 A
93 Houghton Lake High School conventional Houghton Lake rural: Fringe 106.5 84.4 B
428 Howell High School conventional Howell Suburb: Midsize 96.7 27.7 D
466 Hudson Area High School conventional Hudson rural: Distant 95.4 21.3 D
205 Hudsonville High School conventional Hudsonville Suburb: Large 102.8 65.5 c
472 Huron High School conventional Huron rural: Fringe 95.2 20.3 D
31 Huron High School conventional Ann Arbor city: Midsize 111.6 94.9 A
382 Ida High School conventional ida rural: Fringe 98.3 35.5 c
241 Imlay City High School conventional imlay city town: Distant 101.8 59.4 c
196 Inland Lakes High School conventional inland Lakes rural: remote 103.0 67.0 c
* International Academy of Macomb Selective chippewa Valley Suburb: Large * * *
5 International Academy Selective Bloomfield Hills Suburb: Large 127.2 99.3 A
8 International Academy of Flint† charter Flint city: Midsize 120.2 98.8 A
206 Ionia High School conventional ionia town: Distant 102.8 65.3 c
261 Iron Mountain High School conventional iron Mountain town: remote 101.4 56.0 c
55 Ishpeming High School conventional ishpeming town: remote 109.1 90.9 A
128 Ithaca High School conventional ithaca town: Distant 105.3 78.5 B
416 J.W. Sexton High School conventional Lansing city: Midsize 97.1 29.8 D
193 Jackson High School conventional Jackson city: Small 103.0 67.5 c
15 Jeffers High School conventional Adams township rural: Distant 115.8 97.6 A
554 Jefferson High School conventional Jefferson (Monroe) rural: Fringe 88.4 6.4 F
214 Jenison High School conventional Jenison Suburb: Large 102.5 64.0 c
151 Johannesburg-Lewiston High School conventional Johannesburg-Lewiston rural: Distant 104.1 74.6 B
521 John F. Kennedy High School conventional taylor city: Small 93.1 12.0 D
444 John Glenn High School conventional Wayne-Westland Suburb: Large 96.1 25.0 D
182 John Glenn High School conventional Bangor township Suburb: Small 103.2 69.4 c
215 Jonesville High School conventional Jonesville rural: Distant 102.5 63.8 c
134 Kalamazoo Central High School conventional kalamazoo Suburb: Midsize 105.0 77.5 B
98 Kalkaska High School conventional kalkaska town: remote 106.4 83.6 B
220 Kearsley High School conventional kearsley Suburb: Large 102.3 62.9 c
18 Kelloggsville High School conventional kelloggsville city: Small 114.8 97.1 A
298 Kenowa Hills High School conventional kenowa Hills Suburb: Large 100.3 49.7 c
570 Kensington Woods High School charter Howell Suburb: Midsize 81.7 3.4 F
550 Kent City High School conventional kent city rural: Fringe 89.2 7.1 F
578 Kettering High School conventional Detroit city: Large 77.3 2.0 F
507 King High School conventional Detroit city: Large 93.8 14.4 D
271 Kingsford High School conventional Breitung township town: remote 101.1 54.3 c
156 Kingsley Area High School conventional kingsley rural: Distant 104.0 73.8 B
492 Kingston High School conventional kingston rural: remote 94.5 16.9 D
Mackinac Center for Public Policy
The Michigan Public High School Context and Performance Report Card 26

* Indicates not enough data were publicly available to include the school in the model.† Denotes schools that have less than four years of data publicly available, but still have enough publicly available data to be included in the model. ‡ As noted in Appendix E, several schools were erroneously listed in government tables as general education high schools and thus were originally included in the model. The subsequent removal of these schools from our graphics means that the percent rank of the school with the lowest CAP Score is not zero.
The Michigan Public High School CAP Report Card: Alphabetical
Rank High School School Type District or Municipality LocaleOverall CAP Values
Score percent rank Grade
190 Holly High School conventional Holly rural: Fringe 103.1 68.0 c
334 Holt Sr High School conventional Holt Suburb: Large 99.4 43.7 c
278 Holton High School conventional Holton rural: Distant 100.9 53.1 c
317 Homer Community High School conventional Homer rural: Distant 99.8 46.5 c
* Hope of Detroit Academy Consortium High School charter Detroit city: Large * * *
330 Hopkins High School conventional Hopkins rural: Distant 99.5 44.3 c
42 Houghton Central High School conventionalHoughton- portage township
rural: Fringe 110.3 93.1 A
93 Houghton Lake High School conventional Houghton Lake rural: Fringe 106.5 84.4 B
428 Howell High School conventional Howell Suburb: Midsize 96.7 27.7 D
466 Hudson Area High School conventional Hudson rural: Distant 95.4 21.3 D
205 Hudsonville High School conventional Hudsonville Suburb: Large 102.8 65.5 c
472 Huron High School conventional Huron rural: Fringe 95.2 20.3 D
31 Huron High School conventional Ann Arbor city: Midsize 111.6 94.9 A
382 Ida High School conventional ida rural: Fringe 98.3 35.5 c
241 Imlay City High School conventional imlay city town: Distant 101.8 59.4 c
196 Inland Lakes High School conventional inland Lakes rural: remote 103.0 67.0 c
* International Academy of Macomb Selective chippewa Valley Suburb: Large * * *
5 International Academy Selective Bloomfield Hills Suburb: Large 127.2 99.3 A
8 International Academy of Flint† charter Flint city: Midsize 120.2 98.8 A
206 Ionia High School conventional ionia town: Distant 102.8 65.3 c
261 Iron Mountain High School conventional iron Mountain town: remote 101.4 56.0 c
55 Ishpeming High School conventional ishpeming town: remote 109.1 90.9 A
128 Ithaca High School conventional ithaca town: Distant 105.3 78.5 B
416 J.W. Sexton High School conventional Lansing city: Midsize 97.1 29.8 D
193 Jackson High School conventional Jackson city: Small 103.0 67.5 c
15 Jeffers High School conventional Adams township rural: Distant 115.8 97.6 A
554 Jefferson High School conventional Jefferson (Monroe) rural: Fringe 88.4 6.4 F
214 Jenison High School conventional Jenison Suburb: Large 102.5 64.0 c
151 Johannesburg-Lewiston High School conventional Johannesburg-Lewiston rural: Distant 104.1 74.6 B
521 John F. Kennedy High School conventional taylor city: Small 93.1 12.0 D
444 John Glenn High School conventional Wayne-Westland Suburb: Large 96.1 25.0 D
182 John Glenn High School conventional Bangor township Suburb: Small 103.2 69.4 c
215 Jonesville High School conventional Jonesville rural: Distant 102.5 63.8 c
134 Kalamazoo Central High School conventional kalamazoo Suburb: Midsize 105.0 77.5 B
98 Kalkaska High School conventional kalkaska town: remote 106.4 83.6 B
220 Kearsley High School conventional kearsley Suburb: Large 102.3 62.9 c
18 Kelloggsville High School conventional kelloggsville city: Small 114.8 97.1 A
298 Kenowa Hills High School conventional kenowa Hills Suburb: Large 100.3 49.7 c
570 Kensington Woods High School charter Howell Suburb: Midsize 81.7 3.4 F
550 Kent City High School conventional kent city rural: Fringe 89.2 7.1 F
578 Kettering High School conventional Detroit city: Large 77.3 2.0 F
507 King High School conventional Detroit city: Large 93.8 14.4 D
271 Kingsford High School conventional Breitung township town: remote 101.1 54.3 c
156 Kingsley Area High School conventional kingsley rural: Distant 104.0 73.8 B
492 Kingston High School conventional kingston rural: remote 94.5 16.9 D
The Michigan Public High School CAP Report Card: Alphabetical
Rank High School School Type District or Municipality LocaleOverall CAP Values
Score percent rank Grade
458 Laingsburg High School conventional Laingsburg rural: Distant 95.6 22.7 D
52 Lake City High School conventional Lake city rural: Distant 109.4 91.4 A
448 Lake Fenton High School conventional Lake Fenton rural: Fringe 95.9 24.4 D
* Lake Linden-Hubbell High School conventional Lake Linden-Hubbell rural: Distant * * *
262 Lake Orion Community High School conventional Lake orion rural: Fringe 101.4 55.8 c
462 Lake Shore High School conventional Lake Shore (Macomb) Suburb: Large 95.5 22.0 D
417 Lakeland High School conventional Huron Valley Suburb: Large 97.1 29.6 D
203 Laker High School conventionalelkton-pigeon- Bay port Laker
rural: remote 102.9 65.8 c
210 Lakeshore High School conventional Lakeshore (Berrien) rural: Fringe 102.6 64.6 c
538 Lakeview High School conventional Lakeview (Macomb) Suburb: Large 91.7 9.1 F
447 Lakeview High School conventional Lakeview (calhoun) city: Small 96.0 24.5 D
344 Lakeview High School conventional Lakeview (Montcalm) rural: Distant 99.2 42.0 c
473 LakeVille High School conventional LakeVille rural: Distant 95.2 20.1 D
362 Lakewood High School conventional Lakewood rural: Fringe 98.8 38.9 c
525 Lamphere High School conventional Lamphere Suburb: Large 92.7 11.3 D
292 Landmark Academy† charter kimball rural: Fringe 100.5 50.8 c
463 L'Anse Creuse High School conventional L'Anse creuse Suburb: Large 95.5 21.8 D
510 L'Anse Creuse High School-North conventional L'Anse creuse Suburb: Large 93.7 13.9 D
485 L'Anse High School conventional L'Anse rural: remote 94.9 18.1 D
296 Lapeer East Sr High School conventional Lapeer town: Distant 100.4 50.1 c
418 Lapeer West Sr High School conventional Lapeer town: Distant 97.0 29.4 D
386 LaSalle High School conventional St. ignace town: remote 98.0 34.9 c
226 Lawrence Jr/Sr High School conventional Lawrence rural: Distant 102.3 61.9 c
26 Lawton High School conventional Lawton rural: Fringe 113.0 95.8 A
13 Lee High School conventional Godfrey-Lee city: Small 116.7 98.0 A
411 Lee M. Thurston High School conventional South redford Suburb: Large 97.2 30.6 c
* Leland Public School conventional Leland rural: remote * * *
391 Leslie High School conventional Leslie rural: Distant 97.9 34.0 c
* Lighthouse Academy charter Grand rapids Suburb: Large * * *
481 Lincoln High School conventional Van Dyke city: Midsize 95.0 18.8 D
255 Lincoln Park High School conventional Lincoln park Suburb: Large 101.4 57.0 c
557 Lincoln Sr High School conventional Lincoln rural: Fringe 86.7 5.8 F
274 Linden High School conventional Linden rural: Fringe 101.0 53.8 c
* Litchfield High School conventional Litchfield rural: Distant * * *
252 Lowell Sr High School conventional Lowell rural: Fringe 101.5 57.5 c
60 Loy Norrix High School conventional kalamazoo city: Small 108.9 90.0 A
199 Ludington High School conventional Ludington town: remote 103.0 66.5 c
192 Luther L. Wright High School conventional ironwood town: remote 103.1 67.7 c
* Mackinac Island School conventional Mackinac island rural: Fringe * * *
* Mackinaw City K-12 School conventional Mackinaw city rural: Distant * * *
365 Madison High School conventional Madison (oakland) Suburb: Large 98.8 38.4 c
89 Madison High School conventional Madison (Lenawee) rural: Fringe 106.9 85.1 B
301 Manchester High School conventional Manchester rural: Distant 100.2 49.2 c
216 Manistee High School conventional Manistee town: remote 102.5 63.6 c
115 Manistique Middle and High School conventional Manistique town: remote 105.9 80.7 B
Mackinac Center for Public Policy
The Michigan Public High School Context and Performance Report Card 27

* Indicates not enough data were publicly available to include the school in the model.† Denotes schools that have less than four years of data publicly available, but still have enough publicly available data to be included in the model. ‡ As noted in Appendix E, several schools were erroneously listed in government tables as general education high schools and thus were originally included in the model. The subsequent removal of these schools from our graphics means that the percent rank of the school with the lowest CAP Score is not zero.
The Michigan Public High School CAP Report Card: Alphabetical
Rank High School School Type District or Municipality LocaleOverall CAP Values
Score percent rank Grade
92 Manton Consolidated High School conventional Manton rural: Distant 106.6 84.6 B
246 Maple City-Glen Lake Jr/Sr High School conventional Glen Lake rural: remote 101.6 58.5 c
374 Maple Valley Jr/Sr High School conventional Maple Valley rural: Distant 98.5 36.9 c
116 Marcellus High School conventional Marcellus rural: Distant 105.8 80.5 B
407 Marine City High School conventional east china Suburb: Small 97.4 31.3 c
503 Marion High School conventional Marion rural: remote 93.9 15.1 D
201 Marlette Jr/Sr High School conventional Marlette rural: remote 102.9 66.2 c
239 Marquette Sr High School conventional Marquette town: remote 101.9 59.7 c
* Marshall Academy charter Marshall rural: Fringe * * *
387 Marshall High School conventional Marshall town: Fringe 98.0 34.7 c
329 Martin High School conventional Martin rural: Distant 99.5 44.5 c
297 Marysville High School conventional Marysville Suburb: Small 100.4 49.9 c
265 Mason County Central High School conventional Mason county central rural: Distant 101.3 55.3 c
74 Mason County Eastern Jr High/High School conventional Mason county eastern rural: Distant 108.1 87.6 B
383 Mason High School conventional Mason (ingham) rural: Fringe 98.2 35.4 c
455 Mason Sr High School conventional Mason (Monroe) rural: Fringe 95.7 23.2 D
224 Mattawan High School conventional Mattawan town: Fringe 102.3 62.3 c
234 Mayville High School conventional Mayville rural: Distant 102.1 60.6 c
345 McBain High School conventional McBain rural Agricultural rural: Distant 99.2 41.8 c
102 Melvindale High School conventionalMelvindale- north Allen park
Suburb: Large 106.3 82.9 B
443 Memphis High School conventional Memphis rural: Distant 96.1 25.2 D
183 Mendon Middle/High School conventional Mendon rural: Distant 103.2 69.2 c
414 Menominee High School conventional Menominee town: remote 97.2 30.1 c
221 Meridian High School conventional Meridian rural: Fringe 102.3 62.8 c
498 Merrill High School conventional Merrill rural: Distant 94.1 15.9 D
* Merritt Academy charter new Haven rural: Fringe * * *
283 Mesick Consolidated Jr/Sr High School conventional Mesick rural: remote 100.8 52.3 c
494 Michigan Center Jr/Sr High School conventional Michigan center Suburb: Small 94.4 16.6 D
359 Michigan Health Academy charter Detroit city: Large 98.9 39.4 c
* Mid Peninsula School conventional Mid peninsula rural: Distant * * *
* Midland Academy of Advanced and Creative Studies charter Midland rural: Fringe * * *
65 Midland High School conventional Midland town: Distant 108.6 89.2 B
529 Milan High School conventional Milan rural: Fringe 92.6 10.7 D
259 Milford High School conventional Huron Valley rural: Fringe 101.4 56.3 c
14 Mio AuSable High School conventional Mio AuSable rural: remote 116.3 97.8 A
124 Mona Shores High School conventional Mona Shores city: Small 105.4 79.2 B
500 Monroe High School conventional Monroe Suburb: Small 94.0 15.6 D
80 Montabella Jr/Sr High conventional Montabella rural: remote 107.5 86.6 B
148 Montague High School conventional Montague rural: Fringe 104.2 75.1 B
217 Morenci Area High School conventional Morenci rural: Distant 102.4 63.5 c
228 Morley Stanwood High School conventional Morley Stanwood rural: Distant 102.2 61.6 c
552 Morrice Area High School conventional Morrice rural: Fringe 89.0 6.8 F
47 Mott Middle College High School† Selective Flint city: Midsize 109.8 92.2 A
Mackinac Center for Public Policy
The Michigan Public High School Context and Performance Report Card 28

* Indicates not enough data were publicly available to include the school in the model.† Denotes schools that have less than four years of data publicly available, but still have enough publicly available data to be included in the model. ‡ As noted in Appendix E, several schools were erroneously listed in government tables as general education high schools and thus were originally included in the model. The subsequent removal of these schools from our graphics means that the percent rank of the school with the lowest CAP Score is not zero.
The Michigan Public High School CAP Report Card: Alphabetical
Rank High School School Type District or Municipality LocaleOverall CAP Values
Score percent rank Grade
92 Manton Consolidated High School conventional Manton rural: Distant 106.6 84.6 B
246 Maple City-Glen Lake Jr/Sr High School conventional Glen Lake rural: remote 101.6 58.5 c
374 Maple Valley Jr/Sr High School conventional Maple Valley rural: Distant 98.5 36.9 c
116 Marcellus High School conventional Marcellus rural: Distant 105.8 80.5 B
407 Marine City High School conventional east china Suburb: Small 97.4 31.3 c
503 Marion High School conventional Marion rural: remote 93.9 15.1 D
201 Marlette Jr/Sr High School conventional Marlette rural: remote 102.9 66.2 c
239 Marquette Sr High School conventional Marquette town: remote 101.9 59.7 c
* Marshall Academy charter Marshall rural: Fringe * * *
387 Marshall High School conventional Marshall town: Fringe 98.0 34.7 c
329 Martin High School conventional Martin rural: Distant 99.5 44.5 c
297 Marysville High School conventional Marysville Suburb: Small 100.4 49.9 c
265 Mason County Central High School conventional Mason county central rural: Distant 101.3 55.3 c
74 Mason County Eastern Jr High/High School conventional Mason county eastern rural: Distant 108.1 87.6 B
383 Mason High School conventional Mason (ingham) rural: Fringe 98.2 35.4 c
455 Mason Sr High School conventional Mason (Monroe) rural: Fringe 95.7 23.2 D
224 Mattawan High School conventional Mattawan town: Fringe 102.3 62.3 c
234 Mayville High School conventional Mayville rural: Distant 102.1 60.6 c
345 McBain High School conventional McBain rural Agricultural rural: Distant 99.2 41.8 c
102 Melvindale High School conventionalMelvindale- north Allen park
Suburb: Large 106.3 82.9 B
443 Memphis High School conventional Memphis rural: Distant 96.1 25.2 D
183 Mendon Middle/High School conventional Mendon rural: Distant 103.2 69.2 c
414 Menominee High School conventional Menominee town: remote 97.2 30.1 c
221 Meridian High School conventional Meridian rural: Fringe 102.3 62.8 c
498 Merrill High School conventional Merrill rural: Distant 94.1 15.9 D
* Merritt Academy charter new Haven rural: Fringe * * *
283 Mesick Consolidated Jr/Sr High School conventional Mesick rural: remote 100.8 52.3 c
494 Michigan Center Jr/Sr High School conventional Michigan center Suburb: Small 94.4 16.6 D
359 Michigan Health Academy charter Detroit city: Large 98.9 39.4 c
* Mid Peninsula School conventional Mid peninsula rural: Distant * * *
* Midland Academy of Advanced and Creative Studies charter Midland rural: Fringe * * *
65 Midland High School conventional Midland town: Distant 108.6 89.2 B
529 Milan High School conventional Milan rural: Fringe 92.6 10.7 D
259 Milford High School conventional Huron Valley rural: Fringe 101.4 56.3 c
14 Mio AuSable High School conventional Mio AuSable rural: remote 116.3 97.8 A
124 Mona Shores High School conventional Mona Shores city: Small 105.4 79.2 B
500 Monroe High School conventional Monroe Suburb: Small 94.0 15.6 D
80 Montabella Jr/Sr High conventional Montabella rural: remote 107.5 86.6 B
148 Montague High School conventional Montague rural: Fringe 104.2 75.1 B
217 Morenci Area High School conventional Morenci rural: Distant 102.4 63.5 c
228 Morley Stanwood High School conventional Morley Stanwood rural: Distant 102.2 61.6 c
552 Morrice Area High School conventional Morrice rural: Fringe 89.0 6.8 F
47 Mott Middle College High School† Selective Flint city: Midsize 109.8 92.2 A
The Michigan Public High School CAP Report Card: Alphabetical
Rank High School School Type District or Municipality LocaleOverall CAP Values
Score percent rank Grade
293 Mount Clemens High School conventional Mt. clemens Suburb: Large 100.5 50.6 c
250 Mt. Pleasant Sr High School conventional Mt. pleasant town: Distant 101.5 57.9 c
575 Mumford High School conventional Detroit city: Large 78.7 2.5 F
332 Munising High and Middle School conventional Munising rural: remote 99.4 44.0 c
561 Muskegon Heights High School conventional Muskegon Heights Suburb: Midsize 85.1 5.1 F
25 Muskegon High School conventional Muskegon city: Small 113.5 95.9 A
406 Napoleon High School conventional napoleon rural: Fringe 97.5 31.5 c
318 Negaunee High School conventional negaunee town: remote 99.8 46.4 c
191 New Buffalo Sr High School conventional new Buffalo rural: Fringe 103.1 67.9 c
536 New Haven High School conventional new Haven Suburb: Large 91.8 9.5 F
305 New Lothrop High School conventional new Lothrop rural: Distant 100.1 48.6 c
121 Newaygo High School conventional newaygo town: Distant 105.6 79.7 B
270 Newberry High School conventional tahquamenon town: remote 101.1 54.5 c
147 Niles Sr High School conventional niles city: Small 104.3 75.3 B
515 North Adams High School† conventional north Adams-Jerome rural: Distant 93.6 13.0 D
360 North Branch High School conventional north Branch rural: Distant 98.9 39.3 c
* North Central Area Jr/Sr High School conventional north central rural: remote * * *
* North Dickinson School conventional north Dickinson county rural: remote * * *
258 North Farmington High School conventional Farmington city: Small 101.4 56.5 c
7 North Huron School† conventional north Huron rural: Distant 123.3 99.0 A
53 North Muskegon High School conventional north Muskegon Suburb: Midsize 109.2 91.2 A
* North Star Academy charter Marquette rural: Fringe * * *
569 Northern High School conventional Flint city: Midsize 81.9 3.6 F
97 Northern High School conventional Forest Hills Suburb: Large 106.4 83.8 B
* Northport Public School conventional northport rural: remote * * *
180 Northview High School conventional northview Suburb: Large 103.3 69.7 c
95 Northville High School conventional northville Suburb: Large 106.5 84.1 B
* Northwest Academy charter charlevoix town: remote * * *
505 Northwest High School conventional northwest rural: Fringe 93.8 14.7 D
577 Northwestern High School conventional Flint city: Midsize 77.7 2.2 F
562 Northwestern High School conventional Detroit city: Large 84.4 4.9 F
285 Norway High School conventional norway-Vulcan town: remote 100.7 51.9 c
175 Novi High School conventional novi city: Small 103.3 70.6 B
* Oakland Early College Selective West Bloomfield city: Small * * *
* Oakland International Academy Middle/High School charter Detroit city: Large * * *
388 Oakridge High School conventional oakridge Suburb: Midsize 97.9 34.5 c
179 Ogemaw Heights High School conventional West Branch-rose city rural: remote 103.3 69.9 c
* Ojibwe Charter School charter Brimley rural: Distant * * *
24 Okemos High School conventional okemos rural: Fringe 113.6 96.1 A
511 Old Redford Academy High charter Detroit city: Large 93.7 13.7 D
377 Olivet High School conventional olivet rural: Distant 98.5 36.4 c
280 Onaway Sr High School conventional onaway rural: remote 100.9 52.8 c
189 Onekama Middle/High School† conventional onekama rural: Distant 103.1 68.2 c
508 Onsted Community High School conventional onsted rural: Distant 93.8 14.2 D
423 Ontonagon Area Jr/Sr High School conventional ontonagon rural: remote 96.9 28.6 D
Mackinac Center for Public Policy
The Michigan Public High School Context and Performance Report Card 29

* Indicates not enough data were publicly available to include the school in the model.† Denotes schools that have less than four years of data publicly available, but still have enough publicly available data to be included in the model. ‡ As noted in Appendix E, several schools were erroneously listed in government tables as general education high schools and thus were originally included in the model. The subsequent removal of these schools from our graphics means that the percent rank of the school with the lowest CAP Score is not zero.
The Michigan Public High School CAP Report Card: Alphabetical
Rank High School School Type District or Municipality LocaleOverall CAP Values
Score percent rank Grade
370 Orchard View High School conventional orchard View rural: Fringe 98.7 37.6 c
574 Osborn Upper School of Global Communications and Culture conventional Detroit city: Large 79.5 2.7 F
487 Oscar A. Carlson High School conventional Gibraltar Suburb: Large 94.7 17.8 D
105 Oscoda Area High School conventional oscoda rural: Fringe 106.1 82.4 B
264 Otsego High School conventional otsego rural: Fringe 101.3 55.5 c
64 Ottawa Hills High School conventional Grand rapids city: Midsize 108.6 89.3 B
* Outlook Academy charter Allegan rural: Fringe * * *
446 Ovid-Elsie High School conventional ovid-elsie rural: Distant 96.0 24.7 D
* Owendale-Gagetown Jr/Sr High School conventional owendale-Gagetown rural: Distant * * *
78 Owosso High School conventional owosso rural: Fringe 107.6 87.0 B
442 Oxford High School conventional oxford rural: Fringe 96.2 25.4 D
* Pansophia Academy charter coldwater town: Distant * * *
266 Parchment High School conventional parchment Suburb: Midsize 101.3 55.2 c
138 Paw Paw High School conventional paw paw rural: Fringe 104.5 76.8 B
392 Peck Jr/Sr High School conventional peck rural: Distant 97.9 33.8 c
245 Pellston Middle/High School conventional pellston rural: remote 101.7 58.7 c
166 Pennfield Sr High School conventional Pennfield rural: Fringe 103.6 72.1 B
* Pentwater Public School conventional pentwater rural: remote * * *
336 Perry High School conventional perry town: Fringe 99.4 43.3 c
580 Pershing High School conventional Detroit city: Large 77.0 1.7 F
173 Petoskey High School conventional petoskey town: remote 103.4 70.9 B
299 Pewamo-Westphalia Jr/Sr High School conventional pewamo-Westphalia rural: Distant 100.3 49.6 c
493 Pickford High School† conventional pickford rural: Distant 94.4 16.8 D
467 Pinckney Community High School conventional pinckney Suburb: Midsize 95.4 21.2 D
306 Pinconning High School conventional pinconning rural: Distant 100.1 48.4 c
194 Pine River High School conventional pine river rural: remote 103.0 67.3 c
43 Pioneer High School conventional Ann Arbor city: Midsize 110.3 92.9 A
482 Pittsford Area High School conventional pittsford rural: Distant 95.0 18.6 D
349 Plainwell High School conventional plainwell rural: Fringe 99.1 41.1 c
563 Plymouth Educational Center Preparatory High School† charter Detroit city: Large 83.4 4.7 F
153 Plymouth High School conventional plymouth-canton Suburb: Large 104.0 74.3 B
69 Pontiac Academy for Excellence High School charter pontiac city: Small 108.3 88.5 B
572 Pontiac High School conventional pontiac city: Small 81.3 3.0 F
* Port Hope Community School conventional port Hope rural: remote * * *
395 Port Huron High School conventional port Huron Suburb: Small 97.8 33.3 c
304 Port Huron Northern High School conventional port Huron Suburb: Small 100.2 48.7 c
168 Portage Central High School conventional portage city: Small 103.5 71.7 B
126 Portage Northern High School conventional portage city: Small 105.4 78.8 B
409 Portland High School conventional portland town: Distant 97.3 31.0 c
* Posen Consolidated High School conventional posen rural: remote * * *
544 Potterville High School conventional potterville rural: Fringe 90.5 8.1 F
430 Quincy High School conventional Quincy rural: Distant 96.7 27.4 D
385 Ravenna High School conventional ravenna rural: Distant 98.1 35.0 c
Mackinac Center for Public Policy
The Michigan Public High School Context and Performance Report Card 30

* Indicates not enough data were publicly available to include the school in the model.† Denotes schools that have less than four years of data publicly available, but still have enough publicly available data to be included in the model. ‡ As noted in Appendix E, several schools were erroneously listed in government tables as general education high schools and thus were originally included in the model. The subsequent removal of these schools from our graphics means that the percent rank of the school with the lowest CAP Score is not zero.
The Michigan Public High School CAP Report Card: Alphabetical
Rank High School School Type District or Municipality LocaleOverall CAP Values
Score percent rank Grade
370 Orchard View High School conventional orchard View rural: Fringe 98.7 37.6 c
574 Osborn Upper School of Global Communications and Culture conventional Detroit city: Large 79.5 2.7 F
487 Oscar A. Carlson High School conventional Gibraltar Suburb: Large 94.7 17.8 D
105 Oscoda Area High School conventional oscoda rural: Fringe 106.1 82.4 B
264 Otsego High School conventional otsego rural: Fringe 101.3 55.5 c
64 Ottawa Hills High School conventional Grand rapids city: Midsize 108.6 89.3 B
* Outlook Academy charter Allegan rural: Fringe * * *
446 Ovid-Elsie High School conventional ovid-elsie rural: Distant 96.0 24.7 D
* Owendale-Gagetown Jr/Sr High School conventional owendale-Gagetown rural: Distant * * *
78 Owosso High School conventional owosso rural: Fringe 107.6 87.0 B
442 Oxford High School conventional oxford rural: Fringe 96.2 25.4 D
* Pansophia Academy charter coldwater town: Distant * * *
266 Parchment High School conventional parchment Suburb: Midsize 101.3 55.2 c
138 Paw Paw High School conventional paw paw rural: Fringe 104.5 76.8 B
392 Peck Jr/Sr High School conventional peck rural: Distant 97.9 33.8 c
245 Pellston Middle/High School conventional pellston rural: remote 101.7 58.7 c
166 Pennfield Sr High School conventional Pennfield rural: Fringe 103.6 72.1 B
* Pentwater Public School conventional pentwater rural: remote * * *
336 Perry High School conventional perry town: Fringe 99.4 43.3 c
580 Pershing High School conventional Detroit city: Large 77.0 1.7 F
173 Petoskey High School conventional petoskey town: remote 103.4 70.9 B
299 Pewamo-Westphalia Jr/Sr High School conventional pewamo-Westphalia rural: Distant 100.3 49.6 c
493 Pickford High School† conventional pickford rural: Distant 94.4 16.8 D
467 Pinckney Community High School conventional pinckney Suburb: Midsize 95.4 21.2 D
306 Pinconning High School conventional pinconning rural: Distant 100.1 48.4 c
194 Pine River High School conventional pine river rural: remote 103.0 67.3 c
43 Pioneer High School conventional Ann Arbor city: Midsize 110.3 92.9 A
482 Pittsford Area High School conventional pittsford rural: Distant 95.0 18.6 D
349 Plainwell High School conventional plainwell rural: Fringe 99.1 41.1 c
563 Plymouth Educational Center Preparatory High School† charter Detroit city: Large 83.4 4.7 F
153 Plymouth High School conventional plymouth-canton Suburb: Large 104.0 74.3 B
69 Pontiac Academy for Excellence High School charter pontiac city: Small 108.3 88.5 B
572 Pontiac High School conventional pontiac city: Small 81.3 3.0 F
* Port Hope Community School conventional port Hope rural: remote * * *
395 Port Huron High School conventional port Huron Suburb: Small 97.8 33.3 c
304 Port Huron Northern High School conventional port Huron Suburb: Small 100.2 48.7 c
168 Portage Central High School conventional portage city: Small 103.5 71.7 B
126 Portage Northern High School conventional portage city: Small 105.4 78.8 B
409 Portland High School conventional portland town: Distant 97.3 31.0 c
* Posen Consolidated High School conventional posen rural: remote * * *
544 Potterville High School conventional potterville rural: Fringe 90.5 8.1 F
430 Quincy High School conventional Quincy rural: Distant 96.7 27.4 D
385 Ravenna High School conventional ravenna rural: Distant 98.1 35.0 c
The Michigan Public High School CAP Report Card: Alphabetical
Rank High School School Type District or Municipality LocaleOverall CAP Values
Score percent rank Grade
426 Reading High School conventional reading rural: Distant 96.8 28.1 D
439 Redford Union High School conventional redford Union Suburb: Large 96.3 25.9 D
212 Reed City High School conventional reed city town: remote 102.5 64.3 c
372 Reese High School conventional reese rural: Distant 98.6 37.2 c
354 Reeths-Puffer High School conventional reeths-puffer Suburb: Midsize 98.9 40.3 c
16 Renaissance High School Selective Detroit city: Large 115.7 97.5 A
* Republic-Michigamme School conventional republic-Michigamme rural: remote * * *
534 Richmond Community High School conventional richmond town: Fringe 91.8 9.8 F
530 River Rouge High School conventional river rouge Suburb: Large 92.2 10.5 D
358 River Valley High School conventional river Valley rural: Distant 98.9 39.6 c
11 Riverside Academy-West Campus† charter Dearborn city: Small 118.0 98.3 A
381 Riverview Community High School conventional riverview Suburb: Large 98.3 35.7 c
254 Robichaud Sr High School conventional Westwood Suburb: Large 101.5 57.2 c
100 Rochester Adams High School conventional rochester Suburb: Large 106.3 83.2 B
207 Rochester High School conventional rochester Suburb: Large 102.8 65.1 c
200 Rockford High School conventional rockford Suburb: Large 102.9 66.3 c
188 Rogers City High School conventional rogers town: remote 103.1 68.4 c
111 Rogers High School conventional Wyoming city: Small 106.0 81.4 B
435 Romeo High School conventional romeo Suburb: Large 96.5 26.6 D
339 Romulus Sr High School conventional romulus Suburb: Large 99.2 42.8 c
412 Roosevelt High School conventional Wyandotte city Suburb: Large 97.2 30.5 c
50 Roscommon High School conventional roscommon rural: Distant 109.5 91.7 A
303 Roseville High School conventional roseville Suburb: Large 100.2 48.9 c
343 Ross Beatty High School conventional cassopolis rural: Distant 99.2 42.1 c
* Ross/Hill Academy High charter Detroit city: Large * * *
230 Royal Oak High School conventional royal oak Suburb: Large 102.2 61.3 c
61 Rudyard High School conventional rudyard rural: Distant 108.8 89.8 B
10 Saginaw Arts and Sciences Academy Selective Saginaw city: Small 119.7 98.5 A
555 Saginaw High School conventional Saginaw city: Small 87.1 6.3 F
218 Salem High School conventional plymouth-canton Suburb: Large 102.4 63.3 c
101 Saline High School conventional Saline rural: Fringe 106.3 83.1 B
509 Sand Creek High School conventional Sand creek rural: Distant 93.7 14.0 D
127 Sandusky High School conventional Sandusky town: Distant 105.3 78.7 B
251 Saranac High School conventional Saranac rural: Distant 101.5 57.7 c
122 Saugatuck High School conventional Saugatuck rural: Distant 105.6 79.5 B
249 Sault Area High School conventional Sault Ste. Marie town: remote 101.5 58.0 c
419 Schoolcraft High School conventional Schoolcraft Suburb: Midsize 97.0 29.3 D
40 Shelby High School conventional Shelby rural: Distant 110.6 93.4 A
350 Shepherd High School conventional Shepherd rural: Distant 99.1 40.9 c
68 Skyline High School† conventional Ann Arbor Suburb: Large 108.5 88.7 B
46 South Haven High School conventional South Haven town: Distant 109.8 92.4 A
516 South Lake High School conventional South Lake Suburb: Large 93.5 12.9 D
287 South Lyon East High School† conventional South Lyon rural: Fringe 100.6 51.6 c
211 South Lyon High School conventional South Lyon Suburb: Midsize 102.6 64.5 c
565 Southeastern High School conventional Detroit city: Large 82.7 4.4 F
549 Southfield High School conventional Southfield city: Small 89.5 7.3 F
Mackinac Center for Public Policy
The Michigan Public High School Context and Performance Report Card 31

* Indicates not enough data were publicly available to include the school in the model.† Denotes schools that have less than four years of data publicly available, but still have enough publicly available data to be included in the model. ‡ As noted in Appendix E, several schools were erroneously listed in government tables as general education high schools and thus were originally included in the model. The subsequent removal of these schools from our graphics means that the percent rank of the school with the lowest CAP Score is not zero.
The Michigan Public High School CAP Report Card: Alphabetical
Rank High School School Type District or Municipality LocaleOverall CAP Values
Score percent rank Grade
541 Southfield-Lathrup High School conventional Southfield Suburb: Large 91.1 8.6 F
452 Southgate Anderson High School conventional Southgate Suburb: Large 95.8 23.7 D
408 Southwestern Academy conventional Flint city: Midsize 97.4 31.1 c
566 Southwestern High School conventional Detroit city: Large 82.5 4.1 F
281 Sparta Sr High School conventional Sparta Suburb: Large 100.8 52.6 c
36 Spring Lake High School conventional Spring Lake rural: Fringe 111.2 94.1 A
229 Springport High School conventional Springport rural: Distant 102.2 61.4 c
450 St. Charles Community High School conventional St. charles rural: Distant 95.8 24.0 D
315 St. Clair High School conventional east china Suburb: Small 99.8 46.9 c
469 St. Johns High School conventional St. Johns rural: Fringe 95.3 20.8 D
176 St. Joseph High School conventional St. Joseph Suburb: Small 103.3 70.4 B
363 St. Louis High School conventional St. Louis town: Distant 98.8 38.7 c
277 Standish-Sterling Central High School conventional Standish-Sterling rural: Distant 100.9 53.3 c
1 Star International Academy charter Dearborn Heights Suburb: Large 140.8 100.0 A
438 Stephenson High School conventional Stephenson rural: remote 96.4 26.1 D
232 Sterling Heights Sr High School conventional Warren Suburb: Large 102.1 60.9 c
341 Stevenson High School conventional Livonia city: Small 99.2 42.5 c
394 Stockbridge High School conventional Stockbridge rural: Distant 97.8 33.5 c
158 Stoney Creek High School conventional rochester Suburb: Large 103.9 73.4 B
109 Sturgis High School conventional Sturgis town: Distant 106.0 81.7 B
556 Summerfield High School conventional Summerfield rural: Distant 86.8 6.1 F
543 Summit Academy North High School charter romulus Suburb: Large 90.8 8.3 F
* Superior Central School conventional Superior central rural: remote * * *
309 Suttons Bay Sr High School conventional Suttons Bay rural: Distant 100.0 47.9 c
404 Swan Valley High School conventional Swan Valley Suburb: Midsize 97.5 31.8 c
499 Swartz Creek High School conventional Swartz creek Suburb: Large 94.0 15.7 D
142 Tawas Area High School conventional tawas rural: Fringe 104.3 76.1 B
459 Tecumseh High School conventional tecumseh town: Distant 95.6 22.5 D
* Tekonsha Sr High School conventional tekonsha rural: Distant * * *
348 Thornapple Kellogg High School conventional thornapple kellogg rural: Fringe 99.1 41.3 c
* Traverse City College Preparatory Academy charter traverse city rural: Fringe * * *
479 Trenton High School conventional trenton Suburb: Large 95.0 19.1 D
422 Tri County Sr High School conventional tri county rural: Distant 96.9 28.8 D
501 Tri-Township School† conventional rapid river rural: Distant 94.0 15.4 D
45 Troy High School conventional troy city: Small 110.1 92.6 A
533 Truman High School conventional taylor city: Small 91.8 10.0 D
157 Ubly Community High School conventional Ubly rural: Distant 103.9 73.6 B
474 Union City High School conventional Union city rural: Distant 95.1 20.0 D
91 Union High School conventional Dowagiac Union town: Distant 106.7 84.8 B
376 Unionville-Sebewaing High School conventional Unionville-Sebewaing rural: Distant 98.5 36.5 c
3 Universal Academy† charter Detroit city: Large 133.8 99.7 A
320 University High School conventional Ferndale Suburb: Large 99.6 46.0 c
108 University High School Academy† Selective Southfield city: Small 106.1 81.9 B
113 University Preparatory Academy High School† charter Detroit city: Large 105.9 81.0 B
Mackinac Center for Public Policy
The Michigan Public High School Context and Performance Report Card 32

* Indicates not enough data were publicly available to include the school in the model.† Denotes schools that have less than four years of data publicly available, but still have enough publicly available data to be included in the model. ‡ As noted in Appendix E, several schools were erroneously listed in government tables as general education high schools and thus were originally included in the model. The subsequent removal of these schools from our graphics means that the percent rank of the school with the lowest CAP Score is not zero.
The Michigan Public High School CAP Report Card: Alphabetical
Rank High School School Type District or Municipality LocaleOverall CAP Values
Score percent rank Grade
541 Southfield-Lathrup High School conventional Southfield Suburb: Large 91.1 8.6 F
452 Southgate Anderson High School conventional Southgate Suburb: Large 95.8 23.7 D
408 Southwestern Academy conventional Flint city: Midsize 97.4 31.1 c
566 Southwestern High School conventional Detroit city: Large 82.5 4.1 F
281 Sparta Sr High School conventional Sparta Suburb: Large 100.8 52.6 c
36 Spring Lake High School conventional Spring Lake rural: Fringe 111.2 94.1 A
229 Springport High School conventional Springport rural: Distant 102.2 61.4 c
450 St. Charles Community High School conventional St. charles rural: Distant 95.8 24.0 D
315 St. Clair High School conventional east china Suburb: Small 99.8 46.9 c
469 St. Johns High School conventional St. Johns rural: Fringe 95.3 20.8 D
176 St. Joseph High School conventional St. Joseph Suburb: Small 103.3 70.4 B
363 St. Louis High School conventional St. Louis town: Distant 98.8 38.7 c
277 Standish-Sterling Central High School conventional Standish-Sterling rural: Distant 100.9 53.3 c
1 Star International Academy charter Dearborn Heights Suburb: Large 140.8 100.0 A
438 Stephenson High School conventional Stephenson rural: remote 96.4 26.1 D
232 Sterling Heights Sr High School conventional Warren Suburb: Large 102.1 60.9 c
341 Stevenson High School conventional Livonia city: Small 99.2 42.5 c
394 Stockbridge High School conventional Stockbridge rural: Distant 97.8 33.5 c
158 Stoney Creek High School conventional rochester Suburb: Large 103.9 73.4 B
109 Sturgis High School conventional Sturgis town: Distant 106.0 81.7 B
556 Summerfield High School conventional Summerfield rural: Distant 86.8 6.1 F
543 Summit Academy North High School charter romulus Suburb: Large 90.8 8.3 F
* Superior Central School conventional Superior central rural: remote * * *
309 Suttons Bay Sr High School conventional Suttons Bay rural: Distant 100.0 47.9 c
404 Swan Valley High School conventional Swan Valley Suburb: Midsize 97.5 31.8 c
499 Swartz Creek High School conventional Swartz creek Suburb: Large 94.0 15.7 D
142 Tawas Area High School conventional tawas rural: Fringe 104.3 76.1 B
459 Tecumseh High School conventional tecumseh town: Distant 95.6 22.5 D
* Tekonsha Sr High School conventional tekonsha rural: Distant * * *
348 Thornapple Kellogg High School conventional thornapple kellogg rural: Fringe 99.1 41.3 c
* Traverse City College Preparatory Academy charter traverse city rural: Fringe * * *
479 Trenton High School conventional trenton Suburb: Large 95.0 19.1 D
422 Tri County Sr High School conventional tri county rural: Distant 96.9 28.8 D
501 Tri-Township School† conventional rapid river rural: Distant 94.0 15.4 D
45 Troy High School conventional troy city: Small 110.1 92.6 A
533 Truman High School conventional taylor city: Small 91.8 10.0 D
157 Ubly Community High School conventional Ubly rural: Distant 103.9 73.6 B
474 Union City High School conventional Union city rural: Distant 95.1 20.0 D
91 Union High School conventional Dowagiac Union town: Distant 106.7 84.8 B
376 Unionville-Sebewaing High School conventional Unionville-Sebewaing rural: Distant 98.5 36.5 c
3 Universal Academy† charter Detroit city: Large 133.8 99.7 A
320 University High School conventional Ferndale Suburb: Large 99.6 46.0 c
108 University High School Academy† Selective Southfield city: Small 106.1 81.9 B
113 University Preparatory Academy High School† charter Detroit city: Large 105.9 81.0 B
The Michigan Public High School CAP Report Card: Alphabetical
Rank High School School Type District or Municipality LocaleOverall CAP Values
Score percent rank Grade
490 Utica High School conventional Utica Suburb: Large 94.6 17.3 D
* Vanderbilt Area School conventional Vanderbilt rural: Distant * * *
401 Vandercook Lake High School conventional Vandercook Lake Suburb: Small 97.6 32.3 c
263 Vassar Sr High School conventional Vassar town: Distant 101.4 55.7 c
152 Vestaburg Community High School conventional Vestaburg rural: remote 104.1 74.5 B
289 Vicksburg High School conventional Vicksburg Suburb: Midsize 100.6 51.3 c
* Vista Meadows Academy charter Dearborn Heights Suburb: Large * * *
424 Voyageur Consortium High School charter Detroit city: Large 96.8 28.4 D
* Wakefield-Marenisco School conventional Wakefield‑Marenisco rural: Distant * * *
* Waldron High School conventional Waldron rural: remote * * *
* Walkerville High School conventional Walkerville rural: remote * * *
290 Walled Lake Central High School conventional Walled Lake Suburb: Large 100.6 51.1 c
327 Walled Lake Northern High School conventional Walled Lake Suburb: Large 99.5 44.8 c
351 Walled Lake Western High School conventional Walled Lake Suburb: Large 99.0 40.8 c
437 Warren Mott High School conventional Warren city: Midsize 96.4 26.2 D
413 Warren Woods Tower High School conventional Warren Woods city: Midsize 97.2 30.3 c
162 Washtenaw Technical Middle College charter Ann Arbor Suburb: Large 103.8 72.8 B
390 Waterford Kettering High School conventional Waterford Suburb: Large 97.9 34.2 c
420 Waterford Mott High School conventional Waterford Suburb: Large 96.9 29.1 D
* Watersmeet Township School conventional Watersmeet township rural: remote * * *
38 Watervliet Sr High School conventional Watervliet town: Fringe 110.7 93.7 A
523 Waverly Sr High School conventional Waverly Suburb: Large 92.8 11.7 D
478 Wayland High School conventional Wayland Union town: Distant 95.0 19.3 D
141 Wayne Memorial High School conventional Wayne-Westland Suburb: Large 104.4 76.3 B
* WayPoint Academy charter Muskegon Suburb: Midsize * * *
506 Webberville High School conventional Webberville town: Fringe 93.8 14.6 D
300 West Bloomfield High School conventional West Bloomfield Suburb: Large 100.3 49.4 c
77 West Iron County High School conventional West iron county town: remote 107.6 87.1 B
51 West Michigan Academy of Environmental Science† charter Grand rapids Suburb: Large 109.4 91.5 A
79 West Ottawa High School Campus conventional West ottawa Suburb: Small 107.5 86.8 B
87 West Sr High conventional traverse city rural: Fringe 107.0 85.4 B
225 Western High School conventional Western rural: Fringe 102.3 62.1 c
311 Western International High School conventional Detroit city: Large 100.0 47.5 c
366 Westwood High School conventional n.i.c.e. town: remote 98.8 38.2 c
35 White Cloud High School conventional White cloud rural: Distant 111.3 94.2 A
117 White Pigeon Jr/Sr High School conventional White pigeon rural: Fringe 105.8 80.4 B
* Whitefish Township School conventional Whitefish Township rural: remote * * *
553 Whiteford High School conventional Whiteford Agricultural rural: Fringe 88.5 6.6 F
331 Whitehall Sr High School conventional Whitehall rural: Fringe 99.5 44.2 c
342 Whitmore Lake High School conventional Whitmore Lake rural: Fringe 99.2 42.3 c
28 Whittemore-Prescott Area High School conventional Whittemore-prescott rural: remote 112.2 95.4 A
* Will Carleton Charter School Academy charter Hillsdale rural: Fringe * * *
185 Williamston High School conventional Williamston town: Fringe 103.1 68.9 c
454 Willow Run High School conventional Willow run Suburb: Large 95.7 23.4 D
Mackinac Center for Public Policy
The Michigan Public High School Context and Performance Report Card 33

* Indicates not enough data were publicly available to include the school in the model.† Denotes schools that have less than four years of data publicly available, but still have enough publicly available data to be included in the model. ‡ As noted in Appendix E, several schools were erroneously listed in government tables as general education high schools and thus were originally included in the model. The subsequent removal of these schools from our graphics means that the percent rank of the school with the lowest CAP Score is not zero.
The Michigan Public High School CAP Report Card: Alphabetical
Rank High School School Type District or Municipality LocaleOverall CAP Values
Score percent rank Grade
307 Winans Academy High School charter Detroit city: Large 100.1 48.2 c
* Wolverine Middle/High School conventional Wolverine rural: remote * * *
502 Woodhaven High School conventional Woodhaven-Brownstown Suburb: Large 93.9 15.2 D
174 Wylie E. Groves High School conventional Birmingham Suburb: Large 103.4 70.7 B
125 Wyoming Park High School conventional Wyoming city: Small 105.4 79.0 B
328 Yale Sr High School conventional Yale rural: Distant 99.5 44.7 c
432 Ypsilanti High School conventional Ypsilanti Suburb: Large 96.7 27.1 D
361 Zeeland East High School conventional Zeeland rural: Fringe 98.9 39.1 c
273 Zeeland West High School conventional Zeeland rural: Fringe 101.0 54.0 c
Mackinac Center for Public Policy
The Michigan Public High School Context and Performance Report Card 34

* Indicates not enough data were publicly available to include the school in the model.† Denotes schools that have less than four years of data publicly available, but still have enough publicly available data to be included in the model. ‡ As noted in Appendix E, several schools were erroneously listed in government tables as general education high schools and thus were originally included in the model. The subsequent removal of these schools from our graphics means that the percent rank of the school with the lowest CAP Score is not zero.
The Michigan Public High School CAP Report Card: Ranked By Score
Rank High School School Type District or Municipality LocaleOverall CAP Values
Score percent rank Grade
1 Star International Academy charter Dearborn Heights Suburb: Large 140.8 100.0 A
2 Cesar Chavez High School charter Detroit city: Large 135.4 99.8 A
3 Universal Academy† charter Detroit city: Large 133.8 99.7 A
4 City Middle/High School Selective Grand rapids city: Midsize 130.5 99.5 A
5 International Academy Selective Bloomfield Hills Suburb: Large 127.2 99.3 A
6 Excel Charter Academy-Grand River Prep School† charter kentwood Suburb: Large 123.3 99.2 A
7 North Huron School† conventional north Huron rural: Distant 123.3 99.0 A
8 International Academy of Flint† charter Flint city: Midsize 120.2 98.8 A
9 Genesee Early College† Selective Flint city: Midsize 120.0 98.6 A
10 Saginaw Arts and Sciences Academy Selective Saginaw city: Small 119.7 98.5 A
11 Riverside Academy-West Campus† charter Dearborn city: Small 118.0 98.3 A
12 Baldwin Sr High School† conventional Baldwin rural: remote 117.9 98.1 A
13 Lee High School conventional Godfrey-Lee city: Small 116.7 98.0 A
14 Mio AuSable High School conventional Mio AuSable rural: remote 116.3 97.8 A
15 Jeffers High School conventional Adams township rural: Distant 115.8 97.6 A
16 Renaissance High School Selective Detroit city: Large 115.7 97.5 A
17 Covert High School conventional covert rural: Distant 115.3 97.3 A
18 Kelloggsville High School conventional kelloggsville city: Small 114.8 97.1 A
19 Classical Academy† Selective Flint city: Midsize 114.2 97.0 A
20 Calumet High School conventional calumet town: remote 114.2 96.8 A
21 Holland High School conventional Holland city: Small 114.1 96.6 A
22 Benzie Central Sr High School conventional Benzie county central rural: remote 113.9 96.4 A
23 Fairview High School† conventional Fairview rural: remote 113.8 96.3 A
24 Okemos High School conventional okemos rural: Fringe 113.6 96.1 A
25 Muskegon High School conventional Muskegon city: Small 113.5 95.9 A
26 Lawton High School conventional Lawton rural: Fringe 113.0 95.8 A
27 Bloomingdale Middle and High School conventional Bloomingdale rural: Distant 113.0 95.6 A
28 Whittemore-Prescott Area High School conventional Whittemore-prescott rural: remote 112.2 95.4 A
29 Cass Technical High School Selective Detroit city: Large 111.7 95.3 A
30 H.H. Dow High School conventional Midland town: Distant 111.7 95.1 A
31 Huron High School conventional Ann Arbor city: Midsize 111.6 94.9 A
32 Davis Aerospace High School Selective Detroit city: Large 111.6 94.8 A
33 Gwinn High School conventional Gwinn rural: remote 111.5 94.6 A
34 Henry Ford Early College† Selective Dearborn Suburb: Large 111.3 94.4 A
35 White Cloud High School conventional White cloud rural: Distant 111.3 94.2 A
36 Spring Lake High School conventional Spring Lake rural: Fringe 111.2 94.1 A
37 Grayling High School conventional crawford AuSable rural: Fringe 110.8 93.9 A
38 Watervliet Sr High School conventional Watervliet town: Fringe 110.7 93.7 A
39 Brethren High School conventional kaleva norman Dickson rural: remote 110.6 93.6 A
40 Shelby High School conventional Shelby rural: Distant 110.6 93.4 A
41 Forest Area High School conventional Forest rural: remote 110.4 93.2 A
42 Houghton Central High School conventionalHoughton- portage township
rural: Fringe 110.3 93.1 A
The Michigan Public High School CAP Report Card: Ranked By Score
Mackinac Center for Public Policy
The Michigan Public High School Context and Performance Report Card 35

* Indicates not enough data were publicly available to include the school in the model.† Denotes schools that have less than four years of data publicly available, but still have enough publicly available data to be included in the model. ‡ As noted in Appendix E, several schools were erroneously listed in government tables as general education high schools and thus were originally included in the model. The subsequent removal of these schools from our graphics means that the percent rank of the school with the lowest CAP Score is not zero.
The Michigan Public High School CAP Report Card: Ranked By Score
Rank High School School Type District or Municipality LocaleOverall CAP Values
Score percent rank Grade
43 Pioneer High School conventional Ann Arbor city: Midsize 110.3 92.9 A
44 Creston High School conventional Grand rapids city: Midsize 110.1 92.7 A
45 Troy High School conventional troy city: Small 110.1 92.6 A
46 South Haven High School conventional South Haven town: Distant 109.8 92.4 A
47 Mott Middle College High School† Selective Flint city: Midsize 109.8 92.2 A
48 Harbor Beach Community High School conventional Harbor Beach rural: remote 109.7 92.0 A
49 Fordson High School conventional Dearborn city: Small 109.7 91.9 A
50 Roscommon High School conventional roscommon rural: Distant 109.5 91.7 A
51 West Michigan Academy of Environmental Science† charter Grand rapids Suburb: Large 109.4 91.5 A
52 Lake City High School conventional Lake city rural: Distant 109.4 91.4 A
53 North Muskegon High School conventional north Muskegon Suburb: Midsize 109.2 91.2 A
54 Cass City High School conventional cass city rural: Fringe 109.1 91.0 A
55 Ishpeming High School conventional ishpeming town: remote 109.1 90.9 A
56 Comstock High School conventional comstock Suburb: Midsize 109.0 90.7 A
57 Grand Haven High School conventional Grand Haven Suburb: Midsize 108.9 90.5 A
58 Hancock Central High School conventional Hancock rural: Fringe 108.9 90.4 A
59 Decatur High School conventional Decatur rural: Distant 108.9 90.2 A
60 Loy Norrix High School conventional kalamazoo city: Small 108.9 90.0 A
61 Rudyard High School conventional rudyard rural: Distant 108.8 89.8 B
62 Crossroads Charter Academy charter Big rapids town: remote 108.7 89.7 B
63 Central High School conventional Grand rapids city: Midsize 108.7 89.5 B
64 Ottawa Hills High School conventional Grand rapids city: Midsize 108.6 89.3 B
65 Midland High School conventional Midland town: Distant 108.6 89.2 B
66 Bendle High School conventional Bendle Suburb: Large 108.6 89.0 B
67 East Lansing High School conventional east Lansing city: Small 108.5 88.8 B
68 Skyline High School† conventional Ann Arbor Suburb: Large 108.5 88.7 B
69 Pontiac Academy for Excellence High School charter pontiac city: Small 108.3 88.5 B
70 Hart High School conventional Hart rural: remote 108.2 88.3 B
71 Grosse Pointe South High School conventional Grosse pointe Suburb: Large 108.2 88.2 B
72 Godwin Heights Sr High School conventional Godwin Heights city: Small 108.2 88.0 B
73 Cheboygan Area High School conventional cheboygan rural: Fringe 108.2 87.8 B
74 Mason County Eastern Jr High/High School conventional Mason county eastern rural: Distant 108.1 87.6 B
75 Carsonville-Port Sanilac High School conventional carsonville-port Sanilac rural: Distant 108.0 87.5 B
76 Central High School conventional Forest Hills Suburb: Large 107.9 87.3 B
77 West Iron County High School conventional West iron county town: remote 107.6 87.1 B
78 Owosso High School conventional owosso rural: Fringe 107.6 87.0 B
79 West Ottawa High School Campus conventional West ottawa Suburb: Small 107.5 86.8 B
80 Montabella Jr/Sr High conventional Montabella rural: remote 107.5 86.6 B
81 East Grand Rapids High School conventional east Grand rapids Suburb: Large 107.4 86.5 B
82 Frontier International Academy charter Hamtramck Suburb: Large 107.4 86.3 B
83 HEART Academy charter Harper Woods Suburb: Large 107.3 86.1 B
84 Black River Public School charter Holland city: Small 107.3 86.0 B
85 Big Rapids High School conventional Big rapids rural: Fringe 107.1 85.8 B
Mackinac Center for Public Policy
The Michigan Public High School Context and Performance Report Card 36

* Indicates not enough data were publicly available to include the school in the model.† Denotes schools that have less than four years of data publicly available, but still have enough publicly available data to be included in the model. ‡ As noted in Appendix E, several schools were erroneously listed in government tables as general education high schools and thus were originally included in the model. The subsequent removal of these schools from our graphics means that the percent rank of the school with the lowest CAP Score is not zero.
The Michigan Public High School CAP Report Card: Ranked By Score
Rank High School School Type District or Municipality LocaleOverall CAP Values
Score percent rank Grade
43 Pioneer High School conventional Ann Arbor city: Midsize 110.3 92.9 A
44 Creston High School conventional Grand rapids city: Midsize 110.1 92.7 A
45 Troy High School conventional troy city: Small 110.1 92.6 A
46 South Haven High School conventional South Haven town: Distant 109.8 92.4 A
47 Mott Middle College High School† Selective Flint city: Midsize 109.8 92.2 A
48 Harbor Beach Community High School conventional Harbor Beach rural: remote 109.7 92.0 A
49 Fordson High School conventional Dearborn city: Small 109.7 91.9 A
50 Roscommon High School conventional roscommon rural: Distant 109.5 91.7 A
51 West Michigan Academy of Environmental Science† charter Grand rapids Suburb: Large 109.4 91.5 A
52 Lake City High School conventional Lake city rural: Distant 109.4 91.4 A
53 North Muskegon High School conventional north Muskegon Suburb: Midsize 109.2 91.2 A
54 Cass City High School conventional cass city rural: Fringe 109.1 91.0 A
55 Ishpeming High School conventional ishpeming town: remote 109.1 90.9 A
56 Comstock High School conventional comstock Suburb: Midsize 109.0 90.7 A
57 Grand Haven High School conventional Grand Haven Suburb: Midsize 108.9 90.5 A
58 Hancock Central High School conventional Hancock rural: Fringe 108.9 90.4 A
59 Decatur High School conventional Decatur rural: Distant 108.9 90.2 A
60 Loy Norrix High School conventional kalamazoo city: Small 108.9 90.0 A
61 Rudyard High School conventional rudyard rural: Distant 108.8 89.8 B
62 Crossroads Charter Academy charter Big rapids town: remote 108.7 89.7 B
63 Central High School conventional Grand rapids city: Midsize 108.7 89.5 B
64 Ottawa Hills High School conventional Grand rapids city: Midsize 108.6 89.3 B
65 Midland High School conventional Midland town: Distant 108.6 89.2 B
66 Bendle High School conventional Bendle Suburb: Large 108.6 89.0 B
67 East Lansing High School conventional east Lansing city: Small 108.5 88.8 B
68 Skyline High School† conventional Ann Arbor Suburb: Large 108.5 88.7 B
69 Pontiac Academy for Excellence High School charter pontiac city: Small 108.3 88.5 B
70 Hart High School conventional Hart rural: remote 108.2 88.3 B
71 Grosse Pointe South High School conventional Grosse pointe Suburb: Large 108.2 88.2 B
72 Godwin Heights Sr High School conventional Godwin Heights city: Small 108.2 88.0 B
73 Cheboygan Area High School conventional cheboygan rural: Fringe 108.2 87.8 B
74 Mason County Eastern Jr High/High School conventional Mason county eastern rural: Distant 108.1 87.6 B
75 Carsonville-Port Sanilac High School conventional carsonville-port Sanilac rural: Distant 108.0 87.5 B
76 Central High School conventional Forest Hills Suburb: Large 107.9 87.3 B
77 West Iron County High School conventional West iron county town: remote 107.6 87.1 B
78 Owosso High School conventional owosso rural: Fringe 107.6 87.0 B
79 West Ottawa High School Campus conventional West ottawa Suburb: Small 107.5 86.8 B
80 Montabella Jr/Sr High conventional Montabella rural: remote 107.5 86.6 B
81 East Grand Rapids High School conventional east Grand rapids Suburb: Large 107.4 86.5 B
82 Frontier International Academy charter Hamtramck Suburb: Large 107.4 86.3 B
83 HEART Academy charter Harper Woods Suburb: Large 107.3 86.1 B
84 Black River Public School charter Holland city: Small 107.3 86.0 B
85 Big Rapids High School conventional Big rapids rural: Fringe 107.1 85.8 B
The Michigan Public High School CAP Report Card: Ranked By Score
Rank High School School Type District or Municipality LocaleOverall CAP Values
Score percent rank Grade
86 Early College Alliance† SelectiveWashtenaw intermediate School District
Suburb: Large 107.1 85.6 B
87 West Sr High conventional traverse city rural: Fringe 107.0 85.4 B
88 Central High School conventional traverse city town: remote 107.0 85.3 B
89 Madison High School conventional Madison (Lenawee) rural: Fringe 106.9 85.1 B
90 Bloomfield Hills Andover High School conventional Bloomfield Hills Suburb: Large 106.9 84.9 B
91 Union High School conventional Dowagiac Union town: Distant 106.7 84.8 B
92 Manton Consolidated High School conventional Manton rural: Distant 106.6 84.6 B
93 Houghton Lake High School conventional Houghton Lake rural: Fringe 106.5 84.4 B
94 Deckerville Community High School conventional Deckerville rural: Distant 106.5 84.3 B
95 Northville High School conventional northville Suburb: Large 106.5 84.1 B
96 E.A. Johnson Memorial High School conventional Mt. Morris rural: Fringe 106.5 83.9 B
97 Northern High School conventional Forest Hills Suburb: Large 106.4 83.8 B
98 Kalkaska High School conventional kalkaska town: remote 106.4 83.6 B
99 Grand Blanc Community High School conventional Grand Blanc Suburb: Large 106.3 83.4 B
100 Rochester Adams High School conventional rochester Suburb: Large 106.3 83.2 B
101 Saline High School conventional Saline rural: Fringe 106.3 83.1 B
102 Melvindale High School conventionalMelvindale-north Allen park
Suburb: Large 106.3 82.9 B
103 Eastern High School conventional Forest Hills rural: Fringe 106.2 82.7 B
104 Edsel Ford High School conventional Dearborn city: Small 106.1 82.6 B
105 Oscoda Area High School conventional oscoda rural: Fringe 106.1 82.4 B
106 Crestwood High School conventional crestwood Suburb: Large 106.1 82.2 B
107 Bad Axe High School conventional Bad Axe rural: Fringe 106.1 82.1 B
108 University High School Academy† Selective Southfield city: Small 106.1 81.9 B
109 Sturgis High School conventional Sturgis town: Distant 106.0 81.7 B
110 Croswell-Lexington High School conventional croswell-Lexington rural: Fringe 106.0 81.6 B
111 Rogers High School conventional Wyoming city: Small 106.0 81.4 B
112 Ernest W. Seaholm High School conventional Birmingham Suburb: Large 105.9 81.2 B
113 University Preparatory Academy High School† charter Detroit city: Large 105.9 81.0 B
114 Dearborn High School conventional Dearborn city: Small 105.9 80.9 B
115 Manistique Middle and High School conventional Manistique town: remote 105.9 80.7 B
116 Marcellus High School conventional Marcellus rural: Distant 105.8 80.5 B
117 White Pigeon Jr/Sr High School conventional White pigeon rural: Fringe 105.8 80.4 B
118 Hamilton High School conventional Hamilton rural: Distant 105.8 80.2 B
119 Annapolis High School conventional Dearborn Heights #7 Suburb: Large 105.7 80.0 B
120 Hamtramck High School conventional Hamtramck Suburb: Large 105.7 79.9 B
121 Newaygo High School conventional newaygo town: Distant 105.6 79.7 B
122 Saugatuck High School conventional Saugatuck rural: Distant 105.6 79.5 B
123 Berrien Springs High School conventional Berrien Springs town: Fringe 105.5 79.4 B
124 Mona Shores High School conventional Mona Shores city: Small 105.4 79.2 B
125 Wyoming Park High School conventional Wyoming city: Small 105.4 79.0 B
126 Portage Northern High School conventional portage city: Small 105.4 78.8 B
127 Sandusky High School conventional Sandusky town: Distant 105.3 78.7 B
Mackinac Center for Public Policy
The Michigan Public High School Context and Performance Report Card 37

* Indicates not enough data were publicly available to include the school in the model.† Denotes schools that have less than four years of data publicly available, but still have enough publicly available data to be included in the model. ‡ As noted in Appendix E, several schools were erroneously listed in government tables as general education high schools and thus were originally included in the model. The subsequent removal of these schools from our graphics means that the percent rank of the school with the lowest CAP Score is not zero.
The Michigan Public High School CAP Report Card: Ranked By Score
Rank High School School Type District or Municipality LocaleOverall CAP Values
Score percent rank Grade
128 Ithaca High School conventional ithaca town: Distant 105.3 78.5 B
129 Advanced Technology Academy† charter Dearborn city: Small 105.2 78.3 B
130 Gaylord High School conventional Gaylord rural: Fringe 105.2 78.2 B
131 Caro High School conventional caro town: Distant 105.2 78.0 B
132 A.D. Johnston Jr/Sr High School conventional Bessemer rural: Distant 105.1 77.8 B
133 Cadillac Sr High School conventional cadillac town: remote 105.0 77.7 B
134 Kalamazoo Central High School conventional kalamazoo Suburb: Midsize 105.0 77.5 B
135 Bangor High School conventional Bangor rural: Distant 104.9 77.3 B
136 Haslett High School conventional Haslett Suburb: Large 104.8 77.2 B
137 Arthur Hill High School conventional Saginaw city: Small 104.7 77.0 B
138 Paw Paw High School conventional paw paw rural: Fringe 104.5 76.8 B
139 Harbor Springs High School conventional Harbor Springs rural: Distant 104.5 76.6 B
140 Frankenmuth High School conventional Frankenmuth rural: Fringe 104.5 76.5 B
141 Wayne Memorial High School conventional Wayne-Westland Suburb: Large 104.4 76.3 B
142 Tawas Area High School conventional tawas rural: Fringe 104.3 76.1 B
143 Boyne City High School conventional Boyne town: remote 104.3 76.0 B
144 Albion High School conventional Albion town: Distant 104.3 75.8 B
145 Central Lake Public School† conventional central Lake rural: remote 104.3 75.6 B
146 Chippewa Hills High School conventional chippewa Hills rural: remote 104.3 75.5 B
147 Niles Sr High School conventional niles city: Small 104.3 75.3 B
148 Montague High School conventional Montague rural: Fringe 104.2 75.1 B
149 Gladwin High School conventional Gladwin town: Distant 104.2 75.0 B
150 Galesburg-Augusta High School conventional Galesburg-Augusta rural: Fringe 104.1 74.8 B
151 Johannesburg-Lewiston High School conventional Johannesburg-Lewiston rural: Distant 104.1 74.6 B
152 Vestaburg Community High School conventional Vestaburg rural: remote 104.1 74.5 B
153 Plymouth High School conventional plymouth-canton Suburb: Large 104.0 74.3 B
154 Chelsea High School conventional chelsea town: Fringe 104.0 74.1 B
155 Hillsdale High School conventional Hillsdale town: Distant 104.0 73.9 B
156 Kingsley Area High School conventional kingsley rural: Distant 104.0 73.8 B
157 Ubly Community High School conventional Ubly rural: Distant 103.9 73.6 B
158 Stoney Creek High School conventional rochester Suburb: Large 103.9 73.4 B
159 Hale High School conventional Hale rural: remote 103.9 73.3 B
160 Chandler Park Academy High School† charter Harper Woods Suburb: Large 103.9 73.1 B
161 Davison High School conventional Davison Suburb: Large 103.8 72.9 B
162 Washtenaw Technical Middle College charter Ann Arbor Suburb: Large 103.8 72.8 B
163 Center Line High School conventional center Line Suburb: Large 103.7 72.6 B
164 Colon High School conventional colon rural: Distant 103.7 72.4 B
165 Gobles High School conventional Gobles rural: Distant 103.6 72.3 B
166 Pennfield Sr High School conventional Pennfield rural: Fringe 103.6 72.1 B
167 Bark River-Harris Jr/Sr High School conventional Bark river-Harris rural: remote 103.5 71.9 B
168 Portage Central High School conventional portage city: Small 103.5 71.7 B
169 Canton High School conventional plymouth-canton Suburb: Large 103.5 71.6 B
170 Dexter High School conventional Dexter rural: Fringe 103.4 71.4 B
171 Harrison Community High School conventional Harrison rural: Fringe 103.4 71.2 B
172 Hesperia High School conventional Hesperia rural: Distant 103.4 71.1 B
Mackinac Center for Public Policy
The Michigan Public High School Context and Performance Report Card 38

* Indicates not enough data were publicly available to include the school in the model.† Denotes schools that have less than four years of data publicly available, but still have enough publicly available data to be included in the model. ‡ As noted in Appendix E, several schools were erroneously listed in government tables as general education high schools and thus were originally included in the model. The subsequent removal of these schools from our graphics means that the percent rank of the school with the lowest CAP Score is not zero.
The Michigan Public High School CAP Report Card: Ranked By Score
Rank High School School Type District or Municipality LocaleOverall CAP Values
Score percent rank Grade
128 Ithaca High School conventional ithaca town: Distant 105.3 78.5 B
129 Advanced Technology Academy† charter Dearborn city: Small 105.2 78.3 B
130 Gaylord High School conventional Gaylord rural: Fringe 105.2 78.2 B
131 Caro High School conventional caro town: Distant 105.2 78.0 B
132 A.D. Johnston Jr/Sr High School conventional Bessemer rural: Distant 105.1 77.8 B
133 Cadillac Sr High School conventional cadillac town: remote 105.0 77.7 B
134 Kalamazoo Central High School conventional kalamazoo Suburb: Midsize 105.0 77.5 B
135 Bangor High School conventional Bangor rural: Distant 104.9 77.3 B
136 Haslett High School conventional Haslett Suburb: Large 104.8 77.2 B
137 Arthur Hill High School conventional Saginaw city: Small 104.7 77.0 B
138 Paw Paw High School conventional paw paw rural: Fringe 104.5 76.8 B
139 Harbor Springs High School conventional Harbor Springs rural: Distant 104.5 76.6 B
140 Frankenmuth High School conventional Frankenmuth rural: Fringe 104.5 76.5 B
141 Wayne Memorial High School conventional Wayne-Westland Suburb: Large 104.4 76.3 B
142 Tawas Area High School conventional tawas rural: Fringe 104.3 76.1 B
143 Boyne City High School conventional Boyne town: remote 104.3 76.0 B
144 Albion High School conventional Albion town: Distant 104.3 75.8 B
145 Central Lake Public School† conventional central Lake rural: remote 104.3 75.6 B
146 Chippewa Hills High School conventional chippewa Hills rural: remote 104.3 75.5 B
147 Niles Sr High School conventional niles city: Small 104.3 75.3 B
148 Montague High School conventional Montague rural: Fringe 104.2 75.1 B
149 Gladwin High School conventional Gladwin town: Distant 104.2 75.0 B
150 Galesburg-Augusta High School conventional Galesburg-Augusta rural: Fringe 104.1 74.8 B
151 Johannesburg-Lewiston High School conventional Johannesburg-Lewiston rural: Distant 104.1 74.6 B
152 Vestaburg Community High School conventional Vestaburg rural: remote 104.1 74.5 B
153 Plymouth High School conventional plymouth-canton Suburb: Large 104.0 74.3 B
154 Chelsea High School conventional chelsea town: Fringe 104.0 74.1 B
155 Hillsdale High School conventional Hillsdale town: Distant 104.0 73.9 B
156 Kingsley Area High School conventional kingsley rural: Distant 104.0 73.8 B
157 Ubly Community High School conventional Ubly rural: Distant 103.9 73.6 B
158 Stoney Creek High School conventional rochester Suburb: Large 103.9 73.4 B
159 Hale High School conventional Hale rural: remote 103.9 73.3 B
160 Chandler Park Academy High School† charter Harper Woods Suburb: Large 103.9 73.1 B
161 Davison High School conventional Davison Suburb: Large 103.8 72.9 B
162 Washtenaw Technical Middle College charter Ann Arbor Suburb: Large 103.8 72.8 B
163 Center Line High School conventional center Line Suburb: Large 103.7 72.6 B
164 Colon High School conventional colon rural: Distant 103.7 72.4 B
165 Gobles High School conventional Gobles rural: Distant 103.6 72.3 B
166 Pennfield Sr High School conventional Pennfield rural: Fringe 103.6 72.1 B
167 Bark River-Harris Jr/Sr High School conventional Bark river-Harris rural: remote 103.5 71.9 B
168 Portage Central High School conventional portage city: Small 103.5 71.7 B
169 Canton High School conventional plymouth-canton Suburb: Large 103.5 71.6 B
170 Dexter High School conventional Dexter rural: Fringe 103.4 71.4 B
171 Harrison Community High School conventional Harrison rural: Fringe 103.4 71.2 B
172 Hesperia High School conventional Hesperia rural: Distant 103.4 71.1 B
The Michigan Public High School CAP Report Card: Ranked By Score
Rank High School School Type District or Municipality LocaleOverall CAP Values
Score percent rank Grade
173 Petoskey High School conventional petoskey town: remote 103.4 70.9 B
174 Wylie E. Groves High School conventional Birmingham Suburb: Large 103.4 70.7 B
175 Novi High School conventional novi city: Small 103.3 70.6 B
176 St. Joseph High School conventional St. Joseph Suburb: Small 103.3 70.4 B
177 Frankfort High School conventional Frankfort-elberta rural: remote 103.3 70.2 B
178 Farwell High School conventional Farwell rural: Distant 103.3 70.1 B
179 Ogemaw Heights High School conventional West Branch-rose city rural: remote 103.3 69.9 c
180 Northview High School conventional northview Suburb: Large 103.3 69.7 c
181 Brown City High School conventional Brown city rural: Distant 103.2 69.5 c
182 John Glenn High School conventional Bangor township Suburb: Small 103.2 69.4 c
183 Mendon Middle/High School conventional Mendon rural: Distant 103.2 69.2 c
184 Columbia Central High School conventional columbia rural: Fringe 103.2 69.0 c
185 Williamston High School conventional Williamston town: Fringe 103.1 68.9 c
186 Belding High School conventional Belding town: Distant 103.1 68.7 c
187 Hartford High School conventional Hartford town: Distant 103.1 68.5 c
188 Rogers City High School conventional rogers town: remote 103.1 68.4 c
189 Onekama Middle/High School† conventional onekama rural: Distant 103.1 68.2 c
190 Holly High School conventional Holly rural: Fringe 103.1 68.0 c
191 New Buffalo Sr High School conventional new Buffalo rural: Fringe 103.1 67.9 c
192 Luther L. Wright High School conventional ironwood town: remote 103.1 67.7 c
193 Jackson High School conventional Jackson city: Small 103.0 67.5 c
194 Pine River High School conventional pine river rural: remote 103.0 67.3 c
195 Fennville Public High School conventional Fennville rural: Distant 103.0 67.2 c
196 Inland Lakes High School conventional inland Lakes rural: remote 103.0 67.0 c
197 Elk Rapids High School conventional elk rapids rural: Distant 103.0 66.8 c
198 Heritage High School conventional Saginaw township city: Small 103.0 66.7 c
199 Ludington High School conventional Ludington town: remote 103.0 66.5 c
200 Rockford High School conventional rockford Suburb: Large 102.9 66.3 c
201 Marlette Jr/Sr High School conventional Marlette rural: remote 102.9 66.2 c
202 East Kentwood High School conventional kentwood Suburb: Large 102.9 66.0 c
203 Laker High School conventionalelkton-pigeon-Bay port Laker
rural: remote 102.9 65.8 c
204 Charlevoix High School conventional charlevoix rural: Fringe 102.9 65.7 c
205 Hudsonville High School conventional Hudsonville Suburb: Large 102.8 65.5 c
206 Ionia High School conventional ionia town: Distant 102.8 65.3 c
207 Rochester High School conventional rochester Suburb: Large 102.8 65.1 c
208 Carman-Ainsworth High School conventional carman-Ainsworth Suburb: Large 102.7 65.0 c
209 Escanaba Area Public High School conventional escanaba town: remote 102.6 64.8 c
210 Lakeshore High School conventional Lakeshore (Berrien) rural: Fringe 102.6 64.6 c
211 South Lyon High School conventional South Lyon Suburb: Midsize 102.6 64.5 c
212 Reed City High School conventional reed city town: remote 102.5 64.3 c
213 Athens High School conventional troy city: Small 102.5 64.1 c
214 Jenison High School conventional Jenison Suburb: Large 102.5 64.0 c
215 Jonesville High School conventional Jonesville rural: Distant 102.5 63.8 c
216 Manistee High School conventional Manistee town: remote 102.5 63.6 c
217 Morenci Area High School conventional Morenci rural: Distant 102.4 63.5 c
Mackinac Center for Public Policy
The Michigan Public High School Context and Performance Report Card 39
* Indicates not enough data were publicly available to include the school in the model.† Denotes schools that have less than four years of data publicly available, but still have enough publicly available data to be included in the model. ‡ As noted in Appendix E, several schools were erroneously listed in government tables as general education high schools and thus were originally included in the model. The subsequent removal of these schools from our graphics means that the percent rank of the school with the lowest CAP Score is not zero.
The Michigan Public High School CAP Report Card: Ranked By Score
Rank High School School Type District or Municipality LocaleOverall CAP Values
Score percent rank Grade
218 Salem High School conventional plymouth-canton Suburb: Large 102.4 63.3 c
219 Cedar Springs High School conventional cedar Springs town: Fringe 102.3 63.1 c
220 Kearsley High School conventional kearsley Suburb: Large 102.3 62.9 c
221 Meridian High School conventional Meridian rural: Fringe 102.3 62.8 c
222 Edwardsburg High School conventional edwardsburg Suburb: Large 102.3 62.6 c
223 Eastern High School conventional Lansing city: Midsize 102.3 62.4 c
224 Mattawan High School conventional Mattawan town: Fringe 102.3 62.3 c
225 Western High School conventional Western rural: Fringe 102.3 62.1 c
226 Lawrence Jr/Sr High School conventional Lawrence rural: Distant 102.3 61.9 c
227 Byron Center High School conventional Byron center rural: Fringe 102.2 61.8 c
228 Morley Stanwood High School conventional Morley Stanwood rural: Distant 102.2 61.6 c
229 Springport High School conventional Springport rural: Distant 102.2 61.4 c
230 Royal Oak High School conventional royal oak Suburb: Large 102.2 61.3 c
231 Fenton Sr High School conventional Fenton Suburb: Large 102.2 61.1 c
232 Sterling Heights Sr High School conventional Warren Suburb: Large 102.1 60.9 c
233 Greenville Sr High School conventional Greenville town: Distant 102.1 60.7 c
234 Mayville High School conventional Mayville rural: Distant 102.1 60.6 c
235 Hillman Community Jr/Sr High School† conventional Hillman rural: remote 102.1 60.4 c
236 Fitzgerald Sr High School conventional Fitzgerald city: Midsize 102.0 60.2 c
237 Grandville High School conventional Grandville Suburb: Large 102.0 60.1 c
238 Central Montcalm High School conventional central Montcalm rural: Distant 101.9 59.9 c
239 Marquette Sr High School conventional Marquette town: remote 101.9 59.7 c
240 Bloomfield Hills Lahser High School conventional Bloomfield Hills Suburb: Large 101.8 59.6 c
241 Imlay City High School conventional imlay city town: Distant 101.8 59.4 c
242 Alpena High School conventional Alpena town: remote 101.8 59.2 c
243 Grosse Ile High School conventional Grosse ile township Suburb: Large 101.7 59.1 c
244 Brighton High School conventional Brighton Suburb: Midsize 101.7 58.9 c
245 Pellston Middle/High School conventional pellston rural: remote 101.7 58.7 c
246 Maple City-Glen Lake Jr/Sr High School conventional Glen Lake rural: remote 101.6 58.5 c
247 Alcona Community High School conventional Alcona rural: Distant 101.6 58.4 c
248 Grosse Pointe North High School conventional Grosse pointe Suburb: Large 101.6 58.2 c
249 Sault Area High School conventional Sault Ste. Marie town: remote 101.5 58.0 c
250 Mt. Pleasant Sr High School conventional Mt. pleasant town: Distant 101.5 57.9 c
251 Saranac High School conventional Saranac rural: Distant 101.5 57.7 c
252 Lowell Sr High School conventional Lowell rural: Fringe 101.5 57.5 c
253 Centreville High School conventional centreville rural: Distant 101.5 57.4 c
254 Robichaud Sr High School conventional Westwood Suburb: Large 101.5 57.2 c
255 Lincoln Park High School conventional Lincoln park Suburb: Large 101.4 57.0 c
256 Bay City Central High School conventional Bay city city: Small 101.4 56.9 c
257 Garber High School conventional essexville-Hampton Suburb: Small 101.4 56.7 c
258 North Farmington High School conventional Farmington city: Small 101.4 56.5 c
259 Milford High School conventional Huron Valley rural: Fringe 101.4 56.3 c
260 Comstock Park High School conventional comstock park Suburb: Large 101.4 56.2 c
261 Iron Mountain High School conventional iron Mountain town: remote 101.4 56.0 c
262 Lake Orion Community High School conventional Lake orion rural: Fringe 101.4 55.8 c
Mackinac Center for Public Policy
The Michigan Public High School Context and Performance Report Card 40

* Indicates not enough data were publicly available to include the school in the model.† Denotes schools that have less than four years of data publicly available, but still have enough publicly available data to be included in the model. ‡ As noted in Appendix E, several schools were erroneously listed in government tables as general education high schools and thus were originally included in the model. The subsequent removal of these schools from our graphics means that the percent rank of the school with the lowest CAP Score is not zero.
The Michigan Public High School CAP Report Card: Ranked By Score
Rank High School School Type District or Municipality LocaleOverall CAP Values
Score percent rank Grade
218 Salem High School conventional plymouth-canton Suburb: Large 102.4 63.3 c
219 Cedar Springs High School conventional cedar Springs town: Fringe 102.3 63.1 c
220 Kearsley High School conventional kearsley Suburb: Large 102.3 62.9 c
221 Meridian High School conventional Meridian rural: Fringe 102.3 62.8 c
222 Edwardsburg High School conventional edwardsburg Suburb: Large 102.3 62.6 c
223 Eastern High School conventional Lansing city: Midsize 102.3 62.4 c
224 Mattawan High School conventional Mattawan town: Fringe 102.3 62.3 c
225 Western High School conventional Western rural: Fringe 102.3 62.1 c
226 Lawrence Jr/Sr High School conventional Lawrence rural: Distant 102.3 61.9 c
227 Byron Center High School conventional Byron center rural: Fringe 102.2 61.8 c
228 Morley Stanwood High School conventional Morley Stanwood rural: Distant 102.2 61.6 c
229 Springport High School conventional Springport rural: Distant 102.2 61.4 c
230 Royal Oak High School conventional royal oak Suburb: Large 102.2 61.3 c
231 Fenton Sr High School conventional Fenton Suburb: Large 102.2 61.1 c
232 Sterling Heights Sr High School conventional Warren Suburb: Large 102.1 60.9 c
233 Greenville Sr High School conventional Greenville town: Distant 102.1 60.7 c
234 Mayville High School conventional Mayville rural: Distant 102.1 60.6 c
235 Hillman Community Jr/Sr High School† conventional Hillman rural: remote 102.1 60.4 c
236 Fitzgerald Sr High School conventional Fitzgerald city: Midsize 102.0 60.2 c
237 Grandville High School conventional Grandville Suburb: Large 102.0 60.1 c
238 Central Montcalm High School conventional central Montcalm rural: Distant 101.9 59.9 c
239 Marquette Sr High School conventional Marquette town: remote 101.9 59.7 c
240 Bloomfield Hills Lahser High School conventional Bloomfield Hills Suburb: Large 101.8 59.6 c
241 Imlay City High School conventional imlay city town: Distant 101.8 59.4 c
242 Alpena High School conventional Alpena town: remote 101.8 59.2 c
243 Grosse Ile High School conventional Grosse ile township Suburb: Large 101.7 59.1 c
244 Brighton High School conventional Brighton Suburb: Midsize 101.7 58.9 c
245 Pellston Middle/High School conventional pellston rural: remote 101.7 58.7 c
246 Maple City-Glen Lake Jr/Sr High School conventional Glen Lake rural: remote 101.6 58.5 c
247 Alcona Community High School conventional Alcona rural: Distant 101.6 58.4 c
248 Grosse Pointe North High School conventional Grosse pointe Suburb: Large 101.6 58.2 c
249 Sault Area High School conventional Sault Ste. Marie town: remote 101.5 58.0 c
250 Mt. Pleasant Sr High School conventional Mt. pleasant town: Distant 101.5 57.9 c
251 Saranac High School conventional Saranac rural: Distant 101.5 57.7 c
252 Lowell Sr High School conventional Lowell rural: Fringe 101.5 57.5 c
253 Centreville High School conventional centreville rural: Distant 101.5 57.4 c
254 Robichaud Sr High School conventional Westwood Suburb: Large 101.5 57.2 c
255 Lincoln Park High School conventional Lincoln park Suburb: Large 101.4 57.0 c
256 Bay City Central High School conventional Bay city city: Small 101.4 56.9 c
257 Garber High School conventional essexville-Hampton Suburb: Small 101.4 56.7 c
258 North Farmington High School conventional Farmington city: Small 101.4 56.5 c
259 Milford High School conventional Huron Valley rural: Fringe 101.4 56.3 c
260 Comstock Park High School conventional comstock park Suburb: Large 101.4 56.2 c
261 Iron Mountain High School conventional iron Mountain town: remote 101.4 56.0 c
262 Lake Orion Community High School conventional Lake orion rural: Fringe 101.4 55.8 c
The Michigan Public High School CAP Report Card: Ranked By Score
Rank High School School Type District or Municipality LocaleOverall CAP Values
Score percent rank Grade
263 Vassar Sr High School conventional Vassar town: Distant 101.4 55.7 c
264 Otsego High School conventional otsego rural: Fringe 101.3 55.5 c
265 Mason County Central High School conventional Mason county central rural: Distant 101.3 55.3 c
266 Parchment High School conventional parchment Suburb: Midsize 101.3 55.2 c
267 Constantine High School conventional constantine town: Distant 101.3 55.0 c
268 Clare High School conventional clare town: remote 101.2 54.8 c
269 Beal City High School conventional Beal city rural: Distant 101.1 54.7 c
270 Newberry High School conventional tahquamenon town: remote 101.1 54.5 c
271 Kingsford High School conventional Breitung township town: remote 101.1 54.3 c
272 Brimley Jr/Sr High conventional Brimley rural: Distant 101.1 54.1 c
273 Zeeland West High School conventional Zeeland rural: Fringe 101.0 54.0 c
274 Linden High School conventional Linden rural: Fringe 101.0 53.8 c
275 Battle Creek Central High School conventional Battle creek city: Small 101.0 53.6 c
276 DeWitt High School conventional DeWitt Suburb: Large 100.9 53.5 c
277 Standish-Sterling Central High School conventional Standish-Sterling rural: Distant 100.9 53.3 c
278 Holton High School conventional Holton rural: Distant 100.9 53.1 c
279 Forest Park School conventional Forest park rural: remote 100.9 53.0 c
280 Onaway Sr High School conventional onaway rural: remote 100.9 52.8 c
281 Sparta Sr High School conventional Sparta Suburb: Large 100.8 52.6 c
282 Hill-McCloy High School conventional Montrose rural: Fringe 100.8 52.5 c
283 Mesick Consolidated Jr/Sr High School conventional Mesick rural: remote 100.8 52.3 c
284 East Jordan High School conventional east Jordan rural: Distant 100.7 52.1 c
285 Norway High School conventional norway-Vulcan town: remote 100.7 51.9 c
286 Gladstone Area High School conventional Gladstone rural: Fringe 100.7 51.8 c
287 South Lyon East High School† conventional South Lyon rural: Fringe 100.6 51.6 c
288 Fruitport High School conventional Fruitport Suburb: Midsize 100.6 51.4 c
289 Vicksburg High School conventional Vicksburg Suburb: Midsize 100.6 51.3 c
290 Walled Lake Central High School conventional Walled Lake Suburb: Large 100.6 51.1 c
291 Bullock Creek High School conventional Bullock creek rural: Fringe 100.6 50.9 c
292 Landmark Academy† charter kimball rural: Fringe 100.5 50.8 c
293 Mount Clemens High School conventional Mt. clemens Suburb: Large 100.5 50.6 c
294 Caledonia High School conventional caledonia rural: Fringe 100.4 50.4 c
295 Bridgeport High School conventional Bridgeport-Spaulding rural: Fringe 100.4 50.3 c
296 Lapeer East Sr High School conventional Lapeer town: Distant 100.4 50.1 c
297 Marysville High School conventional Marysville Suburb: Small 100.4 49.9 c
298 Kenowa Hills High School conventional kenowa Hills Suburb: Large 100.3 49.7 c
299 Pewamo-Westphalia Jr/Sr High School conventional pewamo-Westphalia rural: Distant 100.3 49.6 c
300 West Bloomfield High School conventional West Bloomfield Suburb: Large 100.3 49.4 c
301 Manchester High School conventional Manchester rural: Distant 100.2 49.2 c
302 Coopersville High School conventional coopersville town: Fringe 100.2 49.1 c
303 Roseville High School conventional roseville Suburb: Large 100.2 48.9 c
304 Port Huron Northern High School conventional port Huron Suburb: Small 100.2 48.7 c
305 New Lothrop High School conventional new Lothrop rural: Distant 100.1 48.6 c
306 Pinconning High School conventional pinconning rural: Distant 100.1 48.4 c
Mackinac Center for Public Policy
The Michigan Public High School Context and Performance Report Card 41

* Indicates not enough data were publicly available to include the school in the model.† Denotes schools that have less than four years of data publicly available, but still have enough publicly available data to be included in the model. ‡ As noted in Appendix E, several schools were erroneously listed in government tables as general education high schools and thus were originally included in the model. The subsequent removal of these schools from our graphics means that the percent rank of the school with the lowest CAP Score is not zero.
The Michigan Public High School CAP Report Card: Ranked By Score
Rank High School School Type District or Municipality LocaleOverall CAP Values
Score percent rank Grade
307 Winans Academy High School charter Detroit city: Large 100.1 48.2 c
308 Churchill High School conventional Livonia city: Small 100.1 48.1 c
309 Suttons Bay Sr High School conventional Suttons Bay rural: Distant 100.0 47.9 c
310 Berkley High School conventional Berkley Suburb: Large 100.0 47.7 c
311 Western International High School conventional Detroit city: Large 100.0 47.5 c
312 Eaton Rapids Sr High School conventional eaton rapids town: Fringe 99.9 47.4 c
313 Delton-Kellogg High School conventional Delton-kellogg rural: Distant 99.9 47.2 c
314 Evart High School conventional evart rural: remote 99.9 47.0 c
315 St. Clair High School conventional east china Suburb: Small 99.8 46.9 c
316 Gull Lake High School conventional Gull Lake rural: Fringe 99.8 46.7 c
317 Homer Community High School conventional Homer rural: Distant 99.8 46.5 c
318 Negaunee High School conventional negaunee town: remote 99.8 46.4 c
319 Alma Sr High School conventional Alma town: Distant 99.8 46.2 c
320 University High School conventional Ferndale Suburb: Large 99.6 46.0 c
321 Clarkston High School conventional clarkston Suburb: Large 99.6 45.9 c
322 Ferndale High School conventional Ferndale Suburb: Large 99.6 45.7 c
323 Blissfield High School conventional Blissfield town: Distant 99.6 45.5 c
324 Coleman Jr/Sr High School conventional coleman rural: Distant 99.6 45.3 c
325 Allendale High School conventional Allendale Suburb: Large 99.6 45.2 c
326 Avondale High School conventional Avondale Suburb: Large 99.6 45.0 c
327 Walled Lake Northern High School conventional Walled Lake Suburb: Large 99.5 44.8 c
328 Yale Sr High School conventional Yale rural: Distant 99.5 44.7 c
329 Martin High School conventional Martin rural: Distant 99.5 44.5 c
330 Hopkins High School conventional Hopkins rural: Distant 99.5 44.3 c
331 Whitehall Sr High School conventional Whitehall rural: Fringe 99.5 44.2 c
332 Munising High and Middle School conventional Munising rural: remote 99.4 44.0 c
333 Fulton High School conventional Fulton rural: Distant 99.4 43.8 c
334 Holt Sr High School conventional Holt Suburb: Large 99.4 43.7 c
335 Everett High School conventional Lansing city: Midsize 99.4 43.5 c
336 Perry High School conventional perry town: Fringe 99.4 43.3 c
337 Goodrich High School conventional Goodrich rural: Fringe 99.3 43.1 c
338 Fremont High School conventional Fremont town: Distant 99.3 43.0 c
339 Romulus Sr High School conventional romulus Suburb: Large 99.2 42.8 c
340 Bridgman High School conventional Bridgman rural: Fringe 99.2 42.6 c
341 Stevenson High School conventional Livonia city: Small 99.2 42.5 c
342 Whitmore Lake High School conventional Whitmore Lake rural: Fringe 99.2 42.3 c
343 Ross Beatty High School conventional cassopolis rural: Distant 99.2 42.1 c
344 Lakeview High School conventional Lakeview (Montcalm) rural: Distant 99.2 42.0 c
345 McBain High School conventional McBain rural Agricultural rural: Distant 99.2 41.8 c
346 Eisenhower High School conventional Utica Suburb: Large 99.2 41.6 c
347 Algonac High School conventional Algonac Suburb: Large 99.2 41.5 c
348 Thornapple Kellogg High School conventional thornapple kellogg rural: Fringe 99.1 41.3 c
349 Plainwell High School conventional plainwell rural: Fringe 99.1 41.1 c
350 Shepherd High School conventional Shepherd rural: Distant 99.1 40.9 c
351 Walled Lake Western High School conventional Walled Lake Suburb: Large 99.0 40.8 c
352 Hartland High School conventional Hartland Suburb: Large 99.0 40.6 c
Mackinac Center for Public Policy
The Michigan Public High School Context and Performance Report Card 42

* Indicates not enough data were publicly available to include the school in the model.† Denotes schools that have less than four years of data publicly available, but still have enough publicly available data to be included in the model. ‡ As noted in Appendix E, several schools were erroneously listed in government tables as general education high schools and thus were originally included in the model. The subsequent removal of these schools from our graphics means that the percent rank of the school with the lowest CAP Score is not zero.
The Michigan Public High School CAP Report Card: Ranked By Score
Rank High School School Type District or Municipality LocaleOverall CAP Values
Score percent rank Grade
307 Winans Academy High School charter Detroit city: Large 100.1 48.2 c
308 Churchill High School conventional Livonia city: Small 100.1 48.1 c
309 Suttons Bay Sr High School conventional Suttons Bay rural: Distant 100.0 47.9 c
310 Berkley High School conventional Berkley Suburb: Large 100.0 47.7 c
311 Western International High School conventional Detroit city: Large 100.0 47.5 c
312 Eaton Rapids Sr High School conventional eaton rapids town: Fringe 99.9 47.4 c
313 Delton-Kellogg High School conventional Delton-kellogg rural: Distant 99.9 47.2 c
314 Evart High School conventional evart rural: remote 99.9 47.0 c
315 St. Clair High School conventional east china Suburb: Small 99.8 46.9 c
316 Gull Lake High School conventional Gull Lake rural: Fringe 99.8 46.7 c
317 Homer Community High School conventional Homer rural: Distant 99.8 46.5 c
318 Negaunee High School conventional negaunee town: remote 99.8 46.4 c
319 Alma Sr High School conventional Alma town: Distant 99.8 46.2 c
320 University High School conventional Ferndale Suburb: Large 99.6 46.0 c
321 Clarkston High School conventional clarkston Suburb: Large 99.6 45.9 c
322 Ferndale High School conventional Ferndale Suburb: Large 99.6 45.7 c
323 Blissfield High School conventional Blissfield town: Distant 99.6 45.5 c
324 Coleman Jr/Sr High School conventional coleman rural: Distant 99.6 45.3 c
325 Allendale High School conventional Allendale Suburb: Large 99.6 45.2 c
326 Avondale High School conventional Avondale Suburb: Large 99.6 45.0 c
327 Walled Lake Northern High School conventional Walled Lake Suburb: Large 99.5 44.8 c
328 Yale Sr High School conventional Yale rural: Distant 99.5 44.7 c
329 Martin High School conventional Martin rural: Distant 99.5 44.5 c
330 Hopkins High School conventional Hopkins rural: Distant 99.5 44.3 c
331 Whitehall Sr High School conventional Whitehall rural: Fringe 99.5 44.2 c
332 Munising High and Middle School conventional Munising rural: remote 99.4 44.0 c
333 Fulton High School conventional Fulton rural: Distant 99.4 43.8 c
334 Holt Sr High School conventional Holt Suburb: Large 99.4 43.7 c
335 Everett High School conventional Lansing city: Midsize 99.4 43.5 c
336 Perry High School conventional perry town: Fringe 99.4 43.3 c
337 Goodrich High School conventional Goodrich rural: Fringe 99.3 43.1 c
338 Fremont High School conventional Fremont town: Distant 99.3 43.0 c
339 Romulus Sr High School conventional romulus Suburb: Large 99.2 42.8 c
340 Bridgman High School conventional Bridgman rural: Fringe 99.2 42.6 c
341 Stevenson High School conventional Livonia city: Small 99.2 42.5 c
342 Whitmore Lake High School conventional Whitmore Lake rural: Fringe 99.2 42.3 c
343 Ross Beatty High School conventional cassopolis rural: Distant 99.2 42.1 c
344 Lakeview High School conventional Lakeview (Montcalm) rural: Distant 99.2 42.0 c
345 McBain High School conventional McBain rural Agricultural rural: Distant 99.2 41.8 c
346 Eisenhower High School conventional Utica Suburb: Large 99.2 41.6 c
347 Algonac High School conventional Algonac Suburb: Large 99.2 41.5 c
348 Thornapple Kellogg High School conventional thornapple kellogg rural: Fringe 99.1 41.3 c
349 Plainwell High School conventional plainwell rural: Fringe 99.1 41.1 c
350 Shepherd High School conventional Shepherd rural: Distant 99.1 40.9 c
351 Walled Lake Western High School conventional Walled Lake Suburb: Large 99.0 40.8 c
352 Hartland High School conventional Hartland Suburb: Large 99.0 40.6 c
The Michigan Public High School CAP Report Card: Ranked By Score
Rank High School School Type District or Municipality LocaleOverall CAP Values
Score percent rank Grade
353 Flushing High School conventional Flushing Suburb: Large 99.0 40.4 c
354 Reeths-Puffer High School conventional reeths-puffer Suburb: Midsize 98.9 40.3 c
355 Farmington High School conventional Farmington Suburb: Large 98.9 40.1 c
356 Baraga Area High School conventional Baraga rural: remote 98.9 39.9 c
357 Clio Area High School conventional clio Suburb: Large 98.9 39.8 c
358 River Valley High School conventional river Valley rural: Distant 98.9 39.6 c
359 Michigan Health Academy charter Detroit city: Large 98.9 39.4 c
360 North Branch High School conventional north Branch rural: Distant 98.9 39.3 c
361 Zeeland East High School conventional Zeeland rural: Fringe 98.9 39.1 c
362 Lakewood High School conventional Lakewood rural: Fringe 98.8 38.9 c
363 St. Louis High School conventional St. Louis town: Distant 98.8 38.7 c
364 Academy for Business and Technology High School charter Melvindale Suburb: Large 98.8 38.6 c
365 Madison High School conventional Madison (oakland) Suburb: Large 98.8 38.4 c
366 Westwood High School conventional n.i.c.e. town: remote 98.8 38.2 c
367 Hastings High School conventional Hastings rural: Fringe 98.8 38.1 c
368 Carrollton High School conventional carrollton Suburb: Midsize 98.7 37.9 c
369 Brandon High School conventional Brandon rural: Fringe 98.7 37.7 c
370 Orchard View High School conventional orchard View rural: Fringe 98.7 37.6 c
371 Capac High School conventional capac rural: Distant 98.6 37.4 c
372 Reese High School conventional reese rural: Distant 98.6 37.2 c
373 Freeland Middle School/High School conventional Freeland rural: Fringe 98.6 37.1 c
374 Maple Valley Jr/Sr High School conventional Maple Valley rural: Distant 98.5 36.9 c
375 Bentley Sr High School conventional Bentley Suburb: Large 98.5 36.7 c
376 Unionville-Sebewaing High School conventional Unionville-Sebewaing rural: Distant 98.5 36.5 c
377 Olivet High School conventional olivet rural: Distant 98.5 36.4 c
378 Henry Ford II High School conventional Utica Suburb: Large 98.4 36.2 c
379 Athens High School conventional Athens rural: Distant 98.4 36.0 c
380 Bronson Jr/Sr High School conventional Bronson rural: Distant 98.3 35.9 c
381 Riverview Community High School conventional riverview Suburb: Large 98.3 35.7 c
382 Ida High School conventional ida rural: Fringe 98.3 35.5 c
383 Mason High School conventional Mason (ingham) rural: Fringe 98.2 35.4 c
384 Camden-Frontier High School† conventional camden-Frontier rural: remote 98.1 35.2 c
385 Ravenna High School conventional ravenna rural: Distant 98.1 35.0 c
386 LaSalle High School conventional St. ignace town: remote 98.0 34.9 c
387 Marshall High School conventional Marshall town: Fringe 98.0 34.7 c
388 Oakridge High School conventional oakridge Suburb: Midsize 97.9 34.5 c
389 Breckenridge High School conventional Breckenridge rural: Distant 97.9 34.3 c
390 Waterford Kettering High School conventional Waterford Suburb: Large 97.9 34.2 c
391 Leslie High School conventional Leslie rural: Distant 97.9 34.0 c
392 Peck Jr/Sr High School conventional peck rural: Distant 97.9 33.8 c
393 Communication and Media Arts High School conventional Detroit city: Large 97.8 33.7 c
394 Stockbridge High School conventional Stockbridge rural: Distant 97.8 33.5 c
395 Port Huron High School conventional port Huron Suburb: Small 97.8 33.3 c
396 Grand Traverse Academy† charter traverse city rural: Fringe 97.8 33.2 c
397 Charlotte Sr High School conventional charlotte town: Distant 97.7 33.0 c
Mackinac Center for Public Policy
The Michigan Public High School Context and Performance Report Card 43

* Indicates not enough data were publicly available to include the school in the model.† Denotes schools that have less than four years of data publicly available, but still have enough publicly available data to be included in the model. ‡ As noted in Appendix E, several schools were erroneously listed in government tables as general education high schools and thus were originally included in the model. The subsequent removal of these schools from our graphics means that the percent rank of the school with the lowest CAP Score is not zero.
The Michigan Public High School CAP Report Card: Ranked By Score
Rank High School School Type District or Municipality LocaleOverall CAP Values
Score percent rank Grade
398 Bellaire Middle/High School conventional Bellaire rural: remote 97.7 32.8 c
399 Corunna High School conventional corunna town: Distant 97.7 32.7 c
400 AGBU Alex-Marie Manoogian School† charter Southfield city: Small 97.7 32.5 c
401 Vandercook Lake High School conventional Vandercook Lake Suburb: Small 97.6 32.3 c
402 Grand Ledge High School conventional Grand Ledge Suburb: Large 97.6 32.1 c
403 Fowler High School conventional Fowler rural: Distant 97.6 32.0 c
404 Swan Valley High School conventional Swan Valley Suburb: Midsize 97.5 31.8 c
405 Buchanan High School conventional Buchanan Suburb: Large 97.5 31.6 c
406 Napoleon High School conventional napoleon rural: Fringe 97.5 31.5 c
407 Marine City High School conventional east china Suburb: Small 97.4 31.3 c
408 Southwestern Academy conventional Flint city: Midsize 97.4 31.1 c
409 Portland High School conventional portland town: Distant 97.3 31.0 c
410 Addison Jr/Sr High School conventional Addison rural: Distant 97.3 30.8 c
411 Lee M. Thurston High School conventional South redford Suburb: Large 97.2 30.6 c
412 Roosevelt High School conventional Wyandotte city Suburb: Large 97.2 30.5 c
413 Warren Woods Tower High School conventional Warren Woods city: Midsize 97.2 30.3 c
414 Menominee High School conventional Menominee town: remote 97.2 30.1 c
415 Atherton High School conventional Atherton Suburb: Large 97.1 29.9 c
416 J.W. Sexton High School conventional Lansing city: Midsize 97.1 29.8 D
417 Lakeland High School conventional Huron Valley Suburb: Large 97.1 29.6 D
418 Lapeer West Sr High School conventional Lapeer town: Distant 97.0 29.4 D
419 Schoolcraft High School conventional Schoolcraft Suburb: Midsize 97.0 29.3 D
420 Waterford Mott High School conventional Waterford Suburb: Large 96.9 29.1 D
421 Clarenceville High School conventional clarenceville city: Small 96.9 28.9 D
422 Tri County Sr High School conventional tri county rural: Distant 96.9 28.8 D
423 Ontonagon Area Jr/Sr High School conventional ontonagon rural: remote 96.9 28.6 D
424 Voyageur Consortium High School charter Detroit city: Large 96.8 28.4 D
425 Bay City Western High School conventional Bay city town: Distant 96.8 28.3 D
426 Reading High School conventional reading rural: Distant 96.8 28.1 D
427 Flat Rock Community High School conventional Flat rock Suburb: Large 96.7 27.9 D
428 Howell High School conventional Howell Suburb: Midsize 96.7 27.7 D
429 Franklin High School conventional Livonia city: Small 96.7 27.6 D
430 Quincy High School conventional Quincy rural: Distant 96.7 27.4 D
431 Byron Area High School conventional Byron rural: Distant 96.7 27.2 D
432 Ypsilanti High School conventional Ypsilanti Suburb: Large 96.7 27.1 D
433 Birch Run High School conventional Birch run rural: Fringe 96.6 26.9 D
434 Hazel Park High School conventional Hazel park Suburb: Large 96.6 26.7 D
435 Romeo High School conventional romeo Suburb: Large 96.5 26.6 D
436 Chesaning Union High School conventional chesaning Union rural: Distant 96.4 26.4 D
437 Warren Mott High School conventional Warren city: Midsize 96.4 26.2 D
438 Stephenson High School conventional Stephenson rural: remote 96.4 26.1 D
439 Redford Union High School conventional redford Union Suburb: Large 96.3 25.9 D
440 Concord High School conventional concord rural: Fringe 96.2 25.7 D
441 Clinton High School conventional clinton rural: Distant 96.2 25.5 D
442 Oxford High School conventional oxford rural: Fringe 96.2 25.4 D
Mackinac Center for Public Policy
The Michigan Public High School Context and Performance Report Card 44

* Indicates not enough data were publicly available to include the school in the model.† Denotes schools that have less than four years of data publicly available, but still have enough publicly available data to be included in the model. ‡ As noted in Appendix E, several schools were erroneously listed in government tables as general education high schools and thus were originally included in the model. The subsequent removal of these schools from our graphics means that the percent rank of the school with the lowest CAP Score is not zero.
The Michigan Public High School CAP Report Card: Ranked By Score
Rank High School School Type District or Municipality LocaleOverall CAP Values
Score percent rank Grade
443 Memphis High School conventional Memphis rural: Distant 96.1 25.2 D
444 John Glenn High School conventional Wayne-Westland Suburb: Large 96.1 25.0 D
445 Hanover-Horton High School conventional Hanover-Horton rural: Distant 96.1 24.9 D
446 Ovid-Elsie High School conventional ovid-elsie rural: Distant 96.0 24.7 D
447 Lakeview High School conventional Lakeview (calhoun) city: Small 96.0 24.5 D
448 Lake Fenton High School conventional Lake Fenton rural: Fringe 95.9 24.4 D
449 Beaverton High School conventional Beaverton rural rural: Distant 95.9 24.2 D
450 St. Charles Community High School conventional St. charles rural: Distant 95.8 24.0 D
451 East Jackson High School conventional east Jackson rural: Fringe 95.8 23.9 D
452 Southgate Anderson High School conventional Southgate Suburb: Large 95.8 23.7 D
453 Hamady Community High School conventional Westwood Heights Suburb: Large 95.8 23.5 D
454 Willow Run High School conventional Willow run Suburb: Large 95.7 23.4 D
455 Mason Sr High School conventional Mason (Monroe) rural: Fringe 95.7 23.2 D
456 Allen Park High School conventional Allen park Suburb: Large 95.7 23.0 D
457 Detroit School of Arts conventional Detroit city: Large 95.7 22.8 D
458 Laingsburg High School conventional Laingsburg rural: Distant 95.6 22.7 D
459 Tecumseh High School conventional tecumseh town: Distant 95.6 22.5 D
460 Fowlerville High School conventional Fowlerville town: Fringe 95.5 22.3 D
461 Adlai Stevenson High School conventional Utica Suburb: Large 95.5 22.2 D
462 Lake Shore High School conventional Lake Shore (Macomb) Suburb: Large 95.5 22.0 D
463 L'Anse Creuse High School conventional L'Anse creuse Suburb: Large 95.5 21.8 D
464 Bedford Sr High School conventional Bedford Suburb: Large 95.4 21.7 D
465 Dansville High School conventional Dansville rural: Distant 95.4 21.5 D
466 Hudson Area High School conventional Hudson rural: Distant 95.4 21.3 D
467 Pinckney Community High School conventional pinckney Suburb: Midsize 95.4 21.2 D
468 Coldwater High School conventional coldwater town: Distant 95.3 21.0 D
469 St. Johns High School conventional St. Johns rural: Fringe 95.3 20.8 D
470 Fraser High School conventional Fraser Suburb: Large 95.3 20.6 D
471 Carson City-Crystal High School conventional carson city-crystal town: Distant 95.2 20.5 D
472 Huron High School conventional Huron rural: Fringe 95.2 20.3 D
473 LakeVille High School conventional LakeVille rural: Distant 95.2 20.1 D
474 Union City High School conventional Union city rural: Distant 95.1 20.0 D
475 Allen Academy charter Detroit city: Large 95.1 19.8 D
476 Brandywine Sr High School conventional Brandywine Suburb: Large 95.0 19.6 D
477 Harrison High School conventional Farmington city: Small 95.0 19.5 D
478 Wayland High School conventional Wayland Union town: Distant 95.0 19.3 D
479 Trenton High School conventional trenton Suburb: Large 95.0 19.1 D
480 Eau Claire High School conventional eau claire rural: Fringe 95.0 19.0 D
481 Lincoln High School conventional Van Dyke city: Midsize 95.0 18.8 D
482 Pittsford Area High School conventional pittsford rural: Distant 95.0 18.6 D
483 Hemlock High School conventional Hemlock rural: Fringe 94.9 18.4 D
484 Clawson High School conventional clawson Suburb: Large 94.9 18.3 D
485 L'Anse High School conventional L'Anse rural: remote 94.9 18.1 D
486 Durand Area High School conventional Durand town: Fringe 94.9 17.9 D
487 Oscar A. Carlson High School conventional Gibraltar Suburb: Large 94.7 17.8 D
488 Bath High School conventional Bath rural: Fringe 94.7 17.6 D
Mackinac Center for Public Policy
The Michigan Public High School Context and Performance Report Card 45

* Indicates not enough data were publicly available to include the school in the model.† Denotes schools that have less than four years of data publicly available, but still have enough publicly available data to be included in the model. ‡ As noted in Appendix E, several schools were erroneously listed in government tables as general education high schools and thus were originally included in the model. The subsequent removal of these schools from our graphics means that the percent rank of the school with the lowest CAP Score is not zero.
The Michigan Public High School CAP Report Card: Ranked By Score
Rank High School School Type District or Municipality LocaleOverall CAP Values
Score percent rank Grade
489 Anchor Bay High School conventional Anchor Bay rural: Fringe 94.7 17.4 D
490 Utica High School conventional Utica Suburb: Large 94.6 17.3 D
491 Garden City High School conventional Garden city Suburb: Large 94.6 17.1 D
492 Kingston High School conventional kingston rural: remote 94.5 16.9 D
493 Pickford High School† conventional pickford rural: Distant 94.4 16.8 D
494 Michigan Center Jr/Sr High School conventional Michigan center Suburb: Small 94.4 16.6 D
495 Benton Harbor High School conventional Benton Harbor city: Small 94.2 16.4 D
496 Dundee Community High School conventional Dundee town: Distant 94.2 16.2 D
497 Dryden High School conventional Dryden rural: Distant 94.1 16.1 D
498 Merrill High School conventional Merrill rural: Distant 94.1 15.9 D
499 Swartz Creek High School conventional Swartz creek Suburb: Large 94.0 15.7 D
500 Monroe High School conventional Monroe Suburb: Small 94.0 15.6 D
501 Tri-Township School† conventional rapid river rural: Distant 94.0 15.4 D
502 Woodhaven High School conventional Woodhaven-Brownstown Suburb: Large 93.9 15.2 D
503 Marion High School conventional Marion rural: remote 93.9 15.1 D
504 East Detroit High School conventional east Detroit Suburb: Large 93.8 14.9 D
505 Northwest High School conventional northwest rural: Fringe 93.8 14.7 D
506 Webberville High School conventional Webberville town: Fringe 93.8 14.6 D
507 King High School conventional Detroit city: Large 93.8 14.4 D
508 Onsted Community High School conventional onsted rural: Distant 93.8 14.2 D
509 Sand Creek High School conventional Sand creek rural: Distant 93.7 14.0 D
510 L'Anse Creuse High School-North conventional L'Anse creuse Suburb: Large 93.7 13.9 D
511 Old Redford Academy High charter Detroit city: Large 93.7 13.7 D
512 Cousino Sr High School conventional Warren city: Midsize 93.7 13.5 D
513 Douglass Academy for Young Men conventional Detroit city: Large 93.6 13.4 D
514 Harper Woods High School conventional Harper Woods Suburb: Large 93.6 13.2 D
515 North Adams High School† conventional north Adams-Jerome rural: Distant 93.6 13.0 D
516 South Lake High School conventional South Lake Suburb: Large 93.5 12.9 D
517 Coloma High School conventional coloma town: Fringe 93.4 12.7 D
518 Detroit Midtown Academy charter Detroit city: Large 93.4 12.5 D
519 Almont High School conventional Almont rural: Fringe 93.3 12.4 D
520 Clintondale High School conventional clintondale Suburb: Large 93.3 12.2 D
521 John F. Kennedy High School conventional taylor city: Small 93.1 12.0 D
522 Genesee High School conventional Genesee Suburb: Large 92.9 11.8 D
523 Waverly Sr High School conventional Waverly Suburb: Large 92.8 11.7 D
524 Crockett High School conventional Detroit city: Large 92.7 11.5 D
525 Lamphere High School conventional Lamphere Suburb: Large 92.7 11.3 D
526 Grant High School conventional Grant rural: Distant 92.7 11.2 D
527 Climax-Scotts High School conventional climax-Scotts rural: Fringe 92.6 11.0 D
528 Chippewa Valley High School conventional chippewa Valley Suburb: Large 92.6 10.8 D
529 Milan High School conventional Milan rural: Fringe 92.6 10.7 D
530 River Rouge High School conventional river rouge Suburb: Large 92.2 10.5 D
531 Beecher High School conventional Beecher Suburb: Large 92.1 10.3 D
532 Detroit International Academy for Young Women† conventional Detroit city: Large 91.9 10.2 D
533 Truman High School conventional taylor city: Small 91.8 10.0 D
Mackinac Center for Public Policy
The Michigan Public High School Context and Performance Report Card 46
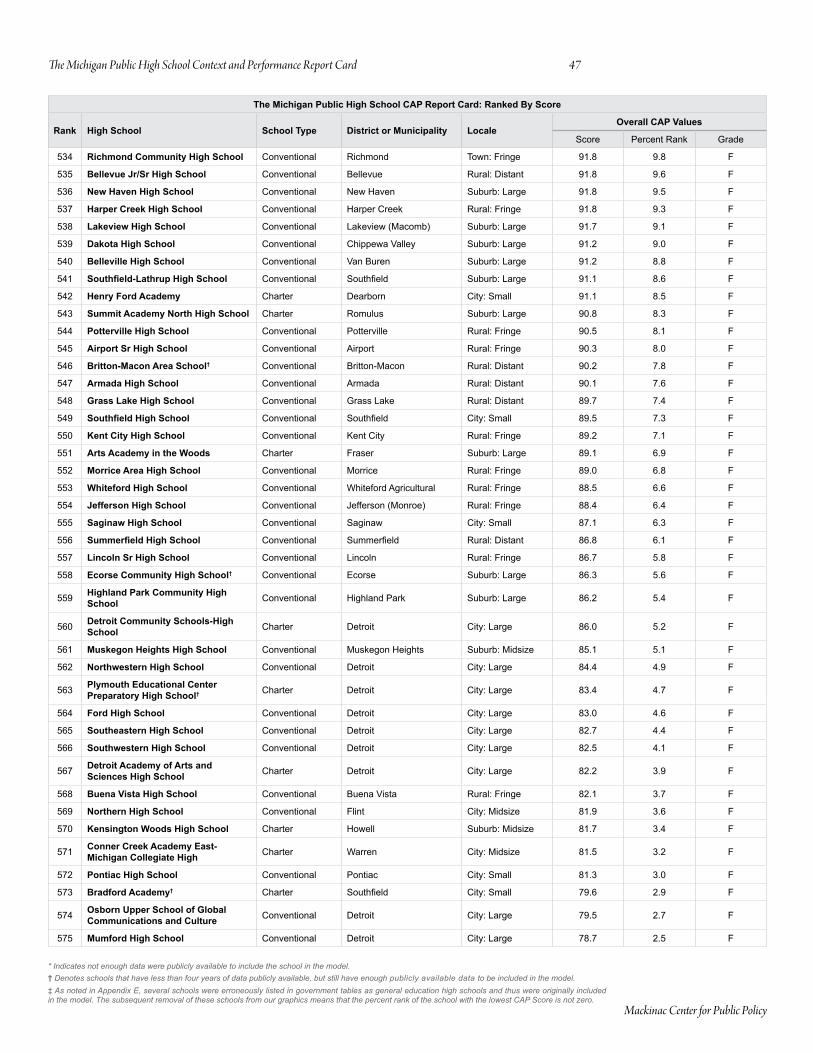
* Indicates not enough data were publicly available to include the school in the model.† Denotes schools that have less than four years of data publicly available, but still have enough publicly available data to be included in the model. ‡ As noted in Appendix E, several schools were erroneously listed in government tables as general education high schools and thus were originally included in the model. The subsequent removal of these schools from our graphics means that the percent rank of the school with the lowest CAP Score is not zero.
The Michigan Public High School CAP Report Card: Ranked By Score
Rank High School School Type District or Municipality LocaleOverall CAP Values
Score percent rank Grade
489 Anchor Bay High School conventional Anchor Bay rural: Fringe 94.7 17.4 D
490 Utica High School conventional Utica Suburb: Large 94.6 17.3 D
491 Garden City High School conventional Garden city Suburb: Large 94.6 17.1 D
492 Kingston High School conventional kingston rural: remote 94.5 16.9 D
493 Pickford High School† conventional pickford rural: Distant 94.4 16.8 D
494 Michigan Center Jr/Sr High School conventional Michigan center Suburb: Small 94.4 16.6 D
495 Benton Harbor High School conventional Benton Harbor city: Small 94.2 16.4 D
496 Dundee Community High School conventional Dundee town: Distant 94.2 16.2 D
497 Dryden High School conventional Dryden rural: Distant 94.1 16.1 D
498 Merrill High School conventional Merrill rural: Distant 94.1 15.9 D
499 Swartz Creek High School conventional Swartz creek Suburb: Large 94.0 15.7 D
500 Monroe High School conventional Monroe Suburb: Small 94.0 15.6 D
501 Tri-Township School† conventional rapid river rural: Distant 94.0 15.4 D
502 Woodhaven High School conventional Woodhaven-Brownstown Suburb: Large 93.9 15.2 D
503 Marion High School conventional Marion rural: remote 93.9 15.1 D
504 East Detroit High School conventional east Detroit Suburb: Large 93.8 14.9 D
505 Northwest High School conventional northwest rural: Fringe 93.8 14.7 D
506 Webberville High School conventional Webberville town: Fringe 93.8 14.6 D
507 King High School conventional Detroit city: Large 93.8 14.4 D
508 Onsted Community High School conventional onsted rural: Distant 93.8 14.2 D
509 Sand Creek High School conventional Sand creek rural: Distant 93.7 14.0 D
510 L'Anse Creuse High School-North conventional L'Anse creuse Suburb: Large 93.7 13.9 D
511 Old Redford Academy High charter Detroit city: Large 93.7 13.7 D
512 Cousino Sr High School conventional Warren city: Midsize 93.7 13.5 D
513 Douglass Academy for Young Men conventional Detroit city: Large 93.6 13.4 D
514 Harper Woods High School conventional Harper Woods Suburb: Large 93.6 13.2 D
515 North Adams High School† conventional north Adams-Jerome rural: Distant 93.6 13.0 D
516 South Lake High School conventional South Lake Suburb: Large 93.5 12.9 D
517 Coloma High School conventional coloma town: Fringe 93.4 12.7 D
518 Detroit Midtown Academy charter Detroit city: Large 93.4 12.5 D
519 Almont High School conventional Almont rural: Fringe 93.3 12.4 D
520 Clintondale High School conventional clintondale Suburb: Large 93.3 12.2 D
521 John F. Kennedy High School conventional taylor city: Small 93.1 12.0 D
522 Genesee High School conventional Genesee Suburb: Large 92.9 11.8 D
523 Waverly Sr High School conventional Waverly Suburb: Large 92.8 11.7 D
524 Crockett High School conventional Detroit city: Large 92.7 11.5 D
525 Lamphere High School conventional Lamphere Suburb: Large 92.7 11.3 D
526 Grant High School conventional Grant rural: Distant 92.7 11.2 D
527 Climax-Scotts High School conventional climax-Scotts rural: Fringe 92.6 11.0 D
528 Chippewa Valley High School conventional chippewa Valley Suburb: Large 92.6 10.8 D
529 Milan High School conventional Milan rural: Fringe 92.6 10.7 D
530 River Rouge High School conventional river rouge Suburb: Large 92.2 10.5 D
531 Beecher High School conventional Beecher Suburb: Large 92.1 10.3 D
532 Detroit International Academy for Young Women† conventional Detroit city: Large 91.9 10.2 D
533 Truman High School conventional taylor city: Small 91.8 10.0 D
The Michigan Public High School CAP Report Card: Ranked By Score
Rank High School School Type District or Municipality LocaleOverall CAP Values
Score percent rank Grade
534 Richmond Community High School conventional richmond town: Fringe 91.8 9.8 F
535 Bellevue Jr/Sr High School conventional Bellevue rural: Distant 91.8 9.6 F
536 New Haven High School conventional new Haven Suburb: Large 91.8 9.5 F
537 Harper Creek High School conventional Harper creek rural: Fringe 91.8 9.3 F
538 Lakeview High School conventional Lakeview (Macomb) Suburb: Large 91.7 9.1 F
539 Dakota High School conventional chippewa Valley Suburb: Large 91.2 9.0 F
540 Belleville High School conventional Van Buren Suburb: Large 91.2 8.8 F
541 Southfield-Lathrup High School conventional Southfield Suburb: Large 91.1 8.6 F
542 Henry Ford Academy charter Dearborn city: Small 91.1 8.5 F
543 Summit Academy North High School charter romulus Suburb: Large 90.8 8.3 F
544 Potterville High School conventional potterville rural: Fringe 90.5 8.1 F
545 Airport Sr High School conventional Airport rural: Fringe 90.3 8.0 F
546 Britton-Macon Area School† conventional Britton-Macon rural: Distant 90.2 7.8 F
547 Armada High School conventional Armada rural: Distant 90.1 7.6 F
548 Grass Lake High School conventional Grass Lake rural: Distant 89.7 7.4 F
549 Southfield High School conventional Southfield city: Small 89.5 7.3 F
550 Kent City High School conventional kent city rural: Fringe 89.2 7.1 F
551 Arts Academy in the Woods charter Fraser Suburb: Large 89.1 6.9 F
552 Morrice Area High School conventional Morrice rural: Fringe 89.0 6.8 F
553 Whiteford High School conventional Whiteford Agricultural rural: Fringe 88.5 6.6 F
554 Jefferson High School conventional Jefferson (Monroe) rural: Fringe 88.4 6.4 F
555 Saginaw High School conventional Saginaw city: Small 87.1 6.3 F
556 Summerfield High School conventional Summerfield rural: Distant 86.8 6.1 F
557 Lincoln Sr High School conventional Lincoln rural: Fringe 86.7 5.8 F
558 Ecorse Community High School† conventional ecorse Suburb: Large 86.3 5.6 F
559 Highland Park Community High School conventional Highland park Suburb: Large 86.2 5.4 F
560 Detroit Community Schools-High School charter Detroit city: Large 86.0 5.2 F
561 Muskegon Heights High School conventional Muskegon Heights Suburb: Midsize 85.1 5.1 F
562 Northwestern High School conventional Detroit city: Large 84.4 4.9 F
563 Plymouth Educational Center Preparatory High School† charter Detroit city: Large 83.4 4.7 F
564 Ford High School conventional Detroit city: Large 83.0 4.6 F
565 Southeastern High School conventional Detroit city: Large 82.7 4.4 F
566 Southwestern High School conventional Detroit city: Large 82.5 4.1 F
567 Detroit Academy of Arts and Sciences High School charter Detroit city: Large 82.2 3.9 F
568 Buena Vista High School conventional Buena Vista rural: Fringe 82.1 3.7 F
569 Northern High School conventional Flint city: Midsize 81.9 3.6 F
570 Kensington Woods High School charter Howell Suburb: Midsize 81.7 3.4 F
571 Conner Creek Academy East-Michigan Collegiate High charter Warren city: Midsize 81.5 3.2 F
572 Pontiac High School conventional pontiac city: Small 81.3 3.0 F
573 Bradford Academy† charter Southfield city: Small 79.6 2.9 F
574 Osborn Upper School of Global Communications and Culture conventional Detroit city: Large 79.5 2.7 F
575 Mumford High School conventional Detroit city: Large 78.7 2.5 F
Mackinac Center for Public Policy
The Michigan Public High School Context and Performance Report Card 47

* Indicates not enough data were publicly available to include the school in the model.† Denotes schools that have less than four years of data publicly available, but still have enough publicly available data to be included in the model. ‡ As noted in Appendix E, several schools were erroneously listed in government tables as general education high schools and thus were originally included in the model. The subsequent removal of these schools from our graphics means that the percent rank of the school with the lowest CAP Score is not zero.
The Michigan Public High School CAP Report Card: Ranked By Score
Rank High School School Type District or Municipality LocaleOverall CAP Values
Score percent rank Grade
576 Central High School conventional Detroit city: Large 78.3 2.4 F
577 Northwestern High School conventional Flint city: Midsize 77.7 2.2 F
578 Kettering High School conventional Detroit city: Large 77.3 2.0 F
579 Creative Technologies Academy† charter cedar Springs town: Fringe 77.2 1.9 F
580 Pershing High School conventional Detroit city: Large 77.0 1.7 F
581 Cody College Preparatory Upper School of Teaching and Learning conventional Detroit city: Large 75.5 1.5 F
582 Denby High School conventional Detroit city: Large 75.1 1.4 F
583 Dream Academy† charter Benton Harbor city: Small 74.4 1.2 F
584 Detroit City High School† conventional Detroit city: Large 73.4 1.0 F
585 Finney High School conventional Detroit city: Large 70.8 0.7‡ F
Mackinac Center for Public Policy
The Michigan Public High School Context and Performance Report Card 48
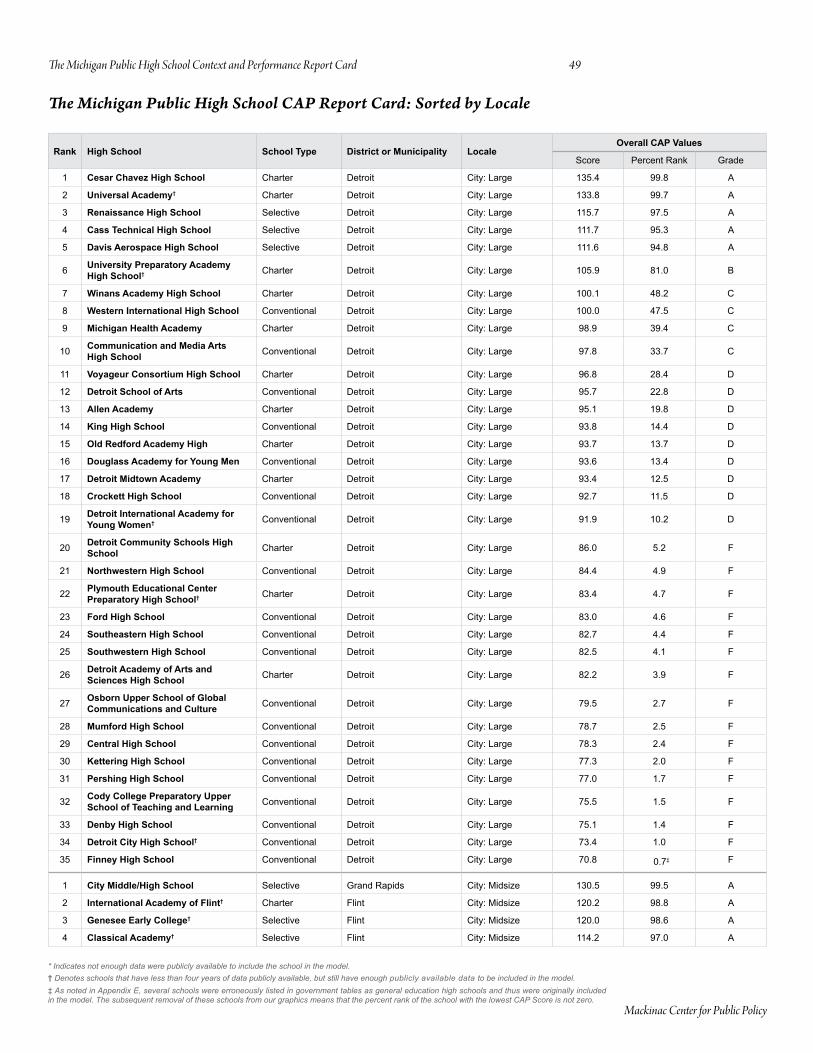
* Indicates not enough data were publicly available to include the school in the model.† Denotes schools that have less than four years of data publicly available, but still have enough publicly available data to be included in the model. ‡ As noted in Appendix E, several schools were erroneously listed in government tables as general education high schools and thus were originally included in the model. The subsequent removal of these schools from our graphics means that the percent rank of the school with the lowest CAP Score is not zero.
The Michigan Public High School CAP Report Card: Sorted by Locale
Rank High School School Type District or Municipality LocaleOverall CAP Values
Score percent rank Grade
1 Cesar Chavez High School charter Detroit city: Large 135.4 99.8 A
2 Universal Academy† charter Detroit city: Large 133.8 99.7 A
3 Renaissance High School Selective Detroit city: Large 115.7 97.5 A
4 Cass Technical High School Selective Detroit city: Large 111.7 95.3 A
5 Davis Aerospace High School Selective Detroit city: Large 111.6 94.8 A
6 University Preparatory Academy High School† charter Detroit city: Large 105.9 81.0 B
7 Winans Academy High School charter Detroit city: Large 100.1 48.2 c
8 Western International High School conventional Detroit city: Large 100.0 47.5 c
9 Michigan Health Academy charter Detroit city: Large 98.9 39.4 c
10 Communication and Media Arts High School conventional Detroit city: Large 97.8 33.7 c
11 Voyageur Consortium High School charter Detroit city: Large 96.8 28.4 D
12 Detroit School of Arts conventional Detroit city: Large 95.7 22.8 D
13 Allen Academy charter Detroit city: Large 95.1 19.8 D
14 King High School conventional Detroit city: Large 93.8 14.4 D
15 Old Redford Academy High charter Detroit city: Large 93.7 13.7 D
16 Douglass Academy for Young Men conventional Detroit city: Large 93.6 13.4 D
17 Detroit Midtown Academy charter Detroit city: Large 93.4 12.5 D
18 Crockett High School conventional Detroit city: Large 92.7 11.5 D
19 Detroit International Academy for Young Women† conventional Detroit city: Large 91.9 10.2 D
20 Detroit Community Schools High School charter Detroit city: Large 86.0 5.2 F
21 Northwestern High School conventional Detroit city: Large 84.4 4.9 F
22 Plymouth Educational Center Preparatory High School† charter Detroit city: Large 83.4 4.7 F
23 Ford High School conventional Detroit city: Large 83.0 4.6 F
24 Southeastern High School conventional Detroit city: Large 82.7 4.4 F
25 Southwestern High School conventional Detroit city: Large 82.5 4.1 F
26 Detroit Academy of Arts and Sciences High School charter Detroit city: Large 82.2 3.9 F
27 Osborn Upper School of Global Communications and Culture conventional Detroit city: Large 79.5 2.7 F
28 Mumford High School conventional Detroit city: Large 78.7 2.5 F
29 Central High School conventional Detroit city: Large 78.3 2.4 F
30 Kettering High School conventional Detroit city: Large 77.3 2.0 F
31 Pershing High School conventional Detroit city: Large 77.0 1.7 F
32 Cody College Preparatory Upper School of Teaching and Learning conventional Detroit city: Large 75.5 1.5 F
33 Denby High School conventional Detroit city: Large 75.1 1.4 F
34 Detroit City High School† conventional Detroit city: Large 73.4 1.0 F
35 Finney High School conventional Detroit city: Large 70.8 0.7‡ F
1 City Middle/High School Selective Grand rapids city: Midsize 130.5 99.5 A
2 International Academy of Flint† charter Flint city: Midsize 120.2 98.8 A
3 Genesee Early College† Selective Flint city: Midsize 120.0 98.6 A
4 Classical Academy† Selective Flint city: Midsize 114.2 97.0 A
The Michigan Public High School CAP Report Card: Sorted by Locale
Mackinac Center for Public Policy
The Michigan Public High School Context and Performance Report Card 49

* Indicates not enough data were publicly available to include the school in the model.† Denotes schools that have less than four years of data publicly available, but still have enough publicly available data to be included in the model. ‡ As noted in Appendix E, several schools were erroneously listed in government tables as general education high schools and thus were originally included in the model. The subsequent removal of these schools from our graphics means that the percent rank of the school with the lowest CAP Score is not zero.
The Michigan Public High School CAP Report Card: Sorted by Locale
Rank High School School Type District or Municipality LocaleOverall CAP Values
Score percent rank Grade
5 Huron High School conventional Ann Arbor city: Midsize 111.6 94.9 A
6 Pioneer High School conventional Ann Arbor city: Midsize 110.3 92.9 A
7 Creston High School conventional Grand rapids city: Midsize 110.1 92.7 A
8 Mott Middle College High School† Selective Flint city: Midsize 109.8 92.2 A
9 Central High School conventional Grand rapids city: Midsize 108.7 89.5 B
10 Ottawa Hills High School conventional Grand rapids city: Midsize 108.6 89.3 B
11 Eastern High School conventional Lansing city: Midsize 102.3 62.4 c
12 Fitzgerald Sr High School conventional Fitzgerald city: Midsize 102.0 60.2 c
13 Everett High School conventional Lansing city: Midsize 99.4 43.5 c
14 Southwestern Academy conventional Flint city: Midsize 97.4 31.1 c
15 Warren Woods Tower High School conventional Warren Woods city: Midsize 97.2 30.3 c
16 J.W. Sexton High School conventional Lansing city: Midsize 97.1 29.8 D
17 Warren Mott High School conventional Warren city: Midsize 96.4 26.2 D
18 Lincoln High School conventional Van Dyke city: Midsize 95.0 18.8 D
19 Cousino Sr High School conventional Warren city: Midsize 93.7 13.5 D
20 Northern High School conventional Flint city: Midsize 81.9 3.6 F
21 Conner Creek Academy East-Michigan Collegiate High charter Warren city: Midsize 81.5 3.2 F
22 Northwestern High School conventional Flint city: Midsize 77.7 2.2 F
1 Saginaw Arts and Sciences Academy Selective Saginaw city: Small 119.7 98.5 A
2 Riverside Academy-West Campus† charter Dearborn city: Small 118.0 98.3 A
3 Lee High School conventional Godfrey-Lee city: Small 116.7 98.0 A
4 Kelloggsville High School conventional kelloggsville city: Small 114.8 97.1 A
5 Holland High School conventional Holland city: Small 114.1 96.6 A
6 Muskegon High School conventional Muskegon city: Small 113.5 95.9 A
7 Troy High School conventional troy city: Small 110.1 92.6 A
8 Fordson High School conventional Dearborn city: Small 109.7 91.9 A
9 Loy Norrix High School conventional kalamazoo city: Small 108.9 90.0 A
10 East Lansing High School conventional east Lansing city: Small 108.5 88.8 B
11 Pontiac Academy for Excellence High School charter pontiac city: Small 108.3 88.5 B
12 Godwin Heights Sr High School conventional Godwin Heights city: Small 108.2 88.0 B
13 Black River Public School charter Holland city: Small 107.3 86.0 B
14 Edsel Ford High School conventional Dearborn city: Small 106.1 82.6 B
15 University High School Academy† Selective Southfield city: Small 106.1 81.9 B
16 Rogers High School conventional Wyoming city: Small 106.0 81.4 B
17 Dearborn High School conventional Dearborn city: Small 105.9 80.9 B
18 Mona Shores High School conventional Mona Shores city: Small 105.4 79.2 B
19 Wyoming Park High School conventional Wyoming city: Small 105.4 79.0 B
20 Portage Northern High School conventional portage city: Small 105.4 78.8 B
21 Advanced Technology Academy† charter Dearborn city: Small 105.2 78.3 B
22 Arthur Hill High School conventional Saginaw city: Small 104.7 77.0 B
23 Niles Sr High School conventional niles city: Small 104.3 75.3 B
24 Portage Central High School conventional portage city: Small 103.5 71.7 B
25 Novi High School conventional novi city: Small 103.3 70.6 B
26 Jackson High School conventional Jackson city: Small 103.0 67.5 c
Mackinac Center for Public Policy
The Michigan Public High School Context and Performance Report Card 50

* Indicates not enough data were publicly available to include the school in the model.† Denotes schools that have less than four years of data publicly available, but still have enough publicly available data to be included in the model. ‡ As noted in Appendix E, several schools were erroneously listed in government tables as general education high schools and thus were originally included in the model. The subsequent removal of these schools from our graphics means that the percent rank of the school with the lowest CAP Score is not zero.
The Michigan Public High School CAP Report Card: Sorted by Locale
Rank High School School Type District or Municipality LocaleOverall CAP Values
Score percent rank Grade
5 Huron High School conventional Ann Arbor city: Midsize 111.6 94.9 A
6 Pioneer High School conventional Ann Arbor city: Midsize 110.3 92.9 A
7 Creston High School conventional Grand rapids city: Midsize 110.1 92.7 A
8 Mott Middle College High School† Selective Flint city: Midsize 109.8 92.2 A
9 Central High School conventional Grand rapids city: Midsize 108.7 89.5 B
10 Ottawa Hills High School conventional Grand rapids city: Midsize 108.6 89.3 B
11 Eastern High School conventional Lansing city: Midsize 102.3 62.4 c
12 Fitzgerald Sr High School conventional Fitzgerald city: Midsize 102.0 60.2 c
13 Everett High School conventional Lansing city: Midsize 99.4 43.5 c
14 Southwestern Academy conventional Flint city: Midsize 97.4 31.1 c
15 Warren Woods Tower High School conventional Warren Woods city: Midsize 97.2 30.3 c
16 J.W. Sexton High School conventional Lansing city: Midsize 97.1 29.8 D
17 Warren Mott High School conventional Warren city: Midsize 96.4 26.2 D
18 Lincoln High School conventional Van Dyke city: Midsize 95.0 18.8 D
19 Cousino Sr High School conventional Warren city: Midsize 93.7 13.5 D
20 Northern High School conventional Flint city: Midsize 81.9 3.6 F
21 Conner Creek Academy East-Michigan Collegiate High charter Warren city: Midsize 81.5 3.2 F
22 Northwestern High School conventional Flint city: Midsize 77.7 2.2 F
1 Saginaw Arts and Sciences Academy Selective Saginaw city: Small 119.7 98.5 A
2 Riverside Academy-West Campus† charter Dearborn city: Small 118.0 98.3 A
3 Lee High School conventional Godfrey-Lee city: Small 116.7 98.0 A
4 Kelloggsville High School conventional kelloggsville city: Small 114.8 97.1 A
5 Holland High School conventional Holland city: Small 114.1 96.6 A
6 Muskegon High School conventional Muskegon city: Small 113.5 95.9 A
7 Troy High School conventional troy city: Small 110.1 92.6 A
8 Fordson High School conventional Dearborn city: Small 109.7 91.9 A
9 Loy Norrix High School conventional kalamazoo city: Small 108.9 90.0 A
10 East Lansing High School conventional east Lansing city: Small 108.5 88.8 B
11 Pontiac Academy for Excellence High School charter pontiac city: Small 108.3 88.5 B
12 Godwin Heights Sr High School conventional Godwin Heights city: Small 108.2 88.0 B
13 Black River Public School charter Holland city: Small 107.3 86.0 B
14 Edsel Ford High School conventional Dearborn city: Small 106.1 82.6 B
15 University High School Academy† Selective Southfield city: Small 106.1 81.9 B
16 Rogers High School conventional Wyoming city: Small 106.0 81.4 B
17 Dearborn High School conventional Dearborn city: Small 105.9 80.9 B
18 Mona Shores High School conventional Mona Shores city: Small 105.4 79.2 B
19 Wyoming Park High School conventional Wyoming city: Small 105.4 79.0 B
20 Portage Northern High School conventional portage city: Small 105.4 78.8 B
21 Advanced Technology Academy† charter Dearborn city: Small 105.2 78.3 B
22 Arthur Hill High School conventional Saginaw city: Small 104.7 77.0 B
23 Niles Sr High School conventional niles city: Small 104.3 75.3 B
24 Portage Central High School conventional portage city: Small 103.5 71.7 B
25 Novi High School conventional novi city: Small 103.3 70.6 B
26 Jackson High School conventional Jackson city: Small 103.0 67.5 c
The Michigan Public High School CAP Report Card: Sorted by Locale
Rank High School School Type District or Municipality LocaleOverall CAP Values
Score percent rank Grade
27 Heritage High School conventional Saginaw township city: Small 103.0 66.7 c
28 Athens High School conventional troy city: Small 102.5 64.1 c
29 Bay City Central High School conventional Bay city city: Small 101.4 56.9 c
30 North Farmington High School conventional Farmington city: Small 101.4 56.5 c
31 Battle Creek Central High School conventional Battle creek city: Small 101.0 53.6 c
32 Churchill High School conventional Livonia city: Small 100.1 48.1 c
33 Stevenson High School conventional Livonia city: Small 99.2 42.5 c
34 AGBU Alex-Marie Manoogian School† charter Southfield city: Small 97.7 32.5 c
35 Clarenceville High School conventional clarenceville city: Small 96.9 28.9 D
36 Franklin High School conventional Livonia city: Small 96.7 27.6 D
37 Lakeview High School conventional Lakeview (calhoun) city: Small 96.0 24.5 D
38 Harrison High School conventional Farmington city: Small 95.0 19.5 D
39 Benton Harbor High School conventional Benton Harbor city: Small 94.2 16.4 D
40 John F. Kennedy High School conventional taylor city: Small 93.1 12.0 D
41 Truman High School conventional taylor city: Small 91.8 10.0 D
42 Henry Ford Academy charter Dearborn city: Small 91.1 8.5 F
43 Southfield High School conventional Southfield city: Small 89.5 7.3 F
44 Saginaw High School conventional Saginaw city: Small 87.1 6.3 F
45 Pontiac High School conventional pontiac city: Small 81.3 3.0 F
46 Bradford Academy† charter Southfield city: Small 79.6 2.9 F
47 Dream Academy† charter Benton Harbor city: Small 74.4 1.2 F
1 Star International Academy charter Dearborn Heights Suburb: Large 140.8 100.0 A
2 International Academy Selective Bloomfield Hills Suburb: Large 127.2 99.3 A
3 Excel Charter Academy-Grand River Prep School† charter kentwood Suburb: Large 123.3 99.2 A
4 Henry Ford Early College† Selective Dearborn Suburb: Large 111.3 94.4 A
5 West Michigan Academy of Environmental Science† charter Grand rapids Suburb: Large 109.4 91.5 A
6 Bendle High School conventional Bendle Suburb: Large 108.6 89.0 B
7 Skyline High School† conventional Ann Arbor Suburb: Large 108.5 88.7 B
8 Grosse Pointe South High School conventional Grosse pointe Suburb: Large 108.2 88.2 B
9 Central High School conventional Forest Hills Suburb: Large 107.9 87.3 B
10 East Grand Rapids High School conventional east Grand rapids Suburb: Large 107.4 86.5 B
11 Frontier International Academy charter Hamtramck Suburb: Large 107.4 86.3 B
12 HEART Academy charter Harper Woods Suburb: Large 107.3 86.1 B
13 Early College Alliance† SelectiveWashtenaw intermediate School District
Suburb: Large 107.1 85.6 B
14 Bloomfield Hills Andover High School conventional Bloomfield Hills Suburb: Large 106.9 84.9 B
15 Northville High School conventional northville Suburb: Large 106.5 84.1 B
16 Northern High School conventional Forest Hills Suburb: Large 106.4 83.8 B
17 Grand Blanc Community High School conventional Grand Blanc Suburb: Large 106.3 83.4 B
18 Rochester Adams High School conventional rochester Suburb: Large 106.3 83.2 B
19 Melvindale High School conventionalMelvindale-north Allen park
Suburb: Large 106.3 82.9 B
20 Crestwood High School conventional crestwood Suburb: Large 106.1 82.2 B
Mackinac Center for Public Policy
The Michigan Public High School Context and Performance Report Card 51

* Indicates not enough data were publicly available to include the school in the model.† Denotes schools that have less than four years of data publicly available, but still have enough publicly available data to be included in the model. ‡ As noted in Appendix E, several schools were erroneously listed in government tables as general education high schools and thus were originally included in the model. The subsequent removal of these schools from our graphics means that the percent rank of the school with the lowest CAP Score is not zero.
The Michigan Public High School CAP Report Card: Sorted by Locale
Rank High School School Type District or Municipality LocaleOverall CAP Values
Score percent rank Grade
21 Ernest W. Seaholm High School conventional Birmingham Suburb: Large 105.9 81.2 B
22 Annapolis High School conventional Dearborn Heights #7 Suburb: Large 105.7 80.0 B
23 Hamtramck High School conventional Hamtramck Suburb: Large 105.7 79.9 B
24 Haslett High School conventional Haslett Suburb: Large 104.8 77.2 B
25 Wayne Memorial High School conventional Wayne-Westland Suburb: Large 104.4 76.3 B
26 Plymouth High School conventional plymouth-canton Suburb: Large 104.0 74.3 B
27 Stoney Creek High School conventional rochester Suburb: Large 103.9 73.4 B
28 Chandler Park Academy High School† charter Harper Woods Suburb: Large 103.9 73.1 B
29 Davison High School conventional Davison Suburb: Large 103.8 72.9 B
30 Washtenaw Technical Middle College charter Ann Arbor Suburb: Large 103.8 72.8 B
31 Center Line High School conventional center Line Suburb: Large 103.7 72.6 B
32 Canton High School conventional plymouth-canton Suburb: Large 103.5 71.6 B
33 Wylie E. Groves High School conventional Birmingham Suburb: Large 103.4 70.7 B
34 Northview High School conventional northview Suburb: Large 103.3 69.7 c
35 Rockford High School conventional rockford Suburb: Large 102.9 66.3 c
36 East Kentwood High School conventional kentwood Suburb: Large 102.9 66.0 c
37 Hudsonville High School conventional Hudsonville Suburb: Large 102.8 65.5 c
38 Rochester High School conventional rochester Suburb: Large 102.8 65.1 c
39 Carman-Ainsworth High School conventional carman-Ainsworth Suburb: Large 102.7 65.0 c
40 Jenison High School conventional Jenison Suburb: Large 102.5 64.0 c
41 Salem High School conventional plymouth-canton Suburb: Large 102.4 63.3 c
42 Kearsley High School conventional kearsley Suburb: Large 102.3 62.9 c
43 Edwardsburg High School conventional edwardsburg Suburb: Large 102.3 62.6 c
44 Royal Oak High School conventional royal oak Suburb: Large 102.2 61.3 c
45 Fenton Sr High School conventional Fenton Suburb: Large 102.2 61.1 c
46 Sterling Heights Sr High School conventional Warren Suburb: Large 102.1 60.9 c
47 Grandville High School conventional Grandville Suburb: Large 102.0 60.1 c
48 Bloomfield Hills Lahser High School conventional Bloomfield Hills Suburb: Large 101.8 59.6 c
49 Grosse Ile High School conventional Grosse ile township Suburb: Large 101.7 59.1 c
50 Grosse Pointe North High School conventional Grosse pointe Suburb: Large 101.6 58.2 c
51 Robichaud Sr High School conventional Westwood Suburb: Large 101.5 57.2 c
52 Lincoln Park High School conventional Lincoln park Suburb: Large 101.4 57.0 c
53 Comstock Park High School conventional comstock park Suburb: Large 101.4 56.2 c
54 DeWitt High School conventional DeWitt Suburb: Large 100.9 53.5 c
55 Sparta Sr High School conventional Sparta Suburb: Large 100.8 52.6 c
56 Walled Lake Central High School conventional Walled Lake Suburb: Large 100.6 51.1 c
57 Mount Clemens High School conventional Mt. clemens Suburb: Large 100.5 50.6 c
58 Kenowa Hills High School conventional kenowa Hills Suburb: Large 100.3 49.7 c
59 West Bloomfield High School conventional West Bloomfield Suburb: Large 100.3 49.4 c
60 Roseville High School conventional roseville Suburb: Large 100.2 48.9 c
61 Berkley High School conventional Berkley Suburb: Large 100.0 47.7 c
62 University High School conventional Ferndale Suburb: Large 99.6 46.0 c
63 Clarkston High School conventional clarkston Suburb: Large 99.6 45.9 c
64 Ferndale High School conventional Ferndale Suburb: Large 99.6 45.7 c
65 Allendale High School conventional Allendale Suburb: Large 99.6 45.2 c
Mackinac Center for Public Policy
The Michigan Public High School Context and Performance Report Card 52
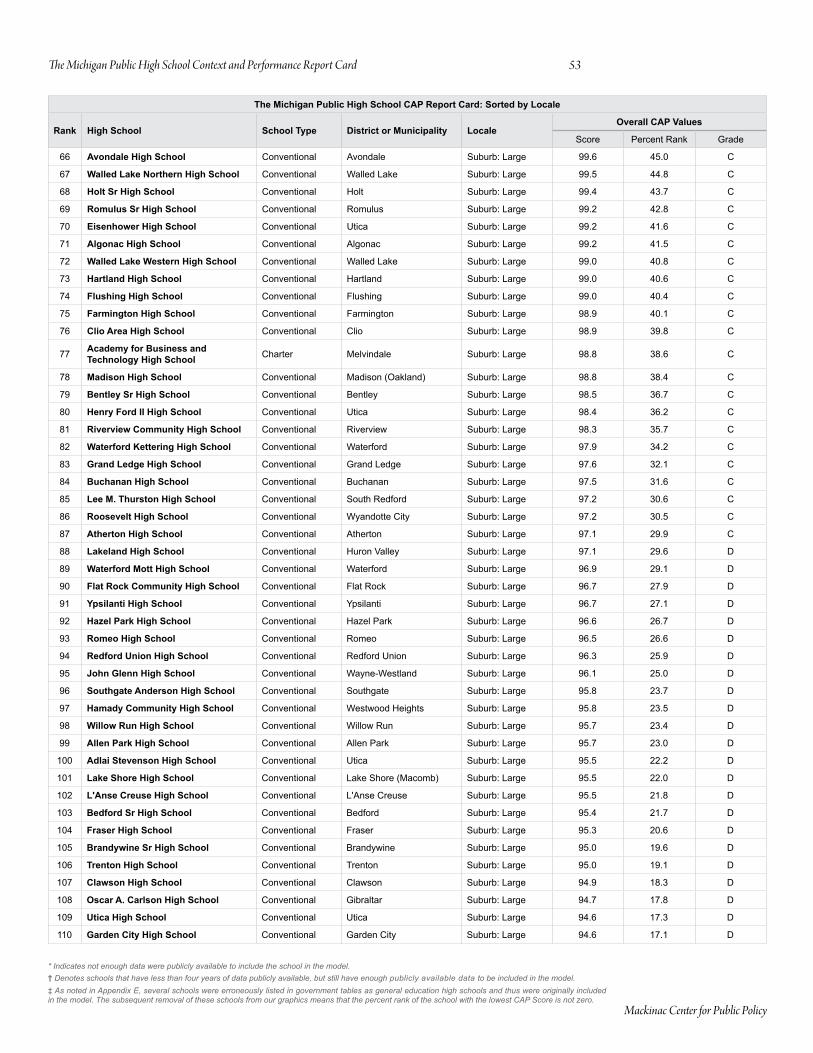
* Indicates not enough data were publicly available to include the school in the model.† Denotes schools that have less than four years of data publicly available, but still have enough publicly available data to be included in the model. ‡ As noted in Appendix E, several schools were erroneously listed in government tables as general education high schools and thus were originally included in the model. The subsequent removal of these schools from our graphics means that the percent rank of the school with the lowest CAP Score is not zero.
The Michigan Public High School CAP Report Card: Sorted by Locale
Rank High School School Type District or Municipality LocaleOverall CAP Values
Score percent rank Grade
21 Ernest W. Seaholm High School conventional Birmingham Suburb: Large 105.9 81.2 B
22 Annapolis High School conventional Dearborn Heights #7 Suburb: Large 105.7 80.0 B
23 Hamtramck High School conventional Hamtramck Suburb: Large 105.7 79.9 B
24 Haslett High School conventional Haslett Suburb: Large 104.8 77.2 B
25 Wayne Memorial High School conventional Wayne-Westland Suburb: Large 104.4 76.3 B
26 Plymouth High School conventional plymouth-canton Suburb: Large 104.0 74.3 B
27 Stoney Creek High School conventional rochester Suburb: Large 103.9 73.4 B
28 Chandler Park Academy High School† charter Harper Woods Suburb: Large 103.9 73.1 B
29 Davison High School conventional Davison Suburb: Large 103.8 72.9 B
30 Washtenaw Technical Middle College charter Ann Arbor Suburb: Large 103.8 72.8 B
31 Center Line High School conventional center Line Suburb: Large 103.7 72.6 B
32 Canton High School conventional plymouth-canton Suburb: Large 103.5 71.6 B
33 Wylie E. Groves High School conventional Birmingham Suburb: Large 103.4 70.7 B
34 Northview High School conventional northview Suburb: Large 103.3 69.7 c
35 Rockford High School conventional rockford Suburb: Large 102.9 66.3 c
36 East Kentwood High School conventional kentwood Suburb: Large 102.9 66.0 c
37 Hudsonville High School conventional Hudsonville Suburb: Large 102.8 65.5 c
38 Rochester High School conventional rochester Suburb: Large 102.8 65.1 c
39 Carman-Ainsworth High School conventional carman-Ainsworth Suburb: Large 102.7 65.0 c
40 Jenison High School conventional Jenison Suburb: Large 102.5 64.0 c
41 Salem High School conventional plymouth-canton Suburb: Large 102.4 63.3 c
42 Kearsley High School conventional kearsley Suburb: Large 102.3 62.9 c
43 Edwardsburg High School conventional edwardsburg Suburb: Large 102.3 62.6 c
44 Royal Oak High School conventional royal oak Suburb: Large 102.2 61.3 c
45 Fenton Sr High School conventional Fenton Suburb: Large 102.2 61.1 c
46 Sterling Heights Sr High School conventional Warren Suburb: Large 102.1 60.9 c
47 Grandville High School conventional Grandville Suburb: Large 102.0 60.1 c
48 Bloomfield Hills Lahser High School conventional Bloomfield Hills Suburb: Large 101.8 59.6 c
49 Grosse Ile High School conventional Grosse ile township Suburb: Large 101.7 59.1 c
50 Grosse Pointe North High School conventional Grosse pointe Suburb: Large 101.6 58.2 c
51 Robichaud Sr High School conventional Westwood Suburb: Large 101.5 57.2 c
52 Lincoln Park High School conventional Lincoln park Suburb: Large 101.4 57.0 c
53 Comstock Park High School conventional comstock park Suburb: Large 101.4 56.2 c
54 DeWitt High School conventional DeWitt Suburb: Large 100.9 53.5 c
55 Sparta Sr High School conventional Sparta Suburb: Large 100.8 52.6 c
56 Walled Lake Central High School conventional Walled Lake Suburb: Large 100.6 51.1 c
57 Mount Clemens High School conventional Mt. clemens Suburb: Large 100.5 50.6 c
58 Kenowa Hills High School conventional kenowa Hills Suburb: Large 100.3 49.7 c
59 West Bloomfield High School conventional West Bloomfield Suburb: Large 100.3 49.4 c
60 Roseville High School conventional roseville Suburb: Large 100.2 48.9 c
61 Berkley High School conventional Berkley Suburb: Large 100.0 47.7 c
62 University High School conventional Ferndale Suburb: Large 99.6 46.0 c
63 Clarkston High School conventional clarkston Suburb: Large 99.6 45.9 c
64 Ferndale High School conventional Ferndale Suburb: Large 99.6 45.7 c
65 Allendale High School conventional Allendale Suburb: Large 99.6 45.2 c
The Michigan Public High School CAP Report Card: Sorted by Locale
Rank High School School Type District or Municipality LocaleOverall CAP Values
Score percent rank Grade
66 Avondale High School conventional Avondale Suburb: Large 99.6 45.0 c
67 Walled Lake Northern High School conventional Walled Lake Suburb: Large 99.5 44.8 c
68 Holt Sr High School conventional Holt Suburb: Large 99.4 43.7 c
69 Romulus Sr High School conventional romulus Suburb: Large 99.2 42.8 c
70 Eisenhower High School conventional Utica Suburb: Large 99.2 41.6 c
71 Algonac High School conventional Algonac Suburb: Large 99.2 41.5 c
72 Walled Lake Western High School conventional Walled Lake Suburb: Large 99.0 40.8 c
73 Hartland High School conventional Hartland Suburb: Large 99.0 40.6 c
74 Flushing High School conventional Flushing Suburb: Large 99.0 40.4 c
75 Farmington High School conventional Farmington Suburb: Large 98.9 40.1 c
76 Clio Area High School conventional clio Suburb: Large 98.9 39.8 c
77 Academy for Business and Technology High School charter Melvindale Suburb: Large 98.8 38.6 c
78 Madison High School conventional Madison (oakland) Suburb: Large 98.8 38.4 c
79 Bentley Sr High School conventional Bentley Suburb: Large 98.5 36.7 c
80 Henry Ford II High School conventional Utica Suburb: Large 98.4 36.2 c
81 Riverview Community High School conventional riverview Suburb: Large 98.3 35.7 c
82 Waterford Kettering High School conventional Waterford Suburb: Large 97.9 34.2 c
83 Grand Ledge High School conventional Grand Ledge Suburb: Large 97.6 32.1 c
84 Buchanan High School conventional Buchanan Suburb: Large 97.5 31.6 c
85 Lee M. Thurston High School conventional South redford Suburb: Large 97.2 30.6 c
86 Roosevelt High School conventional Wyandotte city Suburb: Large 97.2 30.5 c
87 Atherton High School conventional Atherton Suburb: Large 97.1 29.9 c
88 Lakeland High School conventional Huron Valley Suburb: Large 97.1 29.6 D
89 Waterford Mott High School conventional Waterford Suburb: Large 96.9 29.1 D
90 Flat Rock Community High School conventional Flat rock Suburb: Large 96.7 27.9 D
91 Ypsilanti High School conventional Ypsilanti Suburb: Large 96.7 27.1 D
92 Hazel Park High School conventional Hazel park Suburb: Large 96.6 26.7 D
93 Romeo High School conventional romeo Suburb: Large 96.5 26.6 D
94 Redford Union High School conventional redford Union Suburb: Large 96.3 25.9 D
95 John Glenn High School conventional Wayne-Westland Suburb: Large 96.1 25.0 D
96 Southgate Anderson High School conventional Southgate Suburb: Large 95.8 23.7 D
97 Hamady Community High School conventional Westwood Heights Suburb: Large 95.8 23.5 D
98 Willow Run High School conventional Willow run Suburb: Large 95.7 23.4 D
99 Allen Park High School conventional Allen park Suburb: Large 95.7 23.0 D
100 Adlai Stevenson High School conventional Utica Suburb: Large 95.5 22.2 D
101 Lake Shore High School conventional Lake Shore (Macomb) Suburb: Large 95.5 22.0 D
102 L'Anse Creuse High School conventional L'Anse creuse Suburb: Large 95.5 21.8 D
103 Bedford Sr High School conventional Bedford Suburb: Large 95.4 21.7 D
104 Fraser High School conventional Fraser Suburb: Large 95.3 20.6 D
105 Brandywine Sr High School conventional Brandywine Suburb: Large 95.0 19.6 D
106 Trenton High School conventional trenton Suburb: Large 95.0 19.1 D
107 Clawson High School conventional clawson Suburb: Large 94.9 18.3 D
108 Oscar A. Carlson High School conventional Gibraltar Suburb: Large 94.7 17.8 D
109 Utica High School conventional Utica Suburb: Large 94.6 17.3 D
110 Garden City High School conventional Garden city Suburb: Large 94.6 17.1 D
Mackinac Center for Public Policy
The Michigan Public High School Context and Performance Report Card 53
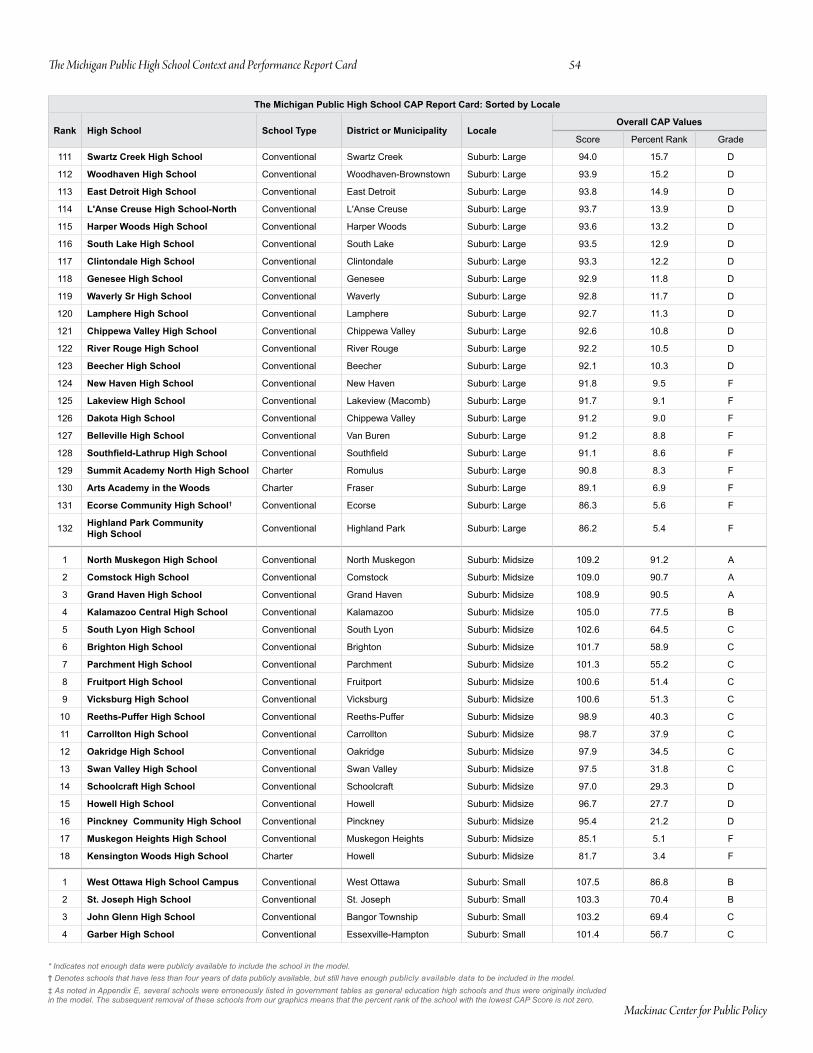
* Indicates not enough data were publicly available to include the school in the model.† Denotes schools that have less than four years of data publicly available, but still have enough publicly available data to be included in the model. ‡ As noted in Appendix E, several schools were erroneously listed in government tables as general education high schools and thus were originally included in the model. The subsequent removal of these schools from our graphics means that the percent rank of the school with the lowest CAP Score is not zero.
The Michigan Public High School CAP Report Card: Sorted by Locale
Rank High School School Type District or Municipality LocaleOverall CAP Values
Score percent rank Grade
111 Swartz Creek High School conventional Swartz creek Suburb: Large 94.0 15.7 D
112 Woodhaven High School conventional Woodhaven-Brownstown Suburb: Large 93.9 15.2 D
113 East Detroit High School conventional east Detroit Suburb: Large 93.8 14.9 D
114 L'Anse Creuse High School-North conventional L'Anse creuse Suburb: Large 93.7 13.9 D
115 Harper Woods High School conventional Harper Woods Suburb: Large 93.6 13.2 D
116 South Lake High School conventional South Lake Suburb: Large 93.5 12.9 D
117 Clintondale High School conventional clintondale Suburb: Large 93.3 12.2 D
118 Genesee High School conventional Genesee Suburb: Large 92.9 11.8 D
119 Waverly Sr High School conventional Waverly Suburb: Large 92.8 11.7 D
120 Lamphere High School conventional Lamphere Suburb: Large 92.7 11.3 D
121 Chippewa Valley High School conventional chippewa Valley Suburb: Large 92.6 10.8 D
122 River Rouge High School conventional river rouge Suburb: Large 92.2 10.5 D
123 Beecher High School conventional Beecher Suburb: Large 92.1 10.3 D
124 New Haven High School conventional new Haven Suburb: Large 91.8 9.5 F
125 Lakeview High School conventional Lakeview (Macomb) Suburb: Large 91.7 9.1 F
126 Dakota High School conventional chippewa Valley Suburb: Large 91.2 9.0 F
127 Belleville High School conventional Van Buren Suburb: Large 91.2 8.8 F
128 Southfield-Lathrup High School conventional Southfield Suburb: Large 91.1 8.6 F
129 Summit Academy North High School charter romulus Suburb: Large 90.8 8.3 F
130 Arts Academy in the Woods charter Fraser Suburb: Large 89.1 6.9 F
131 Ecorse Community High School† conventional ecorse Suburb: Large 86.3 5.6 F
132 Highland Park Community High School conventional Highland park Suburb: Large 86.2 5.4 F
1 North Muskegon High School conventional north Muskegon Suburb: Midsize 109.2 91.2 A
2 Comstock High School conventional comstock Suburb: Midsize 109.0 90.7 A
3 Grand Haven High School conventional Grand Haven Suburb: Midsize 108.9 90.5 A
4 Kalamazoo Central High School conventional kalamazoo Suburb: Midsize 105.0 77.5 B
5 South Lyon High School conventional South Lyon Suburb: Midsize 102.6 64.5 c
6 Brighton High School conventional Brighton Suburb: Midsize 101.7 58.9 c
7 Parchment High School conventional parchment Suburb: Midsize 101.3 55.2 c
8 Fruitport High School conventional Fruitport Suburb: Midsize 100.6 51.4 c
9 Vicksburg High School conventional Vicksburg Suburb: Midsize 100.6 51.3 c
10 Reeths-Puffer High School conventional reeths-puffer Suburb: Midsize 98.9 40.3 c
11 Carrollton High School conventional carrollton Suburb: Midsize 98.7 37.9 c
12 Oakridge High School conventional oakridge Suburb: Midsize 97.9 34.5 c
13 Swan Valley High School conventional Swan Valley Suburb: Midsize 97.5 31.8 c
14 Schoolcraft High School conventional Schoolcraft Suburb: Midsize 97.0 29.3 D
15 Howell High School conventional Howell Suburb: Midsize 96.7 27.7 D
16 Pinckney Community High School conventional pinckney Suburb: Midsize 95.4 21.2 D
17 Muskegon Heights High School conventional Muskegon Heights Suburb: Midsize 85.1 5.1 F
18 Kensington Woods High School charter Howell Suburb: Midsize 81.7 3.4 F
1 West Ottawa High School Campus conventional West ottawa Suburb: Small 107.5 86.8 B
2 St. Joseph High School conventional St. Joseph Suburb: Small 103.3 70.4 B
3 John Glenn High School conventional Bangor township Suburb: Small 103.2 69.4 c
4 Garber High School conventional essexville-Hampton Suburb: Small 101.4 56.7 c
Mackinac Center for Public Policy
The Michigan Public High School Context and Performance Report Card 54

* Indicates not enough data were publicly available to include the school in the model.† Denotes schools that have less than four years of data publicly available, but still have enough publicly available data to be included in the model. ‡ As noted in Appendix E, several schools were erroneously listed in government tables as general education high schools and thus were originally included in the model. The subsequent removal of these schools from our graphics means that the percent rank of the school with the lowest CAP Score is not zero.
The Michigan Public High School CAP Report Card: Sorted by Locale
Rank High School School Type District or Municipality LocaleOverall CAP Values
Score percent rank Grade
111 Swartz Creek High School conventional Swartz creek Suburb: Large 94.0 15.7 D
112 Woodhaven High School conventional Woodhaven-Brownstown Suburb: Large 93.9 15.2 D
113 East Detroit High School conventional east Detroit Suburb: Large 93.8 14.9 D
114 L'Anse Creuse High School-North conventional L'Anse creuse Suburb: Large 93.7 13.9 D
115 Harper Woods High School conventional Harper Woods Suburb: Large 93.6 13.2 D
116 South Lake High School conventional South Lake Suburb: Large 93.5 12.9 D
117 Clintondale High School conventional clintondale Suburb: Large 93.3 12.2 D
118 Genesee High School conventional Genesee Suburb: Large 92.9 11.8 D
119 Waverly Sr High School conventional Waverly Suburb: Large 92.8 11.7 D
120 Lamphere High School conventional Lamphere Suburb: Large 92.7 11.3 D
121 Chippewa Valley High School conventional chippewa Valley Suburb: Large 92.6 10.8 D
122 River Rouge High School conventional river rouge Suburb: Large 92.2 10.5 D
123 Beecher High School conventional Beecher Suburb: Large 92.1 10.3 D
124 New Haven High School conventional new Haven Suburb: Large 91.8 9.5 F
125 Lakeview High School conventional Lakeview (Macomb) Suburb: Large 91.7 9.1 F
126 Dakota High School conventional chippewa Valley Suburb: Large 91.2 9.0 F
127 Belleville High School conventional Van Buren Suburb: Large 91.2 8.8 F
128 Southfield-Lathrup High School conventional Southfield Suburb: Large 91.1 8.6 F
129 Summit Academy North High School charter romulus Suburb: Large 90.8 8.3 F
130 Arts Academy in the Woods charter Fraser Suburb: Large 89.1 6.9 F
131 Ecorse Community High School† conventional ecorse Suburb: Large 86.3 5.6 F
132 Highland Park Community High School conventional Highland park Suburb: Large 86.2 5.4 F
1 North Muskegon High School conventional north Muskegon Suburb: Midsize 109.2 91.2 A
2 Comstock High School conventional comstock Suburb: Midsize 109.0 90.7 A
3 Grand Haven High School conventional Grand Haven Suburb: Midsize 108.9 90.5 A
4 Kalamazoo Central High School conventional kalamazoo Suburb: Midsize 105.0 77.5 B
5 South Lyon High School conventional South Lyon Suburb: Midsize 102.6 64.5 c
6 Brighton High School conventional Brighton Suburb: Midsize 101.7 58.9 c
7 Parchment High School conventional parchment Suburb: Midsize 101.3 55.2 c
8 Fruitport High School conventional Fruitport Suburb: Midsize 100.6 51.4 c
9 Vicksburg High School conventional Vicksburg Suburb: Midsize 100.6 51.3 c
10 Reeths-Puffer High School conventional reeths-puffer Suburb: Midsize 98.9 40.3 c
11 Carrollton High School conventional carrollton Suburb: Midsize 98.7 37.9 c
12 Oakridge High School conventional oakridge Suburb: Midsize 97.9 34.5 c
13 Swan Valley High School conventional Swan Valley Suburb: Midsize 97.5 31.8 c
14 Schoolcraft High School conventional Schoolcraft Suburb: Midsize 97.0 29.3 D
15 Howell High School conventional Howell Suburb: Midsize 96.7 27.7 D
16 Pinckney Community High School conventional pinckney Suburb: Midsize 95.4 21.2 D
17 Muskegon Heights High School conventional Muskegon Heights Suburb: Midsize 85.1 5.1 F
18 Kensington Woods High School charter Howell Suburb: Midsize 81.7 3.4 F
1 West Ottawa High School Campus conventional West ottawa Suburb: Small 107.5 86.8 B
2 St. Joseph High School conventional St. Joseph Suburb: Small 103.3 70.4 B
3 John Glenn High School conventional Bangor township Suburb: Small 103.2 69.4 c
4 Garber High School conventional essexville-Hampton Suburb: Small 101.4 56.7 c
The Michigan Public High School CAP Report Card: Sorted by Locale
Rank High School School Type District or Municipality LocaleOverall CAP Values
Score percent rank Grade
5 Marysville High School conventional Marysville Suburb: Small 100.4 49.9 c
6 Port Huron Northern High School conventional port Huron Suburb: Small 100.2 48.7 c
7 St. Clair High School conventional east china Suburb: Small 99.8 46.9 c
8 Port Huron High School conventional port Huron Suburb: Small 97.8 33.3 c
9 Vandercook Lake High School conventional Vandercook Lake Suburb: Small 97.6 32.3 c
10 Marine City High School conventional east china Suburb: Small 97.4 31.3 c
11 Michigan Center Jr/Sr High School conventional Michigan center Suburb: Small 94.4 16.6 D
12 Monroe High School conventional Monroe Suburb: Small 94.0 15.6 D
1 Watervliet Sr High School conventional Watervliet town: Fringe 110.7 93.7 A
2 Berrien Springs High School conventional Berrien Springs town: Fringe 105.5 79.4 B
3 Chelsea High School conventional chelsea town: Fringe 104.0 74.1 B
4 Williamston High School conventional Williamston town: Fringe 103.1 68.9 c
5 Cedar Springs High School conventional cedar Springs town: Fringe 102.3 63.1 c
6 Mattawan High School conventional Mattawan town: Fringe 102.3 62.3 c
7 Coopersville High School conventional coopersville town: Fringe 100.2 49.1 c
8 Eaton Rapids Sr High School conventional eaton rapids town: Fringe 99.9 47.4 c
9 Perry High School conventional perry town: Fringe 99.4 43.3 c
10 Marshall High School conventional Marshall town: Fringe 98.0 34.7 c
11 Fowlerville High School conventional Fowlerville town: Fringe 95.5 22.3 D
12 Durand Area High School conventional Durand town: Fringe 94.9 17.9 D
13 Webberville High School conventional Webberville town: Fringe 93.8 14.6 D
14 Coloma High School conventional coloma town: Fringe 93.4 12.7 D
15 Richmond Community High School conventional richmond town: Fringe 91.8 9.8 F
16 Creative Technologies Academy† charter cedar Springs town: Fringe 77.2 1.9 F
1 H.H. Dow High School conventional Midland town: Distant 111.7 95.1 A
2 South Haven High School conventional South Haven town: Distant 109.8 92.4 A
3 Midland High School conventional Midland town: Distant 108.6 89.2 B
4 Union High School conventional Dowagiac Union town: Distant 106.7 84.8 B
5 Sturgis High School conventional Sturgis town: Distant 106.0 81.7 B
6 Newaygo High School conventional newaygo town: Distant 105.6 79.7 B
7 Sandusky High School conventional Sandusky town: Distant 105.3 78.7 B
8 Ithaca High School conventional ithaca town: Distant 105.3 78.5 B
9 Caro High School conventional caro town: Distant 105.2 78.0 B
10 Albion High School conventional Albion town: Distant 104.3 75.8 B
11 Gladwin High School conventional Gladwin town: Distant 104.2 75.0 B
12 Hillsdale High School conventional Hillsdale town: Distant 104.0 73.9 B
13 Belding High School conventional Belding town: Distant 103.1 68.7 c
14 Hartford High School conventional Hartford town: Distant 103.1 68.5 c
15 Ionia High School conventional ionia town: Distant 102.8 65.3 c
16 Greenville Sr High School conventional Greenville town: Distant 102.1 60.7 c
17 Imlay City High School conventional imlay city town: Distant 101.8 59.4 c
18 Mt. Pleasant Sr High School conventional Mt. pleasant town: Distant 101.5 57.9 c
19 Vassar Sr High School conventional Vassar town: Distant 101.4 55.7 c
20 Constantine High School conventional constantine town: Distant 101.3 55.0 c
21 Lapeer East Sr High School conventional Lapeer town: Distant 100.4 50.1 c
Mackinac Center for Public Policy
The Michigan Public High School Context and Performance Report Card 55
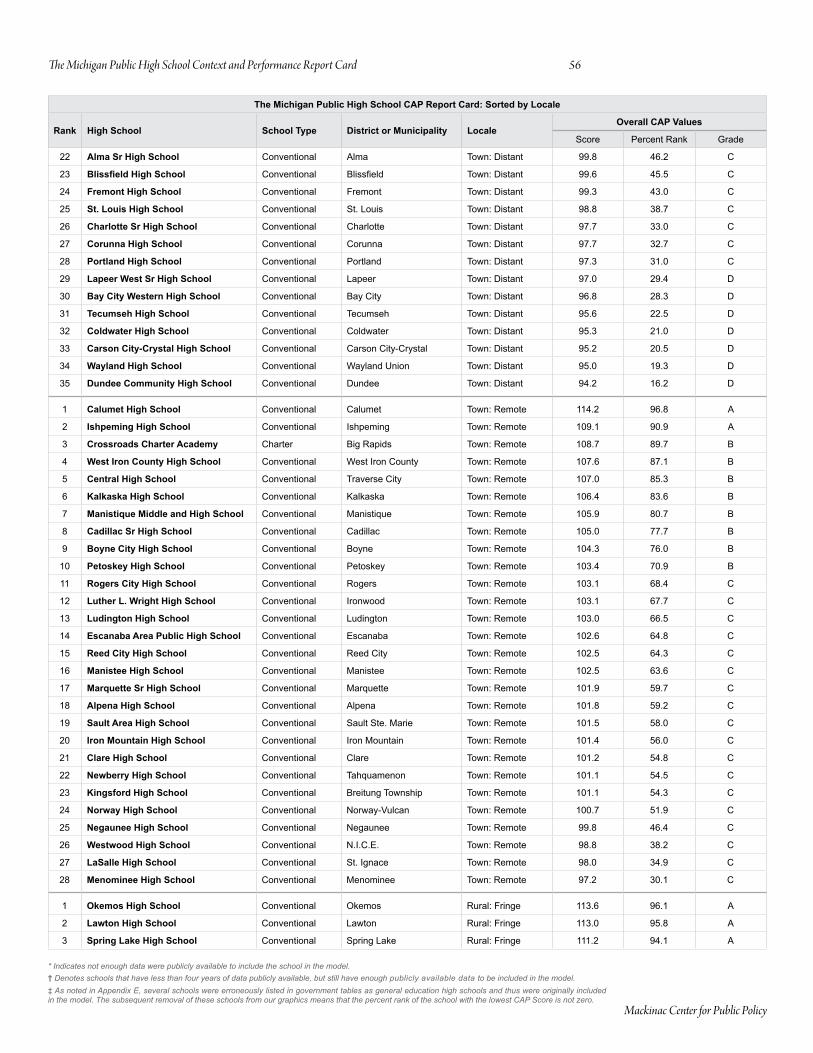
* Indicates not enough data were publicly available to include the school in the model.† Denotes schools that have less than four years of data publicly available, but still have enough publicly available data to be included in the model. ‡ As noted in Appendix E, several schools were erroneously listed in government tables as general education high schools and thus were originally included in the model. The subsequent removal of these schools from our graphics means that the percent rank of the school with the lowest CAP Score is not zero.
The Michigan Public High School CAP Report Card: Sorted by Locale
Rank High School School Type District or Municipality LocaleOverall CAP Values
Score percent rank Grade
22 Alma Sr High School conventional Alma town: Distant 99.8 46.2 c
23 Blissfield High School conventional Blissfield town: Distant 99.6 45.5 c
24 Fremont High School conventional Fremont town: Distant 99.3 43.0 c
25 St. Louis High School conventional St. Louis town: Distant 98.8 38.7 c
26 Charlotte Sr High School conventional charlotte town: Distant 97.7 33.0 c
27 Corunna High School conventional corunna town: Distant 97.7 32.7 c
28 Portland High School conventional portland town: Distant 97.3 31.0 c
29 Lapeer West Sr High School conventional Lapeer town: Distant 97.0 29.4 D
30 Bay City Western High School conventional Bay city town: Distant 96.8 28.3 D
31 Tecumseh High School conventional tecumseh town: Distant 95.6 22.5 D
32 Coldwater High School conventional coldwater town: Distant 95.3 21.0 D
33 Carson City-Crystal High School conventional carson city-crystal town: Distant 95.2 20.5 D
34 Wayland High School conventional Wayland Union town: Distant 95.0 19.3 D
35 Dundee Community High School conventional Dundee town: Distant 94.2 16.2 D
1 Calumet High School conventional calumet town: remote 114.2 96.8 A
2 Ishpeming High School conventional ishpeming town: remote 109.1 90.9 A
3 Crossroads Charter Academy charter Big rapids town: remote 108.7 89.7 B
4 West Iron County High School conventional West iron county town: remote 107.6 87.1 B
5 Central High School conventional traverse city town: remote 107.0 85.3 B
6 Kalkaska High School conventional kalkaska town: remote 106.4 83.6 B
7 Manistique Middle and High School conventional Manistique town: remote 105.9 80.7 B
8 Cadillac Sr High School conventional cadillac town: remote 105.0 77.7 B
9 Boyne City High School conventional Boyne town: remote 104.3 76.0 B
10 Petoskey High School conventional petoskey town: remote 103.4 70.9 B
11 Rogers City High School conventional rogers town: remote 103.1 68.4 c
12 Luther L. Wright High School conventional ironwood town: remote 103.1 67.7 c
13 Ludington High School conventional Ludington town: remote 103.0 66.5 c
14 Escanaba Area Public High School conventional escanaba town: remote 102.6 64.8 c
15 Reed City High School conventional reed city town: remote 102.5 64.3 c
16 Manistee High School conventional Manistee town: remote 102.5 63.6 c
17 Marquette Sr High School conventional Marquette town: remote 101.9 59.7 c
18 Alpena High School conventional Alpena town: remote 101.8 59.2 c
19 Sault Area High School conventional Sault Ste. Marie town: remote 101.5 58.0 c
20 Iron Mountain High School conventional iron Mountain town: remote 101.4 56.0 c
21 Clare High School conventional clare town: remote 101.2 54.8 c
22 Newberry High School conventional tahquamenon town: remote 101.1 54.5 c
23 Kingsford High School conventional Breitung township town: remote 101.1 54.3 c
24 Norway High School conventional norway-Vulcan town: remote 100.7 51.9 c
25 Negaunee High School conventional negaunee town: remote 99.8 46.4 c
26 Westwood High School conventional n.i.c.e. town: remote 98.8 38.2 c
27 LaSalle High School conventional St. ignace town: remote 98.0 34.9 c
28 Menominee High School conventional Menominee town: remote 97.2 30.1 c
1 Okemos High School conventional okemos rural: Fringe 113.6 96.1 A
2 Lawton High School conventional Lawton rural: Fringe 113.0 95.8 A
3 Spring Lake High School conventional Spring Lake rural: Fringe 111.2 94.1 A
Mackinac Center for Public Policy
The Michigan Public High School Context and Performance Report Card 56
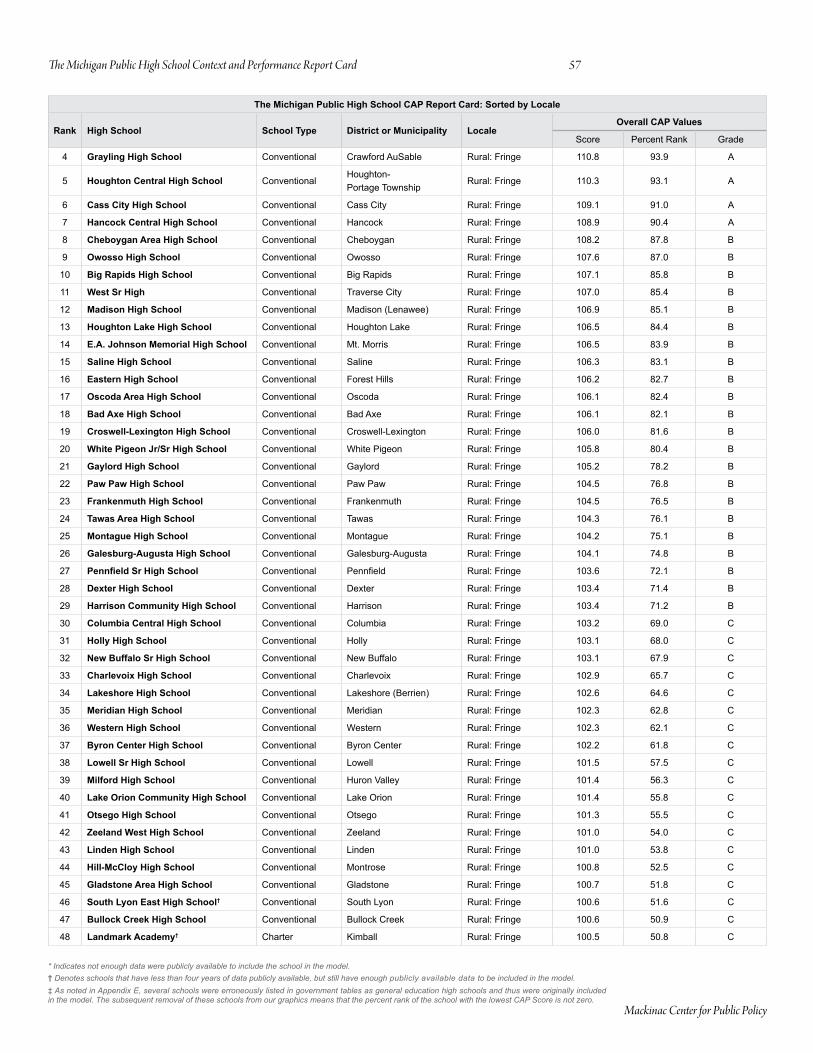
* Indicates not enough data were publicly available to include the school in the model.† Denotes schools that have less than four years of data publicly available, but still have enough publicly available data to be included in the model. ‡ As noted in Appendix E, several schools were erroneously listed in government tables as general education high schools and thus were originally included in the model. The subsequent removal of these schools from our graphics means that the percent rank of the school with the lowest CAP Score is not zero.
The Michigan Public High School CAP Report Card: Sorted by Locale
Rank High School School Type District or Municipality LocaleOverall CAP Values
Score percent rank Grade
22 Alma Sr High School conventional Alma town: Distant 99.8 46.2 c
23 Blissfield High School conventional Blissfield town: Distant 99.6 45.5 c
24 Fremont High School conventional Fremont town: Distant 99.3 43.0 c
25 St. Louis High School conventional St. Louis town: Distant 98.8 38.7 c
26 Charlotte Sr High School conventional charlotte town: Distant 97.7 33.0 c
27 Corunna High School conventional corunna town: Distant 97.7 32.7 c
28 Portland High School conventional portland town: Distant 97.3 31.0 c
29 Lapeer West Sr High School conventional Lapeer town: Distant 97.0 29.4 D
30 Bay City Western High School conventional Bay city town: Distant 96.8 28.3 D
31 Tecumseh High School conventional tecumseh town: Distant 95.6 22.5 D
32 Coldwater High School conventional coldwater town: Distant 95.3 21.0 D
33 Carson City-Crystal High School conventional carson city-crystal town: Distant 95.2 20.5 D
34 Wayland High School conventional Wayland Union town: Distant 95.0 19.3 D
35 Dundee Community High School conventional Dundee town: Distant 94.2 16.2 D
1 Calumet High School conventional calumet town: remote 114.2 96.8 A
2 Ishpeming High School conventional ishpeming town: remote 109.1 90.9 A
3 Crossroads Charter Academy charter Big rapids town: remote 108.7 89.7 B
4 West Iron County High School conventional West iron county town: remote 107.6 87.1 B
5 Central High School conventional traverse city town: remote 107.0 85.3 B
6 Kalkaska High School conventional kalkaska town: remote 106.4 83.6 B
7 Manistique Middle and High School conventional Manistique town: remote 105.9 80.7 B
8 Cadillac Sr High School conventional cadillac town: remote 105.0 77.7 B
9 Boyne City High School conventional Boyne town: remote 104.3 76.0 B
10 Petoskey High School conventional petoskey town: remote 103.4 70.9 B
11 Rogers City High School conventional rogers town: remote 103.1 68.4 c
12 Luther L. Wright High School conventional ironwood town: remote 103.1 67.7 c
13 Ludington High School conventional Ludington town: remote 103.0 66.5 c
14 Escanaba Area Public High School conventional escanaba town: remote 102.6 64.8 c
15 Reed City High School conventional reed city town: remote 102.5 64.3 c
16 Manistee High School conventional Manistee town: remote 102.5 63.6 c
17 Marquette Sr High School conventional Marquette town: remote 101.9 59.7 c
18 Alpena High School conventional Alpena town: remote 101.8 59.2 c
19 Sault Area High School conventional Sault Ste. Marie town: remote 101.5 58.0 c
20 Iron Mountain High School conventional iron Mountain town: remote 101.4 56.0 c
21 Clare High School conventional clare town: remote 101.2 54.8 c
22 Newberry High School conventional tahquamenon town: remote 101.1 54.5 c
23 Kingsford High School conventional Breitung township town: remote 101.1 54.3 c
24 Norway High School conventional norway-Vulcan town: remote 100.7 51.9 c
25 Negaunee High School conventional negaunee town: remote 99.8 46.4 c
26 Westwood High School conventional n.i.c.e. town: remote 98.8 38.2 c
27 LaSalle High School conventional St. ignace town: remote 98.0 34.9 c
28 Menominee High School conventional Menominee town: remote 97.2 30.1 c
1 Okemos High School conventional okemos rural: Fringe 113.6 96.1 A
2 Lawton High School conventional Lawton rural: Fringe 113.0 95.8 A
3 Spring Lake High School conventional Spring Lake rural: Fringe 111.2 94.1 A
The Michigan Public High School CAP Report Card: Sorted by Locale
Rank High School School Type District or Municipality LocaleOverall CAP Values
Score percent rank Grade
4 Grayling High School conventional crawford AuSable rural: Fringe 110.8 93.9 A
5 Houghton Central High School conventionalHoughton- portage township
rural: Fringe 110.3 93.1 A
6 Cass City High School conventional cass city rural: Fringe 109.1 91.0 A
7 Hancock Central High School conventional Hancock rural: Fringe 108.9 90.4 A
8 Cheboygan Area High School conventional cheboygan rural: Fringe 108.2 87.8 B
9 Owosso High School conventional owosso rural: Fringe 107.6 87.0 B
10 Big Rapids High School conventional Big rapids rural: Fringe 107.1 85.8 B
11 West Sr High conventional traverse city rural: Fringe 107.0 85.4 B
12 Madison High School conventional Madison (Lenawee) rural: Fringe 106.9 85.1 B
13 Houghton Lake High School conventional Houghton Lake rural: Fringe 106.5 84.4 B
14 E.A. Johnson Memorial High School conventional Mt. Morris rural: Fringe 106.5 83.9 B
15 Saline High School conventional Saline rural: Fringe 106.3 83.1 B
16 Eastern High School conventional Forest Hills rural: Fringe 106.2 82.7 B
17 Oscoda Area High School conventional oscoda rural: Fringe 106.1 82.4 B
18 Bad Axe High School conventional Bad Axe rural: Fringe 106.1 82.1 B
19 Croswell-Lexington High School conventional croswell-Lexington rural: Fringe 106.0 81.6 B
20 White Pigeon Jr/Sr High School conventional White pigeon rural: Fringe 105.8 80.4 B
21 Gaylord High School conventional Gaylord rural: Fringe 105.2 78.2 B
22 Paw Paw High School conventional paw paw rural: Fringe 104.5 76.8 B
23 Frankenmuth High School conventional Frankenmuth rural: Fringe 104.5 76.5 B
24 Tawas Area High School conventional tawas rural: Fringe 104.3 76.1 B
25 Montague High School conventional Montague rural: Fringe 104.2 75.1 B
26 Galesburg-Augusta High School conventional Galesburg-Augusta rural: Fringe 104.1 74.8 B
27 Pennfield Sr High School conventional Pennfield rural: Fringe 103.6 72.1 B
28 Dexter High School conventional Dexter rural: Fringe 103.4 71.4 B
29 Harrison Community High School conventional Harrison rural: Fringe 103.4 71.2 B
30 Columbia Central High School conventional columbia rural: Fringe 103.2 69.0 c
31 Holly High School conventional Holly rural: Fringe 103.1 68.0 c
32 New Buffalo Sr High School conventional new Buffalo rural: Fringe 103.1 67.9 c
33 Charlevoix High School conventional charlevoix rural: Fringe 102.9 65.7 c
34 Lakeshore High School conventional Lakeshore (Berrien) rural: Fringe 102.6 64.6 c
35 Meridian High School conventional Meridian rural: Fringe 102.3 62.8 c
36 Western High School conventional Western rural: Fringe 102.3 62.1 c
37 Byron Center High School conventional Byron center rural: Fringe 102.2 61.8 c
38 Lowell Sr High School conventional Lowell rural: Fringe 101.5 57.5 c
39 Milford High School conventional Huron Valley rural: Fringe 101.4 56.3 c
40 Lake Orion Community High School conventional Lake orion rural: Fringe 101.4 55.8 c
41 Otsego High School conventional otsego rural: Fringe 101.3 55.5 c
42 Zeeland West High School conventional Zeeland rural: Fringe 101.0 54.0 c
43 Linden High School conventional Linden rural: Fringe 101.0 53.8 c
44 Hill-McCloy High School conventional Montrose rural: Fringe 100.8 52.5 c
45 Gladstone Area High School conventional Gladstone rural: Fringe 100.7 51.8 c
46 South Lyon East High School† conventional South Lyon rural: Fringe 100.6 51.6 c
47 Bullock Creek High School conventional Bullock creek rural: Fringe 100.6 50.9 c
48 Landmark Academy† charter kimball rural: Fringe 100.5 50.8 c
Mackinac Center for Public Policy
The Michigan Public High School Context and Performance Report Card 57
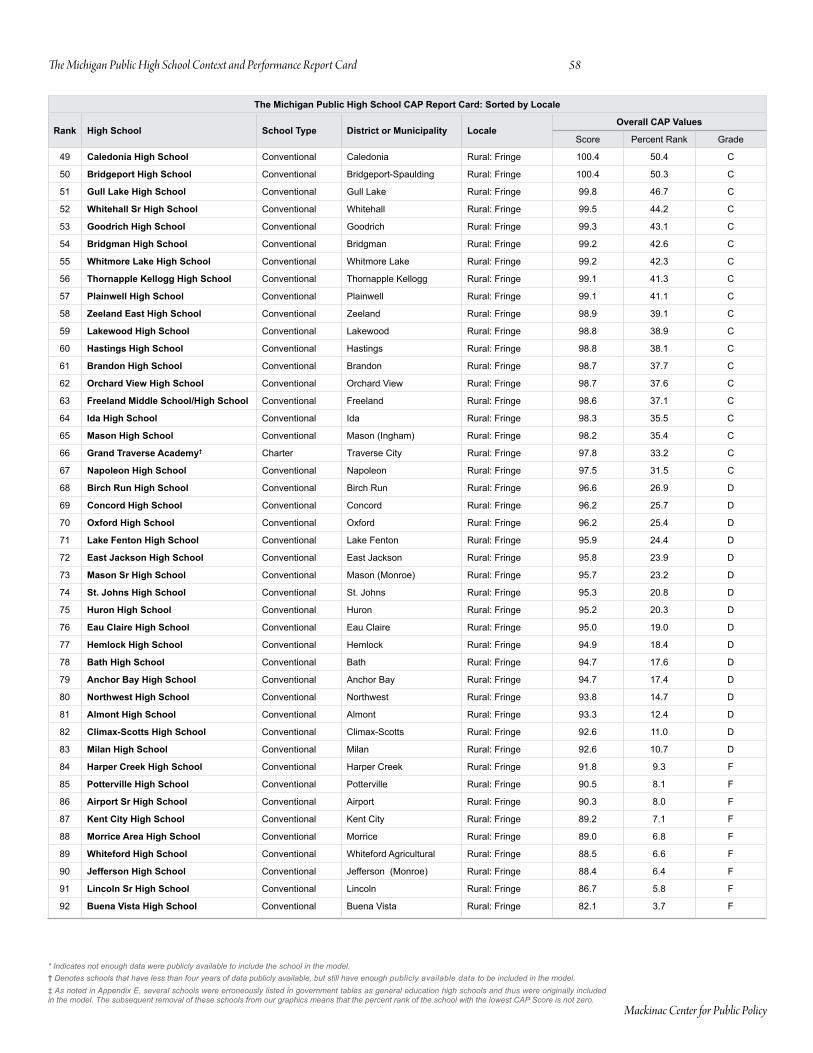
* Indicates not enough data were publicly available to include the school in the model.† Denotes schools that have less than four years of data publicly available, but still have enough publicly available data to be included in the model. ‡ As noted in Appendix E, several schools were erroneously listed in government tables as general education high schools and thus were originally included in the model. The subsequent removal of these schools from our graphics means that the percent rank of the school with the lowest CAP Score is not zero.
The Michigan Public High School CAP Report Card: Sorted by Locale
Rank High School School Type District or Municipality LocaleOverall CAP Values
Score percent rank Grade
49 Caledonia High School conventional caledonia rural: Fringe 100.4 50.4 c
50 Bridgeport High School conventional Bridgeport-Spaulding rural: Fringe 100.4 50.3 c
51 Gull Lake High School conventional Gull Lake rural: Fringe 99.8 46.7 c
52 Whitehall Sr High School conventional Whitehall rural: Fringe 99.5 44.2 c
53 Goodrich High School conventional Goodrich rural: Fringe 99.3 43.1 c
54 Bridgman High School conventional Bridgman rural: Fringe 99.2 42.6 c
55 Whitmore Lake High School conventional Whitmore Lake rural: Fringe 99.2 42.3 c
56 Thornapple Kellogg High School conventional thornapple kellogg rural: Fringe 99.1 41.3 c
57 Plainwell High School conventional plainwell rural: Fringe 99.1 41.1 c
58 Zeeland East High School conventional Zeeland rural: Fringe 98.9 39.1 c
59 Lakewood High School conventional Lakewood rural: Fringe 98.8 38.9 c
60 Hastings High School conventional Hastings rural: Fringe 98.8 38.1 c
61 Brandon High School conventional Brandon rural: Fringe 98.7 37.7 c
62 Orchard View High School conventional orchard View rural: Fringe 98.7 37.6 c
63 Freeland Middle School/High School conventional Freeland rural: Fringe 98.6 37.1 c
64 Ida High School conventional ida rural: Fringe 98.3 35.5 c
65 Mason High School conventional Mason (ingham) rural: Fringe 98.2 35.4 c
66 Grand Traverse Academy† charter traverse city rural: Fringe 97.8 33.2 c
67 Napoleon High School conventional napoleon rural: Fringe 97.5 31.5 c
68 Birch Run High School conventional Birch run rural: Fringe 96.6 26.9 D
69 Concord High School conventional concord rural: Fringe 96.2 25.7 D
70 Oxford High School conventional oxford rural: Fringe 96.2 25.4 D
71 Lake Fenton High School conventional Lake Fenton rural: Fringe 95.9 24.4 D
72 East Jackson High School conventional east Jackson rural: Fringe 95.8 23.9 D
73 Mason Sr High School conventional Mason (Monroe) rural: Fringe 95.7 23.2 D
74 St. Johns High School conventional St. Johns rural: Fringe 95.3 20.8 D
75 Huron High School conventional Huron rural: Fringe 95.2 20.3 D
76 Eau Claire High School conventional eau claire rural: Fringe 95.0 19.0 D
77 Hemlock High School conventional Hemlock rural: Fringe 94.9 18.4 D
78 Bath High School conventional Bath rural: Fringe 94.7 17.6 D
79 Anchor Bay High School conventional Anchor Bay rural: Fringe 94.7 17.4 D
80 Northwest High School conventional northwest rural: Fringe 93.8 14.7 D
81 Almont High School conventional Almont rural: Fringe 93.3 12.4 D
82 Climax-Scotts High School conventional climax-Scotts rural: Fringe 92.6 11.0 D
83 Milan High School conventional Milan rural: Fringe 92.6 10.7 D
84 Harper Creek High School conventional Harper creek rural: Fringe 91.8 9.3 F
85 Potterville High School conventional potterville rural: Fringe 90.5 8.1 F
86 Airport Sr High School conventional Airport rural: Fringe 90.3 8.0 F
87 Kent City High School conventional kent city rural: Fringe 89.2 7.1 F
88 Morrice Area High School conventional Morrice rural: Fringe 89.0 6.8 F
89 Whiteford High School conventional Whiteford Agricultural rural: Fringe 88.5 6.6 F
90 Jefferson High School conventional Jefferson (Monroe) rural: Fringe 88.4 6.4 F
91 Lincoln Sr High School conventional Lincoln rural: Fringe 86.7 5.8 F
92 Buena Vista High School conventional Buena Vista rural: Fringe 82.1 3.7 F
Mackinac Center for Public Policy
The Michigan Public High School Context and Performance Report Card 58

* Indicates not enough data were publicly available to include the school in the model.† Denotes schools that have less than four years of data publicly available, but still have enough publicly available data to be included in the model. ‡ As noted in Appendix E, several schools were erroneously listed in government tables as general education high schools and thus were originally included in the model. The subsequent removal of these schools from our graphics means that the percent rank of the school with the lowest CAP Score is not zero.
The Michigan Public High School CAP Report Card: Sorted by Locale
Rank High School School Type District or Municipality LocaleOverall CAP Values
Score percent rank Grade
49 Caledonia High School conventional caledonia rural: Fringe 100.4 50.4 c
50 Bridgeport High School conventional Bridgeport-Spaulding rural: Fringe 100.4 50.3 c
51 Gull Lake High School conventional Gull Lake rural: Fringe 99.8 46.7 c
52 Whitehall Sr High School conventional Whitehall rural: Fringe 99.5 44.2 c
53 Goodrich High School conventional Goodrich rural: Fringe 99.3 43.1 c
54 Bridgman High School conventional Bridgman rural: Fringe 99.2 42.6 c
55 Whitmore Lake High School conventional Whitmore Lake rural: Fringe 99.2 42.3 c
56 Thornapple Kellogg High School conventional thornapple kellogg rural: Fringe 99.1 41.3 c
57 Plainwell High School conventional plainwell rural: Fringe 99.1 41.1 c
58 Zeeland East High School conventional Zeeland rural: Fringe 98.9 39.1 c
59 Lakewood High School conventional Lakewood rural: Fringe 98.8 38.9 c
60 Hastings High School conventional Hastings rural: Fringe 98.8 38.1 c
61 Brandon High School conventional Brandon rural: Fringe 98.7 37.7 c
62 Orchard View High School conventional orchard View rural: Fringe 98.7 37.6 c
63 Freeland Middle School/High School conventional Freeland rural: Fringe 98.6 37.1 c
64 Ida High School conventional ida rural: Fringe 98.3 35.5 c
65 Mason High School conventional Mason (ingham) rural: Fringe 98.2 35.4 c
66 Grand Traverse Academy† charter traverse city rural: Fringe 97.8 33.2 c
67 Napoleon High School conventional napoleon rural: Fringe 97.5 31.5 c
68 Birch Run High School conventional Birch run rural: Fringe 96.6 26.9 D
69 Concord High School conventional concord rural: Fringe 96.2 25.7 D
70 Oxford High School conventional oxford rural: Fringe 96.2 25.4 D
71 Lake Fenton High School conventional Lake Fenton rural: Fringe 95.9 24.4 D
72 East Jackson High School conventional east Jackson rural: Fringe 95.8 23.9 D
73 Mason Sr High School conventional Mason (Monroe) rural: Fringe 95.7 23.2 D
74 St. Johns High School conventional St. Johns rural: Fringe 95.3 20.8 D
75 Huron High School conventional Huron rural: Fringe 95.2 20.3 D
76 Eau Claire High School conventional eau claire rural: Fringe 95.0 19.0 D
77 Hemlock High School conventional Hemlock rural: Fringe 94.9 18.4 D
78 Bath High School conventional Bath rural: Fringe 94.7 17.6 D
79 Anchor Bay High School conventional Anchor Bay rural: Fringe 94.7 17.4 D
80 Northwest High School conventional northwest rural: Fringe 93.8 14.7 D
81 Almont High School conventional Almont rural: Fringe 93.3 12.4 D
82 Climax-Scotts High School conventional climax-Scotts rural: Fringe 92.6 11.0 D
83 Milan High School conventional Milan rural: Fringe 92.6 10.7 D
84 Harper Creek High School conventional Harper creek rural: Fringe 91.8 9.3 F
85 Potterville High School conventional potterville rural: Fringe 90.5 8.1 F
86 Airport Sr High School conventional Airport rural: Fringe 90.3 8.0 F
87 Kent City High School conventional kent city rural: Fringe 89.2 7.1 F
88 Morrice Area High School conventional Morrice rural: Fringe 89.0 6.8 F
89 Whiteford High School conventional Whiteford Agricultural rural: Fringe 88.5 6.6 F
90 Jefferson High School conventional Jefferson (Monroe) rural: Fringe 88.4 6.4 F
91 Lincoln Sr High School conventional Lincoln rural: Fringe 86.7 5.8 F
92 Buena Vista High School conventional Buena Vista rural: Fringe 82.1 3.7 F
The Michigan Public High School CAP Report Card: Sorted by Locale
Rank High School School Type District or Municipality LocaleOverall CAP Values
Score percent rank Grade
1 North Huron School† conventional north Huron rural: Distant 123.3 99.0 A
2 Jeffers High School conventional Adams township rural: Distant 115.8 97.6 A
3 Covert High School conventional covert rural: Distant 115.3 97.3 A
4 Bloomingdale Middle and High School conventional Bloomingdale rural: Distant 113.0 95.6 A
5 White Cloud High School conventional White cloud rural: Distant 111.3 94.2 A
6 Shelby High School conventional Shelby rural: Distant 110.6 93.4 A
7 Roscommon High School conventional roscommon rural: Distant 109.5 91.7 A
8 Lake City High School conventional Lake city rural: Distant 109.4 91.4 A
9 Decatur High School conventional Decatur rural: Distant 108.9 90.2 A
10 Rudyard High School conventional rudyard rural: Distant 108.8 89.8 B
11 Mason County Eastern Jr High/High School conventional Mason county eastern rural: Distant 108.1 87.6 B
12 Carsonville-Port Sanilac High School conventional carsonville-port Sanilac rural: Distant 108.0 87.5 B
13 Manton Consolidated High School conventional Manton rural: Distant 106.6 84.6 B
14 Deckerville Community High School conventional Deckerville rural: Distant 106.5 84.3 B
15 Marcellus High School conventional Marcellus rural: Distant 105.8 80.5 B
16 Hamilton High School conventional Hamilton rural: Distant 105.8 80.2 B
17 Saugatuck High School conventional Saugatuck rural: Distant 105.6 79.5 B
18 A.D. Johnston Jr/Sr High School conventional Bessemer rural: Distant 105.1 77.8 B
19 Bangor High School conventional Bangor rural: Distant 104.9 77.3 B
20 Harbor Springs High School conventional Harbor Springs rural: Distant 104.5 76.6 B
21 Johannesburg-Lewiston High School conventional Johannesburg-Lewiston rural: Distant 104.1 74.6 B
22 Kingsley Area High School conventional kingsley rural: Distant 104.0 73.8 B
23 Ubly Community High School conventional Ubly rural: Distant 103.9 73.6 B
24 Colon High School conventional colon rural: Distant 103.7 72.4 B
25 Gobles High School conventional Gobles rural: Distant 103.6 72.3 B
26 Hesperia High School conventional Hesperia rural: Distant 103.4 71.1 B
27 Farwell High School conventional Farwell rural: Distant 103.3 70.1 B
28 Brown City High School conventional Brown city rural: Distant 103.2 69.5 c
29 Mendon Middle/High School conventional Mendon rural: Distant 103.2 69.2 c
30 Onekama Middle/High School† conventional onekama rural: Distant 103.1 68.2 c
31 Fennville Public High School conventional Fennville rural: Distant 103.0 67.2 c
32 Elk Rapids High School conventional elk rapids rural: Distant 103.0 66.8 c
33 Jonesville High School conventional Jonesville rural: Distant 102.5 63.8 c
34 Morenci Area High School conventional Morenci rural: Distant 102.4 63.5 c
35 Lawrence Jr/Sr High School conventional Lawrence rural: Distant 102.3 61.9 c
36 Morley Stanwood High School conventional Morley Stanwood rural: Distant 102.2 61.6 c
37 Springport High School conventional Springport rural: Distant 102.2 61.4 c
38 Mayville High School conventional Mayville rural: Distant 102.1 60.6 c
39 Central Montcalm High School conventional central Montcalm rural: Distant 101.9 59.9 c
40 Alcona Community High School conventional Alcona rural: Distant 101.6 58.4 c
41 Saranac High School conventional Saranac rural: Distant 101.5 57.7 c
42 Centreville High School conventional centreville rural: Distant 101.5 57.4 c
43 Mason County Central High School conventional Mason county central rural: Distant 101.3 55.3 c
44 Beal City High School conventional Beal city rural: Distant 101.1 54.7 c
Mackinac Center for Public Policy
The Michigan Public High School Context and Performance Report Card 59

* Indicates not enough data were publicly available to include the school in the model.† Denotes schools that have less than four years of data publicly available, but still have enough publicly available data to be included in the model. ‡ As noted in Appendix E, several schools were erroneously listed in government tables as general education high schools and thus were originally included in the model. The subsequent removal of these schools from our graphics means that the percent rank of the school with the lowest CAP Score is not zero.
The Michigan Public High School CAP Report Card: Sorted by Locale
Rank High School School Type District or Municipality LocaleOverall CAP Values
Score percent rank Grade
45 Brimley Jr/Sr High conventional Brimley rural: Distant 101.1 54.1 c
46 Standish-Sterling Central High School conventional Standish-Sterling rural: Distant 100.9 53.3 c
47 Holton High School conventional Holton rural: Distant 100.9 53.1 c
48 East Jordan High School conventional east Jordan rural: Distant 100.7 52.1 c
49 Pewamo-Westphalia Jr/Sr High School conventional pewamo-Westphalia rural: Distant 100.3 49.6 c
50 Manchester High School conventional Manchester rural: Distant 100.2 49.2 c
51 New Lothrop High School conventional new Lothrop rural: Distant 100.1 48.6 c
52 Pinconning High School conventional pinconning rural: Distant 100.1 48.4 c
53 Suttons Bay Sr High School conventional Suttons Bay rural: Distant 100.0 47.9 c
54 Delton-Kellogg High School conventional Delton-kellogg rural: Distant 99.9 47.2 c
55 Homer Community High School conventional Homer rural: Distant 99.8 46.5 c
56 Coleman Jr/Sr High School conventional coleman rural: Distant 99.6 45.3 c
57 Yale Sr High School conventional Yale rural: Distant 99.5 44.7 c
58 Martin High School conventional Martin rural: Distant 99.5 44.5 c
59 Hopkins High School conventional Hopkins rural: Distant 99.5 44.3 c
60 Fulton High School conventional Fulton rural: Distant 99.4 43.8 c
61 Ross Beatty High School conventional cassopolis rural: Distant 99.2 42.1 c
62 Lakeview High School conventional Lakeview (Montcalm) rural: Distant 99.2 42.0 c
63 McBain High School conventional McBain rural Agricultural rural: Distant 99.2 41.8 c
64 Shepherd High School conventional Shepherd rural: Distant 99.1 40.9 c
65 River Valley High School conventional river Valley rural: Distant 98.9 39.6 c
66 North Branch High School conventional north Branch rural: Distant 98.9 39.3 c
67 Capac High School conventional capac rural: Distant 98.6 37.4 c
68 Reese High School conventional reese rural: Distant 98.6 37.2 c
69 Maple Valley Jr/Sr High School conventional Maple Valley rural: Distant 98.5 36.9 c
70 Unionville-Sebewaing High School conventional Unionville-Sebewaing rural: Distant 98.5 36.5 c
71 Olivet High School conventional olivet rural: Distant 98.5 36.4 c
72 Athens High School conventional Athens rural: Distant 98.4 36.0 c
73 Bronson Jr/Sr High School conventional Bronson rural: Distant 98.3 35.9 c
74 Ravenna High School conventional ravenna rural: Distant 98.1 35.0 c
75 Breckenridge High School conventional Breckenridge rural: Distant 97.9 34.3 c
76 Leslie High School conventional Leslie rural: Distant 97.9 34.0 c
77 Peck Jr/Sr High School conventional peck rural: Distant 97.9 33.8 c
78 Stockbridge High School conventional Stockbridge rural: Distant 97.8 33.5 c
79 Fowler High School conventional Fowler rural: Distant 97.6 32.0 c
80 Addison Jr/Sr High School conventional Addison rural: Distant 97.3 30.8 c
81 Tri County Sr High School conventional tri county rural: Distant 96.9 28.8 D
82 Reading High School conventional reading rural: Distant 96.8 28.1 D
83 Quincy High School conventional Quincy rural: Distant 96.7 27.4 D
84 Byron Area High School conventional Byron rural: Distant 96.7 27.2 D
85 Chesaning Union High School conventional chesaning Union rural: Distant 96.4 26.4 D
86 Clinton High School conventional clinton rural: Distant 96.2 25.5 D
87 Memphis High School conventional Memphis rural: Distant 96.1 25.2 D
88 Hanover-Horton High School conventional Hanover-Horton rural: Distant 96.1 24.9 D
89 Ovid-Elsie High School conventional ovid-elsie rural: Distant 96.0 24.7 D
Mackinac Center for Public Policy
The Michigan Public High School Context and Performance Report Card 60

* Indicates not enough data were publicly available to include the school in the model.† Denotes schools that have less than four years of data publicly available, but still have enough publicly available data to be included in the model. ‡ As noted in Appendix E, several schools were erroneously listed in government tables as general education high schools and thus were originally included in the model. The subsequent removal of these schools from our graphics means that the percent rank of the school with the lowest CAP Score is not zero.
The Michigan Public High School CAP Report Card: Sorted by Locale
Rank High School School Type District or Municipality LocaleOverall CAP Values
Score percent rank Grade
45 Brimley Jr/Sr High conventional Brimley rural: Distant 101.1 54.1 c
46 Standish-Sterling Central High School conventional Standish-Sterling rural: Distant 100.9 53.3 c
47 Holton High School conventional Holton rural: Distant 100.9 53.1 c
48 East Jordan High School conventional east Jordan rural: Distant 100.7 52.1 c
49 Pewamo-Westphalia Jr/Sr High School conventional pewamo-Westphalia rural: Distant 100.3 49.6 c
50 Manchester High School conventional Manchester rural: Distant 100.2 49.2 c
51 New Lothrop High School conventional new Lothrop rural: Distant 100.1 48.6 c
52 Pinconning High School conventional pinconning rural: Distant 100.1 48.4 c
53 Suttons Bay Sr High School conventional Suttons Bay rural: Distant 100.0 47.9 c
54 Delton-Kellogg High School conventional Delton-kellogg rural: Distant 99.9 47.2 c
55 Homer Community High School conventional Homer rural: Distant 99.8 46.5 c
56 Coleman Jr/Sr High School conventional coleman rural: Distant 99.6 45.3 c
57 Yale Sr High School conventional Yale rural: Distant 99.5 44.7 c
58 Martin High School conventional Martin rural: Distant 99.5 44.5 c
59 Hopkins High School conventional Hopkins rural: Distant 99.5 44.3 c
60 Fulton High School conventional Fulton rural: Distant 99.4 43.8 c
61 Ross Beatty High School conventional cassopolis rural: Distant 99.2 42.1 c
62 Lakeview High School conventional Lakeview (Montcalm) rural: Distant 99.2 42.0 c
63 McBain High School conventional McBain rural Agricultural rural: Distant 99.2 41.8 c
64 Shepherd High School conventional Shepherd rural: Distant 99.1 40.9 c
65 River Valley High School conventional river Valley rural: Distant 98.9 39.6 c
66 North Branch High School conventional north Branch rural: Distant 98.9 39.3 c
67 Capac High School conventional capac rural: Distant 98.6 37.4 c
68 Reese High School conventional reese rural: Distant 98.6 37.2 c
69 Maple Valley Jr/Sr High School conventional Maple Valley rural: Distant 98.5 36.9 c
70 Unionville-Sebewaing High School conventional Unionville-Sebewaing rural: Distant 98.5 36.5 c
71 Olivet High School conventional olivet rural: Distant 98.5 36.4 c
72 Athens High School conventional Athens rural: Distant 98.4 36.0 c
73 Bronson Jr/Sr High School conventional Bronson rural: Distant 98.3 35.9 c
74 Ravenna High School conventional ravenna rural: Distant 98.1 35.0 c
75 Breckenridge High School conventional Breckenridge rural: Distant 97.9 34.3 c
76 Leslie High School conventional Leslie rural: Distant 97.9 34.0 c
77 Peck Jr/Sr High School conventional peck rural: Distant 97.9 33.8 c
78 Stockbridge High School conventional Stockbridge rural: Distant 97.8 33.5 c
79 Fowler High School conventional Fowler rural: Distant 97.6 32.0 c
80 Addison Jr/Sr High School conventional Addison rural: Distant 97.3 30.8 c
81 Tri County Sr High School conventional tri county rural: Distant 96.9 28.8 D
82 Reading High School conventional reading rural: Distant 96.8 28.1 D
83 Quincy High School conventional Quincy rural: Distant 96.7 27.4 D
84 Byron Area High School conventional Byron rural: Distant 96.7 27.2 D
85 Chesaning Union High School conventional chesaning Union rural: Distant 96.4 26.4 D
86 Clinton High School conventional clinton rural: Distant 96.2 25.5 D
87 Memphis High School conventional Memphis rural: Distant 96.1 25.2 D
88 Hanover-Horton High School conventional Hanover-Horton rural: Distant 96.1 24.9 D
89 Ovid-Elsie High School conventional ovid-elsie rural: Distant 96.0 24.7 D
The Michigan Public High School CAP Report Card: Sorted by Locale
Rank High School School Type District or Municipality LocaleOverall CAP Values
Score percent rank Grade
90 Beaverton High School conventional Beaverton rural rural: Distant 95.9 24.2 D
91 St. Charles Community High School conventional St. charles rural: Distant 95.8 24.0 D
92 Laingsburg High School conventional Laingsburg rural: Distant 95.6 22.7 D
93 Dansville High School conventional Dansville rural: Distant 95.4 21.5 D
94 Hudson Area High School conventional Hudson rural: Distant 95.4 21.3 D
95 LakeVille High School conventional LakeVille rural: Distant 95.2 20.1 D
96 Union City High School conventional Union city rural: Distant 95.1 20.0 D
97 Pittsford Area High School conventional pittsford rural: Distant 95.0 18.6 D
98 Pickford High School† conventional pickford rural: Distant 94.4 16.8 D
99 Dryden High School conventional Dryden rural: Distant 94.1 16.1 D
100 Merrill High School conventional Merrill rural: Distant 94.1 15.9 D
101 Tri-Township School† conventional rapid river rural: Distant 94.0 15.4 D
102 Onsted Community High School conventional onsted rural: Distant 93.8 14.2 D
103 Sand Creek High School conventional Sand creek rural: Distant 93.7 14.0 D
104 North Adams High School† conventional north Adams-Jerome rural: Distant 93.6 13.0 D
105 Grant High School conventional Grant rural: Distant 92.7 11.2 D
106 Bellevue Jr/Sr High School conventional Bellevue rural: Distant 91.8 9.6 F
107 Britton-Macon Area School† conventional Britton-Macon rural: Distant 90.2 7.8 F
108 Armada High School conventional Armada rural: Distant 90.1 7.6 F
109 Grass Lake High School conventional Grass Lake rural: Distant 89.7 7.4 F
110 Summerfield High School conventional Summerfield rural: Distant 86.8 6.1 F
1 Baldwin Sr High School† conventional Baldwin rural: remote 117.9 98.1 A
2 Mio AuSable High School conventional Mio AuSable rural: remote 116.3 97.8 A
3 Benzie Central Sr High School conventional Benzie county central rural: remote 113.9 96.4 A
4 Fairview High School† conventional Fairview rural: remote 113.8 96.3 A
5 Whittemore-Prescott Area High School conventional Whittemore-prescott rural: remote 112.2 95.4 A
6 Gwinn High School conventional Gwinn rural: remote 111.5 94.6 A
7 Brethren High School conventional kaleva norman Dickson rural: remote 110.6 93.6 A
8 Forest Area High School conventional Forest rural: remote 110.4 93.2 A
9 Harbor Beach Community High School conventional Harbor Beach rural: remote 109.7 92.0 A
10 Hart High School conventional Hart rural: remote 108.2 88.3 B
11 Montabella Jr/Sr High conventional Montabella rural: remote 107.5 86.6 B
12 Central Lake Public School† conventional central Lake rural: remote 104.3 75.6 B
13 Chippewa Hills High School conventional chippewa Hills rural: remote 104.3 75.5 B
14 Vestaburg Community High School conventional Vestaburg rural: remote 104.1 74.5 B
15 Hale High School conventional Hale rural: remote 103.9 73.3 B
16 Bark River-Harris Jr/Sr High School conventional Bark river-Harris rural: remote 103.5 71.9 B
17 Frankfort High School conventional Frankfort-elberta rural: remote 103.3 70.2 B
18 Ogemaw Heights High School conventional West Branch-rose city rural: remote 103.3 69.9 c
19 Pine River High School conventional pine river rural: remote 103.0 67.3 c
20 Inland Lakes High School conventional inland Lakes rural: remote 103.0 67.0 c
21 Marlette Jr/Sr High School conventional Marlette rural: remote 102.9 66.2 c
22 Laker High School conventionalelkton-pigeon-Bay port Laker
rural: remote 102.9 65.8 c
Mackinac Center for Public Policy
The Michigan Public High School Context and Performance Report Card 61

* Indicates not enough data were publicly available to include the school in the model.† Denotes schools that have less than four years of data publicly available, but still have enough publicly available data to be included in the model. ‡ As noted in Appendix E, several schools were erroneously listed in government tables as general education high schools and thus were originally included in the model. The subsequent removal of these schools from our graphics means that the percent rank of the school with the lowest CAP Score is not zero.
The Michigan Public High School CAP Report Card: Sorted by Locale
Rank High School School Type District or Municipality LocaleOverall CAP Values
Score percent rank Grade
23 Hillman Community Jr/Sr High School† conventional Hillman rural: remote 102.1 60.4 c
24 Pellston Middle/High School conventional pellston rural: remote 101.7 58.7 c
25 Maple City-Glen Lake Jr/Sr High School conventional Glen Lake rural: remote 101.6 58.5 c
26 Forest Park School conventional Forest park rural: remote 100.9 53.0 c
27 Onaway Sr High School conventional onaway rural: remote 100.9 52.8 c
28 Mesick Consolidated Jr/Sr High School conventional Mesick rural: remote 100.8 52.3 c
29 Evart High School conventional evart rural: remote 99.9 47.0 c
30 Munising High and Middle School conventional Munising rural: remote 99.4 44.0 c
31 Baraga Area High School conventional Baraga rural: remote 98.9 39.9 c
32 Camden-Frontier High School† conventional camden-Frontier rural: remote 98.1 35.2 c
33 Bellaire Middle/High School conventional Bellaire rural: remote 97.7 32.8 c
34 Ontonagon Area Jr/Sr High School conventional ontonagon rural: remote 96.9 28.6 D
35 Stephenson High School conventional Stephenson rural: remote 96.4 26.1 D
36 L'Anse High School conventional L'Anse rural: remote 94.9 18.1 D
37 Kingston High School conventional kingston rural: remote 94.5 16.9 D
38 Marion High School conventional Marion rural: remote 93.9 15.1 D
Mackinac Center for Public Policy
The Michigan Public High School Context and Performance Report Card 62

Appendix A: Notes on Testing Other Variables and Data Integrity
The ideal model is simple and has strong explanatory power. As discussed in the main text, the model’s primary variable is a scaled free-and-reduced-price- lunch count (“FRL”), which serves as a proxy for socioeconomic status. We did, however, consider other demographic variables.
For instance, female students have been found to outperform male students on some standardized tests.38 Accordingly, we tested a variable representing a school’s percentage of female students, but found that the variable did not add significantly to the model’s explanatory power (see Graphic 17).
In addition, studies have documented achievement gaps between white and black students and between white and Hispanic students (though these gaps may be narrowing).39 We therefore tested a variable that represented a school’s percentage of white students. As with the variable for the percentage of female students, we found that accounting for the percentage of white students did not add significantly to the model’s explanatory power. We found the same for a variable representing the percentage of white female students.40
We also tested a school size variable. School size presents an interesting variable because the relationship to student achievement would likely be nonlinear: Larger schools may have more resources with which to improve performance; smaller schools, on the other hand, may be better able to adapt to the learning needs of individual students. We tested to see if there was a significant nonlinear relationship between school size and performance. After controlling for the school’s FRL ratio, we found limited significant relationships.
As found in columns (1) through (5) of Graphic 17, the inclusion of the additional regressors based on sex, race and school size improves the model’s predictive power, and an examination of the significance levels of the additional regressor coefficients shows some variables are significant at the 5 percent level. Nevertheless, the improvements in predictive power are marginal, and including the additional variables would have only increased the model’s complexity for little measurable gain. Hence, we excluded these variables from the model. FRL is the dominant variable in any case.41
41 As shown in Graphic 17, our model produced an R-squared value of 0.64 using just FRL counts. Full regression results are available on request.
38 catherine e. Freeman, “trends in educational equity of Girls & Women: 2004,”(U.S. Department of education, national center for education Statistics, 2005), http://goo.gl/4Yb95 (accessed June 27, 2012).
39 The Black-White Test Score Gap, eds. christopher Jencks and Meredith phillips (the Brookings institution, 1998).
40 Another demographic variable that is sometimes considered is the percentage of “english Language Learners.” See, for instance, Grover J. Whitehurst and Michelle croft, “the Harlem children’s Zone, promise neighborhoods, and the Broader, Bolder Approach to education,”(the Brookings institution, 2010), http://goo.gl/aeJwc (accessed June 27, 2012). eLL data are not publicly available for individual Michigan high schools, however. eLL is also an administrative categorization that may be prone to subjective biases from school to school.
41 As shown in Graphic 17, our model produced an average adjusted r-squared value of 0.64 using just FrL counts. Full regression results are available on request.
The Michigan Public High School Context and Performance Report Card 63
Mackinac Center for Public Policy

Graphic 17: Adjusted R-Squared Values for Various Context and Performance Models
Context and Performance Models
Adjusted R-square values
Test YearBase model
(1)
+ percentage White
(2)
+ percentage Female
(3)
+ percentage White and percentage Female
(4)
+ School Size Variables
(5)
ACT® 2008 0.58 0.61 0.58 0.61 0.58
2009 0.64 0.65 0.66 0.67 0.65
2010 0.71 0.71 0.71 0.72 0.71
2011 0.70 0.71 0.71 0.73 0.70
Math 2008 0.56 0.64 0.56 0.64 0.56
2009 0.65 0.69 0.66 0.70 0.66
2010 0.66 0.71 0.66 0.72 0.66
2011 0.63 0.67 0.64 0.68 0.64
Reading 2008 0.59 0.63 0.60 0.64 0.59
2009 0.69 0.70 0.70 0.71 0.69
2010 0.68 0.69 0.68 0.70 0.68
2011 0.68 0.70 0.70 0.72 0.69
Science 2008 0.60 0.69 0.60 0.69 0.60
2009 0.68 0.72 0.68 0.73 0.68
2010 0.69 0.74 0.69 0.75 0.69
2011 0.68 0.74 0.69 0.75 0.69
Writing 2008 0.55 0.56 0.56 0.58 0.56
2009 0.61 0.61 0.63 0.63 0.61
2010 0.63 0.63 0.64 0.65 0.63
2011 0.59 0.60 0.62 0.63 0.59
Social Studies 2008 0.59 0.64 0.59 0.65 0.59
2009 0.67 0.69 0.67 0.70 0.67
2010 0.69 0.72 0.69 0.72 0.69
2011 0.67 0.71 0.67 0.71 0.67
Average 0.64 0.67 0.65 0.68 0.64
The Michigan Public High School Context and Performance Report Card 64
Mackinac Center for Public Policy
The Arkansas study also included several other variables: the median household income of families with school-age children in a school district; the percentage of school district residents over the age of 25 with at least a high school diploma; the percentage of school district residents over the age of 25 with at least a bachelor’s degree; and the percentage of married parents among the district’s families with school-age children.42 Although some of these variables were found to have a statistical relationship to student performance in the Arkansas study,43 we were unable to test them in Michigan because these data are not available.
The Arkansas study also tested whether per-pupil district operating expenditures affected student performance. No statistically significant relationship was found.44 This result is consistent with most findings in the research literature.45 Hence, we did not test this variable.
In the end, we adopted a simplified model that includes only the FRL index as a primary explanatory variable.
Regarding data integrity: All unavailable records were set either with “unknown” values (when data were not reported due to small sample size) or with “missing” values when missing. The distributions of the various variable values were then examined for outliers and potentially impossible values. None of the variables used in this study exhibited any issues.
42 Greene et al., “The School Performance Index in Arkansas,”(University of Arkansas, 2006), 2-3, http://goo.gl/OGlrQ (accessed March 1, 2012).43 Ibid., ii.44 Ibid.45 See, for instance, Eric Hanushek, “Assessing the Effects of School Resources on Student Performance: An Update,” Educational Evaluation and Policy Analysis 19, no. 2 (1997): 145 http://goo.gl/cuUEL (accessed July 9, 2012). Note also that per-pupil district operating expenditures may not reflect per-pupil school operating expenditures. Dennis J. Condron and Vincent J. Ro-scigno, “Disparities Within: Unequal Spending and Achievement in an Urban School District,” Sociology of Education 76, no. 1 (2003) http://goo.gl/smi2S (accessed July 9, 2012).no. 1 (2003
42 Greene et al., “the School performance index in Arkansas,”(University of Arkansas, 2006), 2-3, http://goo.gl/oGlrQ (accessed March 1, 2012).
43 ibid., ii.
44 ibid.
45 See, for instance, eric Hanushek, “Assessing the effects of School resources on Student performance: An Update,” Educational Evaluation and Policy Analysis 19, no. 2 (1997): 145, http://goo.gl/cuUeL (accessed July 9, 2012). note also that per-pupil district operating expenditures may not reflect per‑pupil school operating expenditures. Dennis J. condron and Vincent J. roscigno, “Disparities Within: Unequal Spending and Achievement in an Urban School District,” Sociology of Education 76, no. 1 (2003) http://goo.gl/smi2S (accessed July 9, 2012).
The Michigan Public High School Context and Performance Report Card 65
Mackinac Center for Public Policy

46 See “Appendix c: Free and reduced-price Lunch Weights” for more detail.
Appendix B: Calculating CAP Scores and Letter Grades
Calculating CAP Scores
The CAP Score provides an indicator of school performance while controlling for characteristics of the high school. In our analysis, we use both average student performance on the ACT® and Michigan benchmark exams as our primary indicators of student achievement. The various exams have different distributions, and therefore we first adjust the distribution of each exam for each year such that it has a mean of 100 and a standard deviation of 15. More specifically:
Adjusted Performance = 100 + 15 [(School Avg. — State Avg.)]Std. Dev. of State Avg.
The CAP Score is a measure intended to control for the performances of schools while controlling for its characteristics with the use of a regression model (Greene et al, 2006). We control for the proportion of students that qualify for free or reduced price lunch (FRL), allowing us to assess the performance of a high school given its demographics. In order to do this, we run ordinary least squares regressions with schools’ test scores as the dependent variable and an FRL index as the independent variable:
Adj_Perfs,t = β0 + β1FRLs,t + μs,t (1)
where Adj_Perfs,t is the average test score at school s in year t,
β0 is a constant,
β1 is the estimated impact of FRL index on a school’s average score,
FRLs,t is an index that weights FRL student counts according to the percentage of students eligible for free lunch and reduced-price lunch at school s in year t,46 and
µs,t is the error term.
The regression outlined in (1) allows us to control for the contribution that FRL percentage has on school achievement. For example, if the coefficient on the FRL index is 0.01, the score for a school with a 100 on the FRL index is on average one point lower than the score for a school with a 0 on the FRL index. If a school with a 100 FRL index obtains a score that is the same as the statewide average, then it would have a residual score of +1.0, since this school scored one point higher than predicted based on the regression coefficient for FRL. After obtaining the coefficient estimates from these regressions, we compare a school’s actual performance relative to the performance “predicted” by the regression.
The Michigan Public High School Context and Performance Report Card 66
Mackinac Center for Public Policy

A school’s CAP Score is determined by dividing the school’s actual performance by its predicted performance and multiplying by 100:
CAP Score = 100 * Actual Performance
Predicted Performance
Therefore, schools that have a CAP Score over 100 perform better than predicted relative to other schools, and schools that score lower than 100 perform worse than predicted relative to other schools. A school’s average CAP Score for a given test (e.g., the ACT®) is its average CAP Score across years of available data.
Assigning Letter Grades
High schools are assigned letter grades for each test based on average CAP Scores across years. CAP Scores are based on performances relative to predicted expectations, and the regression coefficients and residuals are affected by the schools’ performances relative to other schools. Therefore, high school grades are assigned based on a bell curve:
Grade Percentage of Schools
A 10
B 20
c 40
D 20
F 10
CAP Scores for test levels are then averaged across years. High schools are assigned a letter grade for average scores based on the same bell curve provided in the table above. For example:
School Year TestCAP Values
Score Grade
A.D. Johnston Jr/Sr High School 2008 Act® 101.3 c
A.D. Johnston Jr/Sr High School 2009 Act® 110.8 A
A.D. Johnston Jr/Sr High School 2010 Act® 105.3 B
A.D. Johnston Jr/Sr High School 2011 Act® 100.7 c
A.D. Johnston Jr/Sr High School Average ACT® 104.5 B
The Michigan Public High School Context and Performance Report Card 67
Mackinac Center for Public Policy
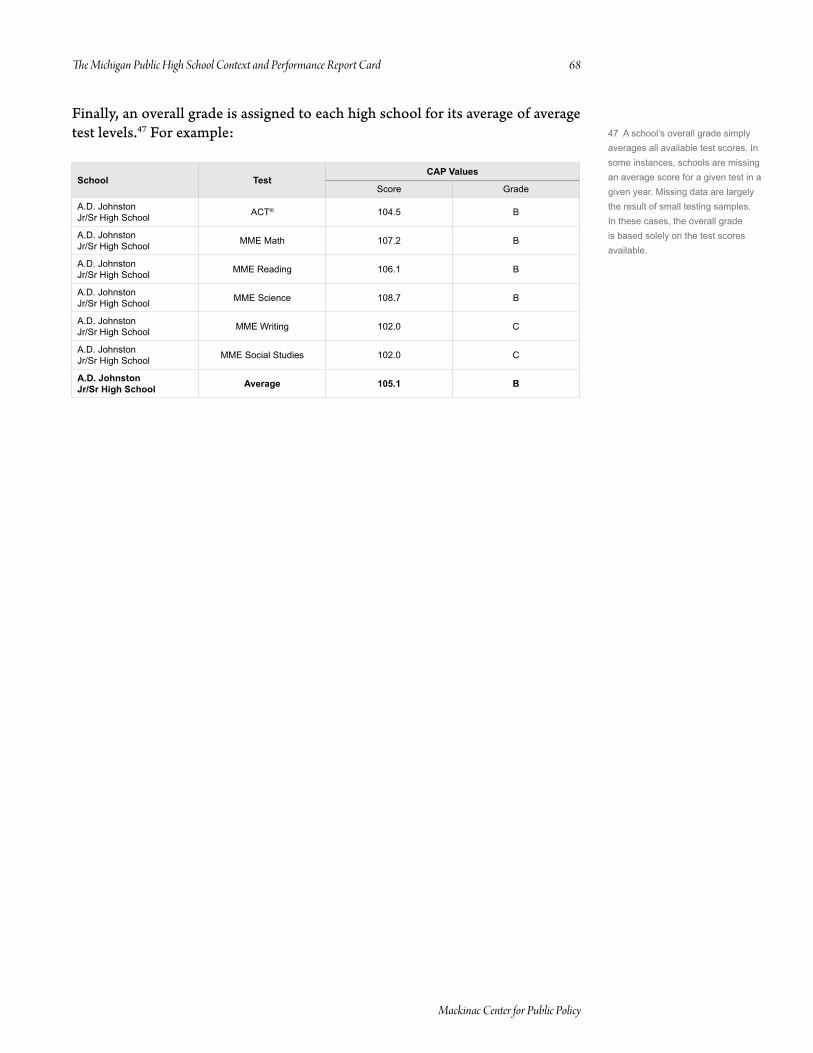
Finally, an overall grade is assigned to each high school for its average of average test levels.47 For example:
School TestCAP Values
Score Grade
A.D. Johnston Jr/Sr High School Act® 104.5 B
A.D. Johnston Jr/Sr High School MMe Math 107.2 B
A.D. Johnston Jr/Sr High School MMe reading 106.1 B
A.D. Johnston Jr/Sr High School MMe Science 108.7 B
A.D. Johnston Jr/Sr High School MMe Writing 102.0 c
A.D. Johnston Jr/Sr High School MMe Social Studies 102.0 c
A.D. Johnston Jr/Sr High School Average 105.1 B
47 A school’s overall grade simply averages all available test scores. in some instances, schools are missing an average score for a given test in a given year. Missing data are largely the result of small testing samples. in these cases, the overall grade is based solely on the test scores available.
The Michigan Public High School Context and Performance Report Card 68
Mackinac Center for Public Policy

Appendix C: Free and Reduced-Price Lunch Weights
We have created a new FRL measure that takes advantage of the fact that the data include both free- and reduced-lunch school head counts. The new measure reweights the counts by multiplying free-lunch eligible students by 2 and reduced-lunch eligible students by 1.48
Specifically:
New FRL Index =
100 * [2 * (Free-Lunch Eligible) + 1 * (Reduced-Lunch Eligible)]
Total School Head Count
Whereas the original FRL percentage variable ranges from 0 to 100, the New FRL Index ranges from 0 to 200, where a school that is 100 percent composed of free-lunch eligible students has a value of 200.
To see the benefit of this measure, consider two hypothetical schools:
School Free-lunch % Reduced-lunch % FRL % New FRL Index
School A 0 75 75 75
School B 75 0 75 150
Whereas School A and School B look identical by the FRL percentage measure, the FRL Index highlights that School B is serving a more disadvantaged student body. The regression results indicate that this new measure improves the model’s explanatory power. Results with the alternative, more traditional measure of FRL percentage are available on request.
48 this methodology is also used here: “2011 Arkansas Benchmark test results: District by District Scores,” (University of Arkansas: Office for education policy, 2011), http://goo.gl/Sz910 (accessed July 2, 2012).
The Michigan Public High School Context and Performance Report Card 69
Mackinac Center for Public Policy

Appendix D: Regression Results
To calculate the CAP Scores, we made use of a linear regression that predicts school performance while controlling for a school’s percentage of students eligible for free or reduced-price lunches under the National School Lunch Program. In general, our regression results indicate a statistically significant negative relationship between the percentage of FRL-eligible students and standardized test scores for 11th-graders. This process allows us to adjust a high school’s performance to account for the socioeconomic status of its student population.
Graphic 18 shows the coefficient estimates for the model. In general, the model does a better job of explaining the variations in the data after 2008 (see the adjusted R-squared values).49
Graphic 18: Coefficient Estimates for Model
School Year
Test 2008 2009 2010 2011
ACT®
Coefficient Estimate
constant 117.92* 120.23* 123.72* 124.61*
(0.91) (0.89) (0.81) (0.84)
FrL Scale -0.31* -0.31* -0.31* -0.31*
(0.01) (0.01) (0.01) (0.01)
Additional information
n 572 578 585 591
Adjusted r-square 0.58 0.64 0.71 0.70
Math
Coefficient Estimate
constant 117.73* 120.47* 123.01* 123.49*
(0.95) (0.78) (0.81) (0.83)
FrL Scale -0.31* -0.31* -0.31* -0.29*
(0.02) (0.01) (0.01) (0.01)
Additional information
n 558 563 576 590
Adjusted r-square 0.56 0.65 0.66 0.63
Reading
Coefficient Estimate
constant 118.21* 120.98* 123.32* 124.36*
(0.91) (0.74) (0.82) (0.76)
FrL Scale -0.31* -0.32* -0.31* -0.30*
(0.02) (0.01) (0.01) (0.01)
Additional information
n 558 564 576 590
49 this period from 2008 through 2011 corresponded to a 24 percent increase in the percentage of Michigan public school students who (according to the public school districts in which they were enrolled) qualified for an NSLP free or reduced‑price lunch. Authors’ calculations based on “Free and reduced Lunch counts,” (center for educational performance and information, 2012), http://goo.gl/Lf21Y (accessed July 9, 2012). Since the relationship between FrL and performance remained stable, the higher proportion of FrL-eligible students may explain the increases in the explanatory power of the model.
The Michigan Public High School Context and Performance Report Card 70
Mackinac Center for Public Policy

School Year
Test 2008 2009 2010 2011
Adjusted r-square 0.59 0.69 0.68 0.68
Science
Coefficient Estimate
constant 118.35* 120.83* 123.53* 124.31*
(0.90) (0.71) (0.74) (0.75)
FrL Scale -0.32* -0.32* -0.31* -0.30*
(0.02) (0.01) (0.01) (0.01)
Additional information
n 557 564 577 590
Adjusted r-square 0.60 0.68 0.69 0.68
Writing
Coefficient Estimate
constant 117.57* 119.75* 122.47* 122.68*
(0.96) (0.85) (0.90) (0.92)
FrL Scale -0.30* -0.30* -0.30* -0.28*
(0.02) (0.01) (0.01) (0.01)
Additional information
n 557 565 578 591
Adjusted r-square 0.55 0.61 0.63 0.59
Social Studies
Coefficient Estimate
constant 118.21* 120.76* 123.54* 124.07*
(0.91) (0.78) (0.73) (0.79)
FrL Scale -0.31* -0.32* -0.31* -0.30*
(0.01) (0.01) (0.01) (0.01)
Additional information
n 558 563 576 590
Adjusted r-square 0.59 0.67 0.69 0.67
* Denotes significance at the 1 percent level.
Notes: Robust standard errors are presented in parentheses.
The Michigan Public High School Context and Performance Report Card 71
Mackinac Center for Public Policy

Appendix E: Filtering the List of Michigan Public High Schools
In developing the Context and Performance Report Card, we attempted to include only those Michigan public high schools whose primary purpose was providing general education. We attempted to exclude high schools that served, for example, only students with disabilities or students at risk of dropping out of school. Including data from such specialized high schools would compare too many “apples to oranges” and weaken the results for the statistical model.
Data from the National Center for Education Statistics were used initially to identify and exclude schools that were not primarily engaged in general education.50 Of the 967 public high schools for which there were 2011 MME scores, 714 had a “school type” labeled “regular school.” Schools labeled “alternative/other school,” “vocational school” and “special education school” were removed from the data set. We also removed another eight schools that were not labeled as “alternative/other school” by NCES, but were easily identifiable as such.
After these adjustments, we counted 706 “regular” public high schools in Michigan. We then re-examined the NCES dataset and removed 22 more high schools that had identified their “school emphasis” as either “alternative education” or “special education.”
Of the remaining 684 schools, 92 did not have enough data from 2008 to 2011 to be used in the statistical model. Upon review, and after phoning some of these 92 schools, we concluded that 17 of them are alternative high schools. These 17 schools are not listed in the CAP Report Card in Appendix A, while the other 75 high schools are, though they are identified as having insufficient data to receive CAP Scores. In the end, while 667 public high schools appear in Appendix A, only 592 were included in the statistical model for the CAP Report Card.
After examining the results of the model, we called a number of schools whose names suggested their primary focus was not general education. Of these, seven schools were later confirmed by school officials themselves to be special education or alternative schools, even though they were not identified as such in the NCES data. The seven schools were: AdvancePath Academy, Battle Creek Area Learning Center, Butcher Community Center, Community Middle/Community High School, Schools of Choice, Southfield Regional Academic Campus and Trillium Academy.
The results for these seven schools, although included in the model, are not displayed in the CAP Report Card. Hence, with all filtering complete, the CAP Report Card displays results for 585 public high schools.
50 “Common Core of Data: Build a Table,” (U.S. Department of Education: National Center for Education Statistics), http://nces.ed.gov/ccd/bat/ (accessed May 15, 2012).
50 “common core of Data: Build a table,” (U.S. Department of education: national center for education Statistics), http://nces .ed.gov/ccd/bat (accessed May 15, 2012).
The Michigan Public High School Context and Performance Report Card 72
Mackinac Center for Public Policy
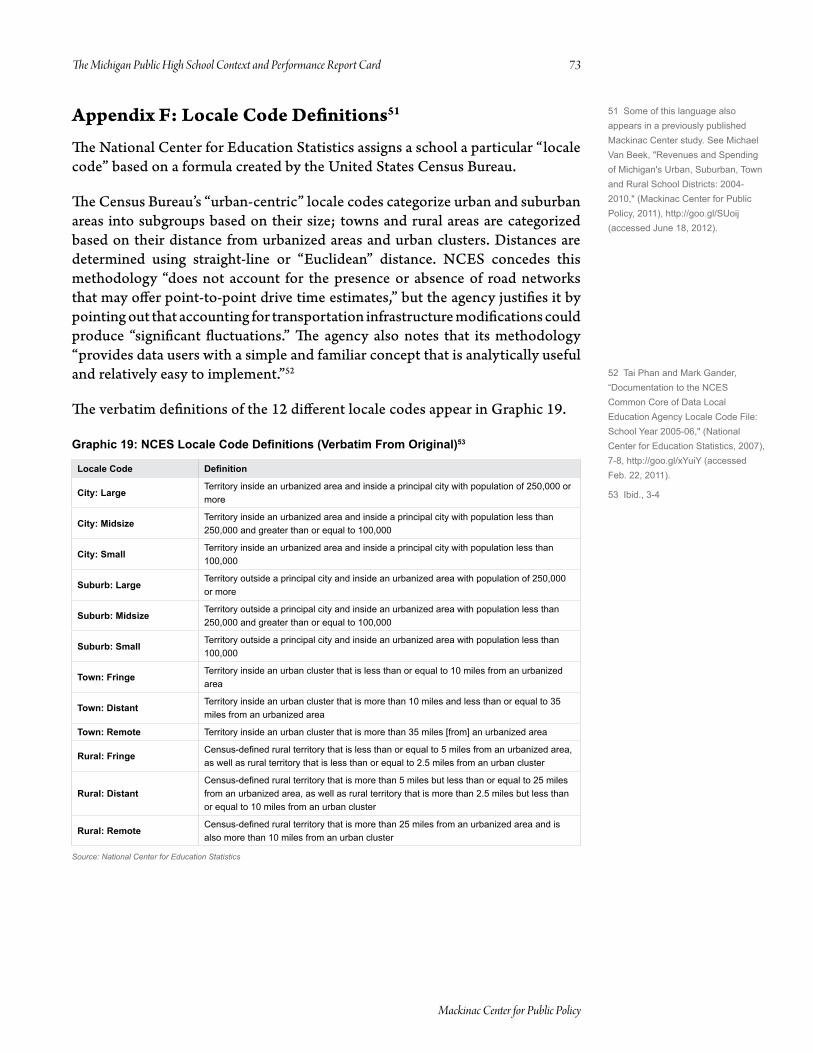
Appendix F: Locale Code Definitions51
The National Center for Education Statistics assigns a school a particular “locale code” based on a formula created by the United States Census Bureau.
The Census Bureau’s “urban-centric” locale codes categorize urban and suburban areas into subgroups based on their size; towns and rural areas are categorized based on their distance from urbanized areas and urban clusters. Distances are determined using straight-line or “Euclidean” distance. NCES concedes this methodology “does not account for the presence or absence of road networks that may offer point-to-point drive time estimates,” but the agency justifies it by pointing out that accounting for transportation infrastructure modifications could produce “significant fluctuations.” The agency also notes that its methodology “provides data users with a simple and familiar concept that is analytically useful and relatively easy to implement.”52
The verbatim definitions of the 12 different locale codes appear in Graphic 19.
Graphic 19: NCES Locale Code Definitions (Verbatim From Original)53
Locale Code Definition
City: Largeterritory inside an urbanized area and inside a principal city with population of 250,000 or more
City: Midsizeterritory inside an urbanized area and inside a principal city with population less than 250,000 and greater than or equal to 100,000
City: Smallterritory inside an urbanized area and inside a principal city with population less than 100,000
Suburb: Largeterritory outside a principal city and inside an urbanized area with population of 250,000 or more
Suburb: Midsizeterritory outside a principal city and inside an urbanized area with population less than 250,000 and greater than or equal to 100,000
Suburb: Smallterritory outside a principal city and inside an urbanized area with population less than 100,000
Town: Fringeterritory inside an urban cluster that is less than or equal to 10 miles from an urbanized area
Town: Distantterritory inside an urban cluster that is more than 10 miles and less than or equal to 35 miles from an urbanized area
Town: Remote territory inside an urban cluster that is more than 35 miles [from] an urbanized area
Rural: FringeCensus‑defined rural territory that is less than or equal to 5 miles from an urbanized area, as well as rural territory that is less than or equal to 2.5 miles from an urban cluster
Rural: DistantCensus‑defined rural territory that is more than 5 miles but less than or equal to 25 miles from an urbanized area, as well as rural territory that is more than 2.5 miles but less than or equal to 10 miles from an urban cluster
Rural: RemoteCensus‑defined rural territory that is more than 25 miles from an urbanized area and is also more than 10 miles from an urban cluster
Source: National Center for Education Statistics
51 Some of this language also appears in a previously published Mackinac center study. See Michael Van Beek, "revenues and Spending of Michigan's Urban, Suburban, town and rural School Districts: 2004-2010," (Mackinac center for public policy, 2011), http://goo.gl/SUoij (accessed June 18, 2012).
52 tai phan and Mark Gander, “Documentation to the nceS common core of Data Local education Agency Locale code File: School Year 2005-06," (national center for education Statistics, 2007), 7-8, http://goo.gl/xYuiY (accessed Feb. 22, 2011).
53 ibid., 3-4
The Michigan Public High School Context and Performance Report Card 73
Mackinac Center for Public Policy
NCES uses the following definitions to clarify the terms contained in Graphic 19 (verbatim from original):54
Principal City: Principal cities are large places that serve as the primary population and employment centers within a county or counties associated with at least one core area of 10,000 or greater population, or “Core Based Statistical Area.”55
Urban (urbanized area and urban clusters): An urban area is a densely settled core of Census Bureau-defined census block groups and census blocks that meet minimum population density requirements. A core area that contains a population of 50,000 or more is classified as an “urbanized area,” and a core area with a population between 2,500 and 50,000 is classified as an “urban cluster.”
Rural: All population and territory not included in an urbanized area or urban cluster.
54 Ibid., 9-10.55 “Metropolitan and Micropolitan Statistical Areas,” (U.S. Census Bureau, 2010), http://goo.gl/msvre (accessed Feb. 23, 2011).
54 ibid., 9-10.
55 “Metropolitan and Micropolitan Statistical Areas,” (U.S. census Bureau, 2010), http://goo.gl/msvre (accessed Feb. 23, 2011).
The Michigan Public High School Context and Performance Report Card 74
Mackinac Center for Public Policy

The Michigan Public High School Context and Performance Report Card 75
Mackinac Center for Public Policy
About the Authors
Michael Van Beek is director of education policy at the Mackinac Center for Public Policy, where he oversees the Center’s education research and publications. His analysis and commentary has been published in The Wall Street Journal, The Detroit News, the Detroit Free Press, The Grand Rapids Press and The Oakland Press, among other newspapers. Van Beek obtained his Master of Arts in American history in 2005 from Purdue University, where he also held teaching assistantships. He received his Bachelor of Arts in 2003 from Hope College.
Daniel Bowen is a Ph.D. candidate in education policy and a distinguished doctoral fellow at the University of Arkansas. Bowen received his Bachelor of Arts in political science and Master of Education from the University of Notre Dame. He has published and presented research on school accountability, school choice and the value of noncore school subjects and extracurricular activities.
Jonathan Mills is a doctoral academy fellow studying education policy at the University of Arkansas. Mills received his Bachelor of Science and Master of Arts in economics from the University of Missouri.
Acknowledgments
The authors would like to acknowledge the following people for their assistance:
• Marc Holley, Ph.D., evaluation unit director, Walton Family Foundation
• Dr. Matthew Ladner, senior advisor of policy and research, Foundation for Excellence in Education
• Jay P. Greene, Ph.D., endowed chair and head of the Department of Education Reform, University of Arkansas
• Andrew J. Coulson, director of the Center for Educational Freedom, Cato Institute, and adjunct scholar, Mackinac Center for Public Policy
• Lindsey Dodge, assistant editor, Mackinac Center
• Audrey Spalding, education policy analyst, Mackinac Center
• Christina Bolema, Mackinac Center communications intern
• Victoria Hechtman, Mackinac Center communications intern
• Evan Burgess, Mackinac Center graphics intern
Although these individuals helped significantly with this study, any errors in the report are the responsibility of the authors alone.
The Michigan Public High School Context and Performance Report Card 76
Mackinac Center for Public Policy
Dr. Paul McCrackenUniversity of Michigan (ret.)
Charles MeiserLake Superior State University (ret.)
Glenn MootsNorthwood University
Dr. George Nastas IIIMarketing Consultants
Dr. John PaffordNorthwood University
Dr. Mark PerryUniversity of Michigan - Flint
Lawrence W. ReedFoundation for Economic Education
Gregory RehmkeEconomic Thinking/ E Pluribus Unum Films
Dr. Steve SafranekAve Maria School of Law
Dr. Howard SchwartzOakland University
Dr. Martha SegerFederal Reserve Board (ret.)
James SheehanDeutsche Bank Securities
Rev. Robert SiricoActon Institute for the Study of Religion and Liberty
Dr. Bradley SmithCapital University Law School
Clifford TaylorFormer Chief Justice of Michigan Supreme Court
Dr. John TaylorWayne State University
Dr. Richard K. VedderOhio University
Prof. Harry Veryser Jr.University of Detroit Mercy
John Walter Jr.Dow Corning Corporation (ret.)
Dr. William WilsonEconomic Consultant
Mike WintherInstitute for Principle Studies
Dr. Gary WolframHillsdale College
BOARD OF DIRECTORS BOARD OF SCHOLARS
Dr. Donald AlexanderWestern Michigan University
Dr. William AllenMichigan State University
Dr. Thomas BertonneauWriter and Independent Scholar
Dr. Brad BirzerHillsdale College
Dr. Peter BoettkeGeorge Mason University
Dr. Theodore BolemaAnderson Economic Group
Dr. Stephen ColarelliCentral Michigan University
Andrew CoulsonCato Institute
Robert CrownerEastern Michigan University (ret.)
Dr. Richard CutlerUniversity of Michigan (ret.)
Dr. Jefferson EdgensMorehead State University
Dr. David FelbeckUniversity of Michigan (ret.)
Dr. Burton FolsomHillsdale College
Dr. Wayland GardnerWestern Michigan University (ret.)
John GretherNorthwood University
Dr. Michael HeberlingBaker College
Dr. Ormand HookMecosta-Osceola Intermediate School District
Robert HunterMackinac Center for Public Policy
Prof. Harry HutchisonMason School of Law
Dr. David JandaInstitute for Preventative Sports Medicine
Annette KirkRussell Kirk Center for Cultural Renewal
David LittmannMackinac Center for Public Policy
Dr. Dale MatcheckNorthwood University
D. Joseph Olson, ChairmanRetired Senior Vice President and General Counsel, Amerisure Companies
Joseph G. Lehman, PresidentMackinac Center for Public Policy
Joseph J. Fitzsimmons Retired President, University Microfilms
Dulce M. Fuller Owner, Woodward and Maple
Richard G. Haworth Chairman Emeritus, Haworth, Inc.
Kent B. HerrickPresident and CEO, Thermogy
J.C. Huizenga President, Westwater Group
Phil F. Jenkins Chairman, Sweepster Inc.
R. Douglas Kinnan Senior Vice President and CFO, Amerisure Insurance
Edward C. Levy Jr. President, Edw. C. Levy Co.
Rodney M. Lockwood Jr.President, Lockwood Construction Company, Inc.
Joseph P. Maguire President, Wolverine Development Corporation
Richard D. McLellan Attorney, McLellan Law Offices
Hon. Clifford W. Taylor Retired Chief Justice, Michigan Supreme Court

© 2012 Mackinac center for public policy, Midland, Michigan
iSBn: 978-1-890624-80-4 | S2012-05
140 West Main Street p.o. Box 568 Midland, Michigan 48640
989-631-0900 Fax 989-631-0964 www.mackinac.org [email protected]
the Mackinac center for public policy is dedicated to improving the understanding of economic and political
principles among citizens, public officials, policymakers and opinion leaders. The Center has emerged as one of the
largest and most prolific of the more than 50 state‑based free‑market “think tanks” in America. Additional information
about the Mackinac center and its publications can be found at www.mackinac.org.
Additional copies of this report are available for order from the Mackinac center.
For more information, call 989-631-0900, or see our website, www.mackinac.org.
Michael Van Beek is director of education policy at the Mackinac Center for Public Policy. His analysis and commentary has been published in The Wall Street Journal, The Detroit News, the Detroit Free Press, The Grand Rapids Press, The Oakland Press and elsewhere. Van Beek obtained his Master of Arts in American history from Purdue University and his Bachelor of Arts in history from Hope College.
Daniel Bowen is a Ph.D. candidate in education policy and a distinguished doctoral fellow at the University of Arkansas. Bowen received his Bachelor of Arts in political science and Master of Education from the University of Notre Dame. He has published and presented research on school accountability, school choice and the value of noncore school subjects and extracurricular activities.
Jonathan Mills is a doctoral academy fellow studying education policy at the University of Arkansas. Mills received his Bachelor of Science and Master of Arts in economics from the University of Missouri.