the michigan natural resources business plan: leveraging our assets to make michigan a top ten state
TRANSCRIPT

Executive Summary
MICHIGAN NATURAL RESOURCES BUSINESS PLAN:
LEVERAGING OUR ASSETS TO MAKE MICHIGAN A TOP TEN STATE
July, 2015

2
PREPARED FOR
Business Leaders for MichiganDetroit, Michigan
SUBMITTED BY
Public Sector Consultants Inc.Lansing, Michiganwww.pscinc.com
IN PARTNERSHIP WITH
Sustainable Water WorksNovi, Michiganwww.sustainablewaterworks.org

3
CONTENTS
EXECUTIVE SUMMARY
Research Approach and Findings Potential Growth Strategies
BACKGROUND AND METHODOLOGY
Overview of the Project Approach
OVERVIEW OF MICHIGAN’S NATURAL RESOURCE ECONOMY
What Industries Make Up Michigan’s Natural Resource Economy? Other Ways Natural Resources Play a Part in Michigan’s Economy
ISSUES AND OPPORTUNITIES IDENTIFIED IN THE RESEARCH
Literature and Industry Expert Interview Findings Economic Position and Opportunities
GROWTH POTENTIAL AND OPPORTUNITIES FOR
MICHIGAN’S NATURAL RESOURCE INDUSTRIES
Natural Resources Sector Strengths, Weaknesses, Opportunities, and Threats Recommended Industry Priorities Potential Growth Strategies
CONCLUSIONS
REFERENCES
APPENDIX A: COMPLETE PROJECT METHODOLOGY
APPENDIX B: STAKEHOLDERS ENGAGED IN THE PROJECT
APPENDIX C: NAICS CODES INCLUDED IN ECONOMIC ANALYSIS
APPENDIX D: REGIONAL CEDS PRIORITIES
APPENDIX E: REGIONAL SALES AND EXPORTS, 2012
APPENDIX F: COMPARISON OF STATES
BY NATURAL RESOURCE CATEGORIES
APPENDIX G: SHIFT SHARE AND LOCATION QUOTIENT ANALYSIS
04
0406
07
0707
09
0911
12
1218
24
242830
32
33
36
39
40
42
43
45
49

4Executive Summary
EXTRACTION INDUSTRIES
Industries that involve the extraction of raw materials from the earth for consumer use. Michigan extraction indistries include mining, oil and gas, and water (as a product).
PRODUCTION INDUSTRIES
Businesses that are producing and/or using natural resources to renewably produce new products. In Michigan, relevant examples are agriculture, forestry, and renewable energy.
EXECUTIVE SUMMARY
AESTHETIC INDUSTRIES
Natural resource industries that are built upon or enhance people’s appreciation for beauty and the natural landscape. The primary aesthet-ic-based industries in Michigan are tourism and outdoor recreation.
CROSS-SECTOR SUPPORT INDUSTRIES AND RESEARCH
Cross-sector businesses or organizations that support our understanding, use, and/or protection of natural resources or transport natural resource products within and between Michigan and other markets. Examples include natural resources and science research institutions, environmental consulting organizations, and Great Lakes and inland shipping.
Michigan is blessed with abundant and diverse natural resources, which are a significant part of the state’s culture, history, identity, and economy. Our natural resources attract visitors, residents, and businesses to the state. Natural resources are grown, extracted, and used raw in the development of secondary products that are processed here and exported to other states and globally. We use natural resources, particularly water, as part of the process for many of our other critical industries, including Michigan’s manufacturing and energy sectors. Water is also key to our tourism and recreation econo-mies. In both the academic and business research and development sectors, Michigan has a strong base of intellectual resources that fuel innovation and contribute to the state’s potential to capitalize on its natural resource economy.
RESEARCH APPROACH AND FINDINGS
Public Sector Consultants (PSC), in partnership with Sustainable Water Works (SWW), was engaged by Business Leaders for Michigan (BLM) to develop a business plan for the natural resource economy—one of six asset areas identified by BLM in its Michigan Turnaround Plan to make Michigan a Top Ten state for jobs, personal income, and a healthy economy.

5 Executive Summary
PSC and SWW conducted research that included a review of state and regional natural resource-related plans, interviews with over 15 industry thought leaders, an economic and market of Michigan’s natural resource industries, and a focus group of natural resource industry stakeholders, to help identify opportunities, challenges, and strategies in four categories of Michigan natural resource industries:
Michigan’s natural resource industries provide over 7 percent of all Michigan jobs, create over $32 billion in gross domestic product (GDP), and account for over $400 billion in sales. Exports of natural resource industry products from Michigan account for over $61 billion. While not currently ranked among the top performing states on most of these metrics, Michigan does compare well to surrounding Great Lakes and Midwestern states in terms of our current and potential natural resource industry opportunities. Additionally, natural resources are a significant share of jobs and economic activity in some regions of the state, particularly in the Northern Lower Peninsula and Upper Peninsula.
If Michigan were to attain the same growth levels as the tenth-fastest-growing state for natural resources industries, real GDP would increase by $5.2 billion, jobs would increase by 57,000, and earning by almost $11,000 per person by the year 2023 (BLM 2015).
Based on the research, Michigan has the natural resource assets to become a Top Ten natural resource economy state, particularly in the areas of: • Tourism• Outdoor recreation• Agriculture (crop and animal production) and food processing• Timber and value-added timber products• Renewable energy
These industries are likely to offer the strongest opportunities for growth and market position, given the existing policy landscape in Michigan, the Turnaround Plan’s time frame of making Michigan a Top Ten state by 2020, their relatively strong position on economic indicators such as employment, GDP and earnings, and other factors such as regional priorities, competitive advantage, national industry rankings, global industry trends, strong supporting policies, and potential synergies with other natural resource industries.
Natural resources research and development showed strong economic and market position, is critical to the growth of several of the priority industries, and is included as an important strategy in the state’s tourism, agriculture, timber, recreation and (forthcoming) water strategies. As such, this business plan identifies related objectives and strategies for enhancing the state’s research and development (R&D) efforts regarding natural resources as well. Other industries, such as mining, oil/gas production, and Great Lakes shipping are also very relevant and, in some cases, could offer significant growth opportu-nities. While the recommended focus of this business plan is on the seven priority industries identified above, these additional industries are also an important part of Michigan’s economy and should continue to be fostered and supported wherever possible.

6Executive Summary
In the longer term, Michigan is also uniquely situated to benefit economically from its freshwater resources in several respects, including research and development, as a key enabler of other industries (e.g., agriculture and manufacturing), and as a continued part of making Michigan an attractive place to live and do business. The Michigan Economic Center’s recent Blue Water Economy report andthe state’s forthcoming water strategy broadly address economic and social issues around Michigan’s water (including how water contributes to community quality of life). But because this business plan is focused on strategies for accelerating natural resources business and industry opportunities, we have kept the focus of water in this business strategy on areas where water is a specific business product or service, or the primary input to a product or service (for example, tourism products like boating).
POTENTIAL GROWTH STRATEGIES
This report identifies five high-priority strategies that public and private stakeholders should pursue in order to help Michigan realize these natural resource economy opportunities. For each of these strate-gies, we have identified several implementing actions (described on pages 35 to 37).
STRATEGY 1
Improve public infrastructure that supports Michigan’s natural resources industries, particularly rail and highway improvements that support export of agriculture, timber, and mining products, and improve the efficiency and access to highly demanded tourism destinations in Michigan.
STRATEGY 2
Expand and enhance tourism and outdoor recreation amenities and services, and continue to expand the national and international promotion of Michigan’s tourism assets, in order to increase the number of visitors to the state and tourism-serving businesses/jobs in Michigan.
STRATEGY 3
Focus the state’s existing public and private research and development assets on making Michigan a national leader in the innovation of sustainable natural resources products and processes.
STRATEGY 4
Provide an attractive and affordable working environment in order to ensure an adequate labor force to support the growth of Michigan’s natural resources industries.
STRATEGY 5
Ensure dedicated leadership and accountability for the implementation of this natural resources business plan.

7 Background and Methodology
OVERVIEW OF THE PROJECT
Business Leaders for Michigan is a private, nonprofit executive leadership organization whose mission is to develop, advocate for, and support high-impact strategies that will make Michigan a Top Ten state for jobs, personal income, and a healthy economy. BLM’s work is defined by the Michigan Turnaround Plan, a holistic, fact-based strategy developed to achieve its goal. The New Michigan Strategy identifies six distinctive assets to grow Michigan’s economy:1. Global Engineering Village2. Gateway to the Midwest3. Higher Education Marketplace4. Natural Resource Economy5. Global Center of Mobility6. Life Sciences Hub
Public Sector Consultants, in partnership with Sustainable Water Works, was engaged by BLM to develop a business plan for the natural resources asset area. Based on significant research conducted during the develop-ment of the Turnaround Plan, BLM identified initial areas of opportunity in the natural resource economy (economic sectors that are dependent on the abundance and/or high quality of Michigan’s natural resources). PSC and SWW worked with BLM to further evaluate and refine those opportunities by:
• Determining which natural resource industries/sectors should be priorities for investment and public policy support in Michigan (statewide and regionally)
• Identifying the national and global market trends for those industries, and evaluate Michigan’s relative strengths and weaknesses for becoming a Top Ten state in those sectors
• Developing specific goals and strategies for supporting and accelerating the economic growth, market position, and job creation capability of those natural resource industries in Michigan
APPROACH
The PSC/SWW team used a three-phased approach to complete this project:• Phase I: Scoping and Research• Phase II: Economic Data Evaluation and Competitive Assessment• Phase III: Development of a Natural Resource Economy Business Plan
In Phase I, PSC and SWW researched existing statewide natural resource economic strategies and plans, and reviewed all regional Comprehensive Economic Development Strategies (CEDS) prepared by regional planning organizations. CEDS are required to be eligible for U.S. Economic Development Administration (EDA) funding. The goal is to bring together the public and private sectors in the creation of an economic roadmap to diversify and strengthen regional economies. As these plans reflect the economic development goals and priorities of regional public and private stakeholders, PSC reviewed Michigan regional plans to evaluate their consistency with the business sectors initially identified by BLM in 2011 and identify unique regional differences and major themes among the regions as they relate to natural resource–based industries.
BACKGROUND AND METHODOLOGY

8Background and Methodology
There are 12 planning regions within Michigan that currently have CEDS. The purpose was to better under-stand how natural resources currently factor into state and regional economic development strategies, and subsequently identify natural resource industries with established specific industry goals and strategies.
In addition, PSC and SWW worked with BLM to select a group of over 15 thought leaders and natural resource industry experts throughout the state to interview for the project. The group of experts interviewed included representatives from all of the major natural resource industries and included a mix of participants from the public, private, university, and nonprofit sectors. Participants were asked to provide input on what they saw as key strengths, opportunities, and challenges of Michigan’s natural resources business sectors.
Finally, we reviewed the literature on national and global trends in the four natural resource categories in order to better understand what types of natural resources sectors are growing and how those trends align with Michigan’s resources.
In Phase II, PSC conducted an economic and market competitiveness analysis of Michigan’s natural resource industries. We evaluated natural resource-related industries at the four-digit North American Industry Classification System (NAICS) codes level, using the Economic Modeling Solutions Inc. (EMSI) database and projections. The EMSI database, which accesses over 90 sources of data including multiple sources within the Bureau of Economic Analysis, the U.S. Census Bureau, the Bureau of Labor Statistics, and more, allows for evaluation of the historic, current, and predicted future strength of Michigan’s natural resource economy.In Phase III, PSC convened a group of industry stakeholders to present the data from Phases I and II, get consensus among stakeholders on which natural resource industries they believe offer the greatest economic opportunities for Michigan, and obtain input on goals and strategies for accelerating the growth and economic position of these industries.
A more detailed description of the project methodology is included in Appendix A, and Appendix B provides a list of interviewees (Phase I) and industry stakeholder focus group attendees (Phase III). The full list of NAICS codes used in the Phase II analysis is included in Appendix C.

9 Overview of Michigan’s Natural Resource Economy
EXHIBIT 1. Natural Resources Business Plan Industry Categories
Michigan’s abundant and diverse natural resources include beaches, dunes, freshwater lakes and rivers, minerals, oil and gas, forests, fertile agricultural land, wind, sun and biomass energy sources, and aquatic, avian, and terrestrial wildlife.
Michigan’s natural resources attract visitors and prospective residents. The state grows, extracts, and uses raw natural resources in the development of secondary products that are used here and exported to other states and globally. Natural resources, particularly water, are used as part of the process for many of our other critical industries, including Michigan’s manufacturing and energy sectors. In both the academic and business research and development sectors, Michigan has a strong base of intellectual resources that fuel innovation and contribute to the state’s potential to capitalize on its natural resource economy.
These high-quality, substantial natural resources are deeply embedded in Michigan’s history, culture, economy and identity; as such, they are important elements of Michigan’s past and future prosperity.
WHAT INDUSTRIES MAKE UP MICHIGAN’S NATURAL RESOURCE ECONOMY?
As an organizing framework for the business plan, natural resource industries and business sectors have been grouped into four categories, as described in Exhibit 1.
OVERVIEW OF MICHIGAN’S NATURAL RESOURCE ECONOMY
EXTRACTION INDUSTRIES
Industries that involve the extraction of raw materials from the earth for consumer use. Michigan extraction indistries include mining, oil and gas, and water (as a product).
PRODUCTION INDUSTRIES
Businesses that are producing and/or using natural resources to renewably produce new products. In Michigan, relevant examples are agriculture, forestry, and renewable energy.
AESTHETIC INDUSTRIES
Natural resource industries that are built upon or enhance people’s appreciation for beauty and the natural landscape. The primary aesthet-ic-based industries in Michigan are tourism and outdoor recreation.
CROSS-SECTOR SUPPORT INDUSTRIES AND RESEARCH
Cross-sector businesses or organizations that support our understanding, use, and/or protection of natural resources or transport natural resource products within and between Michigan and other markets. Examples include natural resources and science research institutions, environmental consulting organizations, and Great Lakes and inland shipping.

10Overview of Michigan’s Natural Resource Economy
In developing a framework for a natural resources business plan, it would be easy to connect a vast majority of Michigan’s industries in some way to our natural resource base. The intention of the New Michigan Strategy in the Michigan Turnaround Plan, however, is to identify specific industry areas that make (or have the potential to make) Michigan a Top Ten state for jobs, personal income, and a healthy economy. The purpose of the six subarea business plans is to focus on a few high-priority, potentially high-impact industry areas and identify how public and private sector partners can support and accel-erate those industries.
Accordingly, this business plan includes only those sectors that are directly tied to the use of the state’s natural resources—either for the sale of the natural resource product itself, processing of the resource into a value-added product, enjoying the resource for its aesthetic value, researching the resources and developing new products or solutions for sustainability, or for the transport of goods, services, and people via the state’s natural resources. This narrower definition, therefore, does not include:
The approach is geographically based—including only sectors that have a strategic advantage in using
The types of natural resource industries included in this plan are those that:
• Sell the natural resource product itself• Process the resource into a value-
added product• Allow for the enjoyment of the
resource for its aesthetic value• Research the resources and develop
new products or solutions for sustainability
• Transport goods, services, and people via the state’s natural resources
The types of natural resource industries NOT included in this plan are those that:
• Process or convert natural resources from outside Michigan (for example, manufacturing of products from imported petroleum)
• Are not in some way unique (in their nature or abundance) to Michigan, such as wastewater and drinking water treatment operations
• Use natural resources as a part of an unrelated manufacturing process, such as the use of water that occurs in significant majority of manufacturing processes (unless water is the primary input of the manufactured product)
the natural resources that are located in Michigan, recognizing that determining which industries to include can require fine distinctions.
In particular, water is challenging to consider in the context of this business plan. Water is a critical natural resource for Michigan’s overall economic health, and it will likely have increasing strategic importance in business and workforce location decisions. But because this business plan is focused on strategies for accelerating natural resources business and industry opportunities, and because the state has a forthcoming water strategy which will address, at a much broader level, economic and social issues around Michigan’s water (including how water contributes to community quality of life), we have kept the focus of water in this business strategy very narrowly focused. Strategies related to water are solely

11 Overview of Michigan’s Natural Resource Economy
focused on where it is a specific business product or service, or the primary input to a product or service (for example, tourism products like boating).
OTHER WAYS NATURAL RESOURCES PLAY A PART IN MICHIGAN’S ECONOMY
In addition to the industries that are directly tied to the consumptive or nonconsumptive use of Michigan’s natural resources, the state’s natural resources are also an important, but more indirect part of Michigan’s economic prosperity.
Michigan’s substantial and high-quality natural resources contribute to the overall beauty of the state, and help create beautiful and unique places to live, work, and visit. Beyond the associated businesses, Michigan’s natural resources contribute to higher property values and expanded community development (and related tax income for local and state governments), and help businesses to attract and retain high-quality, highly demanded talent. Numerous studies have documented these economic impacts in Michigan and elsewhere. And while these broader benefits are not the focus of this business plan, we recognize that because of its abundant and diverse natural resources, Michigan’s economy benefits particularly in these areas.

12Issues and Opportunities
Across the board, Michigan’s aesthetic-based natural resources industries—primarily tourism and outdoor recreation—were identified as key economic opportunities for the state. Nationally and globally, tourism is a growing industry. Since the Great Recession, the U.S. travel industry has created jobs at a pace that is 29 percent faster than the rest of economy, and over 7 million jobs in the U.S. are supported by direct spending on travel—7 percent of total private-sector economy (U.S. Travel Association 2012).
The state has focused considerable energy in recent years on growing its tourism and outdoor recre-ation economies, and developed strategic plans for both. For the tourism sector, the 2012–2017 Michigan Tourism Strategic Plan, developed by industry experts, looks at where the industry is, where it wants to be, and what actions and investments are required to achieve that vision. The plan recog-nizes the importance of Michigan’s natural resources to tourism, and includes a specific goal to “be internationally recognized for our stewardship of—and rich opportunities to experience—our natural, cultural, and heritage resources” (Nicholls n.d., 9). One of the key implementations of Michigan’s tourism strategic plan, the “Pure Michigan” marketing campaign, builds upon the image of Michigan’s beautiful natural resources as a reason to visit the state. In 2013, Michigan spent $13 million on the Pure Michigan out-of-state advertising campaign, which generated a return on investment of $86.5 million, or $6.66 per dollar spent (MEDC 2014).
Industry experts cite growing tourism trends based on natural resources (focused on camping, adventure vacations, and beaches) and Michigan’s relative strengths in these areas, as well as the success of the Pure Michigan campaign. The types of businesses cited as potential areas to support for growth include hotels; equipment rental and guide services; equipment manufacturers, wholesalers, and retailers; hunting clubs; construction-related industries from the development of hotels, restaurants, and second homes; and event organizers/marketers. Several of the experts interviewed noted Michigan’s existing strengths in serving these tourism and recreation markets, including several major equipment gear manufacturers and retailers headquartered in the state, such as Cabela’s, Polaris, Carhartt, and Quest Bowhunting.
Review of regional CEDS, industry-specific state strategies, and national and global literature on industry trends, interviews with industry stakeholders, and analysis of Michigan’s current and projected economic position in natural resources sectors provided a robust picture of Michigan’s natural resource assets, oppor-tunities and challenges.
LITERATURE AND INDUSTRY EXPERT INTERVIEW FINDINGS
Findings from the research, by natural resource category, are summarized below.
ISSUES AND OPPORTUNITIES IDENTIFIED IN THE RESEARCH
AESTHETIC INDUSTRIES

13 Issues Opportunities
Outdoor recreation in Michigan is a similarly strong industry. According to a 2012 Michigan Department of Natural Resources survey, at least 63 percent of Michigan residents participate in some form of outdoor recreation each year (MDNR 2012).
The state has two recent plans that specifically discuss opportunities for economic growth and strategies for growing outdoor recreation-related businesses: the Michigan Statewide Comprehensive Outdoor Recreation Plan and the Future of Michigan’s Parks and Outdoor Recreation: Final Report. While both plans discuss broad trends and opportunities in outdoor recreation, both include specific investment recommendations (public and private) to support the growth of related industries including recreational product manufacturing and retailing, related service industries (for example, bike shops, restaurants, guide services), and recreational event companies.
At a regional level, the largest number of natural resource–related projects included in the CEDS by far, were in the tourism and outdoor recreation area (195 projects across the 12 planning regions that have CEDS). There are 12 planning regions within Michigan that currently have CEDS, and eight of them have tourism- or recreation-related cluster strategies, such as accommodations and food service, or arts, entertainment, recreation, and visitor industry clusters. Not surprisingly, while natural resources, tourism, and recreation investments were included in all 12 CEDS, the number of projects and impor-tance of the tourism and recreation industries are larger around the western and eastern shorelines of Michigan, in the Northern Lower Peninsula, and throughout the Upper Peninsula. The types of projects included in CEDS included golf courses, beaches, state and local parks, waterfront improve-ments, trails, green infrastructure, hunting spaces, and water access projects. Trails and waterway access/improvements are the most prevalent, and were included in every CEDS. Appendix D lists all of the regional CEDS and indicates which had natural resource economy projects and/or industry clusters in the four natural resource business categories.
“Tourism is a $17.7 billion industry that
generates nearly $1 billion in state tax
revenue and supports nearly 200,000 jobs
in Michigan. Outdoor recreation in
Michigan is a similarly strong industry. It
generated $18.7 billion in consumer
spending in the state, and created almost
195,000 direct jobs in the Michigan in 2011
(Outdoor Recreation Association n.d.).”
Research and stakeholder input indicated Michigan is, and could continue to be, a leading producer and manufacturer of food and forestry commodities and value-added products, and renewable energy technol-ogies. Production-related industries make up the largest portion of Michigan’s natural resource economy in terms of both sales and jobs.
PRODUCTION NATURAL RESOURCE INDUSTRIES

14Issues and Opportunities
Michigan is recognized nationally and globally as a leader in several areas of food growth and processing, and global population and food demand trends present an important opportunity to grow the state’s already strong agricultural economy. Michigan’s agriculture exports generate more than $3 billion in economic activity each year. Top exports include soybeans, corn, wheat, dairy products, and fruit. (MDARD, Michigan Agriculture Snapshot 2014). Areas of agriculture production noted by experts as having particular growth potential included dairy production and processing (for example, milk, cheese, yogurt, and milk powder) and related dairy niche products, such as artisan cheeses. In addition to agricultural production, Michigan also has
an established food processing industry. The state ranks 19th in the nation in food processing sales (MDARD n.d). In terms of agriculture sector growth, the Michigan Department of Agriculture and Rural Development and the Michigan Economic Development Corporation launched the Strategic Growth Initiative in 2013. The program, which will provide $3 million in grants this year, is intended to increase investment in Michigan’s food and agriculture industry and foster opportunities for job growth in high-tech and innovative careers (MDARD n.d.).
Forestry and manufactured timber products have also historically been a strong industry in Michigan. Over 12 million tons of wood is harvested in Michigan each year, contributing $14.6 billion to the state’s economy (Michigan Forest Products Council 2014). Over 26,000 people are directly employed in the forestry industry in Michigan and over 150,000 people are employed in the broader forest products development industry—which includes the manufacturing of pulp, paper, packing, cellulose, cabinets, furniture, and homes (MDNR 2013, Michigan Forest Products Council 2014). State strategies and several industry experts noted that the timber industry is an underutilized potential in Michigan, and that Michigan has significantly more forest resources than it currently harvests. Expanding forestry business operations could not only increase business opportunities for the processing or raw timber, but also expand the forestry value-added products that could be manufactured here in Michigan and exported nationally and globally. Examples cited include cabinetry and furniture making, sustainable building products (for example, wood flooring), and pulp-based products. There is significant potential in marrying the resource (timber) with Michigan’s manufacturing expertise to better leverage the full supply chain of products. The state’s 2010 Michigan Forest Resource Assessment and Strategy identifies specific strategies for improving Michigan’s forestry resources, harvesting, and utilization of forest products. The strategy targets priority geographic areas, and includes strategies for increasing the use of Michigan’s forest resources for value-added products and biomass energy. It also includes specific perfor-mance measures for the utilization of Michigan forest products.
Renewable energy production is also cited by many experts (and state plans) as a continued opportunity for the state. Michigan has experienced some success in the area of economic development based on renewable energy with potential for more. By the end of 2014, Michigan had an estimated 2,153 megawatts (MW) of installed, online renewable capacity (Baldwin 2015). More than half of this is made up of wind energy. The U.S. Department of Energy has estimated that Michigan’s onshore wind energy potential could be approxi-mately 59,000MW—more than 1.5 times the state’s electricity energy need (U.S. Department of Energy, Energy Efficiency and Renewable Energy Division 2010). However, the Michigan Wind Energy Resource Zone Board provided a more realistic estimate of 3,421 to 6,122 MW of wind energy development, based on best wind resources and exclusion of lands not likely to support wind development—such as steep terrain, urban areas, airports, roads, Great Lakes shorelines, wetlands, lakes, and rivers (Michigan Wind Energy Resource Zone Board 2009).
“Agriculture is Michigan’s second-
largest industry, accounting for more
than $100 billion of the state’s economy
each year. ). Michigan leads the nation
in the production of 18 commodities,
and is a Top Ten state for 56 other
commodities (MDARD n.d).”

15 Issues Opportunities
Biomass, much of it from Michigan’s almost 19 million acres of forest land, provided fuel for 42 percent of Michigan’s renewable net electricity generation in 2013. The state ranks ninth in the U.S. for biomass-generated electricity production (U.S. Energy Information Administration 2014). Michigan’s estimated solar resource potential is 3,500 gigawatts, ranking 16th in the U.S. (Lopez et. al. 2012). Michigan’s renewable energy supply chain has also grown in recent years.
Finally, water has been the focus of several recent (and ongoing) statewide planning efforts focused on the growth of industries dependent on clean and abundant water supplies, as well as businesses focused on solutions for the protection and/or use of water. The Michigan Economic Center report, Water, Michigan and the Growing Blue Economy, highlights opportunities for Michigan to develop and expand water-related businesses given our geographic position in the heart of the Great Lakes. The report calls for strategic investments to grow water technology businesses (for example, sustainable water reuse, efficiency, and cleaning technologies), water research and learning, and water as a sustainable growth platform for businesses that depend on water for their product development (Austin n.d.). The state’s Office of Great Lakes is also developing a statewide water plan that will make recommendations across a broad spectrum of water issues, including economic and job creation opportunities for the state. This report is expected to be completed in mid-2015.
Regionally, production-related industries were the second
“Michigan could realize between $3.6
most frequently mentioned natural resource industries in the 12 CEDS. Over 80 percent of the regions identified and $6.2 billion in economic impact farming as part of their economic development strategy, related to meeting growing renewable including urban agriculture in southeast Michigan. Of those energy generation and storage demand regions, almost three-quarters identified cash crops as an
(Energy Innovation Business Council economic development investment area. Forestry and wind
2011). Michigan already ranks 14th for
energy were also included in over two-thirds of the CEDS plans, and biofuels in 75 percent of the regions’ CEDS plans. installed wind capacity, with over 1,500 There were only 35 priority projects in the production MW capacity through 2014 (American category—the lowest of the three natural resource catego- Wind Energy Association 2015).” ries. Ten of the regions also identified production-related industry clusters (including biomass, advanced energy,
forest and wood products, and food innovation) as high priorities in their region. Again, Appendix D identifies which regional CEDS included production-related projects or industry clusters.
Research on Michigan’s future in mining and oil and gas production indicates the extraction industry is somewhat mixed. Several of the experts interviewed cited Michigan’s significant mineral resources, particularly in the Upper Peninsula, and the “mining boom” that has been occurring in recent years. They cited strong global markets and significant improvements in the efficiency and environmental
EXTRACTION-BASED NATURAL RESOURCE INDUSTRIES

16Issues and Opportunities
impacts of mining operations. This has fostered opportunities to expand economic and job growth, particularly in the northern part of the state. Others indicated that this is a limited resource that won’t provide for long-term, sustained growth of Michigan’s economy. Michigan’s mining resources are primarily iron ore (usable shipped), cement (portland), salt, sand, and gravel (construction), and magnesium compounds.
Similarly, oil and gas production and storage are seen by many experts as extremely opportune for the state. They cite the extensive resources of Michigan’s Antrim Shale in the northern part of the state, and growing interest in hydraulic fracturing (“fracking”) to get at greater amounts of that natural gas. Michigan is ranked 17th nationally in natural gas (U.S. Energy Information Administration) and accounts for 1 percent of total U.S. reserves (Michigan Department of Licensing and Regulatory Affairs n.d.). The Antrim gas field, located in Michigan’s Lower Peninsula, was ranked 15th in the nation in estimated proved wet gas reserves (U.S. Energy Information Administration 2014). The state is ranked 17th nationally in crude oil production (U.S. Energy
Information Administration 2014) and total crude oil reserves equal 0.2 percent of U.S total reserves (MI Department of Licensing and Regulatory Affairs n.d.). Michigan also has significant underground natural gas storage capacity—1.1 trillion cubic feet, more than any other state in the nation (U.S. Energy Information Administration 2014). This capacity is equivalent to approximately 10 percent of U.S. natural gas capacity (MI Department of Licensing and Regulatory Affairs n.d.).
However, a recent technical study by the University of Michigan’s Graham Institute notes that Michigan has been only a “middle of the pack” oil and gas producer, and that even with the availability of more modern exploration tools and fracking, Michigan seems unlikely to see major successes in oil and gas production (“wildcatter” is still a relevant description of many current-day small drilling compa-nies), Michigan now seems to be unlikely territory for a major success. The possible exception is that significant gas could be recovered from the carbonate formations and the underlying Utica-Collingwood, but the capital cost of extracting these resources and current low natural gas prices means that it is unlikely that much of this will be developed over the next decade (Wilson and Schwank 2013).
While there are no existing statewide strategies focused on growing the state’s oil, gas, and/or mining industries, Governor Snyder’s newly created Michigan Agency for Energy will be focused on replacing the state’s aging coal-fired power plants with cleaner sources of energy, and there will likely be policies and/or strategies emerging from that agency that will impact Michigan’s natural gas and oil industries. Across the 12 regions with completed CEDS, seven regions included specific extraction-related invest-ment projects (for a total of 55 projects). Over three-quarters of those regions mentioned water extraction activities as part of their economic strategy (for municipal water supply or support of industry). Not surprisingly, mining activities were largely clustered in the northern Lower Peninsula and the Upper Peninsula. The primary mining activities were copper, sand and gravel, iron ore, limestone, and graphite. Oil and gas extraction was mentioned in the CEDS for the northern Lower Peninsula regions (northwest, north central, and northeast) and the central Upper Peninsula. Appendix D identifies which regional CEDS included extraction-related projects or industry clusters.
“Michigan’s mining industry garners
more than $2 billion annually (USGS
2014). The state is ranked second
nationally in the production of iron ore
(USGS 2014), 11th on volume of
minerals extracted (metals and
nonmetals), and ninth in overall value
of nonfuel minerals in the nation
(USGS 2013).”

17 Issues Opportunities
Natural resources also play a role in supporting other Michigan industries, through research and development of new products and the processing and transport of goods and services (primarily along Michigan’s waterways). Echoed in state and regional plans, several industry experts identified the opportunity for Michigan to be known for high-quality natural resources and an ability to solve tough sustainability issues. Interviewees noted that Michigan is uniquely positioned to do that because the state has:• Abundant and high-quality natural resources• Substantial research and development expertise at our universities and within the private sector• Existing, successful entrepreneurial activities in this area• A strong manufacturing and engineering base
INNOVATION AND SUSTAINABILITY IN MICHIGAN’S WATER SECTOR
Michigan’s universities are national and global leaders in water-related research and product innovation. The University Research Corridor, made up of Michigan State University, Wayne State University, and University of Michigan, received almost $300 million in water research awards between 2009 and 2014, and awarded over 3,400 water-related degrees.
NATURAL RESOURCES CROSS-SECTOR SUPPORT INDUSTRIES
The marriage of these assets could uniquely position Michigan to be a top state for researching and developing solutions for sustainability issues that affect natural resources. For example, Michigan has highly ranked water research centers at its universities, as well as emerging water technology companies that are gaining a foothold in national and global markets. These assets, particularly in the face of growing global water shortages and water quality issues, could be significant opportunities for water-related business growth in Michigan.
Similarly, these assets provide opportunities for addressing agriculture and timber sustainability issues through leveraging the substantial agricultural and forestry science and engineering expertise at our universities (particularly at Michigan State University). Research and business opportunities for efficient conversion of agricultural/forestry waste to energy, and development of food processing technologies that decrease energy and water use were noted in particular. Opportunities to create sustainable, value-added forestry products, such as building construction materials, could also position Michigan to be a leader in this area.
LEADERSHIP
There is a general consensus among those interviewed for this project that state agencies, under Gov. Rick Snyder’s administration, have been supportive of economic interests related to natural resources. Several interviewees, however, noted that there is a need and an opportunity for more state govern-ment and cross-industry private sector partnerships to support the innovation and entrepreneurship necessary to successfully foster natural resource economies. Experts interviewed also noted that the business community and Business Leaders for Michigan should be champions on behalf of growing Michigan’s natural resources industries.
18Issues and Opportunities
While about 7.3 percent of Michigan’s employment is in natural resource–related industries, only 5.7 percent of total establishments are natural resource industry sectors. This is primarily due to the employee-heavy establishments in the extraction and production sectors of the natural resource economy, such as foundries or furniture making. Employment in these sectors is more concentrated within a fewer number of establishments than in other sectors.
OUTPUTS
The Michigan Turnaround Plan evaluates Michigan’s position in terms of the same three outputs for each of the six asset areas identified:• Gross domestic product • Earnings• Employment
PSC investigated Michigan’s natural resources industry GDP, as well as the past, present, and predicted future number of jobs and associated current earnings by each sector for Michigan. As part of the analysis, we also evaluated earnings and jobs for comparison states and the economic regions within Michigan. This shows the relative size of each industry in terms of its impact on local populations. A large number of high-wage jobs are strong contributors to local prosperity and growth, while a few low-wage jobs may not be an industry worth exerting effort for expansion in terms of its impact on local prosperity.
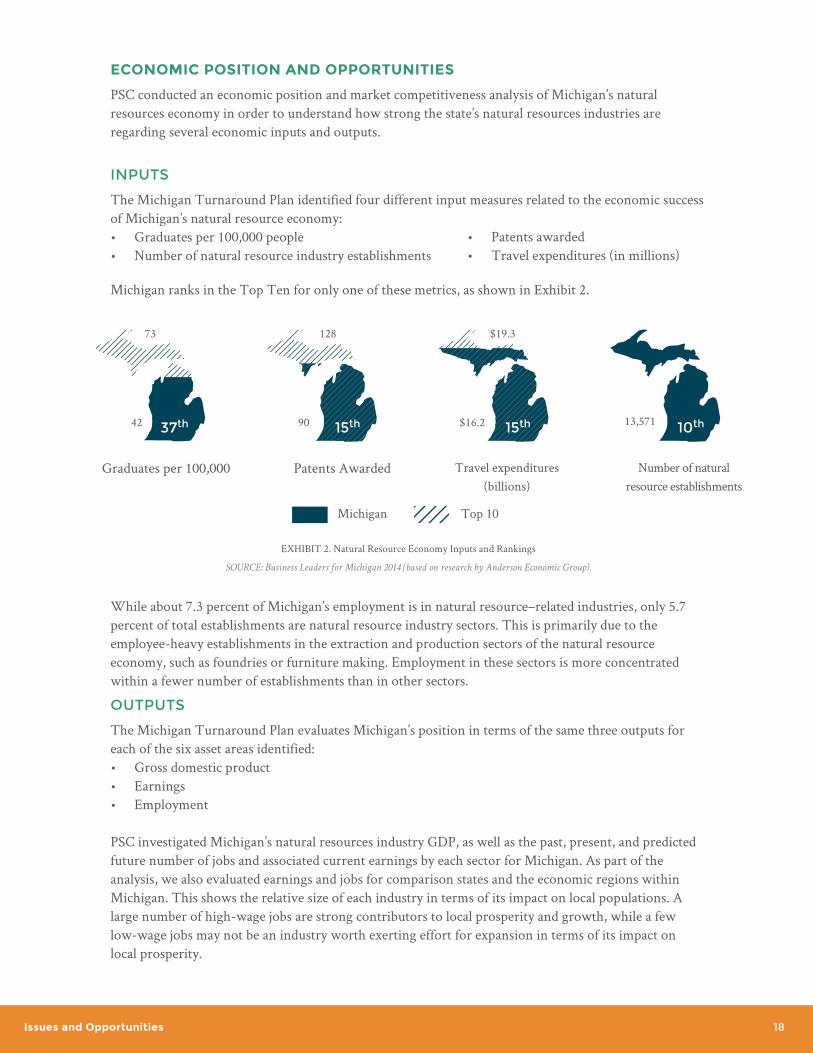
EXHIBIT 2. Natural Resource Economy Inputs and Rankings
SOURCE: Business Leaders for Michigan 2014 (based on research by Anderson Economic Group).
Michigan Top 10
Graduates per 100,000 Patents Awarded Travel expenditures (billions)
Number of natural resource establishments
73
42 37th
128
90 15th
$19.3
$16.2 15th 13,571 10th
ECONOMIC POSITION AND OPPORTUNITIES
PSC conducted an economic position and market competitiveness analysis of Michigan’s natural resources economy in order to understand how strong the state’s natural resources industries are regarding several economic inputs and outputs.
INPUTS
The Michigan Turnaround Plan identified four different input measures related to the economic success of Michigan’s natural resource economy:• Graduates per 100,000 people• Number of natural resource industry establishments
• Patents awarded• Travel expenditures (in millions)
Michigan ranks in the Top Ten for only one of these metrics, as shown in Exhibit 2.

19 Issues Opportunities
GROSS DOMESTIC PRODUCT
Michigan’s GDP for its natural resource industries is $32 billion (approximately 8 percent of Michigan’s total GDP, as shown in Exhibit 3). This is slightly below the national average for natural resource industry GDP, which is almost 11 percent.
EXHIBIT 3. Natural Resource Industries GDP (as a percentage of total GDP)
EXHIBIT 4. Natural Resource Industries Average Earnings and Rankings
SOURCE: Prepared by PSC based on Economic Modeling Specialists Intl.; Economy\Industries\4 and 6 Digit. Data for 2004:2014, and 2014:2024.QCEW
Employees, Non-QCEW Employees & Self-Employed—EMSI 2014.3 Class of Worker. Downloaded from www.economicmodeling.com as a product of
contractual services between EMSI and PSC. Collected July 2014.
SOURCES: Economy\Industries\4 and 6 Digit. Data for 2004:2014, and 2014:2024.QCEW Employees, Non-QCEW Employees & Self-Employed—EMSI 2014.3
Class of Worker. Downloaded from www.economicmodeling.com as a product of contractual services between EMSI and PSC. Collected July 2014; U.S. Census
Bureau, County Business Patterns 2012.
8%
11%Nation
Michigan
EARNINGS
Earnings include salaries and benefits received and are an average of all jobs performed. Some workers in an industry or category may earn significantly more than the average, while others much less. Average earnings allow us to help identify sectors that could have the greatest impact if growth were to occur. Exhibit 4 presents the average earning per natural resource–related category, the average earnings for a Top Ten state, and Michigan’s current ranking. Cross-sector support industries offer the highest average earnings at $109,400 (salary plus benefits), while aesthetic-related industries offer the lowest at $26,505. Extraction natural resource industries offer an average of $80,835, while produc-tion-related industries, at $54,234, are more on par with the state average. Although aesthetic industry earnings are among the lowest of the natural resources industries, there are still potentially strong economic benefits from growing the industry such as increased visitor spending and higher property tax revenue. As the exhibit shows, Michigan ranks 20th and is just over $12,000 below the Top Ten states in terms of average natural resource industry earnings.
Average earnings to be a top 10 state
Michigan Average earning and rank
$58,207$34,953 $100,113 $103,106
$26,505
Aesthetic
$54,234
Production
$80,835
Extraction
$108,677
Cross-Sector
30th 16th 25th 8th

20Issues and Opportunities
EMPLOYMENT
Nationwide, the natural resource economy makes up over 8.3 percent of the total job force. Michigan is slightly below the national average with only 7.3 percent of its employed job force in natural resource–related industries, ranking 35th nationally. Nevada has the largest share of its employment in natural resource–related industries (19.7 percent). In order to be a Top Ten state, Michigan would need its natural resource industry jobs to make up at least 12 percent of the state’s total employment. Exhibit 5 provides a breakdown of Michigan’s natural resource employment by industry category.
While Michigan’s natural resource economy is only a small slice of the total jobs pie, it represents a sector that has growth potential and can make a strong contribution to the state’s industry diversifica-tion. Michigan’s natural resources also contribute to job growth in other sectors, by helping to make Michigan a desired location for residents and businesses alike. After an obvious decline from around 2006 through 2009, Michigan has experienced modest job growth in natural resource–related industries over the past five years, and this trend of steady improvement is expected to continue through 2024.
In order to better understand Michigan’s relative position in the natural resources economy, PSC also compared Michigan’s natural resources employment (as well as other market position factors described in the next section) to six Great Lakes/Midwestern comparison states—Illinois, Indiana, Minnesota, Ohio, Pennsylvania, and Wisconsin. In addition to being located in the region surrounding Michigan, these states share similar demographic and geographic characteristics. In addition, we evaluated these factors within Michigan’s ten prosperity regions in order to identify regional natural resource industry opportunities.
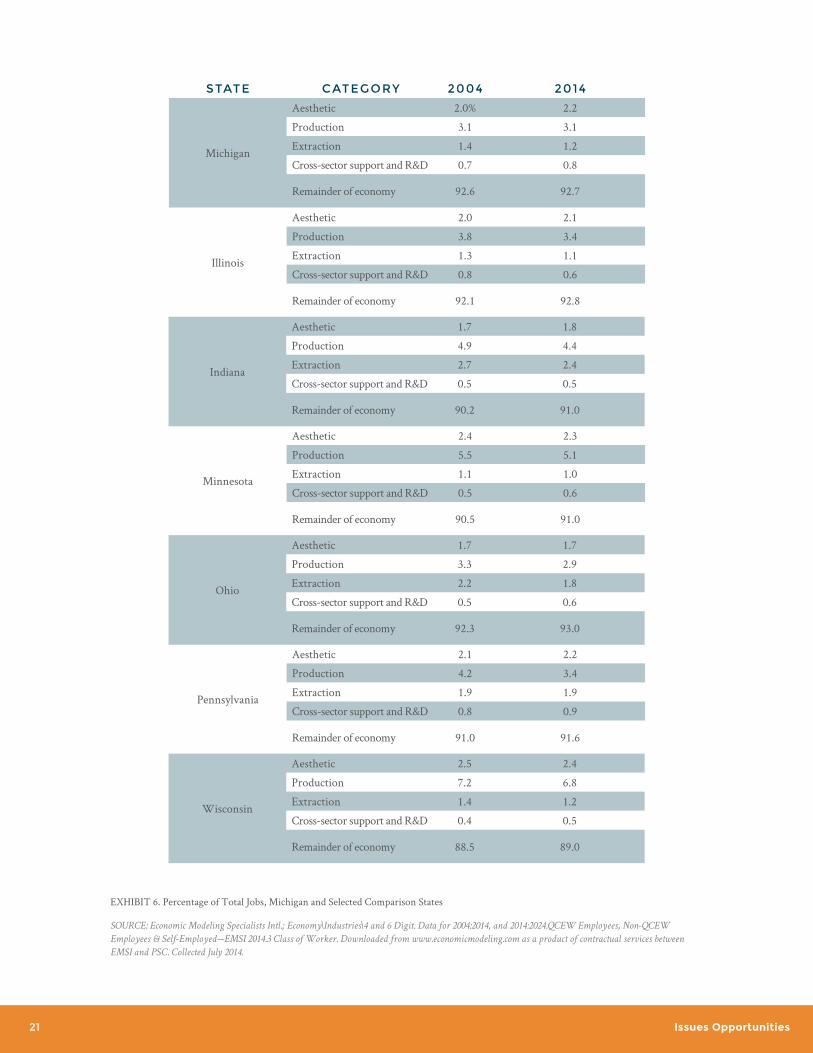
Michigan’s percentage of employment falling under the aesthetic and cross-sector support industries is very similar to that in the comparison states (see Exhibit 6). Half of the comparison states (Indiana, Ohio, and Pennsylvania) have slightly higher employment in the extraction category. Michigan ranks sixth out of the seven states in percentage of employment in the natural resource production economy, with 3.1 percent. Wisconsin and Minnesota have a significantly larger share of employment in the natural resource production economy, with 6.79 percent and 5.10 percent, respectively. Overall, Michigan’s share of employment devoted to the natural resource–related industries is similar to that in comparison states, which ranges from 7 to 11 percent of the economy in the identified industries.
Average percent employed to be a
Top Ten state
Michigan percent employed and rank
5.69%3.55% 2.38% 1.18%
2.16%
Aesthetic
3.08%
Production
1.22%
Extraction
0.81%
Cross-Sector
30th 16th 25th 8th
EXHIBIT 5. Natural Resource–Related Employment and Rankings
SOURCE: Prepared by PSC based on Economic Modeling Specialists Intl.; Economy\Industries\4 and 6 Digit. Data for 2004:2014, and 2014:2024.QCEW
Employees, Non-QCEW Employees & Self-Employed—EMSI 2014.3 Class of Worker. Downloaded from www.economicmodeling.com as a product of
contractual services between EMSI and PSC. Collected July 2014.
21 Issues Opportunities
EXHIBIT 6. Percentage of Total Jobs, Michigan and Selected Comparison States
SOURCE: Economic Modeling Specialists Intl.; Economy\Industries\4 and 6 Digit. Data for 2004:2014, and 2014:2024.QCEW Employees, Non-QCEW
Employees & Self-Employed—EMSI 2014.3 Class of Worker. Downloaded from www.economicmodeling.com as a product of contractual services between
EMSI and PSC. Collected July 2014.
STATE CATEGORY 2004 2014
Michigan
Aesthetic 2.0% 2.2
Production 3.1 3.1
Extraction 1.4 1.2
Cross-sector support and R&D 0.7 0.8
Remainder of economy 92.6 92.7
Illinois
Aesthetic 2.0 2.1
Production 3.8 3.4
Extraction 1.3 1.1
Cross-sector support and R&D 0.8 0.6
Remainder of economy 92.1 92.8
Minnesota
Aesthetic 2.4 2.3
Production 5.5 5.1
Extraction 1.1 1.0
Cross-sector support and R&D 0.5 0.6
Remainder of economy 90.5 91.0
Pennsylvania
Aesthetic 2.1 2.2
Production 4.2 3.4
Extraction 1.9 1.9
Cross-sector support and R&D 0.8 0.9
Remainder of economy 91.0 91.6
Indiana
Aesthetic 1.7 1.8
Production 4.9 4.4
Extraction 2.7 2.4
Cross-sector support and R&D 0.5 0.5
Remainder of economy 90.2 91.0
Ohio
Aesthetic 1.7 1.7
Production 3.3 2.9
Extraction 2.2 1.8
Cross-sector support and R&D 0.5 0.6
Remainder of economy 92.3 93.0
Wisconsin
Aesthetic 2.5 2.4
Production 7.2 6.8
Extraction 1.4 1.2
Cross-sector support and R&D 0.4 0.5
Remainder of economy 88.5 89.0

22Issues and Opportunities
In addition, PSC evaluated how Michigan’s natural resources jobs are distributed among Michigan’s ten prosperity regions (identified by Gov. Snyder in 2013; see https://www.michigan.gov/documents/dmb/Prosperity_Map1_430346_7.pdf). The prosperity regions are very diverse in their natural resource composition and each contributes a unique piece to Michigan’s natural resource profile. Exhibit 7 presents information on the total number of jobs and percentage of jobs within that category for each region. Region 10 (Detroit Metro) contains the greatest share of total employment for the aesthetic, cross-sector support, and extraction categories, because it is the largest population center and some of the industry headquarters are located there. Only the production category has a different regional employment leader, Region 4 (West Michigan), which contains 42 percent of total employment. Region 4 also contains over 25 percent of the state’s extraction jobs.
0 10,000 20,000 30,000 40,000 50,000 60,000Upper Peninsula Prosperity Region 1
Northwest Prospertiy Region 2Northeast Prosperity Region 3
West Michigan Prosperity Region 4East Central Michigan Prosperity Region 5
East Michigan Prosperity Region 6South Central Prosperity Region 7
Southwest Prosperity Region 8Southeast Michigan Prosperity Region 9
Detroit Metro Prosperity Region 10
5.0%8.7%
2.3%16.0%
7.1%4.8%
4.4%5.9%
8.1%37.7%
2.8%1.0%1.6%
9.8%2.1%1.8%2.5%
5.8%17.2%
55.3%
4.6%3.5%
2.7%25.5%
5.7%5.1%
3.4%8.9%9.7%
31.0%
5.0%4.7%
1.6%
4.0%6.2%
2.8%16.1%
6.1%11.5%
42.0%
AE
ST
HE
TIC
NUMBER OF JOBS
CR
OS
S-S
EC
TO
R
Upper Peninsula Prosperity Region 1Northwest Prospertiy Region 2Northeast Prosperity Region 3
West Michigan Prosperity Region 4East Central Michigan Prosperity Region 5
East Michigan Prosperity Region 6South Central Prosperity Region 7
Southwest Prosperity Region 8Southeast Michigan Prosperity Region 9
Detroit Metro Prosperity Region 10
EX
TR
AC
TIO
N
Upper Peninsula Prosperity Region 1Northwest Prospertiy Region 2Northeast Prosperity Region 3
West Michigan Prosperity Region 4East Central Michigan Prosperity Region 5
East Michigan Prosperity Region 6South Central Prosperity Region 7
Southwest Prosperity Region 8Southeast Michigan Prosperity Region 9
Detroit Metro Prosperity Region 10
PR
OD
UC
TIO
N
Upper Peninsula Prosperity Region 1Northwest Prospertiy Region 2Northeast Prosperity Region 3
West Michigan Prosperity Region 4East Central Michigan Prosperity Region 5
East Michigan Prosperity Region 6South Central Prosperity Region 7
Southwest Prosperity Region 8Southeast Michigan Prosperity Region 9
Detroit Metro Prosperity Region 10
EXHIBIT 7. Percentage of Total Natural Resource Jobs by Category for Each Region, 2014
SOURCE: Prepared by PSC based on Economic Modeling Specialists Intl.; Economy\Industries\4 and 6 Digit. Data for 2004:2014, and 2014:2024.QCEW Employees, Non-QCEW Employees &
Self-Employed—EMSI 2014.3 Class of Worker. Downloaded from www.economicmodeling.com as a product of contractual services between EMSI and PSC. Collected July 2014.

23 Issues Opportunities
REGIONAL SALES EXPORTS % OF TOTAL EXPORTS
AESTHETIC $8,119,498,067 $2,329,556,634 0.6%
PRODUCTION $47,250,687,608 $35,377,537,424 8.8%
EXTRACTION $36,617,025,624 $21,422,169,933 5.3%
CROSS-SECTOR SUPPORT $7,436,543,359 $3,790,019,897 0.9%
REMAINDER OF ECONOMY $753,746,620,504 $340,223,606,627 84.4%
TOTAL $853,170,375,162 $403,142,890,515
SALES AND EXPORTS
Natural resource–based industries make up a greater share of total regional sales and exports than either their share of total jobs or share of total establishments. While 7.3 percent of Michigan’s employment is in natural resource–related industries and only 5.7 percent of its establishments, natural resource–related industries account for 11.7 percent of regional sales and 15 percent of exports. This is primarily due to the high value in the extraction and production sectors. As shown in Exhibit 8, total regional sales in 2012 were over $850 billion, and annual exports were over $400 billion.Compared to the nation, Michigan has a slightly smaller share of its overall regional sales and exports originating from the natural resource–based industries. Michigan lags behind the national average most in the production sectors, which could present an opportunity for expansion.
Appendix E presents the regional sales and exports data, by category, for each Michigan Prosperity Region in the state. It shows that Regions 1, 2, 3, 4, and 8 (Upper Peninsula, Northwest, Northeast, West, and Southwest Michigan) have the most exports associated with natural resource–related industries, primarily due to strong production- and extraction-sector industries.
EXHIBIT 8. Michigan’s Regional Sales and Exports, 2012
SOURCE: Economic Modeling Specialists Intl.; Economy\Input-Output Model\Regional Jobs, Earnings, Sales and Exports Table, 4 and 6 Digit. Data for 2012.
Downloaded at www.economicmodeling.com as a product of contractual services between EMS and PSC. Collected July 2014.
OTHER ECONOMIC INDICATORS
In addition to the inputs and outputs evaluated by BLM in the Michigan Turnaround Plan, and the analysis of sales and exports, PSC evaluated two other economic indicators that play a role in determining the strength and growth potential of Michigan’s natural resources industries:
• SHIFT SHARE ANALYSIS, which looks as the current level of employment in an industry and estimates how much of the industry’s predicted growth or decline can be attributed to changes in the nation’s overall economy (national growth effect), how much can be attributed to predicted changes in the target industry at the national level (industry mix effect), and how much of the predicted employment change can be attributed to unique regional characteristics (regional competitiveness effect—which we are terming competitive advantage or disadvantage).
• LOCATION QUOTIENT ANALYSIS, which identifies how a region’s share of total employment in a given industry or industry cluster compares with the nation’s share of employment within that industry. A location quotient of 1 indicates that the regional employment percentage is the same as the national employment percentage, or that the industry’s share of regional employment is “average.” A location quotient greater than 1 indicates a larger share of employment devoted to the particular industry than the national average.
The shift share and location quotient analyses helped further identify natural resources industries with strong market share and high growth and/export potential. Appendices F and G provide detailed findings from the shift share and location quotient analyses.

24Growth Potential and Opportunities
The New Michigan Strategy evaluates Michigan’s status on industry inputs, outputs, and potential growth opportunities and strategies for each of the six identified asset areas. The intent of this plan is to identify which industries, with focused strategies and strong leadership, are particularly ripe for contributing to Michigan’s economic growth and market position.
Literature research, interviews with industry experts, and the economic/market competitiveness assessment were used to begin identifying key strengths, weaknesses, opportunities, and threats (SWOTs) for the four natural resource industry categories. In addition, a focus group of stakeholders was convened to review the results of the research and get their input on issues and opportunities, and potential strategies for growing Michigan’s natural resource economy.
It is clear from the research and input of industry stakeholders that Michigan is (or has the potential to) become a top performing state in several natural resource–based economies. The research findings in the previous section outline the major issues and opportunities associated with growing and making Michigan’s natural resource economy a Top Ten performing industry. Based on these findings, as well as input from the industry stakeholder focus group, we have summarized the SWOTs for each natural resource industry category and recommended priority natural resource industries and related strategies for growing those industries below.
NATURAL RESOURCES SECTOR STRENGTHS, WEAKNESSES, OPPORTUNITIES, AND THREATS
GROWTH POTENTIAL AND OPPORTUNITIES FOR MICHIGAN’S NATURAL RESOURCE
INDUSTRIES
AESTHETIC NATURAL RESOURCE INDUSTRIES
Our research indicates that Michigan could be a leader in tourism and outdoor recreation industries.Exhibit 9 lists some of the key SWOTs of Michigan’s aesthetic-based natural resource industries that affect the state’s market position and potential growth of these industries.
STRENGTHS AND OPPORTUNITIES
The international travel industry is growing, with more interest among millennials and retirees, and an increasing number of millionaires worldwide.
Beach-related travel is very popular, and Michigan has the second longest coastline in the U.S.
There is significant national momentum and attention for the Pure Michigan campaign. Forbes recently ranked the campaign as the sixth best tourism promotion campaign in the world.
Surveys of the millennial generation consistently show interest in quality of place when making location decisions, including easy access to high-quality outdoor recreation opportunities.
Michigan has over 12,000 miles of hiking, multiuse, equestrian, off-road vehicle, and snowmobile trails throughout the state. The 4,600-mile, multistate North Country Trail that runs through Michigan’s Lower and Upper Peninsula is the longest national scenic trail in the United States (MDNR 2012).
EXHIBIT 9. SWOTs of Michigan’s Aesthetic Natural Resource Industries
25 Growth Potential and Opportunities
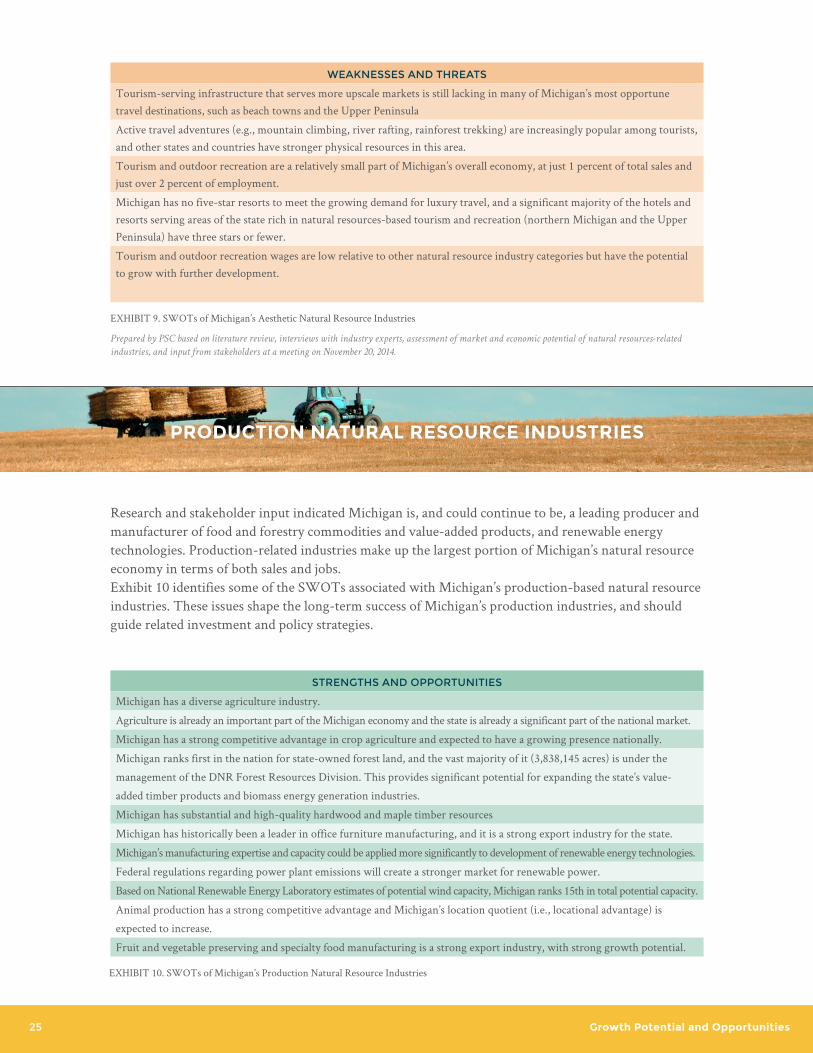
Research and stakeholder input indicated Michigan is, and could continue to be, a leading producer and manufacturer of food and forestry commodities and value-added products, and renewable energy technologies. Production-related industries make up the largest portion of Michigan’s natural resource economy in terms of both sales and jobs. Exhibit 10 identifies some of the SWOTs associated with Michigan’s production-based natural resource industries. These issues shape the long-term success of Michigan’s production industries, and should guide related investment and policy strategies.
STRENGTHS AND OPPORTUNITIES
Michigan has a diverse agriculture industry.
Agriculture is already an important part of the Michigan economy and the state is already a significant part of the national market.
Michigan has a strong competitive advantage in crop agriculture and expected to have a growing presence nationally.
Michigan ranks first in the nation for state-owned forest land, and the vast majority of it (3,838,145 acres) is under the
management of the DNR Forest Resources Division. This provides significant potential for expanding the state’s value-
added timber products and biomass energy generation industries.
Michigan has substantial and high-quality hardwood and maple timber resources
Michigan has historically been a leader in office furniture manufacturing, and it is a strong export industry for the state.
Michigan’s manufacturing expertise and capacity could be applied more significantly to development of renewable energy technologies.
Federal regulations regarding power plant emissions will create a stronger market for renewable power.
Based on National Renewable Energy Laboratory estimates of potential wind capacity, Michigan ranks 15th in total potential capacity.
Animal production has a strong competitive advantage and Michigan’s location quotient (i.e., locational advantage) is
expected to increase.
Fruit and vegetable preserving and specialty food manufacturing is a strong export industry, with strong growth potential.
WEAKNESSES AND THREATS
Tourism-serving infrastructure that serves more upscale markets is still lacking in many of Michigan’s most opportune travel destinations, such as beach towns and the Upper Peninsula
Active travel adventures (e.g., mountain climbing, river rafting, rainforest trekking) are increasingly popular among tourists, and other states and countries have stronger physical resources in this area.
Tourism and outdoor recreation are a relatively small part of Michigan’s overall economy, at just 1 percent of total sales and just over 2 percent of employment.
Michigan has no five-star resorts to meet the growing demand for luxury travel, and a significant majority of the hotels and resorts serving areas of the state rich in natural resources-based tourism and recreation (northern Michigan and the Upper Peninsula) have three stars or fewer.
Tourism and outdoor recreation wages are low relative to other natural resource industry categories but have the potential to grow with further development.
Prepared by PSC based on literature review, interviews with industry experts, assessment of market and economic potential of natural resources-related
industries, and input from stakeholders at a meeting on November 20, 2014.
EXHIBIT 10. SWOTs of Michigan’s Production Natural Resource Industries
EXHIBIT 9. SWOTs of Michigan’s Aesthetic Natural Resource Industries
PRODUCTION NATURAL RESOURCE INDUSTRIES

26Growth Potential and Opportunities
Research on Michigan’s future in mining and oil and gas production indicates the future growth of the extraction industry is mixed. While some experts see it as a historically important and potentially growing industry, others cite potential environmental issues and the lack of long-term industry sustainability.Exhibit 11 identifies some of the SWOTs associated with extraction-based industries that impact the economic position of Michigan’s mining, oil, and gas industries.
WEAKNESSES AND THREATS
Michigan’s transportation network is insufficient (in terms of quality and quantity) to adequately support a growing
production-based natural resources sector.
Timber resources on state, federal, and private lands are currently underutilized/underharvested.
Forest product industries (particularly furniture manufacturing) face pressure from international importers, such as China
and Vietnam. Michigan has a locational competitive disadvantage in the furniture manufacturing industry.
The price of renewable energy electricity is still higher than electricity produced by coal and natural gas.
There is a potential tightening of state land leases and permits, due to community backlash/“not in my backyard” (NIMBY)
sentiments associated with timber, agriculture, and renewable energy industries.
Plant diseases and pests can have significant impacts on Michigan’s agriculture industry in some years, and could be a
growing issue as climate change progresses.
Agriculture is often at the end of the line for gas and electric infrastructure, and lack of access to gas and electric service may
be limiting growth of some agricultural and food processing businesses
Automation in the agriculture sector may result in increased yields and sales, but will likely result in declining employment
over the longer term.
Prepared by PSC based on literature review, interviews with industry experts, assessment of market and economic potential of natural resources-related
industries, and input from stakeholders at a meeting on November 20, 2014.
EXHIBIT 10. SWOTs of Michigan’s Production Natural Resource Industries
EXTRACTION-BASED NATURAL RESOURCE INDUSTRIES
STRENGTHS AND OPPORTUNITIES
Michigan has a significant amount of mineral deposits and resources, particularly iron ore.
The alumina/aluminum product and processing (3313) and other nonmetallic mineral production manufacturing (3279) industries are expected to have strong job growth over the next ten years, and that Michigan has a competitive advantage compared to many of other Midwestern states.
Forging/stamping is a strong export industry for the state, and Michigan is expected to have higher growth than competing states.
The mining industry offers high-paying jobs compared to other natural resource industries, and average wages for the oil and gas industry are among the most competitive of all natural resource-based industries.
The Antrim Shale geologic formation offers significant natural gas storage opportunities.
New technologies have opened up oil and gas extraction opportunities, and there has been increased drilling in recent
years—particularly in Jackson, Calhoun and Lenawee Counties.
EXHIBIT 11. SWOTs of Michigan’s Extraction Natural Resource Industries

27 Growth Potential and Opportunities
STRENGTHS AND OPPORTUNITIES
Michigan already has significant expertise and a strong reputation in agricultural R&D, particularly at Michigan State University (MSU). MSU is ranked 21st in the world for its agricultural sciences programs (Morse and Foster 2014) and its AgBioResearch program funds research of more than 300 scientists (MSU n.d.).
Michigan already has over 350 emerging water technology-related companies (Pezza 2014), and the Michigan Economic Development Corporation has been cultivating this industry by exploring applicable national and global models.
Michigan has nine university water research centers. The University Research Corridor (University of Michigan, Wayne State, Michigan State University) alone was awarded almost $300 million in grants for water research, education, and outreach programs between 2009 and 2013 (AEG 2014).
Michigan universities are home to several distinguished natural resource-oriented programs including (but not limited to) MSU’s federal Forest Sciences Laboratory and Experiment Station, University of Michigan’s Graham Environmental Sustainability Institute, Grand Valley State University’s Annis Water Research Center, Wayne State University’s Environmental Sciences program, Michigan Technological University’s Geological and Mining Sciences program, and Western Michigan University’s Environmental Institute.
Michigan already has numerous anchor companies involved in natural resources (or natural resource-related) research and product development, such as Dow Chemical, Nestle Global, BASF, and Whirlpool.
EXHIBIT 12. SWOTs of Michigan’s Natural Resources Cross-sector Support Industries
WEAKNESSES AND THREATS
Potential tightening of state land leases and permits due to community backlash/NIMBYism could limit industry expansion, particularly around fracking for natural gas.
Minerals, oil, and gas are nonrenewable resources, making long-term sustainability of those industries a challenge.
The iron and steel mills/ferroalloy manufacturing sector is strong for Michigan, but is predicted to have stagnant job growth over the next ten years, due to national industry-level changes.
Foundries have historically been the largest extraction industry employer in Michigan but nationally the industry is declining and Michigan is projected to have a competitive disadvantage in the future.
Mining, oil, and gas operations do not employ significant numbers of people. The mining industry has employed less than 30,000 people statewide in 2014 (1.1 percent of total jobs in Michigan), and oil and gas operations employed fewer than 800 people statewide in 2014.
Prepared by PSC based on literature review, interviews with industry experts, assessment of market and economic potential of natural resources-related
industries, and input from stakeholders at a meeting on November 20, 2014.
EXHIBIT 11. SWOTs of Michigan’s Extraction Natural Resource Industries
NATURAL RESOURCES CROSS-SECTOR SUPPORT INDUSTRIES
Natural resources also play a role in supporting other Michigan industries, through research and develop-ment of new products and the processing and transport of goods and services (primarily along Michigan’s waterways). Regional, state and national literature all cite the importance of R&D in addressing natural resources sustainability issues, and several experts noted that Michigan has an opportunity to be known for high-quality natural resources and an ability to solve tough sustainability issues. Exhibit 12 lists some of the key SWOTs for Michigan’s natural resource cross-sector support industries.

28Growth Potential and Opportunities
RECOMMENDED INDUSTRY PRIORITIES
Based on the research and evaluation of industries, it is clear that Michigan has the natural resource assets to become a Top Ten natural resource economy state, particularly in the areas of: • Tourism• Outdoor recreation• Agriculture (crop and animal production) and food processing• Timber and value-added timber products• Renewable energy
These sectors met three or more of the five economic/market position criteria, two or more of the three industry strategy or policy criteria, and were identified as having strong synergies with other natural resource sectors (e.g., products or waste used in that industry providing value to another industry).
Natural resources research and development showed strong economic and market position, as well as synergy with other sectors, but does not have a specific statewide strategy and little specific mention in the regions’ CEDS. However, it is a critical support to growing several of the priority industries, and is included as an important strategy in the state’s tourism, agriculture, timber, recreation, and (forth-coming) water strategies. As such, this business plan identifies related objectives and strategies for enhancing the state’s natural resources R&D efforts as well.
As discussed in the Overview section, other industries such as mining, oil/gas production, and Great Lakes shipping are also very relevant and, in some cases, significant natural resource industries for Michigan that offer growth opportunities. While the recommended focus of this business plan is on the seven priority industries identified above, these additional industries are also an important part of Michigan’s economy and should continue to be fostered and supported wherever possible.
Michigan is also uniquely situated to benefit economically from its freshwater resources—both as an input to other industries (e.g., agriculture and manufacturing) and as a continued part of making Michigan an attractive place to live and do business. Michigan’s freshwater resources will become an even more distinctive competitive opportunity over time, as global climate change impacts supply and demand for freshwater resources.
Exhibit 13 identifies the key Michigan natural resource industries and the criteria by which PSC and SWW evaluated and prioritized industry opportunities.
WEAKNESSES AND THREATS
Improving the commercializing of university research remains a long-term process.
There have not been comprehensive partnerships between universities and the private sector on natural resources research institutes or centers (although there have been numerous individual and topic-specific partnerships).
Michigan universities do not routinely rank in the top ten or 20 for environmental sciences and natural resource conserva-tion, research, and management programs.
Prepared by PSC based on literature review, interviews with industry experts, assessment of market and economic potential of natural resources-related
industries, and input from stakeholders at a meeting on November 20, 2014.
EXHIBIT 12. SWOTs of Michigan’s Natural Resources Cross-sector Support Industries

29
Gro
wth
Po
ten
tial a
nd
Op
po
rtun
ities
Prepared by PSC based on research findings from 2014
EXHIBIT 13. Priority Natural Resource Industry Opportunity Areas and Criteria
Has
an
exis
ting
stat
ewid
e in
dust
ry st
rate
gy
Iden
tifie
d as
a p
rior
ity in
> h
alf
of re
gion
al e
cono
mic
pla
ns
Stro
ng sy
nerg
y w
ith o
ther
na
tura
l res
ourc
e in
dust
ries
Stro
ng L
Q
Com
petit
ive
adva
ntag
e
Indu
stry
expe
cted
to g
row
nat
iona
lly
Cur
rent
ly ra
nked
in to
p 20
stat
es
by re
leva
nt in
udst
ry jo
urna
ls
Cur
rent
ly ra
nked
in T
op 1
0 St
ates
by
rele
vant
indu
stry
jour
nals
The
re a
re e
xist
ing
stat
e po
licie
s ge
ared
tow
ard
grow
ing
the
indu
stry
EXISTING STRATEGIES
AND POLICIES
INDUSTRIES IDENTIFIED
SYNERGIESECONOMIC AND MARKET
COMPETITIVENESS STRENGHTS
Agriculture (crop and animals)
Food processing
Tourism (accommodations, atttractions)
Outdoor recreation (sporting goods sales, manufacturing, rental)
Timber and value-added forest products
Research and development
Mining (ferrous and nonferrous)
Shipping transport n/a
n/a
n/a
Oil and gas development and storage
30Growth Potential and Opportunities
POTENTIAL GROWTH STRATEGIES
This report identifies the following potential growth strategies that public and private stakeholders could pursue in order to help Michigan realize these natural resource economy opportunities. These are based on our research (including review of goals and strategies in existing state or regional strategic plans), economic and market analysis, interview with experts, and goals and actions identified by stakeholders.
Underpinning all of these strategies is the need for Michigan to continue to allocate and invest resources (such as the Michigan Natural Resources Trust Fund, federal farmland and watershed protec-tion funding, and public-private economic development resources) in protecting, enhancing, and promoting Michigan’s natural resources in order to support priority industries.
STRATEGY #1: Improve public infrastructure that supports Michigan’s natural resources industries, particularly rail and highway improvements that support export of agriculture, timber, and mining products, and improve the efficiency and access to highly demanded tourism destinations in Michigan.• Integrate and prioritize (where applicable) natural resource industry priorities into the ongoing
implementation of the Michigan Logistics and Supply Chain Strategic Plan. That strategic plan already recognizes the importance of a high-quality and adequate logistics infrastructure system to supporting many of Michigan’s natural resources industries. As specific actions and investment plans are developed, natural resources industry leaders should be engaged to help prioritize rail, highway, and shipping improvements that better enable the fast and efficient transport of natural resource commodities and goods.
• Evaluate and implement high-priority, tourism-serving passenger transportation opportunities, such as highway and rail improvements linking Michigan to key domestic and Canadian tourism markets, and airport expansions in popular but hard to reach tourism destinations (e.g., Northwest Michigan, the Upper Peninsula). Potential actions include:
• Build and upgrade interstate highway corridors to Indiana, Ohio, and Canada.• Upgrade airports in Northwest Michigan and the Upper Peninsula. • Develop passenger rail access between Chicago and Northwest Michigan and improve rail along the
I-94 corridor to Detroit to improve travel times and frequency.• Expand broadband access and energy infrastructure (renewable and nonrenewable) in underserved
rural areas that support business growth and technologic innovation in Michigan’s agriculture, food processing, and wood products industries.
• Promote continued intelligent deployment of renewable energy infrastructure, particularly wind and biomass.
STRATEGY #2: Expand and enhance tourism and outdoor recreation amenities and services, and continue to expand the national and international promotion of Michigan’s tourism assets, in order to increase the number of visitors to the state and tourism-serving businesses/jobs in Michigan.• The Michigan Economic Development Corporation (MEDC) and regional economic development
councils should partner with the private sector to develop more high-quality tourism products and amenities. In particular, focusing investment on upscale, active travel resorts and accommodations in Northern Michigan and the Upper Peninsula to meet internationally growing demand.
31 Growth Potential and Opportunities
• Invest in and implement high-priority trail infrastructure (and related amenities and community connections) recommended in the Michigan Comprehensive Trails Plan, the Michigan State Parks and Recreation Blue Ribbon Panel recommendation plan, the Michigan Statewide Comprehensive Outdoor Recreation Plan, and the Governor’s Iron Belle Showcase Trail Plan. Michigan is already known as a leading trails state and making investments in the development of new trails and comple-tion of key trail connections, community connections (Trail Towns©), and a cross-state showcase trails will help attract tourists and outdoor recreation enthusiasts and grow trail-serving businesses. Continue to augment annual funding for the Pure Michigan marketing campaign in order to expand its geographic reach, target new demographic markets, and increase overall market penetration.
• Implement priority recommendations for land acquisition, disposal, and management in the Michigan Department of Natural Resources’ 2013 Managed Public Land Strategy.
STRATEGY #3: Focus the state’s existing public and private research and development assets on making Michigan a national leader in the innovation of sustainable natural resources products and processes. • Expand investment in public and private R&D in order to be a leader in natural resources sustain-
ability innovation. Potential options for targeting investments include creating a capital investment fund to support basic and early stage research and development (university and private sector); developing a public-private “X Prize” challenge grant program that provides award dollars to researchers who develop new technologies or processes for addressing key food systems, water, energy, or sustainability issues; and endowing faculty positions in key resource areas that help attract R&D dollars and talent and accelerate the commercialization of university research.
STRATEGY #4: Provide an attractive and affordable working environment in order to ensure an adequate labor force to support the growth of Michigan’s natural resources industries.• Ensure Michigan’s job training programs provide adequate capacity to train workers for tourism, agricul-
ture and natural resource industries and promote immigration policies that attract additional workers.
STRATEGY #5: Ensure dedicated leadership and accountability for the implementation of this natural resources business plan.• Develop a Natural Resources Roundtable composed of the key stakeholders in the priority sectors
outlined in this report to champion the strategies and report progress.
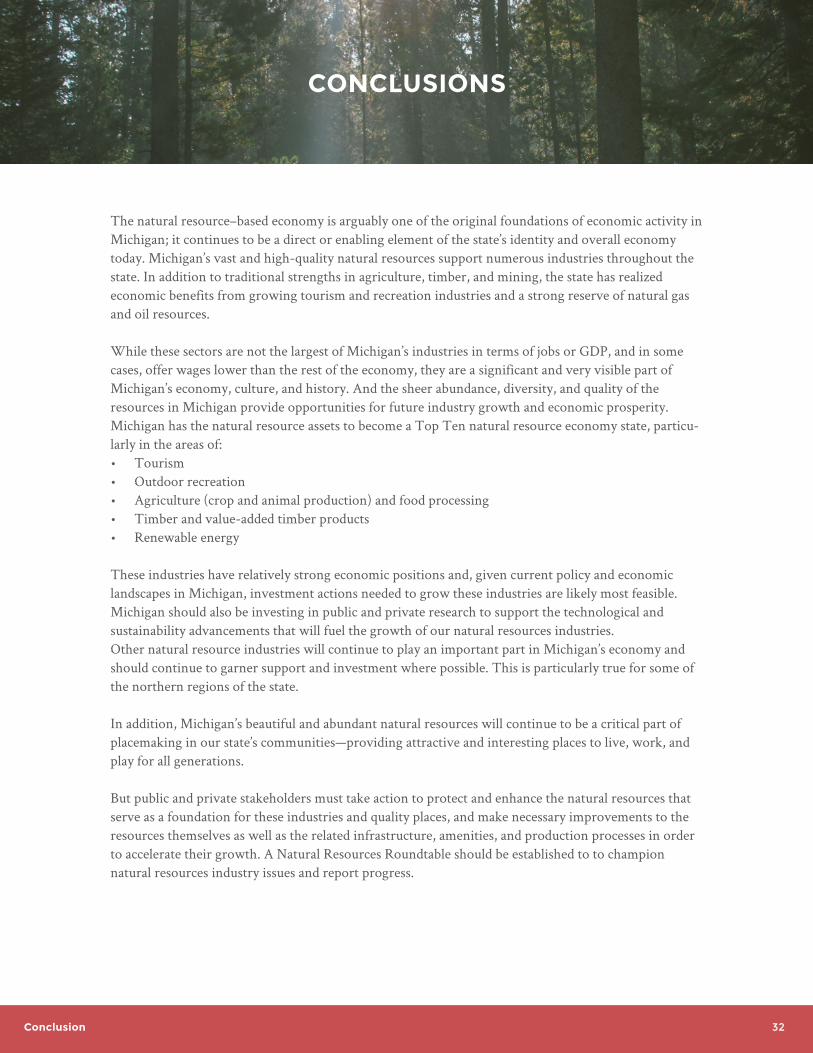
32Conclusion
CONCLUSIONS
The natural resource–based economy is arguably one of the original foundations of economic activity in Michigan; it continues to be a direct or enabling element of the state’s identity and overall economy today. Michigan’s vast and high-quality natural resources support numerous industries throughout the state. In addition to traditional strengths in agriculture, timber, and mining, the state has realized economic benefits from growing tourism and recreation industries and a strong reserve of natural gas and oil resources.
While these sectors are not the largest of Michigan’s industries in terms of jobs or GDP, and in some cases, offer wages lower than the rest of the economy, they are a significant and very visible part of Michigan’s economy, culture, and history. And the sheer abundance, diversity, and quality of the resources in Michigan provide opportunities for future industry growth and economic prosperity. Michigan has the natural resource assets to become a Top Ten natural resource economy state, particu-larly in the areas of: • Tourism• Outdoor recreation• Agriculture (crop and animal production) and food processing• Timber and value-added timber products• Renewable energy
These industries have relatively strong economic positions and, given current policy and economic landscapes in Michigan, investment actions needed to grow these industries are likely most feasible. Michigan should also be investing in public and private research to support the technological and sustainability advancements that will fuel the growth of our natural resources industries.Other natural resource industries will continue to play an important part in Michigan’s economy and should continue to garner support and investment where possible. This is particularly true for some of the northern regions of the state.
In addition, Michigan’s beautiful and abundant natural resources will continue to be a critical part of placemaking in our state’s communities—providing attractive and interesting places to live, work, and play for all generations.
But public and private stakeholders must take action to protect and enhance the natural resources that serve as a foundation for these industries and quality places, and make necessary improvements to the resources themselves as well as the related infrastructure, amenities, and production processes in order to accelerate their growth. A Natural Resources Roundtable should be established to to champion natural resources industry issues and report progress.

33
American Wind Energy Association (AWEA). 2015. Michigan Wind Energy Statistics. Online, accessed 9/1/14. Available at: www.awea.org/Resources/state.aspx?ItemNumber=5216
Anderson Economic Group (AEG). 2014. Innovating for the Blue Economy: Water Research and Innovation at the URC. Prepared for the University Research Corridor. Online, accessed 8/2/14. Available at: http://urcmich.org/ news/2014water/URC_Water-Industry-Sector.pdf
Austin, John. N.d. Water, Michigan and the Growing Blue Economy. Michigan Economic Center. Lansing: MI. Online, accessed 7/22/14. Available at: http://mieconomiccenter.org/News/tabid/90/ID/52/REPORT-Water-Michigan-and-the- Growing-Blue-Economy.aspx
Baldwin, Julie of the Michigan Public Service Commission. E-mail communication to Sally Talberg (Michigan Public Service Commission) and Shanna Draheim. January 7, 2015.
BBC Research and Consulting. June 2014. Community and Economic Benefits of Bicycling in Michigan. Prepared for the Michigan Department of Transportation. Online, accessed 9/17/14. Available at: www.michigan.gov/mdot/0,4616,7-151-9615_11223_64797_69435---,00.html
Business Leaders for Michigan. 2014. Michigan Turnaround Plan (updated). Online, accessed 9/7/14. Available at: www. businessleadersformichigan.com/storage/documents/michigan-turnaround-plan/Final%202014%20MTP.pdf
______. 2015. New Michigan Report 2015. Online, accessed 6/14/15. Available at http://static1.1.sqspcdn.com/static/f/939177/26081633/1427387603817/NewMichiganBooklet2015v2. pdf?token=Q3WmvksxmRjhy5O8pYZKIrFXm0Q%3D
Central Upper Peninsula Planning and Development Regional Commission. March 7, 2014. Progress Report and Amendments to the Comprehensive Economic Development Strategy Report. Online, accessed 7/1/14. Available at: www.cuppad.org/Documents/ceds.pdf
Eastern Michigan Council of Governments. 2013. 2013 Supplemental Report to the 2010 Comprehensive Economic Development Strategy. Online, accessed 6/22/14. Available at: www.emcog.org/sitedocs/2013%20EMCOG%20 CEDS%20Update%20April%201,%202013.pdf
Eastern Upper Peninsula Planning and Development Regional Commission. 2012. 2011–2012 Update to the 2010–2015 Comprehensive Economic Development Strategy. Online, accessed 9/30/14. Available at: www.eup-planning.org/PDF/DOCUMENTS/ECON/CEDS_2012.pdf
Energy Innovation Business Council. 2011. Economic Impact of New Energy Manufacturing in Michigan. Online, accessed 1/3/15. Available at: http://instituteforenergyinnovation.org/files/dmfile/ EconomicImpactofNewEnergyManufacturinginMichigan2.pdf
Ernst and Young. 2013. U.S. Renewable Energy Attractiveness Indices. Online, accessed 12/30/14. Available at: www.ey.com/Publication/vwLUAssets/United_States_renewable_energy _attractiveness_indices/$FILE/ United_States_renewable_energy_attractiveness_indices.pdf
Fluid Equipment Development Company. N.d. Fluid Equipment Development Company website. Online, accessed 10/24/14. Available at: www.fedco-usa.com/?q=node/1%20%3D%3E%20about%20fedco
Lambert, Emily. May 24, 2012. A Mining Rush in the Upper Peninsula. New York Times. Online, accessed 9/25/14. Available at: www.nytimes.com/2012/05/25/business/in-mining-some-michigan-towns-see-hope.html?pagewanted=all&_r=0
Longwoods International. 2014. Michigan 2013 Tourism Advertising Evaluation and Image Study. Online, accessed 9/6/14. Available at: www.michiganbusiness.org/cm/Files/Reports/MI-2013-Ntl-Tourism-Advertising-Evaluation-and-Image- Study-Report.pdf
Lopez, A., B. Roberts, D. Heimiller, N. Blair, and G. Porro. July, 2012. U.S. renewable energy technical potentials: A GIS-based analysis. Golden, CO: National Renewable Energy Laboratory. Online, accessed 1/7/15. Available at: www.nrel.gov/ docs/fy12osti/51946.pdf.
REFERENCES
References

34
McKinsey and Company. 2011. Growing the New Michigan – Natural Resources Economy. Online, accessed 10/24/14. Available at: www.businessleadersformichigan.com/storage/documents/research-and-reports/michigan-turn-around-plan/Appendix%20Natural%20Resources%20Economy.pdf
Michigan Department of Agriculture and Rural Development (MDARD). 2014. Michigan Agriculture Snapshot. Online, accessed 9/8/14. Available at: www.michigan.gov/documents/mdard/MDARD_Snapshot_4-7-2014_453066_7.pdf?20140929183724
___. August 2014. Michigan Strategic Growth Initiative 2014 - Overview. Online, accessed 7/8/14. Available at: www.michigan.gov/mdard/0,1607,7-125-1568_51684---,00.html
___. N.d. Michigan’s Food and Agriculture Industry. Online, accessed 8/20/14. Available at: www.michigan.gov/documents/mdard/1262-AgReport-2012_2_404589_7.pdf?20140929183911
Michigan Department of Natural Resources and Environment (now Michigan Department of Natural Resources). 2010. Michigan Forest Resource Assessment and Strategy. Online, accessed 10/1/14. Available at: www.michigan.gov/documents/dnr/Strategic_457570_7.pdf
Michigan Department of Licensing and Regulatory Affairs. N.d. About Michigan’s Natural Gas Industry: Exploration and Production. Online, accessed 9/30/14. Available at: www.dleg.state.mi.us/mpsc/gas/about1.htm
Michigan Department of Natural Resources (MDNR). July 1, 2013. Managed Public Land Strategy. Online, accessed 8/4/14. Available at: www.michigan.gov/documents/dnr/Draft_DNR_Public_Land_Management_Strategy-5-24-13_422381_7.pdf
___. December 2012. Michigan Statewide Comprehensive Outdoor Recreation Plan: 2013–2017. Online, accessed 7/25/14. Available at: www.michigandnr.com/publications/pdfs/grants/scorp%20final%20report.pdf
Michigan Economic Development Corporation (MEDC). March 11, 2014. Pure Michigan Campaign Drives $1.2 billion in Visitor Spending. Online, accessed 9/10/14. Available at: www.michigan.org/pressreleases/pure-michigan-campaign-drives-$1-2-billion-in-visitor-spending/
Michigan Forest Products Council. 2014. The Business of Trees: 2014 Annual Report. Online, accessed 12/30/14. Available at: http://michiganforest.com/sites/default/files/resources/files/MFPC-2014annual%20%281%29_0.pdf
Michigan Legislature. 2008. Public Act 295 of 2008: Michigan Clean, Renewable and Efficient Energy Act. Online, accessed 7/26/14. Available at: www.legislature.mi.gov/%28S%285pgyj3nikdx24z55j1brtm3y%29%29/mileg.aspx?page=getobject&objectName=mcl-act-295-of-2008
Michigan Mining Association. N.d. Mining in Michigan Facts. Online, accessed 8/24/14. Available at: www.michiganmining.org/facts.html
Michigan Oil and Gas Producers Education Foundation. N.d. Digital Library. Online, accessed 8/25/14. Available at: www.mogpef.org/Library.aspx
Michigan Sea Grant. February 2009. Michigan’s Great Lakes Jobs. Online, accessed 9/15/14. Available at: www.miseagrant.umich.edu/downloads/coastal/economy/09-101-Jobs-Report.pdf
Michigan State University (MSU). N.d. Rankings and Recognitions. Online, accessed 1/6/15. Available at: www.msu.edu/about/rankings-and-recognitions/
Michigan Wind Energy Resource Zone Board. 2009. Final Report. Online, accessed 8/8/14. Available at: www.dleg.state.mi.us/mpsc/renewables/windboard/werzb_final_report.pdf
Morse, Robert and Melinda Foster. October 27, 2014. Best Global Universities for Agricultural Sciences. U.S. News and World Report. Online, accessed 12/30/14. Available: www.usnews.com/education/best-global-universities/agricultural-sciences
Nicholls, Sarah. N.d. Pure Michigan: A Plan for the Industry by the Industry: 2012–2017 Michigan Tourism Strategic Plan. Online, accessed 9/5/14. Available at: www.michigan.org/lib/files/Industry/Tourism_Strategic_Plan/Tourism_Strategic_Plan.pdf
Northeast Michigan Council of Governments. 2012. Comprehensive Economic Development Strategy, 2012 Annual Update. Online, accessed 9/30/14. Available at: www.nemcog.org/downloads/nemcog_ceds_2012_updatefinal_updated_0612.pdf
Northwest Michigan Council of Governments. June 2014. 2014 Comprehensive Economic Development Strategy (CEDS). Online, accessed 9/30/14. Available at: www.networksnorthwest.org/userfiles/filemanager/2818/
Outdoor Recreation Association. N.d. Michigan: The Outdoor Recreation Economy. Online, accessed 8/22/14. Available at: https://outdoorindustry.org/images/ore_reports/MI-michigan-outdoorrecreationeconomy-oia.pdf
Pezza, Gil. Call with Shanna Draheim. October 30, 2014.
Region 2 Planning Commission. October 2010. Comprehensive Economic Development Strategy. Online, accessed 9/30/14. Available at: www.region2planning.com/website/imagenavigation/Miscellaneous/Economic_Development/R2PC_CEDS_2010ed.pdf
References

35
Resonance Consultancy. 2014. 2014 Trends in Travel and Tourism. Online, accessed 9/6/14. Available at: www.slideshare.net/chrisfair/2014-travel-tourism-trends-28171651
Southwest Michigan Planning Commission. 2013. Comprehensive Economic Development Strategy. Online, accessed 9/30/14. Available at: www.swmpc.org/downloads/2013ceds_final.pdf
State of Michigan. N.d. Michigan’s Logistics and Supply Chain Strategic Plan 2013–2020. Online, accessed 8/2/14. Available at: www.michiganbusiness.org/cm/files/reports/logistics_strategic_plan-12.pdf
The Michigan State Parks and Outdoor Recreation Blue Ribbon Panel. September 23, 2012. The Future of Michigan’s Parks and Outdoor Recreation: A Report to Governor Rick Snyder. Online, accessed 7/15/14. Available at: www.pscinc.com/LinkClick.aspx?fileticket=ZHl-PRDlZ-U%3d&tabid=65
Tri County Regional Planning Commission. June 2013. Regional Momentum A Comprehensive Economic Development Strategy For the Michigan Greater Lansing Area of Clinton, Eaton, and Ingham Counties. Online, accessed 6/22/14. Available at: www.tri-co.org/econ.dev/CEDS_2013_Final_6-13.pdf
U.S. Census Bureau. 2012. Statistical Abstract of the United States. Online, accessed 10/29/14. Available at: www.census.gov/compendia/statab/2012edition.html
U.S. Census Bureau. 2012. County Business Patterns. Online, accessed 1/12/15. Available at: www.census.gov/econ/cbp/
U.S. Department of Energy, Energy Efficiency and Renewable Energy. February 4, 2010. Estimates of Windy1 Land Area and Wind Energy Potential, by State, for areas >= 30% Capacity Factor at 80m. Online, accessed 1/7/15. Available at: http://apps2.eere.energy.gov/wind/windexchange/wind_resource_maps.asp?stateab=mi
U.S. Department of Energy, National Renewable Energy Laboratory. December 31, 2013. Installed Wind Capacity by State. Online, accessed 1/6/15. Available at: http://apps2.eere.energy.gov/wind/windexchange/wind_installed_capacity.asp
U.S. Energy Information Administration. March 2014. Michigan State Energy Profile. Online, accessed 1/7/15. Available at: www.eia.gov/state/?sid=MI
U.S. Geological Survey. 2014. Mineral Commodity Summaries 2014. Online, accessed 1/7/15. Available at: http://minerals.usgs.gov/minerals/pubs/mcs/2014/mcs2014.pdf
U.S. Geological Survey. July 2013. 2011 Minerals Yearbook: Statistical Summary. Online, accessed 1/7/15. Available at: http://minerals.usgs.gov/minerals/pubs/commodity/statistical_summary/myb1-2011-stati.pdf
U.S. Travel Association. 2012. Travel Means Jobs. Online, accessed 1/12/15. Available at: https://www.ustravel.org/sites/default/files/page/2012/08/e-Travel_Means_Jobs-2012.pdf.
West Michigan Regional Planning Commission. January 2013. 2012 Comprehensive Economic Development Strategy. Online, accessed 9/30/14. Available at: www.wmrpc.org/economic_development/CEDS_reports/2012_CEDS.pdf
West Michigan Shoreline Regional Development Commission. January 2014. Comprehensive Economic Development Strategy. Online, accessed 9/30/14. Available at: www.wmsrdc.org/Download/2014%20CEDS.pdf
Wilson, John R. and Johannes W. Schwank. September 3, 2013. The Application of Hydraulic Fracturing Technologies to Michigan Oil and Gas Recovery. Graham Sustainability Institute Integrated Assessment Report Series, Volume II, Report 2. Online, accessed 4/23/15. Available at: http://graham.umich.edu/media/pubs/HF-02-Technology.pdf.
References

36
APPENDIX A: COMPLETE PROJECT METHODOLOGY
PHASE I METHODOLOGY
The purpose of Phase I (Scoping and Research) was to build on the initial list of industries identified by BLM in 2011 (McKinsey and Company 2011) as potentially strong natural resource industries in Michigan by reviewing existing state and regional natural resource based economic strategies and interviewing industry experts.
For the literature research, PSC reviewed relevant plans related to regional and state natural resource and economic development, such as regional comprehensive economic development strategies, industry/sector strategic plans, and state management plans. The resources reviewed are included in the references.
For the interviews, PSC and SWW worked with BLM to select a group of thought leaders and industry experts. The list was expanded as interviewees suggested additional people to include in the process (see Appendix A for the list of stakeholders interviewed). The team developed an interview guide (provided in Appendix B) and met with each interviewee for approximately 45 minutes to an hour. The group of experts interviewed included representatives from each of the four industry areas described above and included a mix of participants from the public, private, university, and nonprofit sectors.
PHASE II METHODOLOGY
In Phase II, economic evaluation and competitive assessment, PSC conducted a thorough economic analysis of Michigan’s natural resource–based industries. The purpose of this investigation was to:• Get a picture of Michigan’s natural resource–-based industries by looking at current employment,
total earnings, number of establishments, and employment changes at a regional and state level, as well as compared to competitor states
• Identify natural resource–based industries that currently have or could have growth potential and therefore may play a key role in Michigan’s natural resource economy
Public Sector Consultants (PSC) reviewed multiple sources of data to investigate the historic, current, and predicted future strength of Michigan’s natural resource economy. The primary level of analysis is industry sectors, down to the four-digit North American Industry Classification System (NAICS) code level, with a few exceptions (such as recreation goods rental, which would otherwise not be included due to the industries it is grouped with). This allows for a detailed look into which natural resource industry sectors are strong in Michigan or could have the potential for growth, without losing site of the broader picture by digging too deep into the weeds. The primary source utilized for this analysis comes from Economic Modeling Solutions Inc. (EMSI). EMSI builds it database and projections by accessing over 90 sources of data including multiple sources within the Bureau of Economic Analysis, the U.S. Census Bureau, the Bureau of Labor Statistics, and others. This allows for a more robust analysis of current trends and more accurate predictions than would be possible with merely a few sources.
Appendix A

37
For industries with fewer than ten employees, the U.S. Census bureau does not report the exact number of employees and instead reports it as “<10.” In other words, there is exact job numbers hidden in the reported figure of <10. As such, PSC removes numbers reported as “<10” from our calculations, resulting in an under reporting of the actual employment numbers. This may play a role in the very low level of employment for sectors such as wind power generation. This is generally a bigger issue when looking at regional employment levels because there are more industries that have fewer than ten employees within a region versus at the state level.
Previous research into the natural resource–related industries was utilized as the groundwork for identifying industries to include in this analysis. Reports reviewed include: Growing the New Michigan-Natural Resources Economy, prepared by McKinsey & Company for the BLM (McKinsey and Company 2011); Innovating for the Blue Economy: Water Research at the URC, prepared by Anderson Economic Group for the University Research Corridor (Anderson Economic Group 2014); and the U.S. Census Bureau’s Statistical Abstract of the United States for natural resource–related industries (U.S. Census Bureau 2012).
After a thorough review of previous work and incorporating the guidance of the key interviews conducted in Phase I, 72 industries were selected (68 four-digit industries and four six-digit industries) and are presented in Appendix C. This represents an additional 27 industries beyond those included in the 2011 report on the natural resource economy (McKinsey and Company 2011). Some of these industries may already be included in other sector business plans developed by BLM as part of the Michigan Turnaround Plan. They are incorporated here as well because of their strong tie to the natural resource economy. Additionally, three industries from the 2011 McKinsey Report were removed from the analysis because of a weaker relationship to the natural resource economy.
PSC reviewed data for Michigan as a whole and for its economic regions, as well as data for comparison states. The following measures were evaluated:• EMPLOYMENT AND TOTAL EARNINGS. PSC investigated the past, present, and predicted future
number of jobs and associated current earnings by each sector for Michigan, as well as comparison state and the economic regions within Michigan. This allows us to see the relative size of each industry in terms of its impact on local populations. A large number of jobs with a high wage are strong contributors to local prosperity and growth, while a few jobs at a low wage may not be an industry worth exerting effort for expansion in terms of its impact on local prosperity.
• SALES, EXPORTS, AND ESTABLISHMENTS. While the total number of jobs and earnings give an indication of an industry’s relative size and impact on employment levels, industry sales and number of establishments shows how consolidated or dispersed an industry may be. While each industry was investigated individually, only aggregate category-level data is presented in this report. This allows for easy high-level comparisons to other states to get a sense of the relative size of Michigan’s natural resource economy.
• SHIFT-SHARE ANALYSIS. A shift-share analysis looks as the current level of employment in an industry and estimates how much of the industry’s predicted growth or decline can be attributed to changes in the nation’s overall economy (national growth effect), how much can be attributed to predicted changes in the target industry at the national level (industry mix effect), and how much of the predicted employment change can be attributed to unique regional characteristics (regional competitiveness effect).
Appendix A

38
The most important of these for a state is the regional competitiveness effect. This can indicate whether a state is outperforming other states in terms of job growth or stemming decline. For example, if an industry is predicted to decline at the national level (negative industry mix effect), a positive regional competitiveness effect means the local industry may be performing better than the notational average even if still in decline. As the national growth effect and the industry mix effect are based on the total share of employment in an industry and the projected national change, we will focus on the competitive effect for comparison with other states (that is, if national growth is projected to be 3 percent, all jobs in that industry will have an increase in employment of 3percent).
• LOCATION QUOTIENT ANALYSIS. Simply put, a location quotient identifies how a region’s share of total employment in a given industry or industry cluster compares with the nation’s share of employment within that industry. A location quotient of 1 indicates that the regional employment percentage is the same as the national employment percentage, or that the industry’s share of regional employment is “average.” A location quotient greater than 1 indicates a larger share of employment devoted to the particular industry than the national average. A location quotient of 1.25 or greater may be an indication of an exporting industry, but this is not always the case. A location quotient cannot be interpreted in a vacuum; projected growth and relative size (in terms of employment) play key roles in identifying strong or growing industries. Exhibit 1-A provides an illustration of how to interpret location quotient findings.
BELOW AVERAGE EMPLOYMENT
CONCENTRATION AND DECLINING
(too many industries in this quadrant may
indicate diversification or business
attraction is needed)
ABOVE AVERAGE EMPLOYMENT
CONCENTRATION, BUT DECLINING
(warning for the economy when industries
with large employment are in this quadrant)
ABOVE AVERAGE EMPLOYMENT
CONCENTRATION AND A
GROWING CONCENTRATION
(industries with large employment are
important to the economy)
BELOW AVERAGE EMPLOYMENT
CONCENTRATION, BUT GROWING
(“Pre-emergent” industries)
SOURCE: Created by PSC based on descriptions of location quotient analysis available from Economic Modeling Specialists Intl.; EMSI Resource Library,
Understanding Location Quotient. Downloaded from www.economicmodeling.com as a product of contractual services between EMSI and PSC. Collected July 2014.
EXHIBIT 1-A. Simplified Location Quotient Interpretation
Appendix A

39
APPENDIX B:STAKEHOLDERS ENGAGED IN THE PROJECT
INTERVIEWED DURING PHASE I
• Jon Allan, Director, Michigan Department of Environmental Quality Office of Great Lakes• John Austin, Director, Michigan Economic Center• Steve Bakkal, Director, Michigan Energy Office• Ian Bund, Senior Advisor, Plymouth Ventures• Chris Kolb, President, Michigan Environmental Council• Scott Lampert, Founder-owner, Paxton Resources and Michigan Oil and Gas Association• Erin McDonough, President, Michigan Oil and Gas Association
(formerly with Michigan United Conservation Clubs)• Mark Murray, President, Meijer Stores• Chris Peterson, Homer Nowlin Chair of Consumer-responsive Agriculture,
Michigan State University Product Center• Gil Pezza, Senior Project Manager, Michigan Economic Development Corporation• Scott Piggott, Chief Operating Officer, Michigan Farm Bureau• J.R. Richardson, Technical and Regulatory Affairs, Traxys Worldwide
and Michigan Natural Resources Commission member• Lou Anna Simon, President, Michigan State University• Donna Stine, (formerly) Policy Coordinator, Michigan
Department of Natural Resources• Helen Taylor, State Director, The Nature Conservancy• Bill Young, President, Absopure Water Company
PARTICIPATED IN STAKEHOLDER FOCUS GROUP IN NOVEMBER 2014
• John Austin, Director, Michigan Economic Center• Rich Bowman, Director of Government Relations, The Nature Conservancy• Emily Finnell, Michigan Office of the Great Lakes• Jim Goodheart, Senior Policy Advisor, Michigan Department of Environmental Quality• Jonathan Jarosz, Executive Director, Heart of the Lakes• Scott Lampert, Founder-owner, Paxton Resources• Jeff Mason, Executive Director, University Research Corridor• Erin McDonough, President, Michigan Oil and Gas Association (formerly with Michigan United
Conservation Clubs)• William Moritz, Deputy Director, Michigan Department of Natural Resources• Gil Pezza, Senior Project Manager, Michigan Economic Development Corporation• Scott Piggott, Chief Operating Officer, Michigan Farm Bureau• Donna Stine, (formerly) Policy Coordinator, Michigan Department of Natural Resources
Appendix B

40
APPENDIX C: NAICS CODES INCLUDED IN
ECONOMIC ANALYSIS
Category NAICS Description
Aesthetic 3366 Ship and Boat Building
4855 Charter Bus Industry
4871 Scenic and Sightseeing Transportation, Land
4872 Scenic and Sightseeing Transportation, Water
4879 Scenic and Sightseeing Transportation, Other
5615 Travel Arrangement and Reservation Services
7121 Museums, Historical Sites, and Similar Institutions
7139 Other Amusement and Recreation Industries
7211 Traveler Accommodation
7212 RV (Recreational Vehicle) Parks and Recreational Camps
451110 Sporting Goods Stores
532292 Recreational Goods Rental
Production 1110 Crop Production
1120 Animal Production
1131 Timber Tract Operations
1132 Forest Nurseries and Gathering of Forest Products
1133 Logging
1141 Fishing
1142 Hunting and Trapping
1151 Support Activities for Crop Production
1152 Support Activities for Animal Production
1153 Support Activities for Forestry
3111 Animal Food Manufacturing
3112 Grain and Oilseed Milling
3113 Sugar and Confectionery Product Manufacturing
3114 Fruit and Vegetable Preserving and Specialty Food Manufacturing
3115 Dairy Product Manufacturing
3116 Animal Slaughtering and Processing
3117 Seafood Product Preparation and Packaging
3118 Bakeries and Tortilla Manufacturing
3119 Other Food Manufacturing
3121 Beverage Manufacturing
3211 Sawmills and Wood Preservation
3212 Veneer, Plywood, and Engineered Wood Product Manufacturing
3219 Other Wood Product Manufacturing
3221 Pulp, Paper, and Paperboard Mills
Appendix C

41
Category NAICS Description
Production 3222 Converted Paper Product Manufacturing
3253 Pesticide, Fertilizer, and Other Agricultural Chemical Manufacturing
3254 Pharmaceutical and Medicine Manufacturing
3331 Agriculture, Construction, and Mining Machinery Manufacturing
3371 Household and Institutional Furniture and Kitchen Cabinet Manufacturing
3372 Office Furniture (including Fixtures) Manufacturing
4245 Farm Product Raw Material Merchant Wholesalers
221111 Hydroelectric Power Generation
221119 Other Electric Power Generation
Extraction 2111 Oil and Gas Extraction
2121 Coal Mining
2122 Metal Ore Mining
2123 Nonmetallic Mineral Mining and Quarrying
2131 Support Activities for Mining
3241 Petroleum and Coal Products Manufacturing
3271 Clay Product and Refractory Manufacturing
3272 Glass and Glass Product Manufacturing
3273 Cement and Concrete Product Manufacturing
3274 Lime and Gypsum Product Manufacturing
3279 Other Nonmetallic Mineral Product Manufacturing
3311 Iron and Steel Mills and Ferroalloy Manufacturing
3312 Steel Product Manufacturing from Purchased Steel
3313 Alumina and Aluminum Production and Processing
3314 Nonferrous Metal (except Aluminum) Production and Processing
3315 Foundries
3321 Forging and Stamping
4235 Metal and Mineral (except Petroleum) Merchant Wholesalers
4861 Pipeline Transportation of Crude Oil
4862 Pipeline Transportation of Natural Gas
4869 Other Pipeline Transportation
Cross-sector Support Industries
2213 Water, Sewage and Other Systems
2371 Utility System Construction
4831 Deep Sea, Coastal, and Great Lakes Water Transportation
4832 Inland Water Transportation
4883 Support Activities for Water Transportation
5417 Scientific Research and Development Services
Appendix C

42APPENDIX D:
REGIONAL CEDS PRIORITIES
TrailsWaterways
WetlandsState Parks
HuntingFishing
EcotourismDunes
Great LakesBeaches
Golf CoursesEnergy Capacity
WaterNonrenewabl E energy
MiningMinerals
Urban AgricultureFarming
Cash CropsForestry
WindSolar
Biofuels
SOURCE: Developed by PSC, using current regional CEDS plans.
SEMCOG = Southeast Michigan Council of Governments;
R2PC = Region 2 Planning Commission;
SCMPC = Southcentral Michigan Planning Council;
SWMPC = Southwest Michigan Planning Commission;
GLSPDC = Genesee-Lapeer-Shiawassee Region V Planning and Development Commission;
WMRPC = West Michigan Regional Planning Commission;
EMCOG = East Michigan Council of Governments; TCRPC = Tri-County
Regional Planning Commission;
WMSRDC = West Michigan Shoreline Regional Development Commission;
NEMCOG = Northeast Michigan Council of Governments;
NWMCOG = Northwest Michigan Council of Governments;
EUPRDC = Eastern Upper Peninsula Regional Planning & Development Commission;
CUPPAD = Central Upper Peninsula Regional Planning & Development Commission;
WUPPDR = Western Upper Peninsula Planning & Development Region
LP = Lower Peninsula
No
CED
S do
cum
ent c
ompl
ete
SWM
PC
R2P
C
No
CED
S do
cum
ent c
ompl
ete
TC
RPC
EMC
OG
NEM
CO
G
EUPR
PDC
WU
PPD
R
SOUTHEAST LP SOUTHWEST LPNORTH
CENTRAL LP UPPER PENINSULANORTHEAST AND NORTHWEST LPSOUTH CENTRAL LP
Ap
pe
nd
ix D

43
APPENDIX E:REGIONAL SALES AND
EXPORTS, 2012
Region BLM Category Regional Sales Exports Percent of Total Exports
Upper Peninsula Prosperity Region 1
Aesthetic 374,630,177 254,226,384 1.7%
Production 2,498,526,676 2,340,782,724 15.8
Extraction 1,754,469,428 1,689,371,905 11.4
Cross-sector Support 194,979,348 162,044,204 1.1
Rest of Economy 16,827,163,357 10,407,368,592 70.1
Total 21,649,768,986 14,853,793,809
Northwest Prosperity Region 2
Aesthetic 783,868,214 598,178,967 5.0%
Production 2,105,893,092 1,888,212,437 15.7
Extraction 1,188,471,039 1,021,827,861 8.5
Cross-sector Support 58,794,175 32,183,743 0.3
Rest of Economy 15,592,537,505 8,462,810,380 70.5
Total 19,729,564,026 12,003,213,388
Northeast Prosperity Region 3
Aesthetic 157,525,722 98,096,409 1.6%
Production 822,192,936 757,718,356 12.5
Extraction 788,717,278 723,437,213 11.9
Cross-sector Support 118,807,065 102,769,568 1.7
Rest of Economy 7,284,734,560 4,386,628,814 72.3
Total 9,171,977,561 6,068,650,359
West Michigan Prosperity Region 4
Aesthetic 992,909,881 365,225,745 0.5%
Production 16,824,342,338 14,331,347,620 19.9
Extraction 6,081,591,928 5,030,566,289 7.0
Cross-sector Support 729,374,332 483,579,808 0.7
Rest of Economy 94,091,433,780 51,869,448,228 72.0
Total 118,719,652,259 72,080,167,689
East Central Michigan Prosperity Region 5
Aesthetic 512,584,079 279,905,077 1.0%
Production 1,985,557,449 1,775,389,377 6.3
Extraction 2,139,969,720 1,847,188,841 6.5
Cross-sector Support 122,633,968 62,618,106 0.2
Rest of Economy 37,804,365,599 24,432,365,950 86.0
Total 42,565,110,815 28,397,467,350
Appendix E
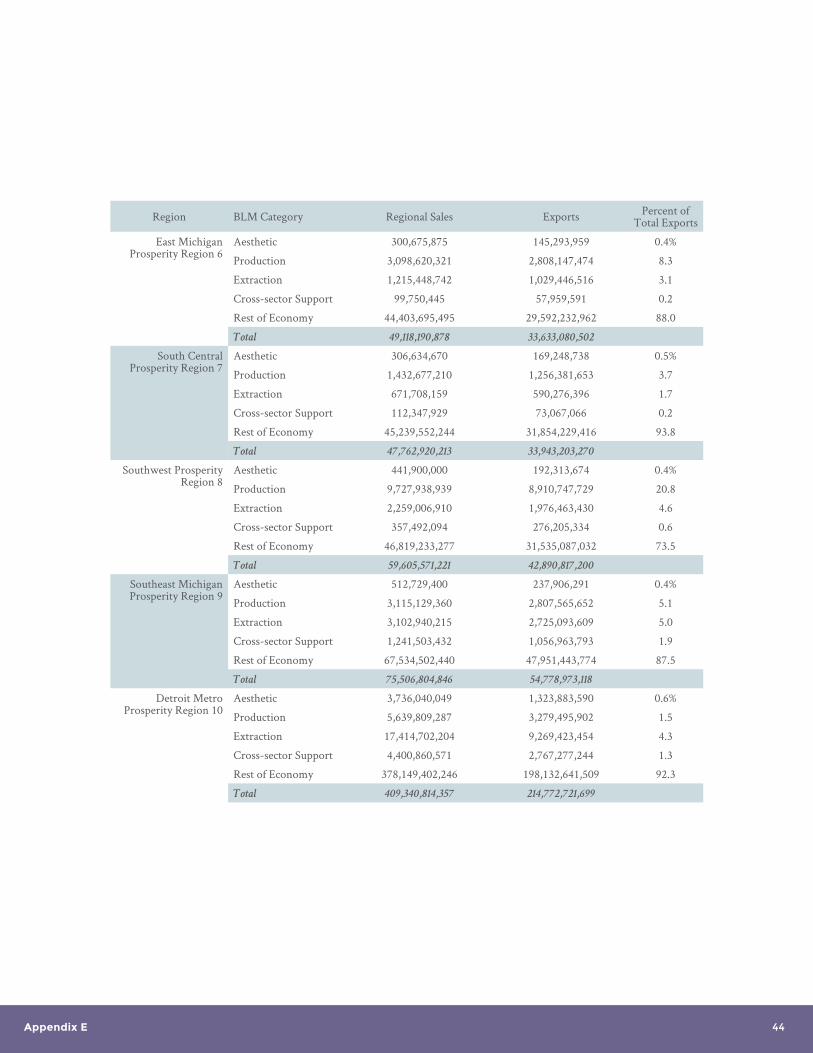
44
Region BLM Category Regional Sales Exports Percent of Total Exports
East Michigan Prosperity Region 6
Aesthetic 300,675,875 145,293,959 0.4%
Production 3,098,620,321 2,808,147,474 8.3
Extraction 1,215,448,742 1,029,446,516 3.1
Cross-sector Support 99,750,445 57,959,591 0.2
Rest of Economy 44,403,695,495 29,592,232,962 88.0
Total 49,118,190,878 33,633,080,502
South Central Prosperity Region 7
Aesthetic 306,634,670 169,248,738 0.5%
Production 1,432,677,210 1,256,381,653 3.7
Extraction 671,708,159 590,276,396 1.7
Cross-sector Support 112,347,929 73,067,066 0.2
Rest of Economy 45,239,552,244 31,854,229,416 93.8
Total 47,762,920,213 33,943,203,270
Southwest Prosperity Region 8
Aesthetic 441,900,000 192,313,674 0.4%
Production 9,727,938,939 8,910,747,729 20.8
Extraction 2,259,006,910 1,976,463,430 4.6
Cross-sector Support 357,492,094 276,205,334 0.6
Rest of Economy 46,819,233,277 31,535,087,032 73.5
Total 59,605,571,221 42,890,817,200
Southeast Michigan Prosperity Region 9
Aesthetic 512,729,400 237,906,291 0.4%
Production 3,115,129,360 2,807,565,652 5.1
Extraction 3,102,940,215 2,725,093,609 5.0
Cross-sector Support 1,241,503,432 1,056,963,793 1.9
Rest of Economy 67,534,502,440 47,951,443,774 87.5
Total 75,506,804,846 54,778,973,118
Detroit Metro Prosperity Region 10
Aesthetic 3,736,040,049 1,323,883,590 0.6%
Production 5,639,809,287 3,279,495,902 1.5
Extraction 17,414,702,204 9,269,423,454 4.3
Cross-sector Support 4,400,860,571 2,767,277,244 1.3
Rest of Economy 378,149,402,246 198,132,641,509 92.3
Total 409,340,814,357 214,772,721,699
Appendix E

45
APPENDIX F:COMPARISON OF STATES BY
NATURAL RESOURCE CATEGORIES
NAICS Description StateNumber of
Jobs, 2014
Percent
Change in
Number of
Jobs,
2014-2024
Competitive
Effect,
2014-2024
Location
Quotient,
2014
Percent
Change in
Location
Quotient,
2014-2024
Aesthetic
7139 Other Amusement
and Recreation
Industries
Michigan 33,449 7% -2,595 0.91 -2%
Illinois 50,831 11 -1,868 0.99 0
Indiana 18,346 14 -39 0.70 0
Minnesota 27,875 12 -795 1.11 -2
Ohio 38,072 6 -3,169 0.82 -5
Pennsylvania 50,096 12 -1,350 0.98 2
Wisconsin 25,960 8 -1,605 1.04 -4
7211 Traveler
Accommodation
Michigan 39,531 8% -543 0.75 4%
Illinois 47,770 9 -367 0.64 3
Indiana 20,559 7 -530 0.54 -3
Minnesota 25,031 6 -820 0.69 -3
Ohio 34,282 6 -1,134 0.51 0
Pennsylvania 53,248 7 -1,222 0.72 2
Wisconsin 29,068 13 896 0.81 4
7212 RV (Recreational
Vehicle) Parks and
Recreational Camps
Michigan 1,892 4% -91 1.15 1%
Illinois 495 -13 -113 0.21 -18
Indiana 993 15 57 0.84 5
Minnesota 1,075 10 11 0.96 1
Ohio 1,473 19 149 0.70 12
Pennsylvania 3,034 5 -124 1.32 0
Wisconsin 2,090 30 441 1.86 21
451110 Sporting Goods
Stores
Michigan 10,807 20% 598 1.23 11%
Illinois 10,315 13 -161 0.84 2
Indiana 5,738 8 -345 0.92 -5
Minnesota 7,260 6 -554 1.21 -7
Ohio 9,652 19 518 0.87 8
Pennsylvania 11,679 3 -1,291 0.95 -6
Wisconsin 6,557 21 479 1.10 8
532292 Recreational Goods
Rental
Michigan 403 59% 118 1.10 29%
Illinois 181 15 -25 0.35 -7
Indiana 108 42 14 0.41 10
Minnesota 270 48 51 1.08 15
Ohio 246 70 99 0.53 35
Pennsylvania 173 -49 -136 0.34 -59
Wisconsin 202 11 -37 0.81 -13
Appendix F

46
NAICS Description StateNumber of
Jobs, 2014
% Change in
Number of
Jobs,
2014-2024
Competitive
Effect,
2014-2024
Location
Quotient,
2014
Percent
Change in
Location
Quotient,
2014-2024
Cross-sector Support and R&D
2371 Utility System
Construction
Michigan 10,381 22% -218 0.73 3%
Illinois 11,612 11 -1,506 0.58 -7
Indiana 8,437 34 806 0.83 7
Minnesota 8,617 31 622 0.89 6
Ohio 15,534 26 244 0.86 4
Pennsylvania 21,183 43 4,023 1.07 20
Wisconsin 9,700 29 476 1.00 5
5417 Scientific Research
and Development
Services
Michigan 23,900 11% -1,204 1.25 1%
Illinois 24,118 0 -4,063 0.90 -12
Indiana 5,075 26 472 0.37 8
Minnesota 8,505 12 -394 0.65 -4
Ohio 17,473 12 -780 0.72 -1
Pennsylvania 29,449 15 -402 1.10 3
5,914 43 1,576 0.45 24
Extraction
3279 Other Nonmetallic
Mineral Product
Manufacturing
Michigan 2,585 28% 573 1.20 27%
Illinois 2,944 -16 -658 0.97 -18
Indiana 3,433 19 445 2.22 12
Minnesota 2,439 1 -130 1.65 -5
Ohio 7,107 3 -214 2.58 0
Pennsylvania 2,489 -5 -275 0.82 -7
Wisconsin 2,305 27 496 1.56 22
3311 Iron and Steel Mills
and Ferroalloy
Manufacturing
Michigan 6,126 0% 56 2.31 6%
Illinois 4,992 -8 -310 1.34 -3
Indiana 19,117 2 614 10.08 3
Minnesota 464 -2 -4 0.26 -1
Ohio 9,269 -27 -2,372 2.75 -24
Pennsylvania 13,275 -12 -1,459 3.58 -8
Wisconsin 310 14 49 0.17 17
3313 Alumina and
Aluminum
Production and
Processing
Michigan 2,424 22% 645 1.43 35%
Illinois 1,132 -50 -509 0.48 -45
Indiana 5,431 -5 -5 4.49 0
Minnesota 635 4 53 0.55 9
Ohio 3,732 -6 -63 1.73 1
Pennsylvania 3,142 -6 -24 1.33 3
813 30 283 0.70 38
Appendix F

47
NAICS Description StateNumber of
Jobs, 2014
% Change in
Number of
Jobs,
2014-2024
Competitive
Effect,
2014-2024
Location
Quotient,
2014
Percent
Change in
Location
Quotient,
2014-2024
Extraction
3315 Foundries Michigan 9,901 -14% -1,697 2.67 -12%
Illinois 5,941 -3 -383 1.14 -3
Indiana 9,281 -20 -2,104 3.50 -22
Minnesota 3,957 14 435 1.56 11
Ohio 12,617 1 -273 2.68 1
Pennsylvania 9,621 11 762 1.85 12
Wisconsin 14,494 7 583 5.74 5
3321 Forging and
Stamping
Michigan 7,893 9% 551 2.69 13%
Illinois 10,458 -10 -1,212 2.54 -8
Indiana 4,013 -10 -454 1.91 -11
Minnesota 4,095 4 84 2.04 2
Ohio 11,165 5 413 2.99 7
Pennsylvania 10,260 6 489 2.50 9
5,721 -1 -170 2.86 -2
Production
1110 Crop Production Michigan 23,156 10% 3,370 0.98 22%
Illinois 26,997 -8 -744 0.82 0
Indiana 15,968 -5 -85 0.95 -1
Minnesota 26,492 2 1,915 1.64 8
Ohio 16,770 -27 -3,741 0.56 -21
Pennsylvania 19,524 -9 -788 0.59 0
Wisconsin 15,987 -9 -747 1.00 -4
1120 Animal Production Michigan 11,274 18% 3,583 0.92 44%
Illinois 7,470 -27 -1,045 0.43 -13
Indiana 9,418 -12 150 1.07 2
Minnesota 20,966 -7 1,220 2.49 7
Ohio 8,878 -27 -1,226 0.57 -14
Pennsylvania 16,310 -7 995 0.95 11
Wisconsin 31,079 1 4,515 3.70 18
3112 Grain and Oilseed
Milling
Michigan 4,248 -2% -101 2.39 3%
Illinois 9,219 -1 -145 3.69 2
Indiana 2,897 -12 -386 2.28 -13
Minnesota 3,301 -6 -219 2.71 -6
Ohio 1,789 -10 -199 0.79 -9
Pennsylvania 1,111 0 -5 0.45 4
Wisconsin 624 2 8 0.52 3
Appendix F

48
NAICS Description StateNumber of
Jobs, 2014
Percent
Change in
Number of
Jobs,
2014-2024
Competitive
Effect,
2014-2024
Location
Quotient,
2014
Percent
Change in
Location
Quotient,
2014-2024
Production
3114 Fruit and Vegetable
Preserving and
Specialty Food
Manufacturing
Michigan 6,894 4% 466 1.37 13%
Illinois 6,644 -1 66 0.94 5
Indiana 3,539 3 188 0.98 5
Minnesota 5,362 -5 -158 1.56 -3
Ohio 12,546 2 544 1.96 7
Pennsylvania 7,429 -3 -25 1.05 4
Wisconsin 11,065 -4 -124 3.22 0
3116 Animal Slaughtering
and Processing
Michigan 5,963 23% 909 0.43 20%
Illinois 17,413 8 125 0.88 4
Indiana 9,574 17 908 0.95 9
Minnesota 16,055 7 -106 1.67 0
Ohio 10,747 15 750 0.60 9
Pennsylvania 14,295 5 -459 0.73 1
Wisconsin 16,747 4 -590 1.75 -2
3372 Office Furniture
(including fixtures)
Manufacturing
Michigan 15,180 -2% -601 4.96 1%
Illinois 4,770 -25 -1,294 1.11 -24
Indiana 6,503 -18 -1,293 2.97 -20
Minnesota 2,509 15 315 1.20 12
Ohio 3,598 17 525 0.92 17
Pennsylvania 5,001 8 307 1.17 10
Wisconsin 3,363 5 96 1.61 4
Appendix F

49
APPENDIX G:SHIFT SHARE AND LOCATION
QUOTIENT ANALYSIS
In order to identify specific industries that have growth potential and could play a key role in Michigan’s natural resource economy, economic indicators must be investigated holistically. In addition to the total number of jobs, an industry’s location quotient (LQ) and a shift-share analysis are important indicators, and must be considered in the analysis of market potential and competitiveness. The following analysis of growth potential looks at the number of jobs, projected job growth, LQ (relative share of employment), expected change in LQ, national growth effect, industry growth effect, and competitive effect (termed advantage/disadvantage) from 2014 to 2024 for all identified natural resource industries. Key findings are presented for each natural resource category and comparisons to other states and identification of key regions within Michigan are identified where appropriate. Appendices F and G provide further details on state and regional comparisons of LQ.
AESTHETIC INDUSTRIES
Twelve industries were included in the natural resource aesthetic industries economic analysis. The five with the greatest potential impact on Michigan’s economy are detailed below. Of these, four show potential for employment growth and a greater share of total employment than the national average, while one industry is expected to increase employment, but decline in importance on a national scale.
AESTHETIC INDUSTRIES
Sporting goods stores (451110) in Michigan have the potential to be a strong export industry. Michigan has a competitive advantage and predicted increasing national LQ (relative share of employment). The state’s industry profile is stronger than our comparison states and is expected to improve over the next ten years, with Ohio close behind. Most employment is centered in Region 10 (Detroit Metro), followed by Regions 9 and 4 (Southeast and West Michigan).
The traveler accommodations industry (7211) is considered preemergent, as it has a large employment base and increasing LQ (relative share of employment compared to the rest of the nation). This sector has the potential to contribute more to Michigan’s economy; however, Michigan is currently expected to grow at a slower rate than the national average in this industry, as are the comparison states of Illinois, Indiana, Minnesota, Ohio, and Pennsylvania. Not surprisingly, Region 10 (Detroit Metro) has the greatest number employed, by far, at 16,321. Region 2 (Northwest) has the strongest LQ at 3.16 (with 4,861 jobs).
The second largest industry in the aesthetic category is “other amusement and recreation industries” (7139). This industry employed 33,449 in 2014, and is predicted to increase in total employment by 7 (7139). This industry employed 33,449 in 2014, and is predicted to increase in total employment by 7percent over the next ten years. All increases in jobs, however, are attributed to national and industry growth, versus a unique local or regional competitive advantage. Michigan also has a low LQ (relative share of employment), which is expected to decline in the near future, meaning Michigan’s share of employment is below national average, and is expected to decline, relative to the nation, even further. Nearly all the identified comparison states are in a similar situation, which could indicate that the region is not as competitive as other parts of the country for this industry.
Appendix G

50
Michigan has a larger share of employment in the recreational goods rental (532292) and recreational vehicle parks and campgrounds (7212) industries than the national average. These industries are expected to continue to grow relative to the nation. In Michigan, Regions 1, 2, and 3 (Upper Peninsula, Northwest, and Northeast, respectively) have the strongest LQs for recreational goods rental. Exhibit 2-A shows the current LQ for each of the aesthetic-based industries against the expected change in LQ from 2014 to 2024. A LQ of 1 indicates that the share of employment in the given industry matches the nationwide share of employment in the industry. A LQ above 1 means that employment in the industry is more concentrated than the national average and a LQ of 1.25 or greater is an indication of an exporting industry (see Appendix A for further details on the methodology). Each circle represents the relative size of the industry in terms of total jobs, to allow for a view of the relative importance of a particular industry.
SOURCE: Economic Modeling Specialists Intl.; Economy\Industries\4 and 6 Digit. Data for 2004:2014, and 2014:2024.QCEW Employees, Non-QCEW Employees &
Self-Employed—EMSI 2014.3 Class of Worker. Downloaded from www.economicmodeling.com as a product of contractual services between EMSI and PSC. Collected
July 2014. Graphic prepared by PSC.
EXHIBIT 2-A. Aesthetic-based Industries: Location Quotient for Michigan, 2014–2024
Traveler accommodation
Other amusement and recreation industries
Sporting goods stores
Travel arrangement and reservation service
Museums, historical sites,
and similar institutions
Recreational Vehicle (RV) parks
and recreational camps
Ship and boating building
Recreational Goods rental
Charter bus industry
Scenic and sightseeing transportation (land)
Scenic and sightseeing transportation (water)
Scenic and sightseeing transportation (other)
1.6
1.4
1.2
1.0
0.8
0.6
0.4
0.2
-100% -80% -60% -40% -20% 20% 40% 60%0%
Appendix G

51
PRODUCTION-BASED INDUSTRIES
The largest category of a natural resource–based economy, both in terms of total jobs and number of establishments, is the production category. Six of the largest subindustries are described in detail below. Four of the six industries are expected to continue experiencing employment growth as well as improve Michigan’s relative share of employment in these industries for the next ten years. Crop production in particular has a strong potential for expansion and a larger national presence.
The natural resource production industry with the greatest number of jobs is crop production (1110), which employed just over 23,000 in 2014. While Michigan’s crop production LQ (relative share of employment) is slightly below the national average, Michigan is expected to grow at a rate far outpacing the industries expecting decline at the national level. As a result, Michigan is expected to have a growing presence in the industry on a national level. Regions 4 and 8 (West and Southwest) combined have two-thirds of the state’s employment for crop production and a strong LQ, indicating exporters. Both regions are expected to continue to play a strong role in Michigan’s crop production economy.
With only 11,274 jobs in 2014, animal production (1120) is expected to have the greatest growth in relative share of employment (LQ) between now and 2024, with an expected increase of 44 percent. Michigan is expected to see an 18 percent increase in employment, while the industry at the national level will experience a significant decline in the number of jobs. As such, Michigan is expected to have a growing presence at the national level. As with crop production, there is an opportunity for this sector to contribute more to Michigan’s overall economy. Regions 4 and 6 (West and East Michigan) have a strong presence, followed by Regions 2 and 5 (Northwest and East Central), where there is predicted to be significant growth in the next ten years.
Michigan has a strong and growing relative share of employment (LQ) in grain and oilseed milling (3112), indicating it is an exporting industry. However, this industry is not a significant source of total employment and is expected to decline slightly over the next ten years. Along with the comparison states, Michigan is expected to lose jobs at a greater rate than the industry overall, which may begin to erode our relative employment strength.
Fruit and vegetable preserving and specialty food manufacturing (3114) is an export industry with a good competitive advantage. With 6,894 jobs, this industry has good potential for growth and an increased national presence. Ohio and Wisconsin are Michigan’s largest regional competitors, with nearly twice the total employment and stronger LQs. Nearly half of Michigan’s jobs in this industry are in Region 4 (West Michigan). The region is predicted to lose 4 percent of employment over the next ten years, but maintain an export base. Region 2 (Northwest) is also expected to decline in employment, but increase its already significant LQ of 7.04.
Appendix G

52
Compared to other Great Lakes states, Michigan’s animal slaughtering and processing sector (3116) has the highest expected percentage job growth. In this industry, Michigan is expected to far exceed the predicted national level and industry level, which is declining. Additionally, over the next ten years, the state is predicted to increase of its relative share of employment (LQ) in this industry by 20 percent. Minnesota and Wisconsin have the highest employment in animal slaughtering and processing, but they are expected to increase employment below the national and industry averages. Similar to Michigan, Indiana and Ohio are expected to increase employment at a greater rate than national and industry averages over the next ten years. Region 9 (Southeast) currently plays a key role in the state in the animal slaughtering and processing sector and is expected to continue to do so.
Office furniture manufacturing (3372), which is included in the natural resource production category, is a strong export industry in Michigan with a high relative share of employment (LQ). At the national level, the office furniture manufacturing industry is expected to experience flat employment growth from 2014 to 2024; industry level employment declines will be made up for through overall economy growth. Industry experts indicate that they expect office furniture and manufacturing to continue to be a stable employment base in the U.S. However, Michigan is expected to experience a slight decline in total jobs, due to the combination of both national and state industry-level declines that will exceed the increase in jobs from economy-wide national growth. While having much smaller shares of the market, Minnesota, Ohio, and Pennsylvania are expected to increase total employment due to national and state effects being greater than industry level declines and may begin to erode Michigan’s position. In Michigan, the vast majority of jobs in this industry (almost 90 percent) are located in Region 4 (West Michigan), although employment growth is expected to occur primarily in other regions of the state.
Exhibit 3-A shows the current LQ for each of the production industries against the expected change in LQ from 2014 to 2024.
Appendix G

53
1.0
2.0
3.0
4.0
5.0
6.0
-100% -80% -60% -40% -20% 20% 40% 60% 80% 100%0
Crop Production
Office Furniture (including Fixtures)
Manufacturing
Animal Production
Pharmaceutical and Medicine Manufacturing
Converted paper Product Manufacturing
Bakeries and Tortilla manufacturing
Fruit and Vegetable Preserving and Specialty
Food manufacturing
Animal Slaughtering and Processing
Beverage manufacturing
Other Wood Product Manufacturing
Houshold and Insitutional Furniture and
Kitchen Cabinet Manufacturing
Support Activities for Crop Production
Grain and Oilseed Milling
Dairy Product Manufacturing
Other Food Manufacturing
Pulp, Paper, and Paperboard Mills
Agriculture, Construction, and Mining
Machinery Manufacturing
Vaneer, Plywood, and Engineered Wood
Product Manufacturing
Logging
Sugar and Confectionery
Product Manufacturing
Sawmills and Wood Preservation
Farm Product Raw
Material Merchant Wholesale
Support Activities for Animal Production
Pesticide, Fertilizer, and OtherAgricultural
Chemical Manufacturing
Animal Food Manufacturing
Hydroelectric Power Generation
Support Activities for Forestry
Fishing
Hunting and Trapping
Seafood Product Preparation and Packaging
Other Electric Power Generation
Timber Tract Operations
Forest Nurseries and
Gathering of Forest Products
SOURCE: Prepared by PSC based on Economic Modeling Specialists Intl.; Economy\Industries\4 and 6 Digit. Data for 2004:2014, and 2014:2024.QCEW
Employees, Non-QCEW Employees & Self-Employed—EMSI 2014.3 Class of Worker. Downloaded from www.economicmodeling.com as a product of
contractual services between EMSI and PSC. Collected July 2014.
EXHIBIT 3-A. Production-based Industries: Location Quotient for Michigan, 2014–2024
Appendix G

54
EXTRACTION INDUSTRIES
There are 21 industries classified as natural resource extraction. The five with the greatest potential impact on Michigan’s employment base are described below. Four of the five industries presented are expected to increase employment in the next ten years, and three will significantly increase their share of total national employment. Forging and stamping (3321) is a strong export industry for Michigan. We have higher expected growth than Illinois, Ohio, and Pennsylvania, which are currently leaders in terms of total employment. Region 4 (West Michigan) leads the state in employment, has a 6.65 LQ, and is expected to continue to grow.Iron and steel mills and ferroalloy manufacturing (3311) is also a strong export industry for Michigan, but is predicted to have stagnant job growth over the next ten years, due to national industry-level changes. National employment levels in this industry are expected to decline, but Michigan is not expected to lose jobs like the rest of the nation. Among our comparisons states, Indiana is expected to fare best in the downturn, with 2 percent job growth. In Michigan, Regions 9 and 10 (Southeast and Detroit Metro) contain nearly all the employment in this industry. Region 10 is expected to decline, while Region 9 is growing in employment and relative share of employment.The alumina and aluminum product and processing (3313) and other nonmetallic mineral production manufacturing (3279) industries are expected to have strong job growth over the next ten years, outperforming the national average in terms of share of employment. Most of our comparison states are expected to have negative or minimal employment growth, due in part to their below national average expected growth. These industries have good LQs in Michigan that are expected to improve further, and have a potential to grow as a regional export. The development potential of these indus-tries should be investigated further.With one of the highest number of employees in the extraction category—nearly 10,000 jobs—foundries (3315) is a declining industry where Michigan is currently losing employment at a greater rate than the rest of the nation. While the industry is losing jobs at the national level, Michigan is losing jobs as a faster rate. With a declining relative share of national employment (LQ), extraction is a declining export industry for Michigan. Only Regions 6 and 1 (East Michigan and Upper Peninsula) are expected to grow in terms of jobs and improved its relative share of employment over the next ten years.Exhibit 4-A shows the current relative share of national employment (LQ) for each of the extraction industries against the expected change in LQ from 2014 to 2024.
Appendix G

55
SOURCE: Prepared by PSC based on Economic Modeling Specialists Intl.; Economy\Industries\4 and 6 Digit. Data for 2004:2014, and 2014:2024.QCEW
Employees, Non-QCEW Employees & Self-Employed—EMSI 2014.3 Class of Worker. Downloaded from www.economicmodeling.com as a product of
contractual services between EMSI and PSC. Collected July 2014.
3.5
3.0
2.5
2.0
1.5
1.0
0.5
0-120% -100% -80% -60% -40% -20% 20% 40% 60% 80% 100%0
Foundries
Forging and Stamping
Metal and mineral (except petroleum) merchant wholesalers
Iron and steel mills and ferroalloy manufacturing
Cement and concrete product manufacturing
Glass and glass product manufacturing
Other nonmetallic mineral product manufacturing
Alimuna and aluminum production and processing
Support activities for mining
Nonmetallic mineral mining and quarrying
Steel product manufacturing from purchased steel
Nonferrous metal (except aluminum)
production and processing
Metal ore mining
Petroleum and coal products manufacturing
Pipeline transportation of natural gas
Oil and gas extraction
Clay product and refractory manufacturing
Lime and gypsum product manufacturing
Other pipeline transportation
Pipeline transportation of crude oil
Coal mining
EXHIBIT 4-A. Extraction-based Industries: Location Quotient for Michigan, 2014–2024
Appendix G
56
CROSS-SECTOR SUPPORT INDUSTRIES
Six industries are classified as cross-sector support industries and include such sectors as transportation, utility construction to scientific research and development. The two with the greatest potential impact on Michigan’s employment base are reviewed below. Both industries are growing and expected to continue to do so. Michigan is growing at a slower rate in these industries than the national average, but is still managing to maintain a relative share of employment.
In previous BLM reports, scientific research and development services were broken into component industries and only the subsector research and development in the physical, engineering, and life sciences industry (54171) was used for analysis. As this subsector contains 22,632 of the total 23,545 jobs in the overall scientific research and development industry, PSC chose not to break it down further. The expected changes in the scientific research and development services sector are dependent primarily on changes in the physical, engineering and life sciences subsector.
Scientific research and development services (5417) is the only cross-sector support industry to perform better than the national average in terms of share of employment, and it is the largest of the cross-sector support industries. The industry is predicted to grow nationally, but Michigan is expected to increase the number employed at a lower rate than the national average, due to a competitive disadvantage. Many of our comparison states are also expected to grow below the national industry average. As it is an industry with a large employment base and good LQ (relative share of employment), we should investigate the reason for the competitive disadvantage or risk a greater decline. Indiana and Wisconsin have a competitive advantage (they are expected to grow at a greater rate than the national and industry averages), although much lower employment bases, and are expected to improve over the next ten years. Regions 9 and 10 (Southeast and Detroit Metro) have the largest number employed in this industry and that is expected to increase.
One industry that may have the potential to be a more important part of Michigan’s cross-sector support industries and the natural resource economy is utility system construction (2371). While only marginally, Michigan’s relative share of employment (LQ) in this industry is expected to improve, as well as the number of jobs. However, all of the predicted job growth in this industry is attributed to national and industry growth effects, as Michigan has a competitive disadvantage and is expected to increase jobs at a lower rate than the national and industry averages. Michigan’s comparison states, particularly Pennsylvania, have a strong advantage in this sector, as they are expected to grow above the national and industry average.
Exhibit 5-A shows the current LQ for each of the cross-sector support industries against the expected change in LQ from 2014 to 2024.
Appendix G

57
Scientific research and development services
Utility system construction
Deep sea, coastal, and great lakes water transportation
Water, sewage, and other systems
Support activities for water transportation
Inland water transportation
-30%
0.2
0.4
0.6
0.8
1
1.2
1.4
1.6
-20% -10% 10% 20% 30% 40%0
SOURCE: Prepared by PSC based on Economic Modeling Specialists Intl.; Economy\Industries\4 and 6 Digit. Data for 2004:2014, and 2014:2024.QCEW
Employees, Non-QCEW Employees & Self-Employed—EMSI 2014.3 Class of Worker. Downloaded from www.economicmodeling.com as a product of
contractual services between EMSI and PSC. Collected July 2014.
EXHIBIT 5-A. Cross-sector Support Industries: Location Quotient for Michigan, 2014–2024
Appendix G

Executive Summary