the melting arctic: business opportunities in arctic development
DESCRIPTION
Lorem ipsum dolor sit amet, consectetur adipisicing elit, sed do eiusmod tempor incididunt ut labore et dolore magna aliqua.TRANSCRIPT
People. Ideas. Success.
Guggenheim Partners
The Melting Arctic: Business Opportunities in Arctic Development
Scott Minerd
Global Chief Investment Officer
January 2014
Guggenheim Investments (“Guggenheim”) represents the following affiliated investment management businesses of Guggenheim Partners, LLC: GS GAMMA Advisors, LLC, Guggenheim Aviation, Guggenheim Funds Distributors, LLC, Guggenheim Funds Investment Advisors, LLC, Guggenheim Partners Investment Management, LLC, Guggenheim Partners Europe Limited, Guggenheim Partners India Management, Guggenheim Real Estate, LLC, Security Investors, LLC and Transparent Value Advisors, LLC. This material is intended to inform you of services available through Guggenheim Investments’ affiliate businesses.
The Arctic Shipping Opportunity
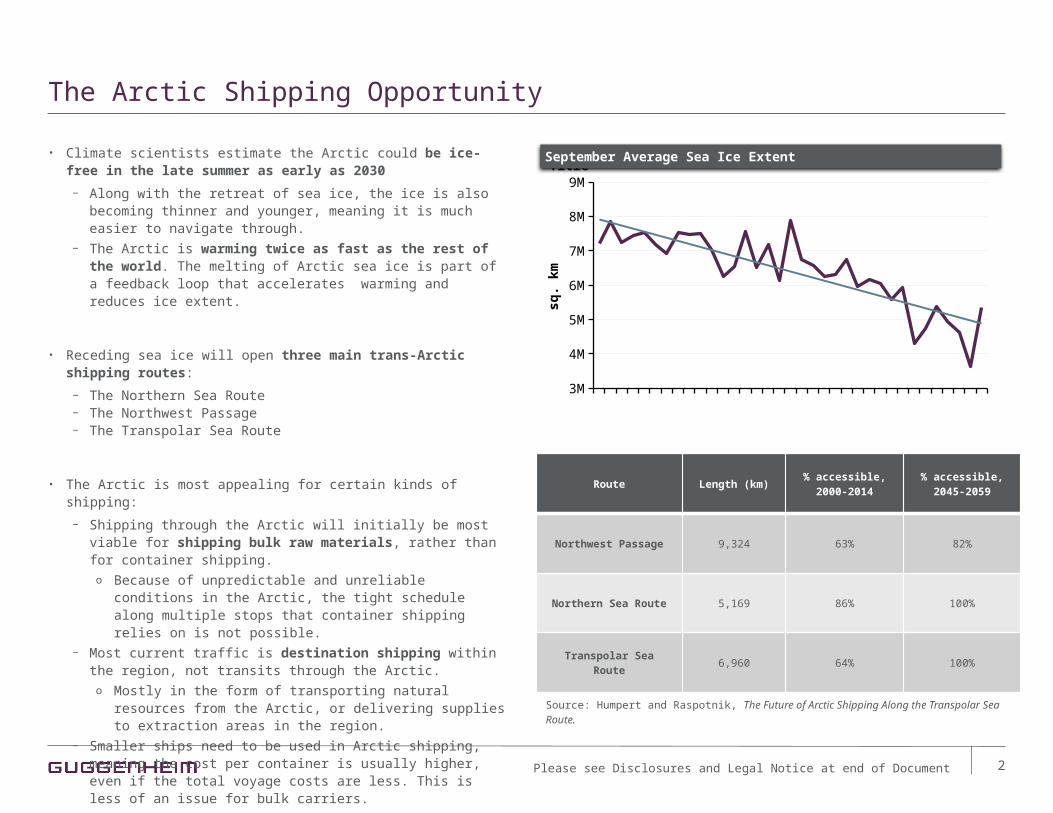
• Climate scientists estimate the Arctic could be ice-free in the late summer as early as 2030
− Along with the retreat of sea ice, the ice is also becoming thinner and younger, meaning it is much easier to navigate through.
− The Arctic is warming twice as fast as the rest of the world. The melting of Arctic sea ice is part of a feedback loop that accelerates warming and reduces ice extent.
• Receding sea ice will open three main trans-Arctic shipping routes:
− The Northern Sea Route − The Northwest Passage− The Transpolar Sea Route
• The Arctic is most appealing for certain kinds of shipping:
− Shipping through the Arctic will initially be most viable for shipping bulk raw materials, rather than for container shipping.o Because of unpredictable and unreliable conditions in the Arctic,
the tight schedule along multiple stops that container shipping relies on is not possible.
− Most current traffic is destination shipping within the region, not transits through the Arctic.o Mostly in the form of transporting natural resources from the Arctic,
or delivering supplies to extraction areas in the region.− Smaller ships need to be used in Arctic shipping, meaning the cost per
container is usually higher, even if the total voyage costs are less. This is less of an issue for bulk carriers.
− Ships transiting the Arctic can reduce speed and thus fuel costs instead of saving time, which may be more attractive for bulk carriers.
2
Route Length (km)% accessible,
2000-2014% accessible,
2045-2059
Northwest Passage 9,324 63% 82%
Northern Sea Route 5,169 86% 100%
Transpolar Sea Route 6,960 64% 100%
Source: Humpert and Raspotnik, The Future of Arctic Shipping Along the Transpolar Sea Route.
3M
4M
5M
6M
7M
8M
9MTitle
sq.
km
September Average Sea Ice Extent
Please see Disclosures and Legal Notice at end of Document
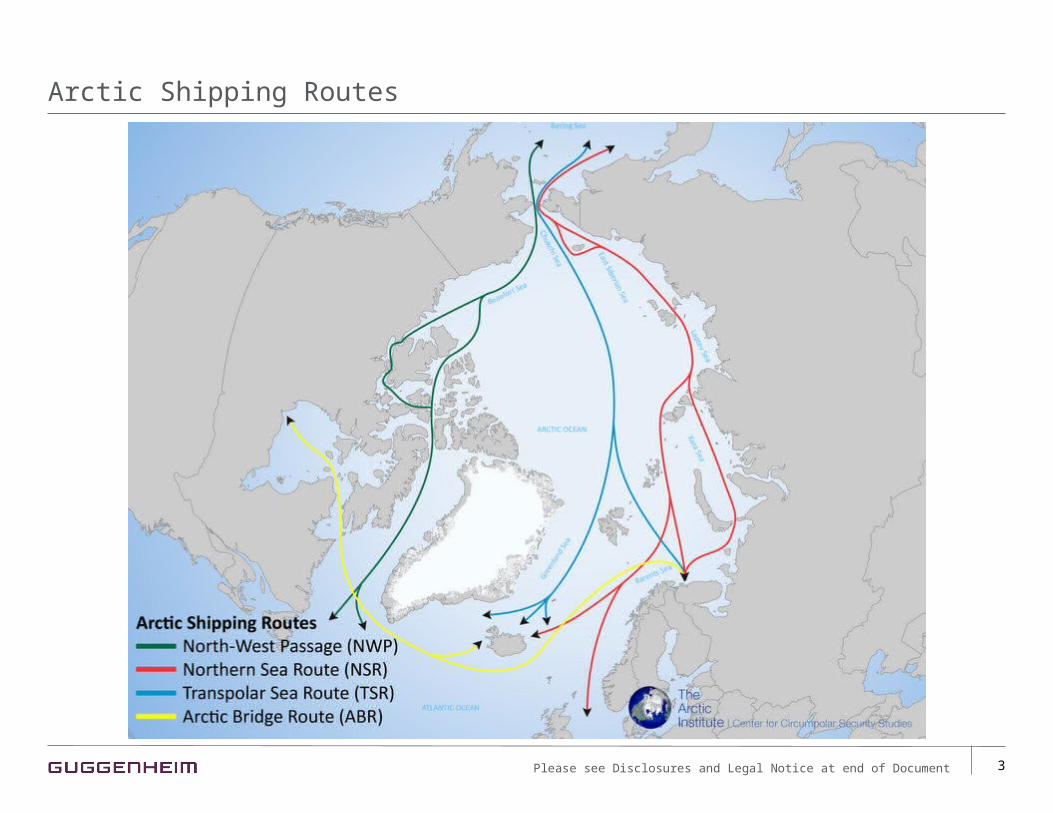
Arctic Shipping Routes
3Please see Disclosures and Legal Notice at end of Document
Ice Conditions Could Allow Large Increase In Arctic Shipping Traffic
4
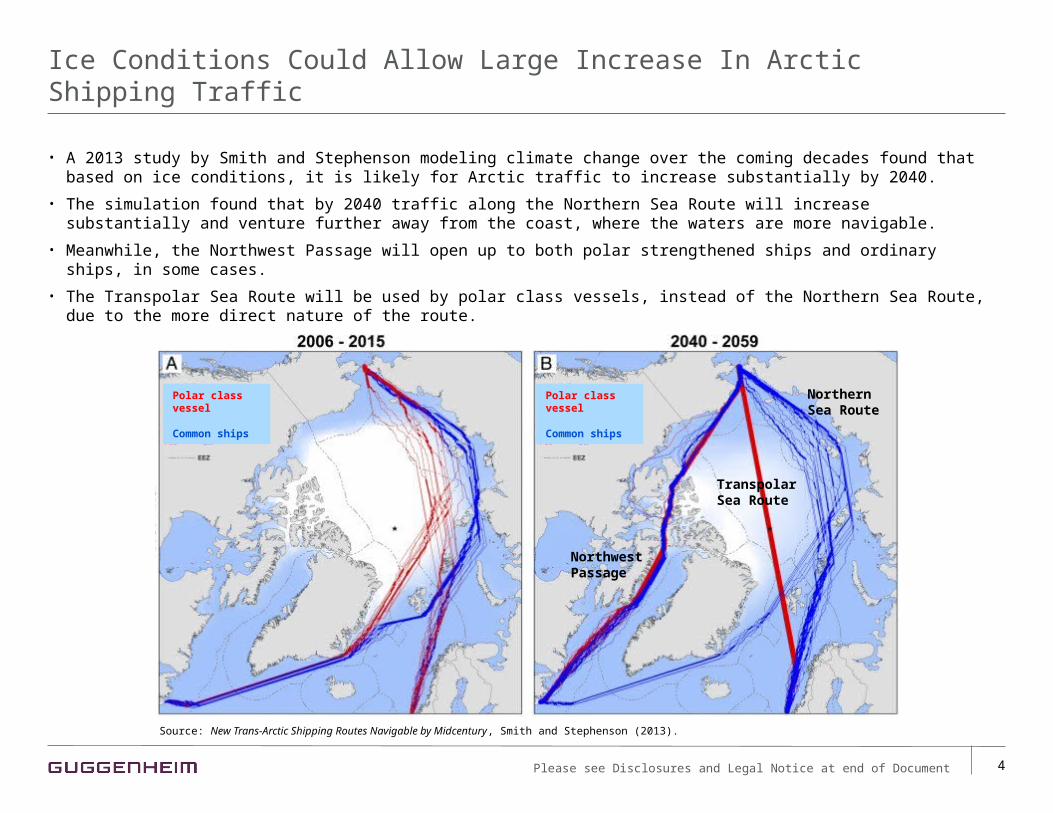
• A 2013 study by Smith and Stephenson modeling climate change over the coming decades found that based on ice conditions, it is likely for Arctic traffic to increase substantially by 2040.
• The simulation found that by 2040 traffic along the Northern Sea Route will increase substantially and venture further away from the coast, where the waters are more navigable.
• Meanwhile, the Northwest Passage will open up to both polar strengthened ships and ordinary ships, in some cases.
• The Transpolar Sea Route will be used by polar class vessels, instead of the Northern Sea Route, due to the more direct nature of the route.
Polar class vessel
Common ships
TranspolarSea Route
Northwest Passage
NorthernSea Route
Source: New Trans-Arctic Shipping Routes Navigable by Midcentury, Smith and Stephenson (2013).
Polar class vessel
Common ships
Please see Disclosures and Legal Notice at end of Document
The Northern Sea Route
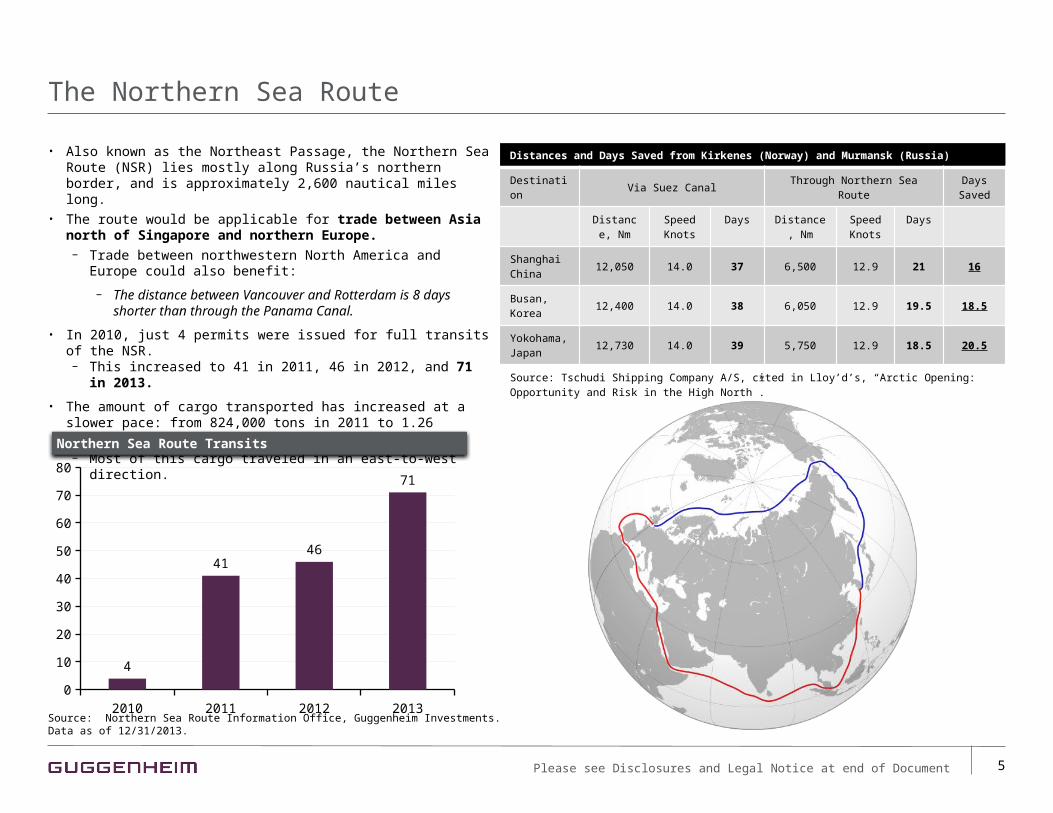
• Also known as the Northeast Passage, the Northern Sea Route (NSR) lies mostly along Russia’s northern border, and is approximately 2,600 nautical miles long.
• The route would be applicable for trade between Asia north of Singapore and northern Europe.− Trade between northwestern North America and Europe could also
benefit:
− The distance between Vancouver and Rotterdam is 8 days shorter than through the Panama Canal.
• In 2010, just 4 permits were issued for full transits of the NSR. − This increased to 41 in 2011, 46 in 2012, and 71 in 2013.
• The amount of cargo transported has increased at a slower pace: from 824,000 tons in 2011 to 1.26 million in 2012, and 1.36 million in 2013.− Most of this cargo traveled in an east-to-west direction.
5
Distances and Days Saved from Kirkenes (Norway) and Murmansk (Russia)
Destination Via Suez Canal Through Northern Sea RouteDays Saved
Distance, Nm
Speed Knots
Days Distance, Nm
Speed Knots
Days
Shanghai China 12,050 14.0 37 6,500 12.9 21 16
Busan, Korea 12,400 14.0 38 6,050 12.9 19.5 18.5
Yokohama, Japan 12,730 14.0 39 5,750 12.9 18.5 20.5
Source: Tschudi Shipping Company A/S, cited in Lloy’d’s, “Arctic Opening: Opportunity and Risk in the High North”.
Source: Northern Sea Route Information Office, Guggenheim Investments. Data as of 12/31/2013.
2010 2011 2012 20130
10
20
30
40
50
60
70
80
4
4146
71
Northern Sea Route Transits
Please see Disclosures and Legal Notice at end of Document
The Northern Sea Route: Studies and Projections
• A study by DNV calculated the cost of an NSR transit vs. a Suez Canal route. Costs factored in ice projections, speed, fuel consumption, and additional costs from building and operating ships suitable for the Arctic.
− The study found that Arctic transit from Tokyo would be economically attractive for part of the year in 2030. − They project 1.4 million TEU of 3.9 million TEU from Tokyo will be transported across the Arctic, which translates to about 480 transit voyages. − By 2050, these numbers rise to 2.5 out of 5.6 million TEU for 850 voyages. The predicted amount of containers that will be transported through the Arctic
corresponds to about 8% of the total container trade between Asia and Europe in 2030, and about 10% in 2050.− The study also found shipping from central ports in Asia (Hong Kong) is likely to become marginally profitable only with high bunker prices and a long
summer sailing season in 2050. Traffic across the Arctic from the southern ports in Asia (Singapore) will not be profitable due to a longer sailing route than via Suez.
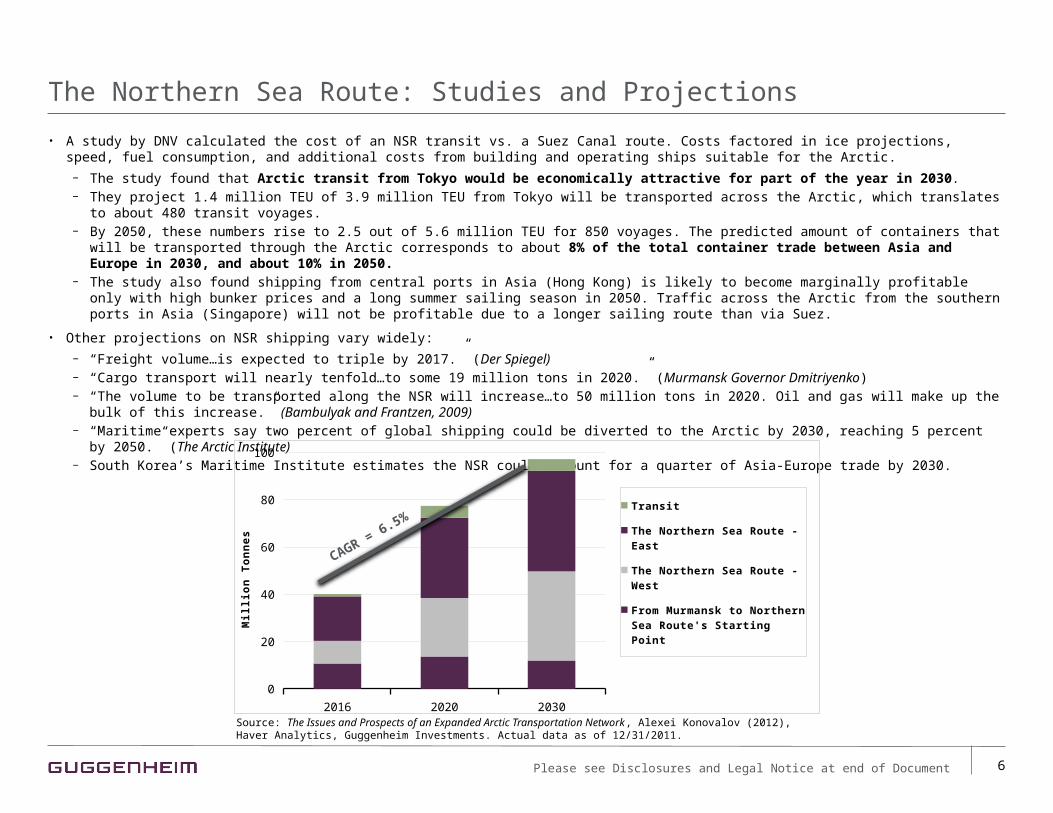
• Other projections on NSR shipping vary widely:
− “Freight volume…is expected to triple by 2017.” (Der Spiegel)− “Cargo transport will nearly tenfold…to some 19 million tons in 2020.” (Murmansk Governor Dmitriyenko)− “The volume to be transported along the NSR will increase…to 50 million tons in 2020. Oil and gas will make up the bulk of this increase.” (Bambulyak and
Frantzen, 2009)− “Maritime experts say two percent of global shipping could be diverted to the Arctic by 2030, reaching 5 percent by 2050.” (The Arctic Institute)− South Korea’s Maritime Institute estimates the NSR could account for a quarter of Asia-Europe trade by 2030.
6
2016 2020 20300
20
40
60
80
100
Transit
The Northern Sea Route - East
The Northern Sea Route - West
From Murmansk to Northern Sea Route's Starting Point
Mil
lio
n T
on
ne
s
CAGR = 6.5%
Source: The Issues and Prospects of an Expanded Arctic Transportation Network, Alexei Konovalov (2012), Haver Analytics, Guggenheim Investments. Actual data as of 12/31/2011.
Please see Disclosures and Legal Notice at end of Document
The Northern Sea Route: Time and Cost Savings
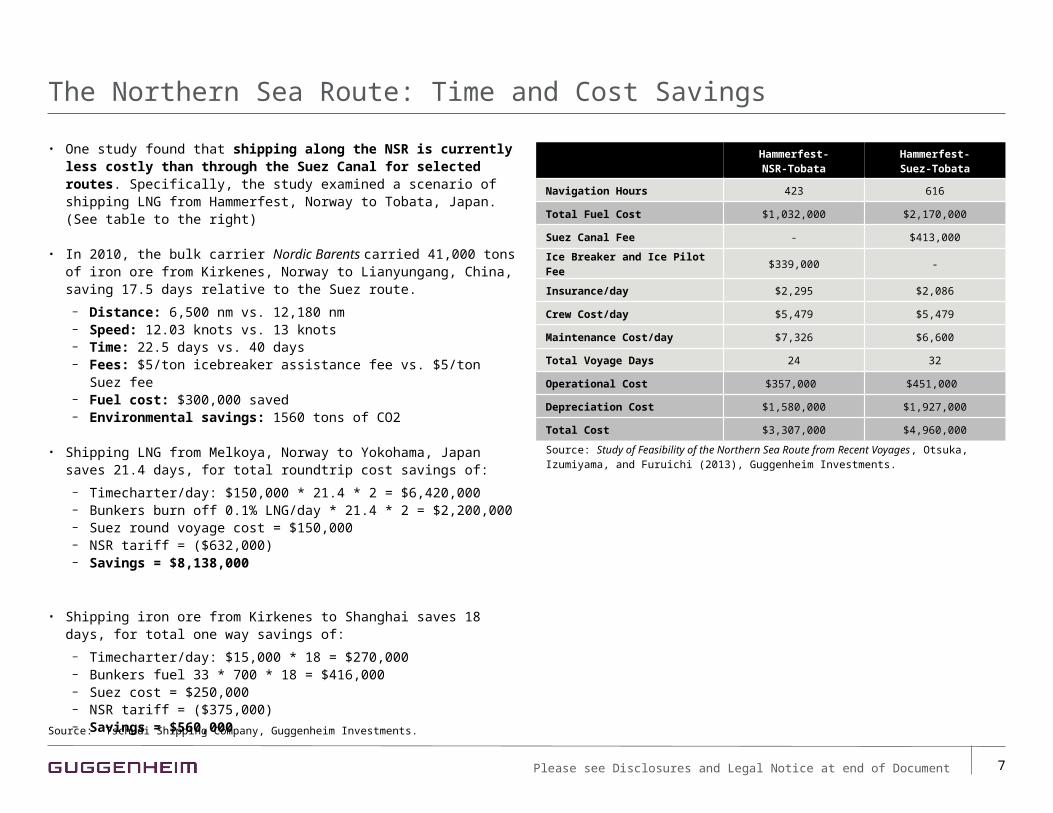
• One study found that shipping along the NSR is currently less costly than through the Suez Canal for selected routes. Specifically, the study examined a scenario of shipping LNG from Hammerfest, Norway to Tobata, Japan. (See table to the right)
• In 2010, the bulk carrier Nordic Barents carried 41,000 tons of iron ore from Kirkenes, Norway to Lianyungang, China, saving 17.5 days relative to the Suez route.
− Distance: 6,500 nm vs. 12,180 nm− Speed: 12.03 knots vs. 13 knots− Time: 22.5 days vs. 40 days− Fees: $5/ton icebreaker assistance fee vs. $5/ton Suez fee− Fuel cost: $300,000 saved− Environmental savings: 1560 tons of CO2
• Shipping LNG from Melkoya, Norway to Yokohama, Japan saves 21.4 days, for total roundtrip cost savings of:
− Timecharter/day: $150,000 * 21.4 * 2 = $6,420,000− Bunkers burn off 0.1% LNG/day * 21.4 * 2 = $2,200,000− Suez round voyage cost = $150,000− NSR tariff = ($632,000)− Savings = $8,138,000
• Shipping iron ore from Kirkenes to Shanghai saves 18 days, for total one way savings of:
− Timecharter/day: $15,000 * 18 = $270,000− Bunkers fuel 33 * 700 * 18 = $416,000− Suez cost = $250,000− NSR tariff = ($375,000)− Savings = $560,000
7
Hammerfest-NSR-Tobata
Hammerfest-Suez-Tobata
Navigation Hours 423 616
Total Fuel Cost $1,032,000 $2,170,000
Suez Canal Fee - $413,000
Ice Breaker and Ice Pilot Fee $339,000 -
Insurance/day $2,295 $2,086
Crew Cost/day $5,479 $5,479
Maintenance Cost/day $7,326 $6,600
Total Voyage Days 24 32
Operational Cost $357,000 $451,000
Depreciation Cost $1,580,000 $1,927,000
Total Cost $3,307,000 $4,960,000
Source: Study of Feasibility of the Northern Sea Route from Recent Voyages, Otsuka, Izumiyama, and Furuichi (2013), Guggenheim Investments.
Source: Tschudi Shipping Company, Guggenheim Investments.
Please see Disclosures and Legal Notice at end of Document
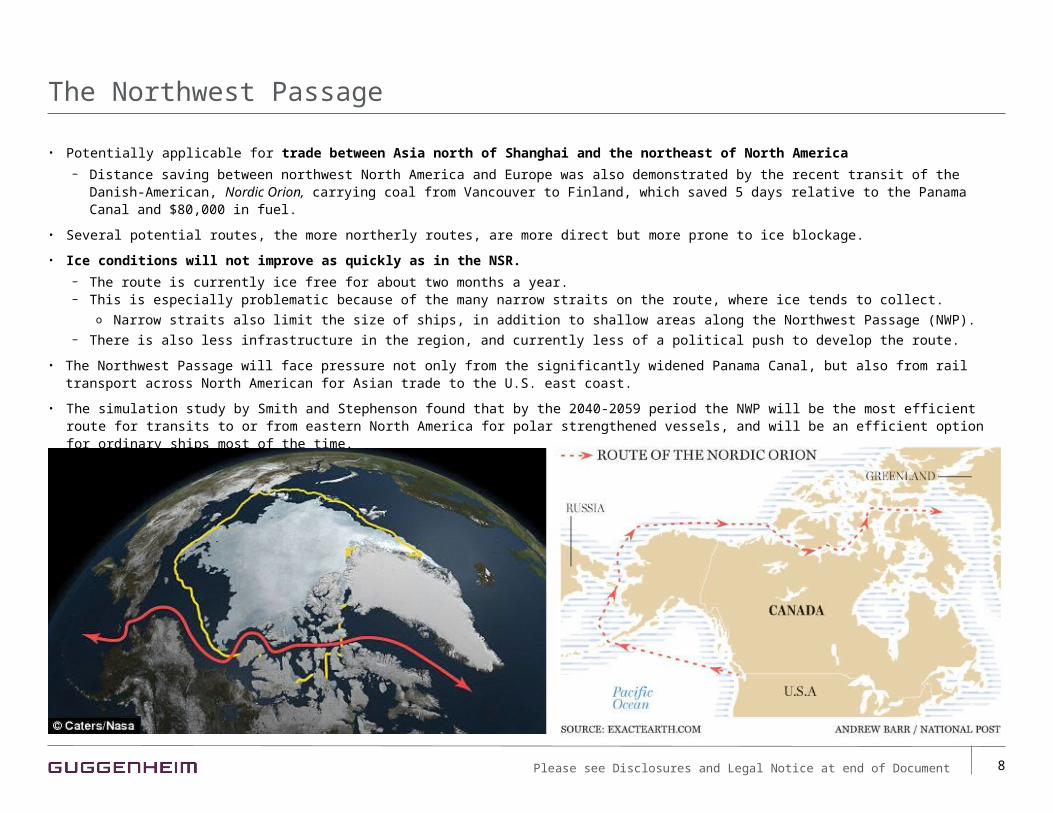
The Northwest Passage
• Potentially applicable for trade between Asia north of Shanghai and the northeast of North America
− Distance saving between northwest North America and Europe was also demonstrated by the recent transit of the Danish-American, Nordic Orion, carrying coal from Vancouver to Finland, which saved 5 days relative to the Panama Canal and $80,000 in fuel.
• Several potential routes, the more northerly routes, are more direct but more prone to ice blockage.
• Ice conditions will not improve as quickly as in the NSR.
− The route is currently ice free for about two months a year.− This is especially problematic because of the many narrow straits on the route, where ice tends to collect.
o Narrow straits also limit the size of ships, in addition to shallow areas along the Northwest Passage (NWP).− There is also less infrastructure in the region, and currently less of a political push to develop the route.
• The Northwest Passage will face pressure not only from the significantly widened Panama Canal, but also from rail transport across North American for Asian trade to the U.S. east coast.
• The simulation study by Smith and Stephenson found that by the 2040-2059 period the NWP will be the most efficient route for transits to or from eastern North America for polar strengthened vessels, and will be an efficient option for ordinary ships most of the time.
8Please see Disclosures and Legal Notice at end of Document
The Transpolar Sea Route
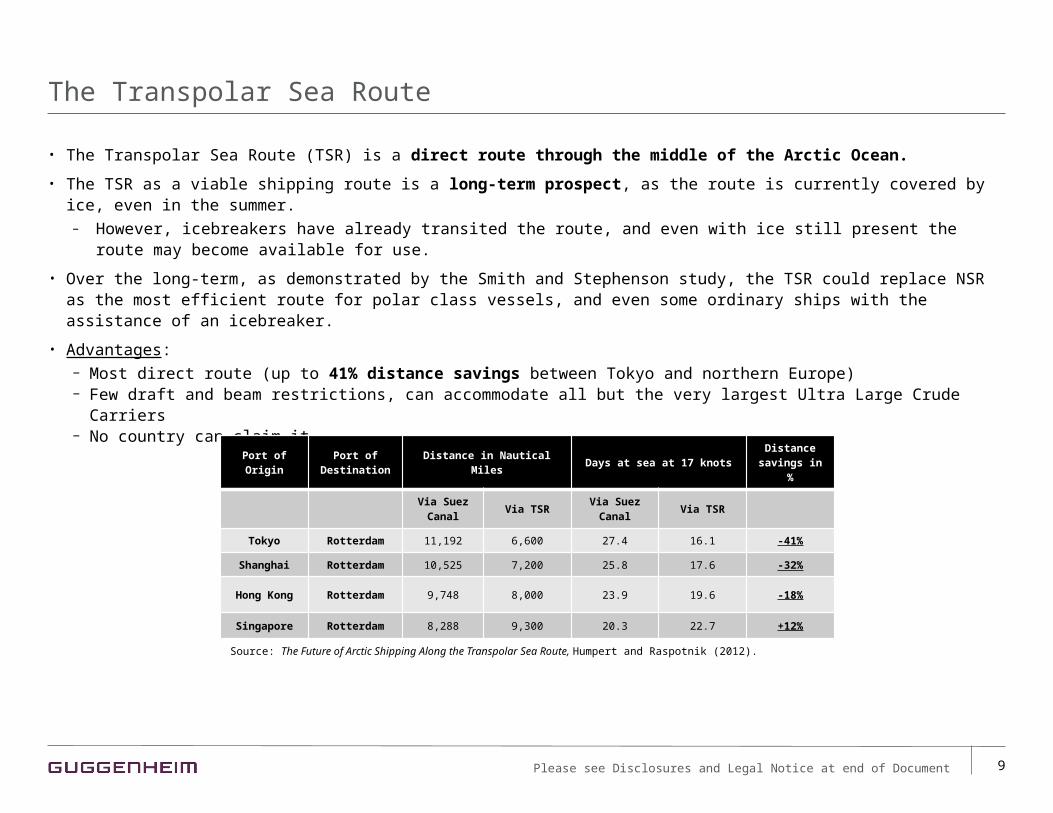
• The Transpolar Sea Route (TSR) is a direct route through the middle of the Arctic Ocean.
• The TSR as a viable shipping route is a long-term prospect, as the route is currently covered by ice, even in the summer.– However, icebreakers have already transited the route, and even with ice still present the route may become available for use.
• Over the long-term, as demonstrated by the Smith and Stephenson study, the TSR could replace NSR as the most efficient route for polar class vessels, and even some ordinary ships with the assistance of an icebreaker.
• Advantages:− Most direct route (up to 41% distance savings between Tokyo and northern Europe)− Few draft and beam restrictions, can accommodate all but the very largest Ultra Large Crude Carriers− No country can claim it
9
Port of Origin
Port of Destination
Distance in Nautical Miles Days at sea at 17 knotsDistance
savings in %
Via Suez Canal
Via TSRVia Suez
CanalVia TSR
Tokyo Rotterdam 11,192 6,600 27.4 16.1 -41%
Shanghai Rotterdam 10,525 7,200 25.8 17.6 -32%
Hong Kong Rotterdam 9,748 8,000 23.9 19.6 -18%
Singapore Rotterdam 8,288 9,300 20.3 22.7 +12%
Source: The Future of Arctic Shipping Along the Transpolar Sea Route, Humpert and Raspotnik (2012).
Please see Disclosures and Legal Notice at end of Document
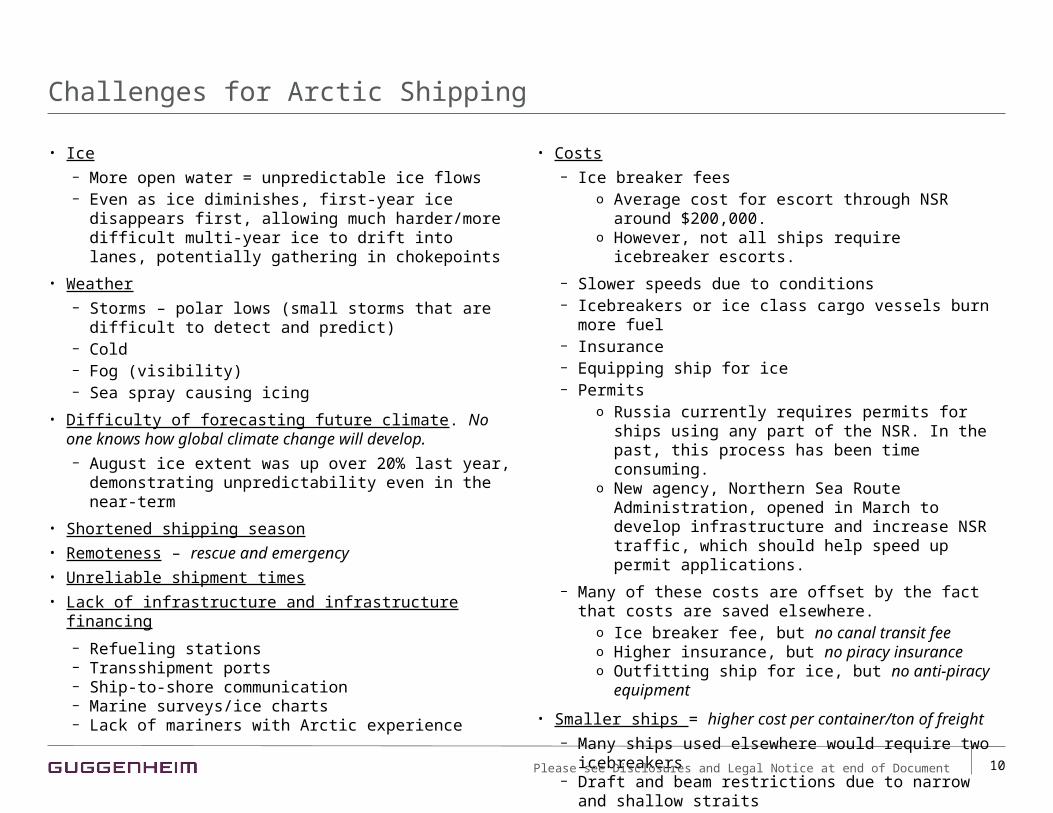
Challenges for Arctic Shipping
• Ice
− More open water = unpredictable ice flows− Even as ice diminishes, first-year ice disappears first,
allowing much harder/more difficult multi-year ice to drift into lanes, potentially gathering in chokepoints
• Weather
− Storms – polar lows (small storms that are difficult to detect and predict)
− Cold− Fog (visibility)− Sea spray causing icing
• Difficulty of forecasting future climate. No one knows how global climate change will develop.
− August ice extent was up over 20% last year, demonstrating unpredictability even in the near-term
• Shortened shipping season
• Remoteness – rescue and emergency
• Unreliable shipment times
• Lack of infrastructure and infrastructure financing
− Refueling stations− Transshipment ports− Ship-to-shore communication− Marine surveys/ice charts− Lack of mariners with Arctic experience
10
• Costs
− Ice breaker feeso Average cost for escort through NSR around $200,000.o However, not all ships require icebreaker escorts.
− Slower speeds due to conditions− Icebreakers or ice class cargo vessels burn more fuel− Insurance− Equipping ship for ice− Permits
o Russia currently requires permits for ships using any part of the NSR. In the past, this process has been time consuming.
o New agency, Northern Sea Route Administration, opened in March to develop infrastructure and increase NSR traffic, which should help speed up permit applications.
− Many of these costs are offset by the fact that costs are saved elsewhere.
o Ice breaker fee, but no canal transit feeo Higher insurance, but no piracy insuranceo Outfitting ship for ice, but no anti-piracy equipment
• Smaller ships = higher cost per container/ton of freight
− Many ships used elsewhere would require two icebreakers− Draft and beam restrictions due to narrow and shallow
straits
Please see Disclosures and Legal Notice at end of Document
11
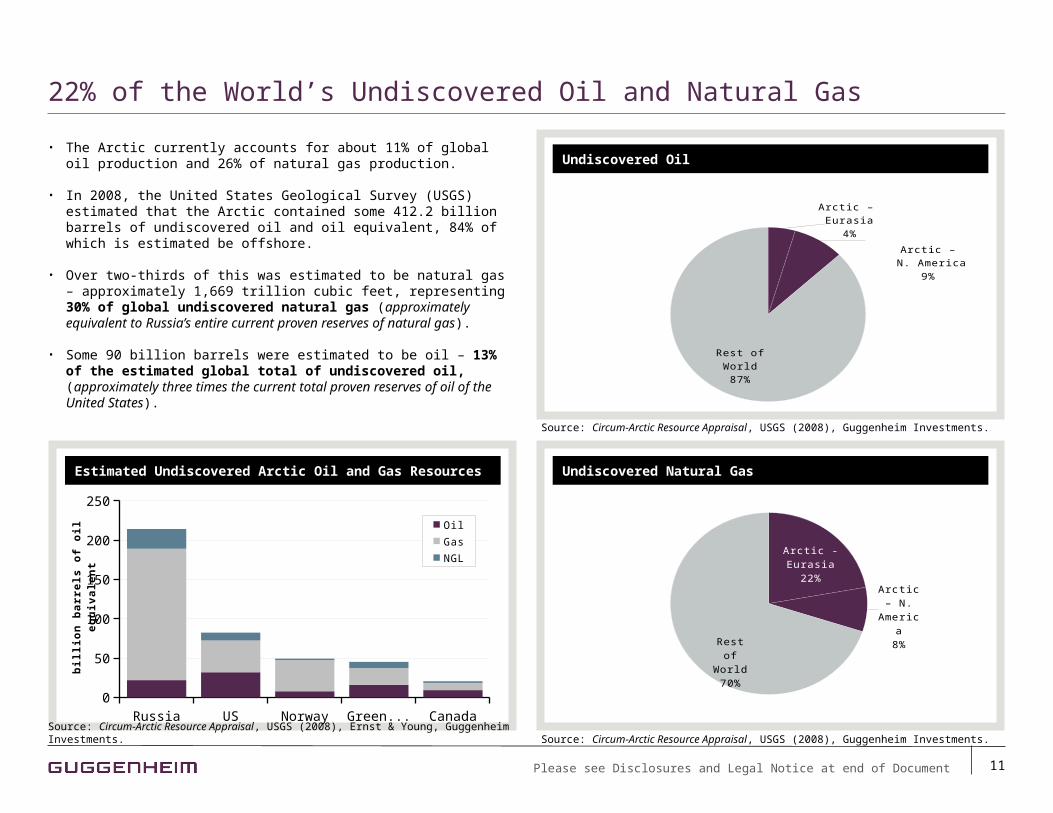
22% of the World’s Undiscovered Oil and Natural Gas
Arctic – Eurasia
4%
Arctic – N. America
9%
Rest of World87%
Arctic - Eurasia22%
Arctic – N. Amer-
ica8%
Rest of World 70%
• The Arctic currently accounts for about 11% of global oil production and 26% of natural gas production.
• In 2008, the United States Geological Survey (USGS) estimated that the Arctic contained some 412.2 billion barrels of undiscovered oil and oil equivalent, 84% of which is estimated be offshore.
• Over two-thirds of this was estimated to be natural gas – approximately 1,669 trillion cubic feet, representing 30% of global undiscovered natural gas (approximately equivalent to Russia’s entire current proven reserves of natural gas).
• Some 90 billion barrels were estimated to be oil – 13% of the estimated global total of undiscovered oil, (approximately three times the current total proven reserves of oil of the United States).
Undiscovered Oil
Estimated Undiscovered Arctic Oil and Gas Resources Undiscovered Natural Gas
Source: Circum-Arctic Resource Appraisal, USGS (2008), Guggenheim Investments.Source: Circum-Arctic Resource Appraisal, USGS (2008), Ernst & Young, Guggenheim Investments.
Source: Circum-Arctic Resource Appraisal, USGS (2008), Guggenheim Investments.
Russia US Norway Greenland Canada0
50
100
150
200
250
Oil
Gas
NGL
bil
lio
n b
arr
els
of
oil
eq
uiv
ale
nt
Please see Disclosures and Legal Notice at end of Document
12
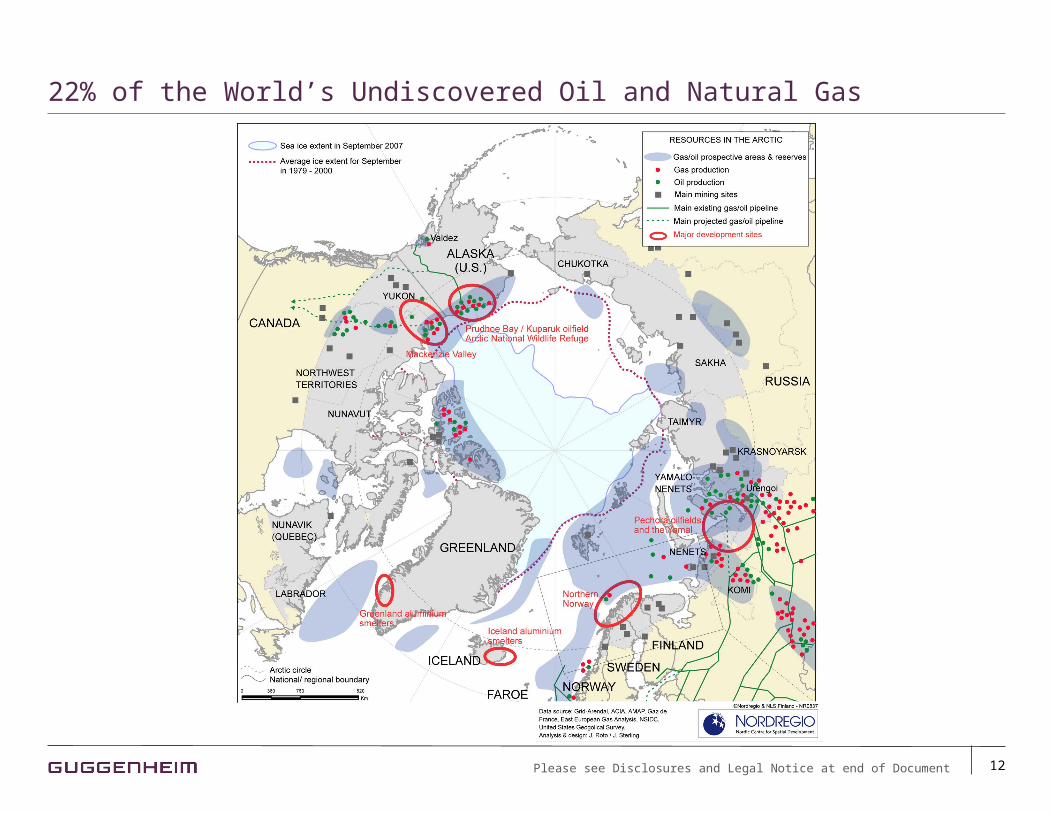
22% of the World’s Undiscovered Oil and Natural Gas
Please see Disclosures and Legal Notice at end of Document
13
Arctic Oil and Natural Gas: Long-Term Production Prospects
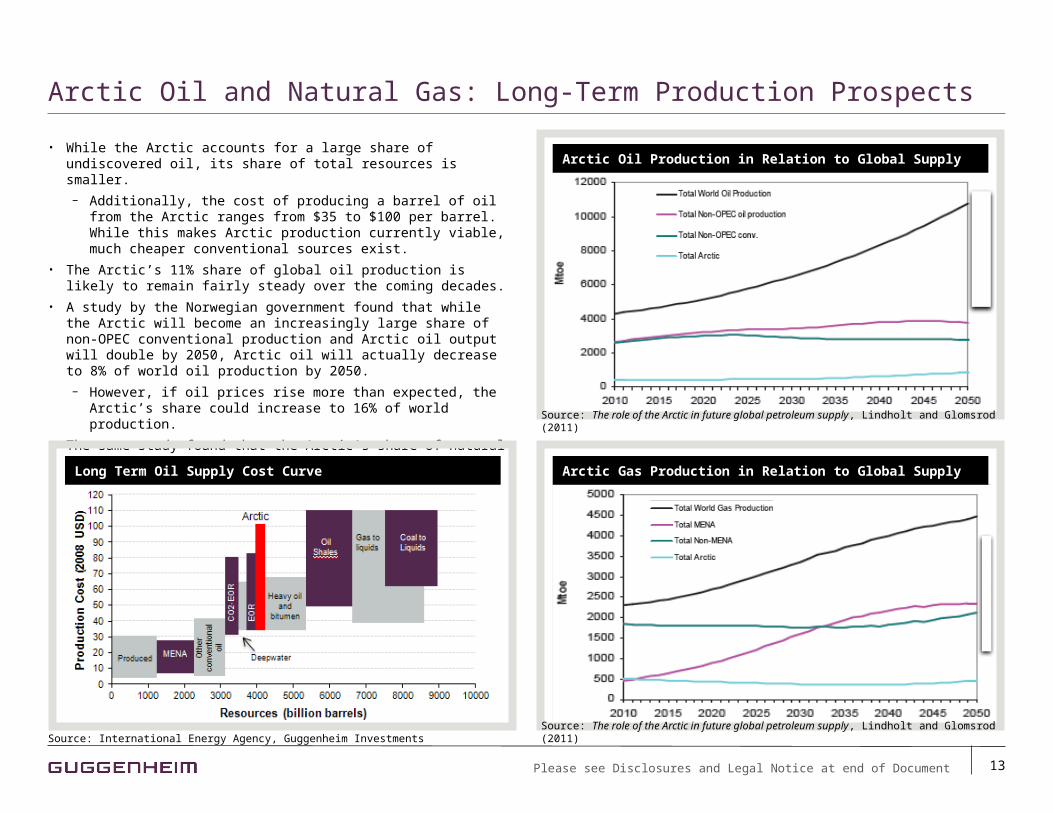
• While the Arctic accounts for a large share of undiscovered oil, its share of total resources is smaller.
− Additionally, the cost of producing a barrel of oil from the Arctic ranges from $35 to $100 per barrel. While this makes Arctic production currently viable, much cheaper conventional sources exist.
• The Arctic’s 11% share of global oil production is likely to remain fairly steady over the coming decades.
• A study by the Norwegian government found that while the Arctic will become an increasingly large share of non-OPEC conventional production and Arctic oil output will double by 2050, Arctic oil will actually decrease to 8% of world oil production by 2050.
− However, if oil prices rise more than expected, the Arctic’s share could increase to 16% of world production.
• The same study found that the Arctic’s share of natural gas production will decrease more substantially, from 26% currently, to 10% by 2050.
Arctic Oil Production in Relation to Global Supply
Arctic Gas Production in Relation to Global Supply
Coal toLiquids
EO
R
Long Term Oil Supply Cost Curve
Source: The role of the Arctic in future global petroleum supply, Lindholt and Glomsrod (2011)Source: International Energy Agency, Guggenheim Investments
Source: The role of the Arctic in future global petroleum supply, Lindholt and Glomsrod (2011)
Please see Disclosures and Legal Notice at end of Document
14
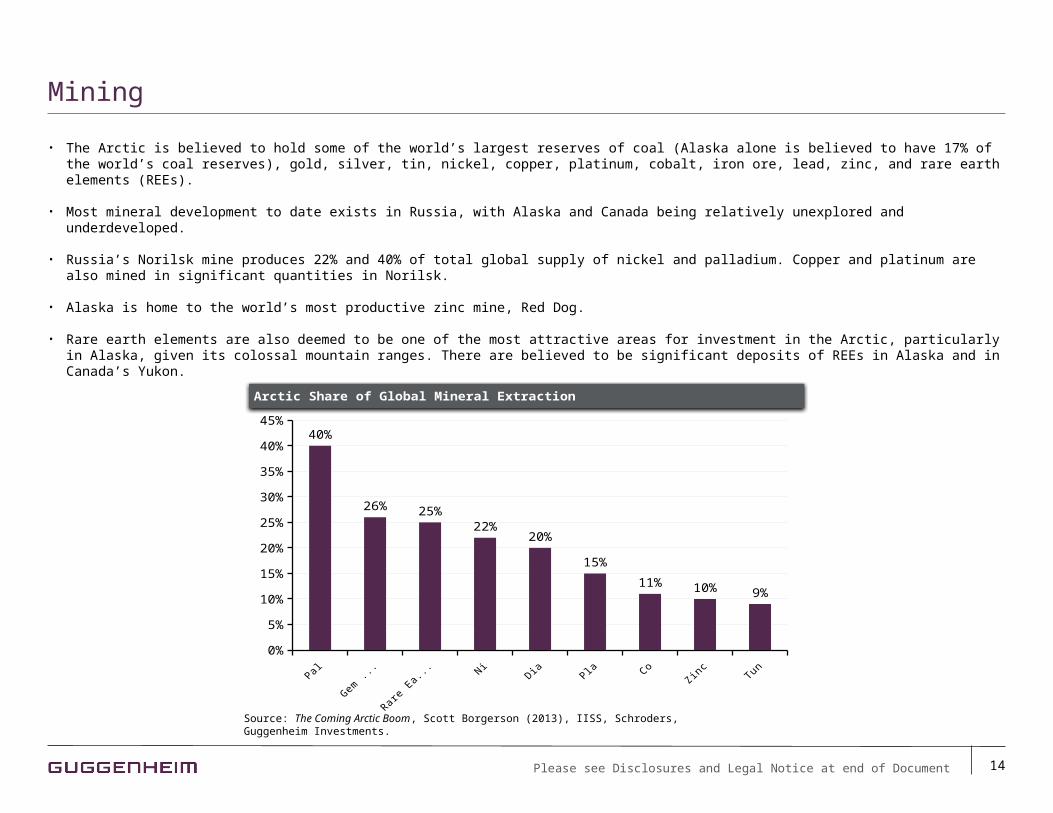
• The Arctic is believed to hold some of the world’s largest reserves of coal (Alaska alone is believed to have 17% of the world’s coal reserves), gold, silver, tin, nickel, copper, platinum, cobalt, iron ore, lead, zinc, and rare earth elements (REEs).
• Most mineral development to date exists in Russia, with Alaska and Canada being relatively unexplored and underdeveloped.
• Russia’s Norilsk mine produces 22% and 40% of total global supply of nickel and palladium. Copper and platinum are also mined in significant quantities in Norilsk.
• Alaska is home to the world’s most productive zinc mine, Red Dog.
• Rare earth elements are also deemed to be one of the most attractive areas for investment in the Arctic, particularly in Alaska, given its colossal mountain ranges. There are believed to be significant deposits of REEs in Alaska and in Canada’s Yukon.
Mining
Source: The Coming Arctic Boom, Scott Borgerson (2013), IISS, Schroders, Guggenheim Investments.
Palladium Gem stones
Rare EarthElements
Nickel Diamonds Platinum Cobalt Zinc Tungsten0%
5%
10%
15%
20%
25%
30%
35%
40%
45%40%
26% 25%22%
20%
15%
11% 10% 9%
Arctic Share of Global Mineral Extraction
Please see Disclosures and Legal Notice at end of Document
15
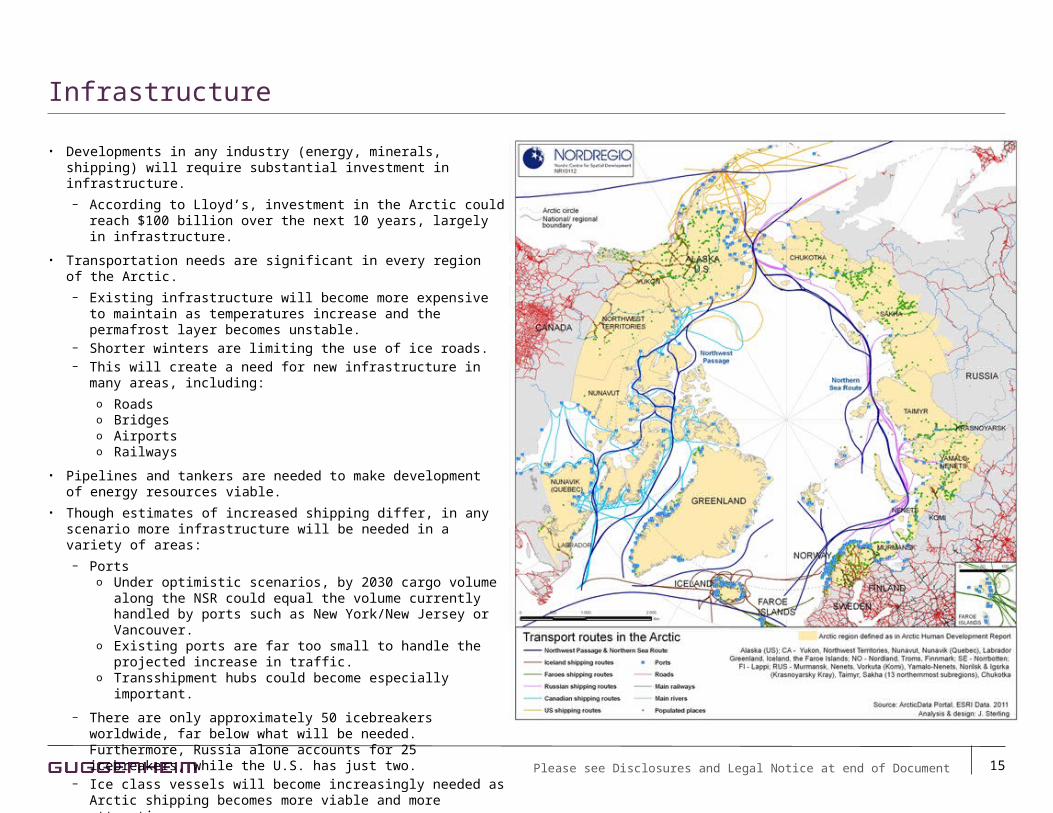
• Developments in any industry (energy, minerals, shipping) will require substantial investment in infrastructure.
− According to Lloyd’s, investment in the Arctic could reach $100 billion over the next 10 years, largely in infrastructure.
• Transportation needs are significant in every region of the Arctic.
− Existing infrastructure will become more expensive to maintain as temperatures increase and the permafrost layer becomes unstable.
− Shorter winters are limiting the use of ice roads.− This will create a need for new infrastructure in many areas, including:
o Roadso Bridgeso Airportso Railways
• Pipelines and tankers are needed to make development of energy resources viable.
• Though estimates of increased shipping differ, in any scenario more infrastructure will be needed in a variety of areas:
− Portso Under optimistic scenarios, by 2030 cargo volume along the NSR
could equal the volume currently handled by ports such as New York/New Jersey or Vancouver.
o Existing ports are far too small to handle the projected increase in traffic.
o Transshipment hubs could become especially important.
− There are only approximately 50 icebreakers worldwide, far below what will be needed. Furthermore, Russia alone accounts for 25 icebreakers, while the U.S. has just two.
− Ice class vessels will become increasingly needed as Arctic shipping becomes more viable and more attractive.
− Ocean charting and surveying, marine navigation aids− Marine communications, traffic monitoring and control− Search and rescue capabilities
Infrastructure
Please see Disclosures and Legal Notice at end of Document
16
Renewable Energy• Norway has invested heavily in renewable energy, which now constitutes nearly 60% of its total domestic energy consumption. • Iceland derives over 80% of its energy supply from renewable sources, mostly geothermal. • There are a number of opportunities to replicate this successful model elsewhere in the Arctic, particularly in Alaska, with its wind and hydroelectric resource
potential.
Water• Most of the world’s fresh water is locked up at the poles, with Canada serving as a reservoir for 20% of the world’s fresh water.• Russia’s major rivers flow into the Arctic Ocean and Alaska is also a vast storehouse of fresh water.• Long-term supplies of pure mountain water can be shipped to any deepwater port on the planet.
Fishing• The Arctic already accounts for 10% of the global fishing catch. • As Arctic ice recedes and access becomes easier, the region will play an increasingly important role in the global fishing industry.
Other• The Arctic is an attractive tourist destination due to its unique environment, diverse cultures, and opportunities for hunting, boating, and sports tourism.• In 2004, 1.2 million passengers traveled to Arctic destinations on cruise ships. Just three years later, the number more than doubled.• 8% of the world’s wood reserves lay within the Arctic.• Trans-Arctic telecom cables, satellite ground stations, and data centers also offer opportunities
Other Opportunities
Please see Disclosures and Legal Notice at end of Document
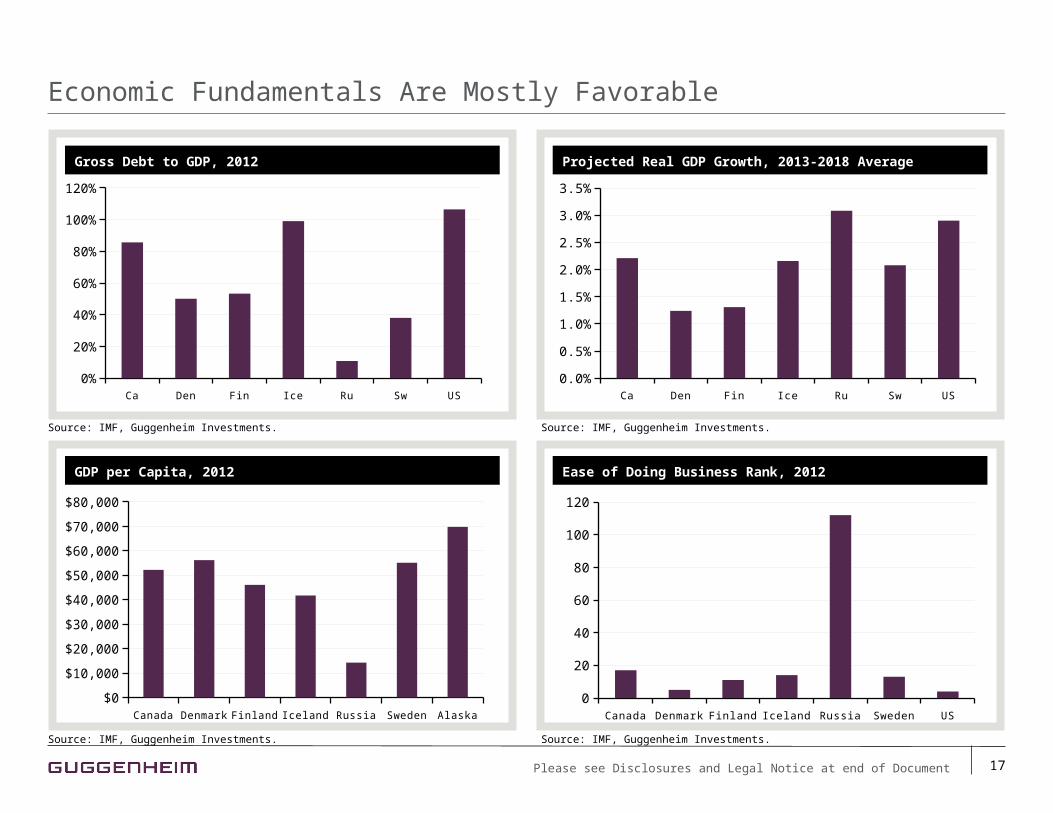
Gross Debt to GDP, 2012
Economic Fundamentals Are Mostly Favorable
17
Projected Real GDP Growth, 2013-2018 Average
GDP per Capita, 2012 Ease of Doing Business Rank, 2012
Canada Denmark Finland Iceland Russia Sweden US
0%
20%
40%
60%
80%
100%
120%
Canada Denmark Finland Iceland Russia Sweden Alaska
$0
$10,000
$20,000
$30,000
$40,000
$50,000
$60,000
$70,000
$80,000
Canada Denmark Finland Iceland Russia Sweden US
0
20
40
60
80
100
120
Source: IMF, Guggenheim Investments.Source: IMF, Guggenheim Investments.
Source: IMF, Guggenheim Investments.Source: IMF, Guggenheim Investments.
Canada Denmark Finland Iceland Russia Sweden US
0.0%
0.5%
1.0%
1.5%
2.0%
2.5%
3.0%
3.5%
Please see Disclosures and Legal Notice at end of Document
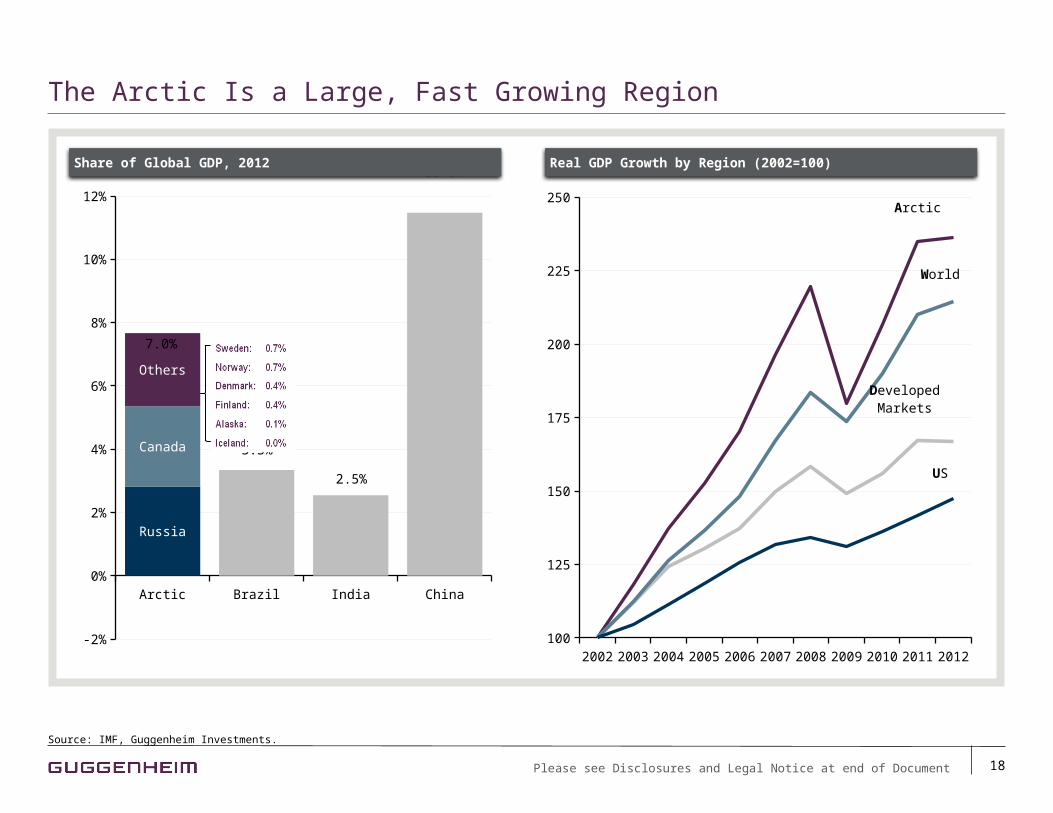
The Arctic Is a Large, Fast Growing Region
18
Source: IMF, Guggenheim Investments.
Arctic Brazil India China
-2%
0%
2%
4%
6%
8%
10%
12%
Russia
Canada
Others
3.3%
2.5%
11.5%Share of Global GDP, 2012
7.0%
2002 2003 2004 2005 2006 2007 2008 2009 2010 2011 2012100
125
150
175
200
225
250Arctic
DevelopedMarkets
World
US
Real GDP Growth by Region (2002=100)
Please see Disclosures and Legal Notice at end of Document
Important Notices and Disclosures
Guggenheim Investments represents the following affiliated investment management businesses of Guggenheim Partners, LLC: GS GAMMA Advisors, LLC, Guggenheim Aviation, Guggenheim Funds Distributors, LLC, Guggenheim Funds Investment Advisors, LLC, Guggenheim Partners Investment Management, LLC, Guggenheim Partners Europe Limited, Guggenheim Partners India Management, Guggenheim Real Estate, LLC, Security Investors, LLC and Transparent Value Advisors, LLC.
The information presented herein has been prepared for informational purposes only and is not an offer to buy or sell, or a solicitation of an offer to buy or sell, any security or fund interest or any financial instrument.
Past performance is not indicative of future results. There is neither representation nor warranty as to the current accuracy or, nor liability for, decisions based on such information.
Although the information presented herein has been obtained from and is based upon sources Guggenheim Investments believes to be reliable, no representation or warranty, expressed or implied, is made as to the accuracy or completeness of that information. No representation or warranty is made by Guggenheim Investments or any of their related entities or affiliates as to the sufficiency, relevance, importance, appropriateness, completeness, or comprehensiveness of the market data, information or summaries contained herein for any specific purpose. The views expressed in this presentation are subject to change based on market and other conditions. There is no guarantee that Guggenheim Investments will make the investments as discussed herein.
The illustrations are intended solely as a tool to assist in consideration of various potential asset allocations for a client’s account. Guggenheim Investments makes no warranty that the asset allocations discussed in this presentation will be used to manage your account. Asset allocations may differ between clients based on their investment objectives and financial situations. No assurance can be given that the investment objectives described herein will be achieved and investment results may vary substantially on a quarterly, annual or other periodic basis.
This data is for illustrative purposes only. Past performance of indices of asset classes does not represent actual returns or volatility of actual accounts or investment managers, and should not be viewed as indicative of future results. The information contained in this presentation has been gathered from sources we believe to be reliable, but we do not guarantee the accuracy or completeness of such information, and we assume no liability for damages resulting from or arising out of the use of such information.
The views expressed in this presentation are the views of Guggenheim Investments and are subject to change based on market and other conditions. In discussion of any strategy, results and risks are based solely on the hypothetical examples cited; actual results and risks will vary depending on specific circumstances. Investors are urged to consider carefully whether such services in general, as well as the products or strategies discussed in this material, are suitable to their needs.
The opinions, estimates, investment strategies and views expressed in this document constitute the judgment of the author and our investment strategists, and based on current market conditions and are subject to change without notice. The investment strategies and views stated here may differ from those expressed for other purposes or in other contexts by other entities affiliated with Guggenheim Investments that may use different investment philosophies. The investments discussed may fluctuate in price or value. Investors may get back less than they invested. Changes in rates of exchange may have an adverse effect on the value of investments. Numbers may not add to 100% due to rounding.
Past performance is not indicative of comparable future results. Given the inherent volatility of the securities markets, it should not be assumed that investors will experience returns comparable to those shown here. Market and economic conditions may change in the future producing materially different results than those shown here. All investments have inherent risks.
Expected returns are statistical estimates of hypothetical average returns of economic asset classes, derived from statistical models. Actual returns are likely to vary from expected returns. Expected return models apply statistical methods and a series of fixed assumptions to derive estimates of hypothetical average asset class performance. The models have limitations, as the assumptions may not be consensus views, or the model may not be updated to reflect current economic or market conditions. Accordingly, these models should not be relied upon to make predictions of actual future account performance. Guggenheim Investments has no obligation to provide recipients hereof with updates or changes to such data.
Any hypothetical performance results shown: (i) do not represent the results of actual investments but were achieved by retroactively applying a strategy designed with the benefit of hindsight; and (ii) do not reflect material economic and market factors that might have had an impact on Guggenheim Investments’ decision-making when using the strategy to manage actual client accounts.
Simulated results are shown for some methodologies because these are new strategies and, thus, have no performance history. There is no guarantee that an actual client portfolio will have the same return and risk profile as the simulated models. Model portfolios do not represent actual trading. Where model results are portrayed, Guggenheim Investments clients may have had investment results that were materially different from those portrayed herein. Some of the securities or strategies reflected in the model portfolio do not relate or relate only partially to the services currently offered by Guggenheim Investments.
The information presented herein is not intended to be target, projected or estimated returns. Rather, these numbers are based upon historical results derived from calculations using the risk distribution assumptions stated. This information is presented solely to assist you in creating a portfolio structure and forming investment guidelines and sector allocations.
The comparisons herein of the performance of the market indicators, benchmarks or indices may not be meaningful since the constitution and risks associated with each market indicator, benchmark or index may be significantly different. Accordingly, no representation or warranty is made to the sufficiency, relevance, importance, appropriateness, completeness, or comprehensiveness of the market data, information or summaries contained herein for any specific purpose.
The information contained herein is given as of the date hereof and this does not purport to give information as of any other date. Neither the delivery of this document nor any sales made hereunder shall, under any circumstances, create an implication that there has been no change in the matters discussed herein since the date hereof.
© 2014 Guggenheim Partners, LLC. All Rights Reserved. No part of this document may be reproduced, stored, or transmitted by any means without the express written consent of Guggenheim Partners, LLC. The information contained herein is confidential and may not be reproduced in whole or in part.
19