the mechanism of phase transformations in crystalline solids
DESCRIPTION
The phase transformationsTRANSCRIPT
THE MECHANISM OFPHASE TRANSFORMATIONS
IN CRYSTALLINE SOLIDSProceedings of an International Symposium organized by the Institute
of Metals and held in the University of Manchester from3 to 5 July 1968
Monograph and Report SeriesNo. 33
1969Published by
The Institute of Metals17 Belgrave Square, London, S.W.1
for the Metals and Metallurgy Trust

First published 1969
Printed in Great Britain by BPC Letterpress Ltd., London, at Sidney Press, Bedford
© The Metals and Metallurgy Trust 1969

CONTENTSSession I: Spinodal Decomposition
Coherency Stress in Elastically Anisotropic Crystalsand Its Effect on Diffusional Processes. John W.Cahn
Spinodal Decomposition: Observations in theIsotropic, Non-Crystalline NazO-SiOz System.M. Tomozawa, H. Herman, and R. K. MacCrone .
A Study of Precipitation in a Cu-16% Ni-1O% Co" Side-Band" Alloy. V. A. Phillips
PAGE
6
11
Zone Formation in an Austenitic Steel ContainingAluminium and Titanium. F. G. Wi/son
The Decomposition of Concentrated Al-Zn Alloys.A. J. Ardel/, K. Nuttall, and R. B. Nicholson .
Precipitation Phenomena in Gold-Platinum Alloys.G. Kralik, J. Weise, and V. Gerold
Discussion
PAGE
16
22
27
29
Session 11: Precipitation
Nucleation in Solids: (A) Brief Survey; (B) CellularPrecipitation. K. N. Tu and D. Turnbull
The Nucleation of Precipitates in Aluminium Alloys.G. W. Lorimer and R. B. Nicholson
The Factors Controlling the Width of Precipitate-FreeZones at Grain Boundaries in AI-Zn. M. H. Jacobsand D. W. Pashley
The Effect of an Addition of 0·5 wt.- % Silver on theAgeing Characteristics of Certain AI-Cu-MgAlloys. N. Sen and D. R. F. West
Effect of Plastic Deformation on the e" -* e' Trans-formation during the Ageing of an AI-4 % Cu Alloyat 1600 C. J. D. Cook and J. Nutting .
Precipitation of NaCl-Type Carbides in Austenite andTheir Behaviour in the Neighbourhood of GrainBoundaries. J. M. Si/cock and A. W. Denham
Carbide Transformations in Ferritic Steel. J. M.
®Darbyshire and J. Barjord. . . . .
l'lV Iron Carbides in Tempered Steels. S. Murphy, J. A.\" Whiteman, and J. H. Woodhead. . . .
A New Precipitate in the AI-Cu-Mg-Ag System.J. H. Auld and J. T. Vietz
32
36
43
49
54
59
65
72
77
Excess Vacancies and the Mechanism of the SlowReaction in an Aluminium-4 % Copper Alloy.J. Okamoto and H. Kimura.
The Effect of 0·24 % Si upon the Initial Stages ofAgeing of an AI-2·5% Cu-l·2% Mg Alloy. R. N.Wi/son
Trace Elements and Precipitation in Aluminium-Copper Alloys. G. B. Brook and B. A. Hatt .
The Effect of Deformation on Precipitation in Ni-Base Alloys. I. Kirman and D. H. Warrington
Theoretical Calculation of the Rhombohedral Distor-tion of the Transition Phase in AI-Zn Alloys.Ryszard Ciach
The Early Stages of Precipitation of Some Group IVCarbides and Nitrides in Molybdenum. N. E. Ryanand J. W. Martin
Nucleation and Growth of IX Rods from Pre-ExistingIXI Plates in Some Copper-Zinc Alloys. P. E. J.Flewitt
The Nucleation of Graphite at an AustenitejCementiteInterface. N. Swindel/s and J. Burke
Discussion
79
80
82
85
86
88
90
9294
Session Ill: Particle Coarsening
Particle Coarsening. G. W. Greenwood 103 Effect of Matrix Structure on Carbide Coarsening andExperimental Confirmation of the Lifshitz-Wagner Transformations. W. E. Stumpjand C. M. Sellars . 120
Theory of Particle Coarsening. A. J. Ardell . 111 Influence of Concurrent Deformation on CoarseningMeasurement of Diffusion Fields around Precipitate of Carbides. T. Mukherjee and C. M. Sellars 122
Particles by Electron-Probe Microanalysis. M. G.Hall and C. W. Haworth 117
The Coarsening of Spherical Intermetallic Particles ina Ferritic Fe-Si-Ti Alloy. E. N. Bower and J. A.Whiteman . 119 Discussion 124
Session IV: Martensite
Martensitic Transformations: A Current Assessment.J. W. Christian . 129
The Nucleation and Growth of Slow-Growing Marten-site in Fe-30% Ni. J. A. Klostermann . 143
The Mechanism of Nucleation of Martensite inPrecipitates of Iron in a Copper Matrix. K. E.Easterling and P. R. Swann . 152
The Effect of Austenitizing Conditions on MartensiteTransformation by Bursts. A. R. Entwisle and J. A.Feeney 156
The Effect of Magnetic Fields on Transformations inSteels. K. R. Satyanarayan and A. P. Miodownik. 162
Martensitic Transformations in Non-Ferrous Crystal-line Solids. D. S. Lieberman 167
The Crystallography of Martensitic Transformationsin Uranium and Its Alloys. A. G. Crocker andN. D. H. Ross 176
The Morphology and Crystallography of MassiveMartensite in Iron-Nickel Alloys. R. G. Bryans,T. Bel/, and V. M. Thomas 181
Session IV: Martensite, continued
PAG!:
Transformation in Stressed Cobalt Nickel Crystals.Ellllllalluc/ deLalllolle and Car/ A !f,lIeller
Remarks on the Factors Controlling the Lattice-Orientation Relationship and Habit Orientation in:v1;utensitic Transformation Processes. W. C.Bun:ers
The 'l. . '( Martensite Transformation in CrystallineMercury. J. S. Ahell and .-1. C. Crocker
The Cr~ stallography of the Martensitic Transformationin an Fe-32°" i Allo). P. C. ROIl-talllf.I', E. O.Fearoll. and M. B('I'i,l .
189
190
192
194
A Note on the Dependence of the Lo\\-TemperatureMartensitic Transformation in b3Sn on Com-position. H. W. Killg
Martensite Produced by Deformation in Mono-crystals of Beta-Brass. HomeI' Pops and/vI. Ah/ers .
Discussion
1%
197
199
Session V: Order-Disorder
Interstial Order-Disorder Transformation in theTitanium-Oxygen System. \1. lIim/wmshi. M.Ko iII'({, and S. Yallwf.{uchi
The Structure of the Low-Temperature Modificationof Titanium Monoxide. I. W. /'ere and R. E,SlIIall/llw/
The Ordered Structure of Ti 1·25. O. WUlallahe. O.Temwki, A. JOSI,\'(I/IS,and./ R. Cusl!es
Some Interstitial Order-Disorder Transformations.K. H. Jack
207
212
220
221
The Order Disorder Transformation in Fe3AI Alloys.M, R. Lesoille and P. M. Cie/ell ,
The Mechanism of Formation of the Un Superlattice.11. N. SO/ll!/ll'{}rlh and 13. Ra/ph
Re-Establishment of Short-Range Order duringAnnealing of a Cold-Worked Ag-Pd Allo~. K.Kris/lIIu Ruo
Discussion
22.1
224
226
228
Session VI: Interface-Controlled Transformations
The Role of Interfaces in Phase Transformations.M. Hillerl. 231
Phase Transformations in L Cr Alloys. ri. Bur-Orand C. Killlllle/ . 248
Transformation Kinetics of the'~ . 'I. Phase Changein a Uranium-Chromiun'-Mol) bdenum Alloy.,'vI. ,\1. Haher/ill and G. F. SlulIer,\' 254
The :~' 'Transformation In the AgZn System,J. E. Kill/ and A. Ca/m 260
The Effect of Small Additions of Copper on theTransformation Charactenstlcs of ','-Phase AuCdAlloys. M, E. Brooke,1 and R. W. SlIIil!/ 266
On the Problem of the Definitions and the Mechanismsof the Bainitc Reaction. H. I. Aarollsoll 270
The Jsothermal Decomposition of Nitrogen Austeniteto Bainite. T. Bell and 13. C. Famell 282
The Isothermal Decompositi()n of Allo~ Austenite.F. G. Berr)'. A. T. Om·ellp'''''' and R. 1'1'.K. HOlle.l'-COli/he 288
The Effect of Manganese on Pearlite Degeneracy inIron·-Nitrogen Alloys . ./. Williallls. R. C. Coc//lWI(',L. C. T. Om'.", and S. C. C/orer 29.1
The Decomposition of the ',' Phase ofa Cu 2711t..""Sn A 110). W. J 'ulII/erllle/l/ell and .-1. Oel'lI.\·lll'J'(' 29-1
A Stud) of 'I. • ('I. ",) . ',' Transformations byHeating or Quenching for Rinar~ re Cr Alloys\\ith Compositions in the ',' Loop. ,I. M. 11/1111::,P. C/lim/dellq, 'vi .. lucO/lIUrier. and P. l.u('(}lI/he 296
Electron M icroscor~ of the Massil e Cu Zn 'I.", Phase.L. 01'/01'.1'. 13. HUII·ho/l. and T. 13. ,\hll.IU/I/'i .lOO
Morphological Studies of the > and:~· '"Tra nsformat ions in Eq uia tom ic AgZn. H. ,\.fe!.C/(//"'- E. A. Merri111uII, and C. M. Wa.1'II/{/1I 302
A Phase-Interface Reaction during the Interdiffusion ofChromium and Tungsten. F. ./ .. 1. dell Broeder 304
Discussion .105
Session VII: Theory of Transformations
Transformations in Solidified Gases. Chur/es S.Burrell
A Band Structure for G.P. Zones and Its Effects.P. Wi/kes and A. H ille/
313
319
Phase Changes and the Pseudopotential Method.O. Weuire and ./. I:'. IlIg/esfie/d
Discussion
321
323

PREFACEIn 1966 the Metallurgy Committee of the Institute of Metals initiated an international conferenceentitled "The Mechanisms of Phase Transformations in Crystalline Solids". The confer-ence was held in the University of Manchester from 3 to 5 July 1968, with the followingprogramme committee:
R. B. Nicholson (Chairman)J. W. ChristianG. W. GreenwoodJ. NuttingR. E. Small man
University of ManchesterUniversity of OxfordUniversity of SheffieldUniversity of LeedsUniversity of Birmingham
The object of the conference was to discuss and correlate recent advances in the theory andexperimental investigation of the mechanisms of phase transformations in crystalline solids.
This volume contains the introductory and contributed papers that were preprinted forthe conference, research notes that were orally presented at the conference, and an editedversion of the discussion that took place at the conference. The programme committee wishesto thank Dr. P. Wilkes and Dr. G. W. Lorimer of the University of Manchester for theirconsiderable help in the recording and editing of the discussion.


Session I
Coherency Stress in Elastically AnisotropicCrystals and Its Effect on
Diffusional ProcessesJohn W. Cahn
Manuscript received 22 February 1968. Professo~ J. W ..Cahn, Ph.D.,is in the Department of Metallurgy and Matenals SCIence, Massa-chusetts Institute of Technology, Cambridge, Mass., U.S.A.
Equation (1) could be considered as the first term of an expan-sion for the flux J in terms of spatial derivatives of the com-position c. In the spinodal theory we encounter an additionalterm
Coherency strains from compositional inhomogeneitiesin elastically anisotropic cubic crystals are shown tohave an anisotropic hydrostatic component. This affectsthe free energy and leads to a new term in the diffusionequation for coherent processes. The influence of thiseffect on nucleation, coarsening, homogenization, andspinodal decomposition is discussed.
•.. (4)
D(2) is a tensor of rank four and could be anisotropic.Yet because it is the product of the diffusion and gradientenergy coefficients, both second-rank tensors, it too is iso-tropic.1,5,6 Thus equation (2) is not the correct form for intro-during the elastic anisotropy. The present paper is a deriva-tion of the appropriate diffusion equation that permits theintroduction of elastic anisotropy.
Let us start with an expression for the free energy of a non-uniform, coherent system containing long-range compositionfluctuations about an average composition Co. This free energyis composed of three terms:1,5
(1) Fch = Sf' (c) dV, the integral of the homogeneousfree-energy density, f' (c), which is the free energy that eachelement of volume of composition c would have if it weresurrounded by homogeneous material of the same compo-sition. The quantity f' (c) is the free energy that we wouldmeasure in real, homogenized solid solutions by conventionalmeans.
(2) F G, the gradient energy, a first term in the expansion foradditional energy that results from the effects of long-rangecomposition gradients. A simple derivation of this term6compares the kinds of neighbours of an atom in a homo-geneous material with those of an atom in a gradient but at asite of the same composition. For a general crystal systemit must have the form
3 32~ oc ocKij--
~ ox; OXj;=1 j~1
and K is a tensor of rank two. For cubic systems, K is iso-tropic6 and the gradient energy reduces to K(VC)2.
(3) Fel, the elastic energy. If the lattice parameters arefunctions of composition, then a coherent inhomogeneoussystem will have additional elastic energy that may be calcu-lated in a straightforward way from linear elasticity and, forisotropic elasticity, may be incorporated into the volumefree energy.'-
The model for calculating the elastic strain energy of a co-herent system starts with a stress-free uniform crystal andassumes that we coherently produce a change in an elementof volume at i' that would produce a strain Eij(i') if that ele-ment were kept stress-free. We also assume that the elasticconstants are independent of this stress-free strain.
... (2)
... (3)
-J = Dvc
3 333
= "" D (I) ~ + "" "" "" D (2l
~ ij OXj ~~~ ijklj~1 j=l k=l 1=1
(i=1,2,3)
-Ji
Spinodal decomposition occurs by a spontaneous diffusionprocess. Diffusion in cubic crystals is usually isotropic, yetthe spinodal reaction in such a crystal is not,! The aniso-tropy is the result of the introduction of elastic coherencyterms that are not isotropic.
Coarsening of coherent precipitates is also a spontaneousdiffusion process. It leads in cubic crystals to alignment of theremaining precipitates along certain crystallographic direc-tions.2,3 This is almost certainly the result of coupling aniso-tropic coherency strains to the diffusion process.
Symmetry rules for processes in crystals are quite basic andif we write
3
- Ji = "" Dij ~ (i = 1,2,3) '" (I)~ OXjj=l
for Fick's first diffusion equation, Dij cannot be anything butisotropic4 and equation (1) becomes

Co
COMPOSITION
Fig. l Schell/alic free energy \'s. COII/POlilion ClI/Tl'\ illll.l/rating IhedillinClion be/ll'een Ih(' e/li>('I.1 of colterenCl Ilrainl alld alOllliclIIisfil enag,\'. Clln'e (a) i.1 Ihe anllal /;.('(' en('/'!!y of a 1II0le 01'hOlllogeneolls SOllllioll al (] f"llclion oj COlllpwilion. Clln(' (b) il/he 1I('{1I111free energy per lIIole of a .I'll/all 0111011I1/of ItOIllO-g('neolls solll/ion of cOlllposilioll e ('oirer('lI/ly ('nclosed ill alIIatrix of arerog(' COlllpO.l'iliOIl ell' Tlte dlj/erenc(' belween IlteseClln'ef i, Ihe ('Iaslic ellerg." dill' 10 coher('nc .•.. Cllrre (c) is a h)'po-11t(,lical solll/ion of Ihe mOll/I' idell/i('al 10 Ihe aClllal solllliol/exc('pllhallhe alOllls are all as.l/lll1ed 10 hore Ihe lallle .Ii::e. Thedilfer(,llc(, belll'eell (,IIITe.I' (a) and (e) il The atolllic lIIil(il ('/I('rg .•..
... (6)
... (10)
Y(P) = ~(Cl I 2(12)
[3 __ CII + 2CI2
CJl~ 2(2CH-CII ~CI2)(/:!II/:!
2 Session I: Spinoda/ DecolI/position
When the source of the stress-free strain is a compositionchange we may, for small composition excursions, define"'" the strain produced by a unit composition change, and
Cij(r) = 'r,ij [c(r) - co] ... (5)For a cubic crystal 'r,ij = 'r,oij and
()In avc
where a is the lattice parameter. For such a caset
\\ here
Ff! = (277)3 JJJ[ Y(P) E(P) E* (P)]IPP (7)
= (2;:)3 'r,:! J J J[ Y(P) AlP) A*(P)] dap (8)
n:!I:!J... (9)
is an orientation-dependent elastic modulus \\ here I, Ill, andIt arc the directional cosines that P makes with the cube axes.E (and E*) and A (and A*) are respectively the complexFourier transforms (and their complex conjugates) of E and c.
E(P) = (2177f.JJJe(r) e>.p (ip. i') dap
4(p) = (2~):JJfJ (e(r) -- co) exp (iP . r) II'Jr ... (11)
\\ here P is a. \\ave vector and r the position vector in thespecimen. The quantity AlP) is independent of how fine ascale we choose for smoothing. provided that the reciprocalof this scale length is larger than p. We cOll\eniently do thisby putting an upper limit to P in the integral.
Fcl differs from the atomic-misfit energy that occurs insolid-solution theory and originates from fitting togetheratoms of different sizes. R.n ThiS atomic-misfit energ) is im-plicitly included in r as measured: it is the difference bet\\eenf' ofa real. homogeneous solution and a free energy ofa hypo-thetical solution of the same system in which all the atomshave the same size (Fig. I). Although this hypothetical solu-tion may have a certain theoretical fascination. it cannot bemade in the laboratory or measured and is of no use as astarting point for a phenomenological theory. F"i on theother hand is the difference between two real free energies,that of a coherent system and a system with the ame phaseor compositions separated into stress-free portions. As sho\\ nin Fig. 2. these two elastic energies have apparently oppositeetrects9 in promoting precipitation but since curve c is an un-realizable state, it is immaterial whether or not such a hypo-thetical solution would have a miscibility gap. In Figs. I and 2.curves band c have a tendenc) to be parallel. This is especi-ally true if we use atomic-misfit theories' in \\ hich each atomof a solid Solulion is assumed to be a region of composit iono or I coherently joined to every other atom.
The sum of the three terms, Felt. FI:. and F,'I. is the freeenerg) of a non-uniform system and b) differentiating thissum \\e obtain an expression for the free-en erg) change result-
tThe derivation in Ref. (I) considers a singlc sine walc. The faCIOI'12,,)3 instead of J' originates in Ihe passage 10 a continuous distributionof \\:'l\ckngths in an infinite system.
CoCOMPOSITION
Fig.:? S('irelllllli(' jree-energl' Clln'el 10 illll.llrtll(' TlwT II/rile Ihealolllic-Illi.ljil energ.'· i, £I /(/{'Ior Ihm ree/llcey lolllhilil)'. Ill('coirerem·.I· ,\Train i,l (] faCIOI' redllcing lire l('nd('l/cy jilr 1I .IIII'('/'-.Ialllrtl/('d .l'OlllliOIl TOprecipilme eoherol/ly. Clln'n (a). (b). IIlld(c) ir{/\'e Ih(' 1{)Jlle IlIeanil/gs l/I in Fig. I.
ing from an arbitrary infinitesimal change in the l'ompo\llionanywhere. i\c(r),
of = JJJ [~~:'- 2(,:! JJJ.-l Y e>.p (
Cahn: Coherency Stress in Elastically Anisotropic Crystals 3
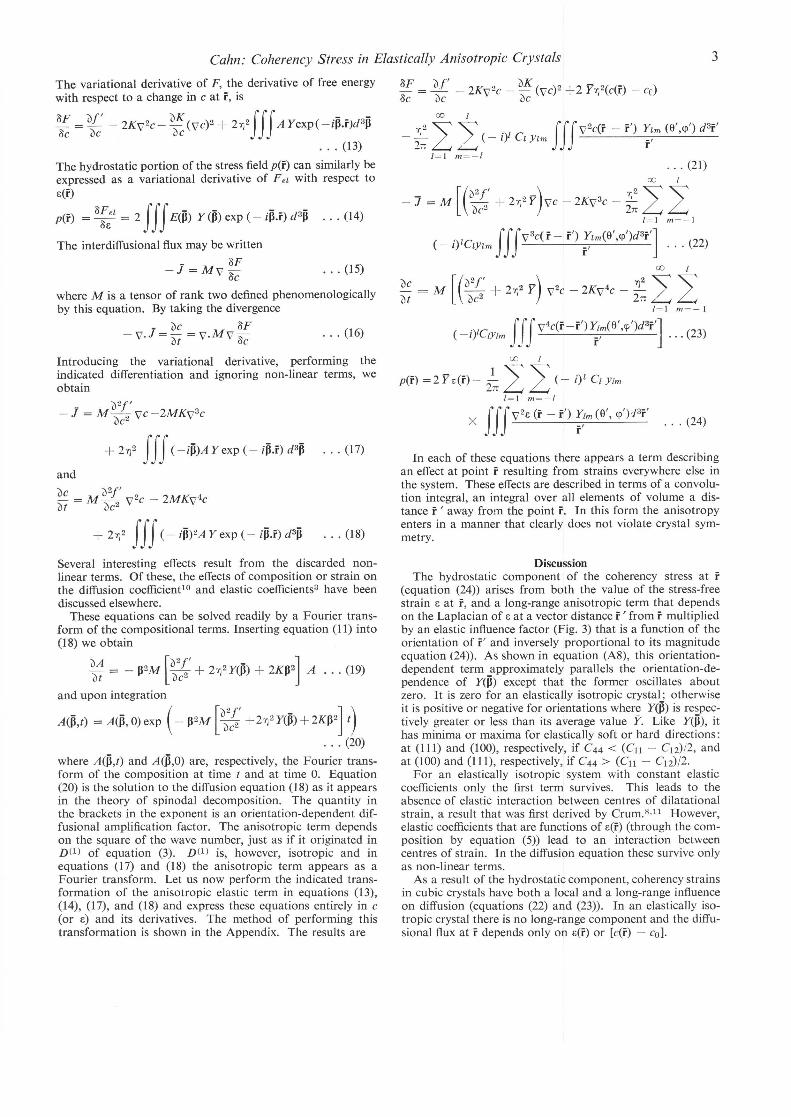
In each of these equations there appears a term describingan effect at point i resulting from strains everywhere else inthe system. These effects are described in terms of a convolu-tion integral, an integral over all elements of volume a dis-tance i ' away from the point i. In this form the anisotropyenters in a manner that clearly does not violate crystal sym-metry.
DiscussionThe hydrostatic component of the coherency stress at i
(equation (24)) arises from both the value of the stress-freestrain E at i, and a long-range anisotropic term that dependson the Laplacian of E at a vector distance i' from i multipliedby an elastic influence factor (Fig. 3) that is a function of theorientation of i' and inversely proportional to its magnitudeequation (24)). As shown in equation (A8), this orientation-dependent term approximately parallels the orientation-de-pendence of Y(P) except that the former oscillates aboutzero. It is zero for an elastically isotropic crystal; otherwiseit is positive or negative for orientations where Y(P) is respec-tively greater or less than its average value Y. Like Y(P) , ithas minima or maxima for elastically soft or hard directions:at (111) and (100), respectively, if C44 < (CIl - Cn)/2, andat (100) and (111), respectively, if C44 > (CIl - Cn)/2.
For an elastically isotropic system with constant elasticcoefficients only the first term survives. This leads to theabsence of elastic interaction between centres of dilatationalstrain, a result that was first derived by Crum.8,11 However,elastic coefficients that are functions of E(i) (through the com-position by equation (5)) lead to an interaction betweencentres of strain. In the diffusion equation these survive onlyas non-linear terms.
As a result of the hydrostatic component, coherency strainsin cubic crystals have both a local and a long-range influenceon diffusion (equations (22) and (23)). In an elastically iso-tropic crystal there is no long-range component and the diffu-sional flux at i depends only on E(i) or [c(i) - co].
... (21)
OCJ I
-.:f. " )' (- i)l Cl Ylm j'fJV2C(i - r')
27t L~ r'1=1 m~-l
'fiF of' oK --- = - - 2KV2c - - (ve)2 +2 Y'l2(c(r) - cc)'fie oc oe
Introducing the variational derivative, performing theindicated differentiation and ignoring non-linear terms, weobtain
_ 02f'-J = M~ve-2MKv3e
+21)2 III(-iP)AYeXP(-iP.i)d3P ... (17)
andoe 02f'Of = M oe2 v2e - 2MKv4e
+ 21)2 I II (- iP)2A Yexp (- ip.i) d3p ... (18)
Several interesting effects result from the discarded non-linear terms. Of these, the effects of composition or strain onthe diffusion coefficienpo and elastic coefficients3 have beendiscussed elsewhere.
These equations can be solved readily by a Fourier trans-form of the compositional terms. Inserting equation (11) into(18) we obtain
0.;; = - p2M [;2~' + 21)2Y(P) + 2KP2J A ... (19)
and upon integration
A(P,t) = A(P,0) exp ( - p2M [o;~'+21)2Y(P)+2KP2J t)
... (20)
where A(P,t) and A(P,O) are, respectively, the Fourier trans-form of the composition at time t and at time O. Equation(20) is the solution to the diffusion equation (18) as it appearsin the theory of spinodal decomposition. The quantity inthe brackets in the exponent is an orientation-dependent dif-fusional amplification factor. The anisotropic term dependson the square of the wave number, just as if it originated inD(l) of equation (3). D(l) is, however, isotropic and inequations (17) and (18) the anisotropic term appears as aFourier transform. Let us now perform the indicated trans-formation of the anisotropic elastic term in equations (13),(14), (17), and (18) and express these equations entirely in e(or E) and its derivatives. The method of performing thistransformation is shown in the Appendix. The results are
The variational derivative of F, the derivative of free energywith respect to a change in e at i, is
'fiF = of' _ 2KV2e _ oK (Ve)2+ 2'IJ2JffA Yexp( -ip.i)d3P'fie oe oe
... (13)
The hydrostatic portion of the stress fieldp(i) can similarly beexpressed as a variational derivative of F el with respect toE(i)
p(i) = 'fi::1 = 2 I I I E(P) Y(P) exp (- ip.i) d3p ... (14)
The interdiffusional flux may be written
- J = MV ~~ ... (15)
where M is a tensor of rank two defined phenomenologicallyby this equation. By taking the divergence
- oe 'fiF- V·J = Of = V·MV 'fic •.• (16)

4 Session I: Spinodal Decomposition
o
f\I •
\
' (010 I
(IC~c::·~
spherical and small compared to their neighbours. Then themain contribution to the last term of equation (25) comesfrom the neighbouring particles. The" volume free energy"( ..••F,.) is large for a particle nucleating nearby and in a softdirection to a similar particle. Consider sueh a small [~particle in an 'X matrix with radius R at f. Setting ...•F,· =- 2a R
where c'i; and c ~ are mole fractions of 'X and ;5 in stress-freeequilibrium and c,,(f) is the concentration in 'X at equilibriumwith the coherent :~ particle at f, we obtain approximately
In[C,,(f)I('(~J = INvkT{c~
12a
C!;J (If
332;:
JJJ ~\_~E_,(_f__ f'_) ( ~(i")__ Y_)d_:l_f' ... (26)
Fit!. 3 A pial of Iile (001) plalte ,ilOIl"iltg ('011I0111',1o/eqllol pmili •.!!rallle,1 of (l'" Y,,) 1" la illllllrale Iile ,{)(Ilial depeltdeltce orIile oltisolropic elallic iltll!/'{/('Iiolt,
The main effect of elastic anisoiropy is in the convolutionII1tegrals. The diffusional f1UAat f nOlI depends not onl) onthe presence of nearby causes of strain but on their orientationand distance relative to f, Th s anisotropic efl'ect gives rise tothe direetionality in spinodal decomposition,! Jt is also thet::ffect that gives rise to direc:tionality in precipitation andripening.~,:l To see this most clearly, consider that the freeenergy of a particle at f contains an elastic term that depend.on a product of E(f) and p{f). The isotropic portion of thelatter is independent of the presence of other particles and isthe same for all particles, but the anisotropic portion shov.sthat a particle has preference for other particles (v. ith similarstrain) that are nearby and in soft directions. This anisotropicportion will lead to differences in '. volume free energy"among particles
The last term in equation (25) covers all space and includesinteractions among different parts of the same particle. B)equation (25) the lowest .• volume free energy" is a plate-likeparticle lying in a soft plane. A raft of separated particles onthe same plane would have a ~imilar lOll elastic energy.
If we now consider also the specific free energy (J of co-herent interfaces, we should find that equilibrium particles arenot spherical and that their equilibrium is affected by neigh-bouring particles. The quantlty " has no contribution fromthe coherency strains which behave as a .. I olume free energy".Onl small particles can be fully coherent. unless these strainsare zero, and G must be determined from measurements onmall particles.
An approximate estimate of the effect of neighbouringparticles on the nueleation rate and olubility of small particlescan be made by assuming that the nucleating particles are
AcknowledgementsThe author has benefited throughout this study from stimu-
lating discussions Ilith Kenneth C. Russell and Keith \-I.Johnson, and is especially grateful to the latter for valuableadvice about the methods used in the Appendix. \-le alsowishes to thank the National Science Foundation for a grantunder which the v.ork was performed.
\Ihere E, is the stress-free strain of forming a :~ particle.The first term is the usual Gibbs Thomson efl'ecL The re-maining tllO are modifications required by the elastic energ):the) lead to 10ller solubilities (and hence increased stabilit~)for small particles in the eiastil:ally favoured positions.
Sinl:e, at large distances, the number of particles in a rangedr varies as r~, the convergence of the convolution integraldepends on a random angular distribution of E{f) or le (f)('0] at large distances. In cohercnt precipitation, this IS auto-maticall~ satisfied if lie start Ilith a large homogeneouscrystal.
Obtaining the solution of the diffusion equation presents nogreat diflkulty in spinodal dewmposition. A Fourier lran~-form of equation (23) leads dircl:tl) to equation (19). Formany purposes this equation is the useful solution. X-ra~din'raction experiments lead directly to the Fourier transformof the composition and permit a dircct verification of equation(19).1~ Several approximate methods exist to perform theinverse transformation of equation (20) and obtain thecomposition as a function of time. In spinodal decompositionthe simplest is to assume that by selective amplification thefastest-growing Fourier I:omponents dominate. The resultingpredil:lion is a structurc composed of a sum of only a fellFourier components.1 ,1:1 The typical tweed structure of (100)waves (or (Ill) wave, depending on elastic anisotropy alone)is the predicted result in anisotropic cubic crystals unlessr, = O.
The role of elastic anisotropy on coarsening kinctics ha~been qualitatively outlined through their influence on bothcritical radii and diffusion. Whether a simple modificationof the existing theories of coarscning can incorporate theseeffects, or Ilhether a Fourier method is required,lo remainsto be seen.
... (25)IfJ
\ F \ /., y-" (-) 3 (-..l V =..l ' E- r - 32;: ,: r)

Cahn: Coherency Stress in Elastically Anisotropic Crystals 5
where
... (A2)
Cl = 1 . 3 . 5 (l - 1)2·4'6 1
Making use of the orthogonality relations among the Ylm we obtain
g-1(Y/1l2) = fJf(Y/Jl2) exp (- ip.r)d3p
References
f f f (- i p)n A Yexp (- i P . r) d3 P
- 3 IfJ (Y (r') - Y) V2H c (r - i") d3 r'= Y Vn c (r) - 32n r I
... (A9)and the anisotropy in equations (A8) and (21)-(24) parallels that ofthe deviation of Y from it spherical average Y.
For the isotropic case, Y is a constant r and only this first termsurvives. In this situation, Y could have been taken out of theintegral in equation (AI) giving the same first term directly. Equa-tion (A8) can be combined with (16), (I7), and (18) to give equations(21), (22), and (23). Using equation (A6) the hydrostatic componentof the stress given by equation (14) can be found and is given byequation (24). Because of cubic symmetry the only non-zero Ylmin these equations are (0,0), (4,0), (4,4), (6,0), (6,4), (8,0), &c. Analternate expansion in terms of Kubic harmonics15 composed onlyof combinations of the allowed Ylm would lead to the same result .
An approximate evaluation of equation (A8) can be made byrecognizing that the essential features of the anisotropy of Y(~), themaxima and minima at (100) and (111), are described by the•• I = 4 "harmonics. Assuming that we have only the" I = 0"and" I = 4" terms, we may combine equations (A3) and (A8) toobtain approximately
I. J. W. Cahn, Acta Met., 1962,10,179 .2. V. A. Phillips, ibid., 1966, 14, 1533.3. A. J. Ardell, R. B. Nicholson, and J. D. Eshelby, ibid., p. 1295.4. J. F. Nye, ••Physical Properties of Crystals ", p. 20. 1957:
Oxford (Clarendon Press).5. J. W. Cahn, Acta Met., 1961, 9, 795.6. J. W. Cahn and J. E. HilIiard, J. Chem. Physics, 1958,28,258.7. J. W. Cahn, Acta Met., 1962,10,907; 1966, 14, 83.8. J. W. Christian, ••The Theory of Transformations in Metals
and Alloys ", p. 188.1965: Oxford (Pergamon Press).9. A. G. Khachaturyan, Soviet Physics-Crystallography, 1965,
10,248.10. J. W. Cahn, Acta Met., 1966, 14, 1685.11. F. R. N. Nabarro, Proc. Ray. Soc., 1940, [A,] 175, 519.12. K. B. Rundman and J. E. HilIiard, Acta Met., 1967,15, 1025.13. J. W. Cahn, J. Chem. Physics, 1965,42,93.14. G. Goertzel and N. Tralli, ••Some Mathematical Methods of
Physics ", p. 160. 1960: New York and London (McGraw-Hill) .
15. A. A. Maradudin, E. W. Montroll, and G. H. Weis, ••SolidState Physics ", Suppl. 3, (edited by F. Seitz and D. Turnbull)p. 97.1963: New York (Academic Press).
is the spherical average value of Y(P). When this is substituted intoequation (AI) the first term in the expansion is readily integrated bymeans of Green's Theorem to give
f f f (- i p)n A Yexp ( - ip.r) d3pOCJ 1
yvnc(r) - 4~.L.L(-i)l elYlmI~I m~-I
If! v2+n C (r - r') Yr,lm(9', <p')d3 r'--------- .,. (A8)
... (A7)
... (A5)
... (A3)
OCJ OCJf jl (Br) dB = I~I Jjl-2 (Br) dl3
o 0= 1tCI/2r
OCJ
= 21t2/r [Y + .L.L (-i)l elYlm Ylm]1=1 m~-I
where ... (A6)21t 1t
Y = ;1t f f Y (P) sin 0" dO"d<p"o 0
where
and for I even
21t 1t
Yl'm'= f J Y(P)Y:~m'(e",<p")sinO"dO"d<p" ... (A4)o 0
The integrals of the Bessel function areOCJf jo (Br) d ~ = 1t/2r
o
ApPENDIXA transformation of a product of two terms is the convolution of
the transforms of the individual factors. The transform of Y /~2 isreadily evaluated, while the transform of Y itself presented somedifficulty except for the isotropic case where Y is a constant.Because of this, the factors in equations (13), (17), and (18) shouldbe regrouped as follows:
f f f [( - dj)2+n A(P)] [Y/IF] exp (- i p.r) d311
= (2~r V2+nc(r)* d-J -1 (Y/IP) ... (AI)
To evaluate this transform, we expand exp (i p.r) and Y(ll) in termsof normalized spherical harmonics Ylm an_d a spherical Besselfunction k Let the spherical coordinates of II and r be (B, 0", <p")and (r, e, <p).Then14
OCJ 1
exp (- i p.r) = 41t )' )' (- i)l jl(~r) Yl:' (0", <p") Ylm (0, <p)~~I~O m~-I

Spinodal Decomposition: Observations in theIsotropic, Non-Crystalline Na20-Si02 System
lll. Tomozawa, H. Herlnan, and R. K . .llacCrone
\\here <'0 is the average composition. and p is the \\,ne num-bcr. a \ector in reciprocal space (IPI = 2:-: I.). ·Up. I) is theFourier amplitudc of the expansion of the \ar\ In!; concen-tration. formall) gi\cn by:
\\here the integral is o\cr the volume of the ,peClmen. Inthis theoretical development. onl) those Fouricr amplitudes(\\hich describe the composition inhomogeneitic, of thcspecimen) \\ ithin a range of \\a\clcngths increase in magni-rude \\ith time during decomposition b) a spinodal mode:outside this range. the amplitudes of the other Fouriercomponents deGI). The \\ a\ elength of the Fourier componentthat gro\\s at the ma\imLlm rate is determincd b) variousparameters of the system, and it is this spacing that. ideally,\\ ill ultimatel) predominate and that \\ ill charaCleri7e thedecomposit ion morphology of the system.
on this observation should therefore be treated \\ ith caution.1n addition, in crystalline systems there is normall), a dcpcn-dence of specific volume on concentration. As phasc separa·tion by a spinodal mode proceeds. strain energy \\ ill contributeto the total free energy and this will introducc cr)stallographicdirectionality. resulting in the modulated structure ~o charac-teristic of this process. However, this morphology againcannot bc unequivocally attributcd to spinodal decomposition.since an interaction elastic-strain cnergy. associated \\ ithparticles formed due to nucleation and gro\\ th. can alsolead to a periodic array." The question of strain encrgy docsnot arise in glass and need not be considercd here.
Thus in this work \\e examine the kinctics of pha,c decom-position, and not the resulting morphology. We ha\e studiedthe kinetics by cxamining the development of small-angleX-ray spectra during the carly stage of decomposition. It \\ illbe sho\~n that this changc in X-ray spectra is intimatelyrclatcd to the development of compositional fluctuations inthe specimen.
In Cahn's:l formulation for a two-componcnt fluid system.the concentration (atomic fraction). c. of solute at a positionvcctor. r. is \\ rittcn as a function of time as a Fourier integral:
..• (2)co] e\p [ - ip.r] dr.-Up. I) = r[dr. I). ,
dr. I)
The unmixing or phase separation in the unstable rangeof various Na20 Si02 glass systems has been investi-gated using small-angle X-ray scattering. By followingthe time development of the Fourier amplitudes of thecomposition fluctuations as unmixing occurs, phaseseparation by the spinodal mode has been identified.The behaviour of specimcns with significant phaseseparation is in agreement with theory. At the initialstage of unmixing, quantitative agreement with certainaspects of the theory is obtained, but the inherentexperimental difficulties preclude detailed correlationat this time. The diffusion coefficient obtained from theX-ray observation of the phase separation indicatesthat anion motion is the rate-controlling processduring decomposition.
:vIanuscript reeei\cd 27 Fcbruan 1~6,. :\.1. fOmOI<I\\a. B.S .. andH. Hcrmall. B.S .. :vI.S.. Ph. D .. arc In the Laboraton for Rescarch on theStructure of Matter. School or I\ktallllr~\ anJ ~laterials Science.Univcrsit) of Penn~)l\ania. Philadelphia. lr<;.A .. \\here the \\ork \\ascarried oul. R. K. MaeCrone. M.Sc .. D.Phil .. is 110\\ 111the Di\ision of\Iate..:rial~ En{!inc..:nn~. Rcn~sda..:r Poh techniC Instilull:. Tro\. :"Jc'\York. ., . .
A gap in miscibility can occur in certain glass systems. Whenthe initially homogeneous glass solution is cooled from thesingle-phase region to within the gap. unmi\ing is favoured,and t\\O vitreous. conjugate phascs can form. The ncwvitreous-product phases arc of course metastable. but theypcrsist by reason of the difficulty in achieving devilrificarion.
A supersaturated glass \\ ill phase separate ideally in oneof three distinct \\ays:
tl) Dcvitrification (nucleation and development of acrystallized phasc).
(2) Nucleation and growth fa sccond glass phase.(3) Spinodal decomposition.
Devitrification will be cxcluded from considcration in thistud) : indeed, it is rather difficult to crystallize glass by simple
heal-treatmcnt. Thus wc wish to distinguish bctween a pro-cess of nucleation and growth. and spinodal decomposition.
With regard to spinodal decomposition. it has been commonin the past to employ the prediction of spatial connectivitybetween the two conjugate-product phases a, evidcnce for theoperation of this mode.' But connecti" ity of precipitates canalso occur \\hen only nucleation and gro\\lh is operating:connectivity devclops from simple topological considerations\\'hene\er thc volume fractions f the t\\O phascs arc compar-able. The assertion of spinodal decomposition based solely
6

7
20
'" PORAI-KOSHITS(1963)
• HAMMEL (1965)
10
.•....-;7·~4/I~·~'-.,. \ ~
,/ / \\\' \ '"I, \ .•.
: '\ r, , "'\: \ ..I , \
\ .\ \
800
600
werF? 700<terwCL::Ew>-
MOL.- % N020
Fig. 1 Metastable miscibility gap in the Na20-Si02 vitreoussystem. ",6 Spinodal calculated by the method of Cook andHilliard.'
i.e., R(I3) may be obtained as 1/2 the slope of a plotted vs.time and a is simply the natural logarithm of the normalizedX-ray intensity at a given angle.
In the present research, the two-component glass NazO-SiOz is considered to be elastically isotropic. It is known thatthis system shows complete miscibility at high temperatures,but has a miscibility gap at low temperatures5,6 (Fig. 1). Arange of compositions annealed over a range of temperatureswas examined. The breakdown of the initial solution wasexamined using the technique of small-angle X-ray scatteringafter the glass had been brought to within the miscibility gap.The X-ray spectra are evaluated after the method of Rundmanand Hilliard,4 and hence it is determined that spinodaldecomposition is operating. An interdiffusion coefficient isobtained from the data, and this value agrees well with litera-ture values of the oxygen self-diffusion coefficient in silica-glass systems.
· .. (5)
· .. (6)
· .. (3)
· .. (4)
A(I3, t) = A(I3, 0) exp [R(I3) t]
F(s, t) = fP(r, t) exp [ - 2rr is.r] dr
(- DNv)! (- DNv)t11 = 11 = --- . R(I3) = 0 at 13= I3c = --p pmax. 4 Mx 2Mx
being thereafter negative at values of 13> I3c.Thus, those Fourier amplitudes describing the composition
will increase for 0 < 13< I3c, the Fourier amplitude corres-ponding to I3max. growing at the fastest rate, while thoseFourier amplitudes with 13> I3cwill decrease with time.
X-rays are scattered by fluctuations in electron density,and thus can be used to examine variations in composition.It was recognized by Rundman and HiJliard4 that a formalcorrespondence exists between the Fourier amplitudes associ-ated with compositional fluctuations and the amplitude of theX-rays scattered to a point, s, in reciprocal space: the latteris given by the usual formula,
where R(I3) = - D132 - 2 Mx 134/Nv
where D is the interdiffusion coefficient when no strains arepresent and M the mobility given by
where Nv is the atomic density, and F is the Helmholtz freeenergy. The second derivative of F with respect to composi-tion represents the curvature of the free-energy concentrationplot at a given composition. x is the gradient-energy coefficientand is positive for systems exhibiting clustering (positive heatof mixing). The value of (a2F/ac2) is negative within thespinodal region and corresponds to a situation where thesolution is unstable to the smallest compositional fluctuation.The amplification function, equation (4), contains the essenceof spinodal decomposition. R(I3) increases from zero withincreasing 13, passes through a maximum at
Tomozawa, Herman, and MacCrone: Spinodal Decomposition in NazO-SiOz System
Cahn has shown that a particular Fourier amplitudeundergoes a development with time given by
The intensity of the scattered X-rays is then given by
and the amplification factor is thus obtained from equation (9)
per, t) = Po + (Is - fA) [c(r, t) - c(r, 0)] ... (7)
R(Il) = (1/2) In [F2 (13,t)/F2 (13,0)] r-1 = (l/2)a t-1. . . (10)
ExperimentalCalculated amounts of analytic reagent grade NaZC03 and
SiOz.nHzO were combined. ASZ03 (0'5 wt.- %) was added as arefining agent. The batch was mixed until homogeneous andthen transferred to a 50-cm3 alumina crucible and pre-sintered at 10000 C. After cooling, the sintered batch wastransferred to a fresh 50-cm3 alumina crucible, which wasinserted into a carbon susceptor. Melting was accomplishedwith a IS-kW induction furnace under an argon atmosphere.For a given composition, the maximum temperature duringmelting exceeded the solidus by at least 100 degC, the meltbeing maintained at this temperature for 1·5 h. The melt wasthen poured into a shallow carbon mould, pressed by a carbonblock, and shaped into a sample 40 x 40 x 5 mm. Thesample was immediately transferred to a furnace at a tempera-ture of 150 degC below the annealing point of the glass andthen furnace-cooled. This procedure was employed to avoidbuild-up of excessive strain which could result in cracking andalso to avoid appreciable phase separation. Spectroanalysisshowed that the impurity content was < 0·2 wt.- %. TheNazO content was determined by flame-photometry (Table I) .
· .. (9)F2 (13, t) = F2 (13,0) exp [2R(I3) t]
where s = 13/2rrand p (r, t) is the electron density at r at timet. Writing
where fA and fs are the scattering factors for the A and Bcomponents, and Po is the average electron density for thesystem, the amplitude of the scattered X-rays is, neglectingthe (000) peak
F(s, t) = (Is - fA) f[c(r, t) - c(r, 0)] exp ( - 2rr is.r)dr
= (Is - fA) A(s, t) ... (8)
8 Session I: Spinoda! Decomposition
i; 4000
25002000
~ --.- -f-
f -- ........•
....•...
1500
os quenchea
2C rr r:
40 rn n
15 28[m,,, -,Od]
I_ 5
f3)( IOQ[cm·1 '
1000
13·0 1\°20 - 86·8 $1°2, 58L 0
109.tll3,I)- 09.t IB,ol 0 2R 13 I
.......-.
..
500
JOmll''l
(; 5
10
-C::>
L0
f":;~>-
~'" OmnZw>-z
fos Quencned
,.,1:)
I COO
5000
,28 [Imdl' - 'od)]
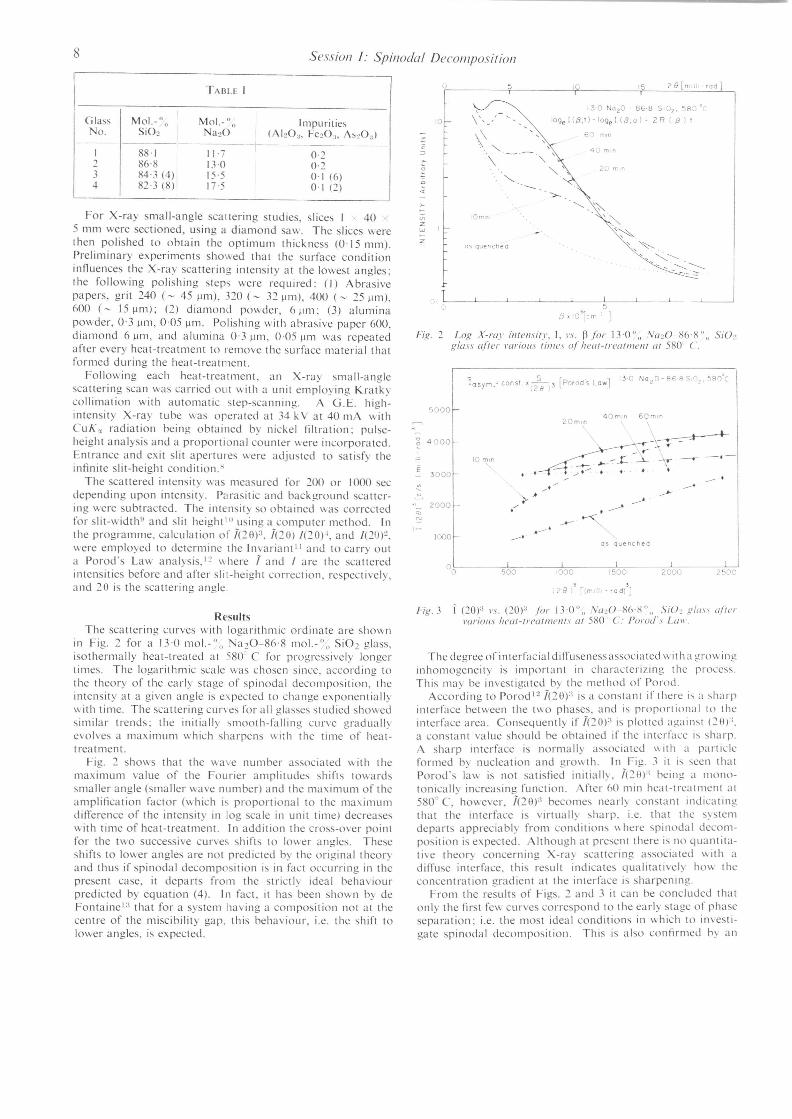
Fig. 3 i (20)" ,"S. (20)3 (or 13,0"" NlI20 86·8"" SiO" ,!!IlIlI lI/II""oriOIl,' !Jeal-II"{'(I/melll.\ III 5HO C: POJ"{)(r" LlIlI".
- S [ ] 30NO,O-86'8S,C),,58}oClosyrn.= consl ;( - 3 POfod"s Low
128 )
20mm,
The degrce of interfacia Id ifi-useness asso-:ia ted wit h a gro\\ inginhomogeneity is important in -:haraucriLing the pro-:ess.This may be investigated by the mcthod of Porod.
According to PorodI21(20)'1 is a constant if thcrc i, a sharpintcrface bct\\cen the t\\O phases, and is proportional to thcintcrface area. Consequemly if 1(29)" is plotted against (20)".a constant value should bc obtained if the interfa-:e i~ sharp.A sharp interface is normally associated \\ ith a parti-:lcformcd by nucleation and growth. In Fig. 3 it i~ seen thatPorod's law is not satisfied initiall), 1(20):' bcing a mono-tonically increasing function. After 60 min heat-treatmcnt at580" C. however. /(29)" bccomcs ncarl) -:onstant indi-:atingthat the interface is virtuall) sharp_ i.e. that the ~)stemdcparts a pprecia bly from condit ions \\ here spi noda I dc-:om-position is expected. Although at present there is no quantita-tive theory concerning X-ra) scattering associated \\ ith adin'use imerface. this result indicates qualitatively ho\\ theconccmration gradient at the intcrface is sharpening.
From the resulis of Figs. 2 and 3 it can be concludcd thatonly the first fe\\ curves -:OITcspond to the early stagc of phaseseparation: i.e. the most ideal conditions in which to investi-gate spinodal decomposition. This is also wnfirmed by an
'"N_ 2000
.: 3000
'-i/'.2 Lo!! X-ray illlellsil)', I, r.\. [3 j(Jr 13·0"" N020 86'8"" SiO~Rlos,\ afler mriolls lillles of' !teal-Irealmelll (/1 580 C.
,u
TABLE I
Glass Mol.- 0 Mol.- ° Impurities0 0
o. SiOz NazO (Ai203, Fe203, AS20,,)- - --I 88·' 11·7 0·22 86·8 13·0 0'23 84-3 (4) 15·5 0·1 (6)4 82·3 (8) 17·5 o 1 (2)
ResultsThe scattering curves with logarithmi-: ordinate are shown
in Fig. 2 for a 13·0 mol.-o" Na20-86'8 mol.-oo Si02 glass,isothermally heat-treated at 580 C for progressively longertimes. The logarjthmi-: scalc was chosen sin-:c, according tothc theory of the early stagc of spinodal decomposition, thcintcnsity at a given angle is npcued to change exponelltiall)with timc. The scattering curves for all glasses studied showedsimilar trends: the initially smooth-falling curve graduall)evolvcs a maximum which sharpens \\ ith the time of heat-treatment.
Fig. 2 shows that thc wave number associated with thcmaximum value of the Fourier amplitudes shifts towardssmallcr angle (smaller \\ave number) and the maximum of theamplification factor (which is proportional to the maximumdifference of the intensity in log scale in unit time) decrcases\\ ith time of heat-treatment. In addition the cross-over pointfor thc t\\ 0 successive curves shifts to lower anglcs_ Theseshifts to lower angles are not predi-:ted by the original theoryand thus if spinodal decomposition is in fact occurring in thcpre ent case, it departs from thc striuiy ideal behaviourpredicted by equation (4). In fact. it has been shown by deFontainel" that for a systcm having a composition not at thecentre of the miscibility gap, this behaviour, i.e. the shift tolower angles, is expected.
For X-ray small-angle scattering studies, slices I 40·5 mm were sectioned. using a diamond saw. The slices wercthen polished to obtain the optimum thickness (0,15 mm).Preliminary experiments showed that the surface conditioninfiuences the X-ray scattering intensity at the lowest angles;the following polishing sicps wcre required: (J) Abrasivepapers, grit 240 (~ 45 pm), 320 (~ 32 pm). 400 (~ 25 pm),600 (~ 15 pm); (2) diamond powder, 6 pm; 0) aluminapowder, 0·3 pm, 0'05 pm. Polishing with abrasive paper 600,diamond 6 pm, and alumina 0'3 pm, 0·05 pm was repeaiedaftcr every heat-treatment to remove the surface material thatformed during the heat-treatment.
Following each heat-treatmcnt, an X-ray small-anglescattering scan was carried out \\ ilh a unit employing Kratky-:ollimation with automatic step-scanning. A G.E. high-intensity X-ray tube was operated at 34 kV at 40 mA \\ ithCuK", radiation being obtained by nickel filtration: pulse-height analysis and a proportional-:ounter \\ere incorporated_Entrance and exit slit apertures wc re adjusted to satisfy theinfinite slit-height condition.'
The scattered intensity was mcasured for 200 or 1000 secdepending upon intensity. Parasitic and background scatter-ing wcre subtracted. The intensity so obtained \\as correctedfor slit-width!' and slit height III using a computer method. Inthe programme. calculation of 1(29)",1(29) /(29)1, and /(20)2.were employed to determine the Invariallt 11and to carry outa Porod's La\\ analysis.12 \\hcre 1 and / are the scatteredintcnsitics before and after slit-height correction, respectively,and 29 is the scallering angle
Tomozawa, Herman, and MacCrone: Spinodal Decomposition in NazO-SiOz System 9
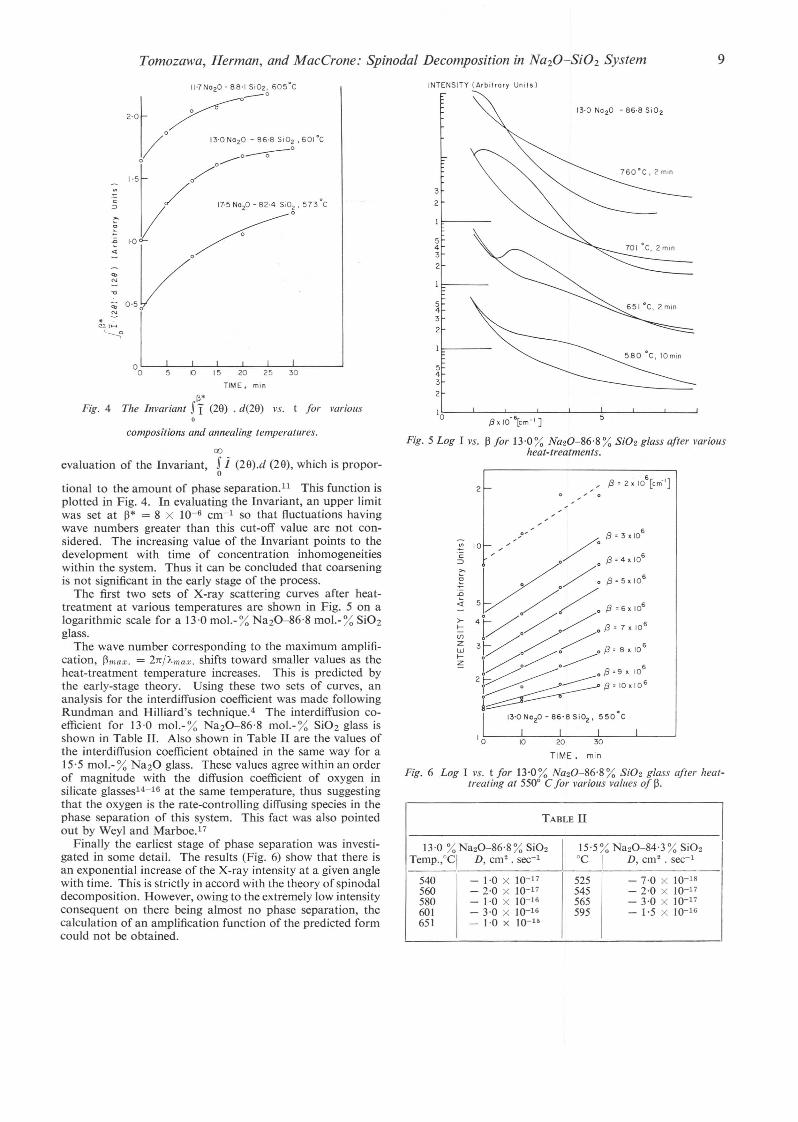
""Fig. 4 The Invariant SI (29) . d(29) vs. t for variouso
compositions and annealing temperatures.5
13·0 No20 - 86·8 Si02
543
2
3
2
INTENSITY (Arbitrory Units)
TABLEn I13·0 % Na20-86·8 % Si02
IJ5'5% Na20-84'3% Si02
Temp.,QCI D, cm2 • sec-1 QC I D, cm2 • sec-1
540 -1'0 x 10-17 525 -7'0 x 10-18560 - 2·0 x 10-17 545 - 2·0 x 10-17580 - J·O x 10-16 565 - 3·0 x 10-17601 - 3·0 x 10-16 595 - J·5 x 10-1665J - J·O X 10-15
{3 x 10⁻⁶[cm-' ]
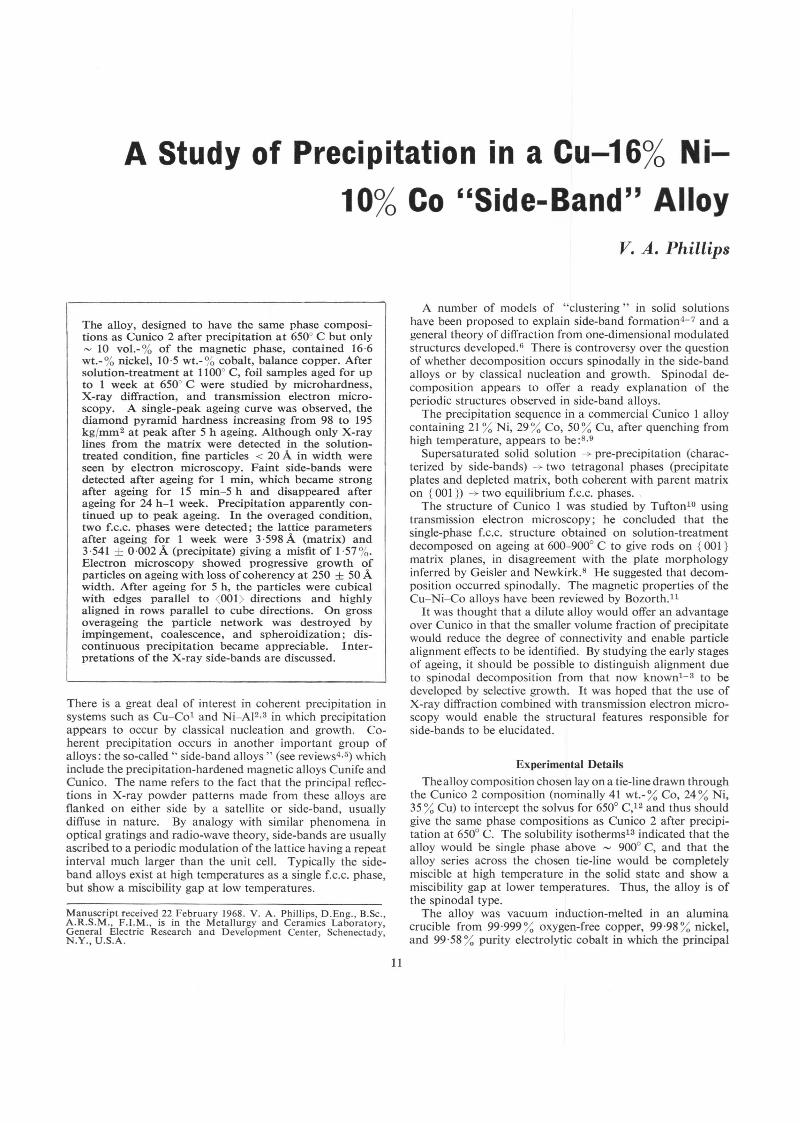
Fig. 5 Log I vs. B for 13'0% Na20-86·8 % Si02 glass after variousheat-treatments.
2, 0
TIME. min
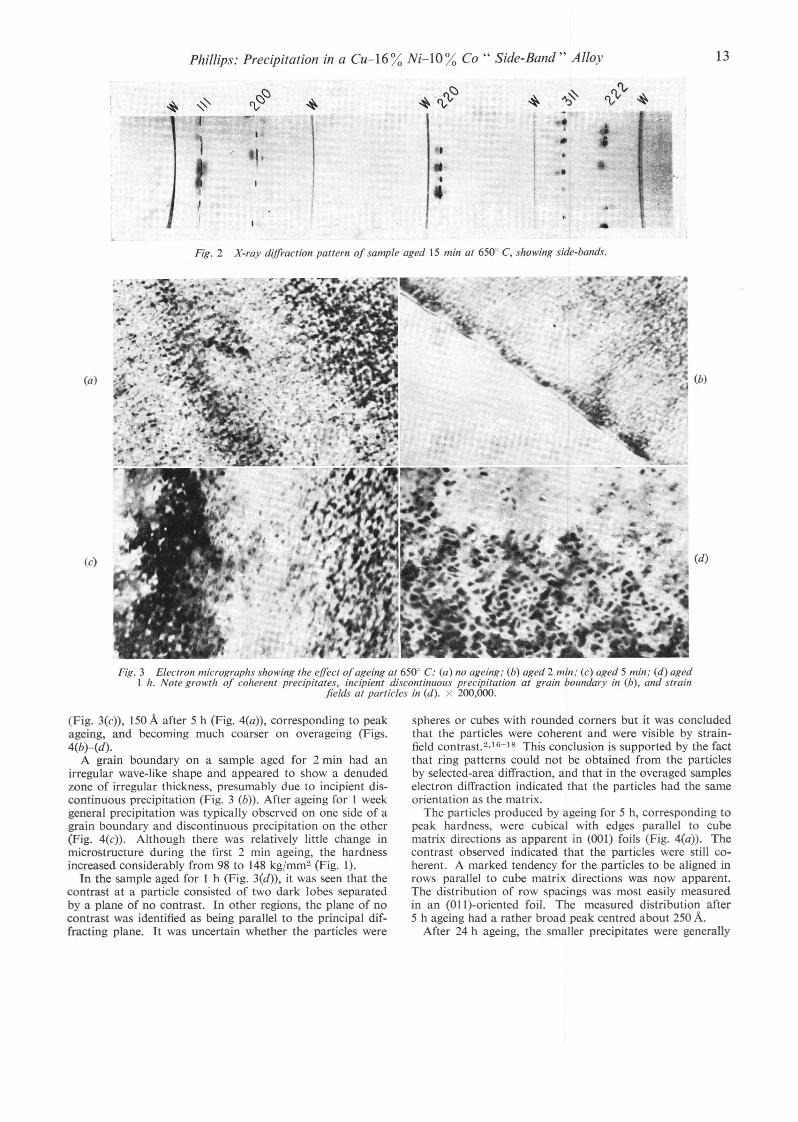
Fig. 6 Log I vs. t for 13·0 % Na20-86·8 % Si02 glass after heat-treating at 550Q C for various values of B.
o 15 20 25 30
TIME. mln
5
00
evaluation of the Invariant, S j (29).d (29), which is propor-o
tional to the amount of phase separation.l1 This function isplotted in Fig. 4. In evaluating the Invariant, an upper limitwas set at B* = 8 X 10⁻⁶ cm-1 so that fluctuations havingwave numbers greater than this cut-off value are not con-sidered. The increasing value of the Invariant points to thedevelopment with time of concentration inhomogeneitieswithin the system. Thus it can be concluded that coarseningis not significant in the early stage of the process.
The first two sets of X-ray scattering curves after heat-treatment at various temperatures are shown in Fig. 5 on alogarithmic scale for a 13·0 mol.-% NazO-86'8 mol.-% SiOzglass.
The wave number corresponding to the maximum amplifi-cation, Bmax. = 2rt/Amax. shifts toward smaller values as theheat-treatment temperature increases. This is predicted bythe early-stage theory. Using these two sets of curves, ananalysis for the interdiffusion coefficient was made followingRundman and Hilliard's technique.4 The interdiffusion co-efficient for 13'0 mol.- % NazO-86·8 mol.- % SiOz glass isshown in Table n. Also shown in Table n are the values ofthe interdiffusion coefficient obtained in the same way for a15·5 mol.- % NazO glass. These values agree within an orderof magnitude with the diffusion coefficient of oxygen insilicate glasses14-16 at the same temperature, thus suggestingthat the oxygen is the rate-controlling diffusing species in thephase separation of this system. This fact was also pointedout by Weyl and Marboe,17
Finally the earliest stage of phase separation was investi-gated in some detail. The results (Fig. 6) show that there isan exponential increase of the X-ray intensity at a given anglewith time. This is strictly in accord with the theory of spinodaldecomposition. However, owing to the extremely low intensityconsequent on there being almost no phase separation, thecalculation of an amplification function of the predicted formcould not be obtained.

10 Session I: Spinodal Decomposition
DiscussionThe lo\\-angle X-ray scattering spectrum as sho\\ n in Fig. 2
does qualitatively satisfy the requirements stipulated for asystem decomposing spinodall) : there is preferelllial develop-melll in X-ray intensity at wavelengths nal"l"O\\ Iy clusteredaround a given i. = i.ma.r. so that composition fluctuations ofthese \\avelengths must increase preferentially. In addition.owing to the initial presencc of quenched inhomogeneities.there is a decay of the Fourier amplitudes for values of 13greater than the critical valuc, l3e. as expected from lhe theor).It is obvious from Fig. 2 that the value of 13 \\ hich correspondsto the maximum rate of gro\\ th is associated \\ ith A::: 300 A.
From the treatment of Rundman and Hilliard,~ it would beexpected that equation (4) should be satisned and that a plotof R(I3) vs. 13 should )ield not only I3mru .. but also 13,·. Ho\\ever.an examination of the scattering curves of Fig. 2 sho\\s thatthe crossover point \\ hich corresponds to 13,. is shifting as afunction of time. This deviation from what might be thoughtto be .. ideal behaviour" has been discussed extensively byde Fontaine, J:l \\ ho shows theoretically t hat there shouldindeed be a shift of the maximum \\ ith time. and an attendantdisplacement of the crossover point. \\ hen the composition ofsolution is not at the centre of the miscibility gap. Fig. Isho\\s that this corresponds to the present case.
The Porod-Iaw analysis al,o points to the operation of Clspinodal mode since the slopc of the plot of i(28)'l plotted vs.(28)'1 (Fig. 3) dccreases \\ ith time to zero, indicating a sharpen-ing of an initiall) din-use int~rface. The Invariant function(Fi!L 4) indicates that the solution is becoming depleted \\ Ithtim~, pointing to the fact that coarsening. at least at earl)times. is not an important pan of the processes being observedherc.
Thc X-ray-scattering Fourier amplitudes of a sample \\ ith a\er) small amount of phase separation indicate that 1nl \s. I
is linear (Fig. 6). This is strong e\ idence for spinodal de-composition. However. there is some deviation from linearit)at larger values of a. and, in ,lddition. the I 2 slope does notclearly decrease as expected from theory. This \\e attribute toexperimelllal limitations \\ hen there is small phase separallonin the sample. The inherent inaccuracies in the measurementsof the X-ray illlensit) changes are expected to be most seriousat this earl) stage. In additi<.'n these inaccuracies arc magnl-ned by the slit-height correction, \\hich is most inaccurate atsmall angles. (Notice that we do not expect to sce negativevalues o(R( 13) since the Fourin amplitudes of a \\ell-quenchedsample at large \alues of 13 are essentiall) zero.) Unfortun-atel). 0\\ ing to experimelllal limitations. \\C \\ere unable todemonst ra te t he maximum in R( /3) in a Imost homogeneousspecimens as predicted in the theory.
ConclusionsIn this work it has been demonstrated that: (I) the X-ray
spectra arc changing in a \\ay that indicates the selecti\edevelopment of composition fluctuations \\ithin a narro\\range of wavelengths: (2) the interface is bccoming less difl-usewith time: and (3) coarsening is not an important feature ofthe process, at least in the early stage.
On a more quantitative level. the valuc of the difl'usivit).as determined from the data of Fig. 5. is of the right order ofmal!nitude-that of OX\ gen in soda-lime-silica glass, Dataare lack ing for difTusion'o-f oxygen in the glass undcr considera-tion here.-but it is clear that din'usion of thc anion is thc rate-controlling step in the process of phasc ,;eparation underconsideration.
The gradient energy coefficient. z. \\ as not dctermincdbecause of lack of sufficient thermodynamic data.
Acknowledgement
This research \\as supported b) the Ad\anccd RcsearchProjects Agenc) of the United Stales Department of Dcfcnse.
ReferencesI. J. W. Cahn and R. J. Charle,. J. Plty.\. CIt(,III. Glm."", 1965,6. III I.2. A. J. Ardell, R. B. icholson, and J. D. Eshclb~, .J('{(J \{el..
1966.14.1295.3. J. W. Cahn,./. Cltelll. PItYlics: 1965. ·n. 93. ( ~_4. K. B. Rundman and J. 1-. Hillrard, Ao{/ .'fl'I., t967. 15, 10_).5. N. S. Andree\. D. A. Gogarov, 1.:..A. Poral-Ko,hJl,. and Yu. G.
Sokolov, "SI ructurc or G la,s", Vol. 3. p. 47. 1964: Nc\\ York(Colbuitanls Bureau).
6. J. J. Hammcl. private communication. ,7.1-1. E. Cook and .I. F. Hilliard. Tralll. \(l'1. So(' . .'1./. \t.f...
1965,233.142. .I'. O. Kralb. G. Porod. al1l1 Z. Skala. An{/ PIli I. A/I\lI'/(/('{/,
1960,13,76. .' .9, Ref. 8, modified b) A. BicnensIOck. pnvatc communication.
10. P. W. Schmidl. A('w Crl'.ll.. 1965, 19, 93l-i. . ,11. A. Guinicr and G. Fournct. .. Small-Angk Scallcnng of ,-
Ra\s". 1955: Ne\\ York and London (John Wilc)). _12. A. Gllinier, .. X-Ra~ Difl'raction", 1963: San FranCISco (I--rcc-
man).13. D. de Fontainc. Ph.D. The,ls 101Ih\\e,tcrn UllJ\ .. 1967,14 T B Kin~ and P. J. Koros.''' KIIlCllC' 01 IIlgh-Tcmpcrature
. 'Pr~ccsscs", p. 30. 1959: Nc\\ York and London (John
Wiley). 'I C'! - 190015. W. D. K ingcr~ and J. A. Lecron. J. PIt.n. C 1('1/1. (/.\WI. .
1.87. £1 - 11116. W. C. Hagel and J. D. MackenLlc, ihi<! .. 19", ..=:>. -.' •.17. W. A. We,1 and E. C. Marboc, .. The COn,IJlUlIOn 01 Gla"c, .
\'01. 11.' Pt. I, p. 712. 1964: "C\\ York and London (JohnWilc~ ).
A Study of Precipitation in a Cu-16% Ni-10% Co "Side-Band" Alloy
v. A. Phillips
The alloy, designed to have the same phase composi-tions as Cunico 2 after precipitation at 6500 C but only~ 10 vol.-% of the magnetic phase, contained 16·6wt.-% nickel, 10·5 wt.-% cobalt, balance copper. Aftersolution-treatment at 11000 C, foil samples aged for upto 1 week at 6500 C were studied by microhardness,X-ray diffraction, and transmission electron micro-scopy. A single-peak ageing curve was observed, thediamond pyramid hardness increasing from 98 to 195kg/mm2 at peak after 5 h ageing. Although only X-raylines from the matrix were detected in the solution-treated condition, fine particles < 20 A in width wereseen by electron microscopy. Faint side-bands weredetected after ageing for 1 min, which became strongafter ageing for 15 min-5 h and disappeared afterageing for 24 h-l week. Precipitation apparently con-tinued up to peak ageing. In the overaged condition,two f.c.c. phases were detected; the lattice parametersafter ageing for 1 week were 3 ·598 A (matrix) and3 ·541 ± 0·002 A (precipitate) giving a misfit of 1·57 %.Electron microscopy showed progressive growth ofparticles on ageing with loss of coherency at 250 ± 50 Awidth. After ageing for 5 h, the particles were cubicalwith edges parallel to <001> directions and highlyaligned in rows parallel to cube directions. On grossoverageing the particle network was destroyed byimpingement, coalescence, and spheroidization; dis-continuous precipitation became appreciable. Inter-pretations of the X-ray side-bands are discussed.
There is a great deal of interest in coherent precipitation insystems such as Cu-C01 and Ni-AI2,3 in which precipitationappears to occur by classical nucleation and growth. Co-herent precipitation occurs in another important group ofalloys: the so-called" side-band alloys" (see reviews4,5) whichinclude the precipitation-hardened magnetic alloys Cunife andCunico. The name refers to the fact that the principal reflec-tions in X-ray powder patterns made from these alloys areflanked on either side by a satellite or side-band, usuallydiffuse in nature. By analogy with similar phenomena inoptical gratings and radio-wave theory, side-bands are usuallyascribed to a periodic modulation of the lattice having a repeatinterval much larger than the unit cell. Typically the side-band alloys exist at high temperatures as a single f.c.c. phase,but show a miscibility gap at low temperatures.
Manuscript received 22 February 1968. V. A. Phillips, D.Eng., B.Sc.,A.R.S.M., F.I.M., is in the Metallurgy and Ceramics Laboratory,General Electric Research and Development Center, Schenectady,N.Y., U.S.A.
11
A number of models of "clustering" in solid solutionshave been proposed to explain side-band formation4-7 and ageneral theory of diffraction from one-dimensional modulatedstructures developed.6 There is controversy over the questionof whether decomposition occurs spinodally in the side-bandalloys or by classical nucleation and growth. Spinodal de-composition appears to offer a ready explanation of theperiodic structures observed in side-band alloys.
The precipitation sequence in a commercial Cunico 1 alloycontaining 21 % Ni, 29% Co, 50% Cu, after quenching fromhigh temperature, appears to be:8,9
Supersaturated solid solution -+ pre-precipitation (charac-terized by side-bands) -+ two tetragonal phases (precipitateplates and depleted matrix, both coherent with parent matrixon {001}) -+ two equilibrium f.c.c. phases. ,
The structure of Cunico 1 was studied by Tufton10 usingtransmission electron microscopy; he concluded that thesingle-phase f.c.c. structure obtained on solution-treatmentdecomposed on ageing at 600-9000 C to give rods on {001}matrix planes, in disagreement with the plate morphologyinferred by Geisler and Newkirk.8 He suggested that decom-position occurred spinodally. The magnetic properties of theCu-Ni-Co alloys have been reviewed by Bozorth.ll
It was thought that a dilute alloy would offer an advantageover Cunico in that the smaller volume fraction of precipitatewould reduce the degree of connectivity and enable particlealignment effects to be identified. By studying the early stagesof ageing, it should be possible to distinguish alignment dueto spinodal decomposition from that now knownl-3 to bedeveloped by selective growth. It was hoped that the use ofX-ray diffraction combined with transmission electron micro-scopy would enable the structural features responsible forside-bands to be elucidated.
Experimental DetailsThe alloy composition chosen lay on a tie-line drawn through
the Cunico 2 composition (nominally 41 wt.- % Co, 24 % Ni,35 % Cu) to intercept the solvus for 6500 C,12 and thus shouldgive the same phase compositions as Cunico 2 after precipi-tation at 6500 C. The solubility isotherms13 indicated that thealloy would be single phase above ~ 9000 C, and that thealloy series across the chosen tie-line would be completelymiscible at high temperature in the solid state and show amiscibility gap at lower temperatures. Thus, the alloy is ofthe spinodal type.
The alloy was vacuum induction-melted in an aluminacrucible from 99·999 % oxygen-free copper, 99·98 % nickel,and 99·58 % purity electrolytic cobalt in which the principal

12 Sessioll I: Spinodal Decompositionimpurity was 0'39~0 nickel. It was solidified and remeltedseveral times to remove gas, then cast into a graphite mouldin vacuum giving a I ·2-in.-sq. ingot. Chemical analysis showed16·6 wt._o
o (17'6 at.-Oo) nickel and 10·5 wt._o
o (11" at._O~)cobalt. The ingot was homogenized for 48 hat 1050 C inargon, cooling in a cooling chamber. A ~-in. slice was coldrolled 8000, solution-treated for 2 h at 10000 C \\ hile sealedin quartz in vacuum, and quenched into cold water using adevice to snap ofr the nose of the tube. Finally, it wa coldrolled 94 ~~to 0'005 in. thickness.
After solution-treating at 1000' C sealed in vacuum andquenching into iced brine, 40 A-dia. particles were visible inthe electron microscope. Solution-treatment at I 100 C forI h was therefore adopted to increase the initial quenchingrate and to enable the particle size to be kept down to ~ 20 Ain the quenched material.
Strips were aged for up to I week at 650 ± 2' C and thenwithdrawn into the cooling zone of the vacuum furnace; theinitial cooling rate was estimated to be ~ 50 degCjsec. Thehardness was determined in a Kelllron microhardness testeron a lightly cleetropolished spot on the strip surface using a300-g load and a diamond p) ramid indenter. longitudinalsections of all the strips were etched and examined in the lightmICroscope.
Discs of2·3 mm dia. punched from the strips \\ere electro-thinned by a Disa jet technique1,I for electron-microscopeexamination at 100 kY. The electrolyte consisted of equalparts of orthophosphoric acid (sp. gr. 1'70) and water at 95 Y.In some cases an alternative electrolyte. consisting of 5 vol.- 0 <>
perchloric acid (70 O~) and 95 <> 0 glacial acetic acid, was usedat J50 V. Both single-tilt and double-tilt Valdre15 holders\\ere employed.
Pieces of all the strips, chemIcally thinned to 0,001 in., wereexamined in forward reflection in a Guinicr-Jagodzinskidouble-cylinder focusing X-ra) camera using monochromatedCuX" radiation. The sample was oscillated during exposure.Calibration lines were provided by tungsten powder of knownparameter placed on one edge of the sample. A fe\\ samples\\ere also examined in a J 14-mm-dia. Debye-Scherrer camerausing CoX" radiation and 16 h exposure. Side-bands were notdetected by this techniquc. The measured lattice parameters\\ere accurate to ± 0·002 A, but the side-bands could only bemeasured to lesser accuracy on account of their difluse nature.
ResultsHardness tests gave a single-peak ageing cune. The
average hardness increased progressively from 98 kg mm~ asolution-treated to 195 kg mm~ peak after 5 h ageing at650 C. and then decreased to 143 kg mm~ after I \Ieek(Fig. I).
In the solution-treated condition. the focusing camerarevealed only matrix lines corresponding to an Lc.c. latticewit h Go = 3· 591 A, with no evidcnce of side-bands. Side-bands were detected after ageing at 650- C fur periods ofI min-5 h (corresponding to peak ageing) but \\ere absentafter overageing for 24 h or I week. The lattice parameterincreased gradually on ageing, attaining an average value of3· 598 A after I week.
A separate Lc,c, precipitate pbase was first detected in theample aged 24 h at 650 C. The mismatch increased to 1·57± 0'1 I o~ average after ageing for I week, corresponding tolattice parameters of 3·598 A (matrix) and 3·541 A (precipi-tate), compared with the expected1~ values of 3·592 and3·525 A, respectively. No ne\\ lines corresponding to a
" ,- -~:>ci
:C I,0 \;: 4 f.,,
I, .
._,--- ..•.tCEf% • ~', ~'N
Fig. 1 I ariarioll olarerage "ardlle.I,I· ",i,h ,he /"Karir/1I11 orrhe ageillf[, ill1e {If 650 C.
tetragonal stage appeared between tbe side-band stage and theformation of the f.c.c. phases. although these would beexpected from tbe work of Biedermann and Kneller.!I
To investigate wbether the volume fraction of the equi-librium phases (formed as discontinuous precipitate nodules)became large enough to conrribute to the difTraction patterns,estimates were made by lineal analysis on metallographicections \\ bich showed 0'1, 0·8. 1,6. and 6·5 vol.- 00 after
ageing times of I h, 5 h, 24 h, and I \\eek. respectively. Sinceonly - I'() of this would be precipitate, it is unlikely to bedetecta ble in any of the diffraction pat terns. The mat rix phasewould be barely detectable after 24 h. but should make somediffraction contribution after I week. The lines apparentl~coincided with tbose from the rest of the matrix.
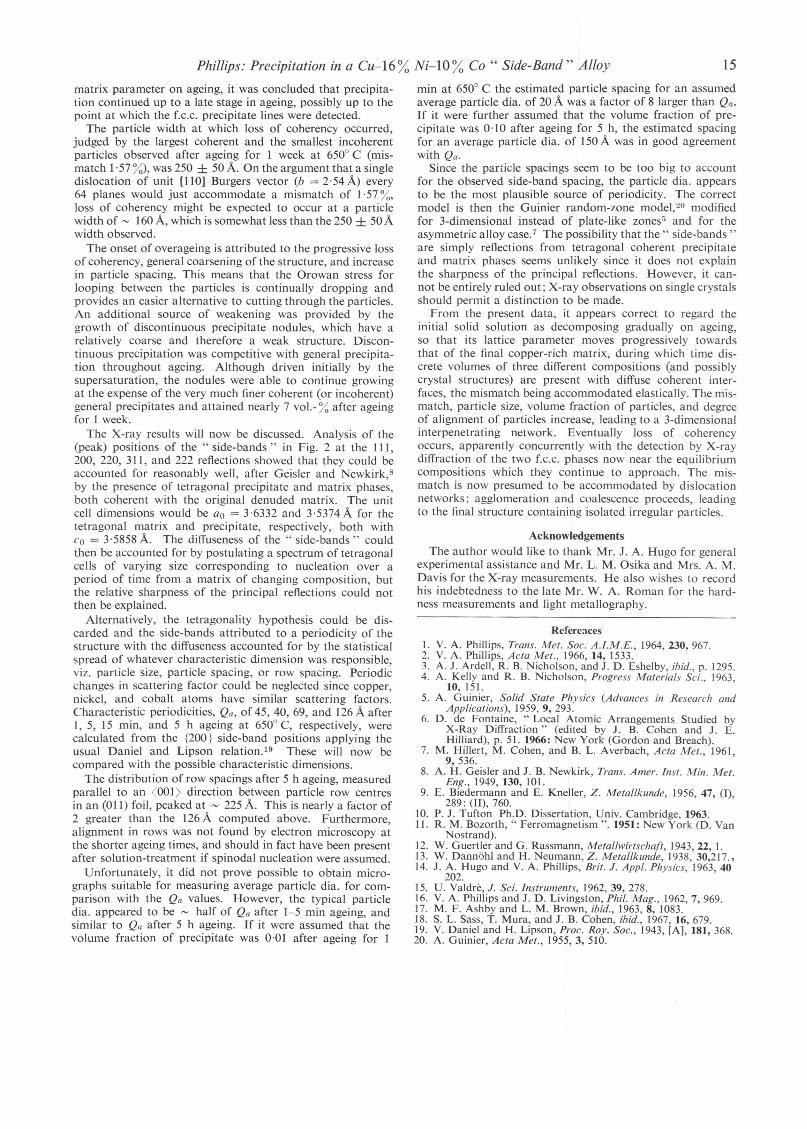
Side-bands were visible on either side of the fundamentallines Ill, 200, 220, 31 I, and 222 of the original Lc.c. lattice,The side-bands were very faint after 1-5 min ageing at 650 C,trong after 15 min ageing (Fig. 2), remained strong \\ ith
further increase in ageing time up to 5 h, and were nOIdetectable after 24 h ageing. No second-order peaks \'1 ereobserved. The sidebands on the two sides of a fundamentalline often differed from one another in intensity. in one casefrom arc to arc along the same difTraction linc. This is taken toindicate a grain-to-grain variation in dim'action behaviour.
rcing and difl'useness of the matrix lines, associated \\ ithmoderately coarse grains and preferred orientation, resultedin less than ideal X-ray patterns. Ho\\cver, the peak posi-tions of the side-bands for the 200 and II1 reflections weremeasured where possible. Their displacement .':J.d from themain line tended to decrease on ageing. Tbe nrst, i.e. highercl \ alue, side-band tended to approach tbe main line oncontinued ageing, while the second ide-band approachedthe parameter at \"hich the f.c.c. precipitate appeared onoverageing.
The light microscope showed evidence of abnormal grain-boundary structures in the etched microsections. A fc\\ ofthe grain boundaries in the solution-treated sample \\ereabnormally tbick and one or t\\-o sho\\ed slight discontinuousprecipitation. The number of grain boundaries afTected andthe size of the precipitate nodules increased on ageing. :'Ilostboundaries shO\\ed discontinuous precipitation in the pe,lk-aged condition; this led to intergranular cracking \\hen, trips aged for 1 h or more were slight I)' deformed.
The electron micrographs obtained are illustrated in Figs,3 and 4. Even quenching from 1100 C into iced brine at aninitial rate of - 8000 degC.sec I failed to suppress precipita-tion and resulted in an average particle size of - ::0 A dia.(Fig.3(a»). The particle size graduall) increased ",ith increase111 ageing time at 650 C (Figs. 3 and 4). being - 50 A after S min
Phillips: Precipitation in a Cu-16 % Ni-lO% Co" Side-Band" Alloy 13
(0)
(c)
(b)
(d)
Fig.3 Electron micrographs showing the effect of ageing at 6500 C: (a) no ageing; (b) aged 2 min; (c) aged 5 min; (d) agedh. Note growth of coherent precipitates, incipient discontinuous precipitation at grain boundary ill (b), and straill
fields at particles in (d). X 200,000.
(Fig. 3(c)), 150A after 5 h (Fig. 4(0)), corresponding to peakageing, and becoming much coarser on overageing (Figs.4(b)-(d).
A grain boundary on a sample aged for 2 min had anirregular wave-like shape and appeared to show a denudedzone of irregular thickness, presumably due to incipient dis-continuous precipitation (Fig. 3 (b)). After ageing for 1 weekgeneral precipitation was typically observed on one side of agrain boundary and discontinuous precipitation on the other(Fig. 4(c)). Although there was relatively little change inmicrostructure during the first 2 min ageing, the hardnessincreased considerably from 98 to 148 kgjmm2 (Fig. 1).
In the sample aged for 1 h (Fig. 3(d)), it was seen that thecontrast at a particle consisted of two dark lobes separatedby a plane of no contrast. In other regions, the plane of nocontrast was identified as being parallel to the principal dif-fracting plane. It was uncertain whether the particles were
spheres or cubes with rounded corners but it was concludedthat the particles were coherent and were visible by strain-field contrast.2,16-1S This conclusion is supported by the factthat ring patterns could not be obtained from the particlesby selected-area diffraction, and that in the overaged sampleselectron diffraction indicated that the particles had the sameorientation as the matrix.
The particles produced by ageing for 5 h, corresponding topeak hardness, were cubical with edges parallel to cubematrix directions as apparent in (001) foils (Fig. 4(a)). Thecontrast observed indicated that the particles were still co-herent. A marked tendency for the particles to be aligned inrows parallel to cube matrix directions was now apparent.The distribution of row spacings was most easily measuredin an (01I)-oriented foil. The measured distribution after5 h ageing had a rather broad peak centred about 250A.
After 24 h ageing, the smaller precipitates were generally

14
(ill
(c)
Session I: Spinoda/ De('oll1posilioll
Fig. 4(u) AKed 5 h {I{ 650 C The (oil i,l 0 few deKree.l olj"(OOI) ({Iullhe lIIicrograph l'dges are parallel 10 001 . Sholl'illgclIhiml precipi{a{el lelldill!? 10 oliKII ill r9"'I, 200.000. th) AKed 24 h 01 650 C. The liJil plo){e i,l lOll) olld {he IOIIKedgl! o/Ihl' IIlicroKral,h i,l porallelto [001], Sholl'illg prollo/lllced oliK"llell o/preClIJilotCl, 80.000, (c) AKed I lI'eeA01 650 C. ShowillK discolltill/lO/l,1 preClIJitllle,1 (.I!rimed) lIdjoillillK II graill hoolldllr •. , The oriellla{ iOIl ill the dilco){/illllOOIregioll is (I 12). .:\0.000. (d) Aged I lI'eeA III 650 C Showillg Kelleral precil'ilotioll ill 0 (112) foil, The precipiw{{'1
,IhOll' 1110in; j'rillgel. 125.000
(III
t" I
\till <.:oherent (Fig, 4{1») but there \\as evidence of loss ofcoherency of the larger particles in some areas, Alignment ofparticles in rows in cube directions ",as marked leading to arenlarl-.abl) regular 3-dimensional ana). The distribution ofro\\ spacings, measured normal to the ro\\s in an (011) foilarea including Fig. 4(h), pc' ked at ~ 350 A As notedearlier, X-ray side-bands were no longer observed at thisagell1g time.
Considerable coalescence and some spheroidization of thepanicle rows had occurred after ageing for I week at C,50 C.leading to a \\ ide range of general precipitate morphologies(Figs ...He) and (d). The particles had e\ identl~ lost coherencyjudged by criteria established previously, I since pronouncedmoire fringes were observed at the particles and strain fields\\ere no\\ absent. T\\o of the ~ets of moire fringes apparentin Fig. ·+(d) ",ere in the correct directions for: Ill: and :511:t) pes. Their spacings \\ere meclsured and agreed \\ ithin ex-perimental accurac) \\ ith the Htlues of 130 and -1--1- A calcu-lated for parallel-type moire patterns from the measuredX-ra) lattice parameters.
Selected-area difTraction on the discontinuous precipitateregion in Fig. 4(c) indicated that the precipitates had the sameorientation as the matrix and the positions of the reOectionsagreed \\ ith the measured X-ra) lattice parameters. Theparticles \\ere elongated parallel to a III direction: fringewere seen parallel to a 110 clirection in this (112)-orientedregion and could be interfacial dislocations or a : Ill:parallel moire pattern. The avcrage fringe spacings measuredat three particles were 141. 150, and 160 A, compared \\ ithJ 36 A calculated for a : I I1 ; parallel moire pattern from the
X-ray lattice paramcters, or 1C,5 A calculated for the spa<.:ingof an array of unit edge dislocations needed to accommodat<:the 1'57"" mismatch, Contrast experiments \\ould be n<:c<:,-sal') to make a distinction.
DiscussionContrary to what might have been expected from previoll~
\\ork' to on Cunico I, the general precipitate shape afterageing for 5 24 h at 650 C \\as cubical. It \\as not possibleto distinguish bct\\een cubes and spheres at shorter ageingtimes. 1':0 particle alignment in ro\\S parallel to 001 matri,directions \\as detected at the beginning of ageing, \\ here it\~ould be expected if decomposition occurred spinodall~,although a number of : 110: foils \\(,IT examined, While thi,might be ascribed to difficulties of obsenation associated \\ iththe high particle dcnsit:v. it seems more likel) that sele<:tivcgro\\th \\as needed to de\elop alignment as obsel'\cd in CuCOl and t i All,;' alloys.
Pronounced alignment of particles in ro"s parallel to 001directions was apparent in the peak-aged and lightly overaged.conditions. corrcsponding to a ]-dimensional array '" ilhremarkabl) uniform spacings. Coalescence, loss of coherenc<:.and sphcroidization leading to the formation of relalivel~coarse, isolated precipitate particles occurred on prolongcdoverageing. Thus, the structure apparently changed from arandom array of isolated particles to a 3-c!imensional inter-penetrating net\\ ork and back to a random array of isolatedparticles. Since the initial solid solution ga\e sharp lines andthe lattice parameter gradually moved to\\ards the final
Phillips: Precipitation in a Cu-16% Ni-l0% Co " Side-Band" Alloy 15
matrix parameter on ageing, it was concluded that precipita-tion continued up to a late stage in ageing, possibly up to thepoint at which the f.c.c. precipitate lines were detected.
The particle width at which loss of coherency occurred,judged by the largest coherent and the smallest incoherentparticles observed after ageing for 1 week at 6500 C (mis-match 1·57 %), was 250 ± 50 A. On the argument that a singledislocation of unit [1l0] Burgers vector (b = 2·54 A) every64 planes would just accommodate a mismatch of 1·57 %,loss of coherency might be expected to occur at a particlewidth of ~ 160 A, which is somewhat less than the 250 ± 50 Awidth observed.
The onset of overageing is attributed to the progressive lossof coherency, general coarsening of the structure, and increasein particle spacing. This means that the Orowan stress forlooping between the particles is continually dropping andprovides an easier alternative to cutting through the particles.An additional source of weakening was provided by thegrowth of discontinuous precipitate nodules, which have arelatively coarse and therefore a weak structure. Discon-tinuous precipitation was competitive with general precipita-tion throughout ageing. Although driven initially by thesupersaturation, the nodules were able to continue growingat the expense of the very much finer coherent (or incoherent)general precipitates and attained nearly 7 vol.- % after ageingfor 1 week.
The X-ray results will now be discussed. Analysis of the(peak) positions of the " side-bands" in Fig. 2 at the 111,200, 220, 31 I, and 222 reflections showed that they could beaccounted for reasonably well, after Geisler and Newkirk, B
by the presence of tetragonal precipitate and matrix phases,both coherent with the original denuded matrix. The unitcell dimensions would be ao = 3·6332 and 3·5374 A for thetetragonal matrix and precipitate, respectively, both withCo = 3·5858 A. The diffuseness of the" side-bands" couldthen be accounted for by postulating a spectrum of tetragonalcells of varying size corresponding to nucleation over aperiod of time from a matrix of changing composition, butthe relative sharpness of the principal reflections could notthen be explained.
Alternatively, the tetragonality hypothesis could be dis-carded and the side-bands attributed to a periodicity of thestructure with the diffuseness accounted for by the statisticalspread of whatever characteristic dimension was responsible,viz. particle size, particle spacing, or row spacing. Periodicchanges in scattering factor could be neglected since copper,nickel, and cobalt atoms have similar scattering factors.Characteristic periodicities, Qa, of 45, 40, 69, and 126 A after1, 5, 15 min, and 5 h ageing at 6500 C, respectively, werecalculated from the {200} side-band positions applying theusual Daniel and Lipson relation.l9 These will now becompared with the possible characteristic dimensions.
The distribution of row spacings after 5 h ageing, measuredparallel to an <001 > direction between particle row centresin an (011) foil, peaked at ~ 225 A. This is nearly a factor of2 greater than the 126 A computed above. Furthermore,alignment in rows was not found by electron microscopy atthe shorter ageing times, and should in fact have been presentafter solution-treatment if spinodal nucleation were assumed.
Unfortunately, it did not prove possible to obtain micro-graphs suitable for measuring average particle dia. for com-parison with the Qa values. However, the typical particledia. appeared to be ~ half of Qa after 1-5 min ageing, andsimilar to Qa after 5 h ageing. If it were assumed that thevolume fraction of precipitate was 0·01 after ageing for 1
min at 6500 C the estimated particle spacing for an assumedaverage particle dia. of 20 A was a factor of 8 larger than Qa.If it were further assumed that the volume fraction of pre-cipitate was 0·10 after ageing for 5 h, the estimated spacingfor an average particle dia. of 150 A was in good agreementwith Qa.
Since the particle spacings seem to be too big to accountfor the observed side-band spacing, the particle dia. appearsto be the most plausible source of periodicity. The correctmodel is then the Guinier random-zone model,20 modifiedfor 3-dimensional instead of plate-like zones5 and for theasymmetric alloy case.7 The possibility that the" side-bands"are simply reflections from tetragonal coherent precipitateand matrix phases seems unlikely since it does not explainthe sharpness of the principal reflections. However, it can-not be entirely ruled out; X-ray observations on single crystalsshould permit a distinction to be made.
From the present data, it appears correct to regard theinitial solid solution as decomposing gradually on ageing,so that its lattice parameter moves progressively towardsthat of the final copper-rich matrix, during which time dis-crete volumes of three different compositions (and possiblycrystal structures) are present with diffuse coherent inter-faces, the mismatch being accommodated elastically. The mis-match, particle size, volume fraction of particles, and degreeof alignment of particles increase, leading to a 3-dimensionalinterpenetrating network. Eventually loss of coherencyoccurs, apparently concurrently with the detection by X-raydiffraction of the two f.c.c. phases now near the equilibriumcompositions which they continue to approach. The mis-match is now presumed to be accommodated by dislocationnetworks; agglomeration and coalescence proceeds, leadingto the final structure containing isolated irregular particles.
AcknowledgementsThe author would like to thank Mr. J. A. Hugo for general
experimental assistance and Mr. L. M. Osika and Mrs. A. M.Davis for the X-ray measurements. He also wishes to recordhis indebtedness to the late Mr. W. A. Roman for the hard-ness measurements and light metallography.
Refereaces1. V. A. Phillips, Trans. Met. Soc. A.I.M.E., 1964,230,967.2. V. A. Phillips, Acta Met., 1966,14, 1533.3. A. J. Ardell, R. B. Nicholson, and J. D. Eshelby, ibid., p. 1295.4. A. Kelly and R. B. Nicholson, Progress Materials Sci., 1963,
10,151.5. A. Guinier, Solid State Physics (Advances in Research and
Applications), 1959, 9, 293.6. D. de Fontaine, "Local Atomic Arrangements Studied by
X-Ray Diffraction" (edited by J. B. Cohen and J. E.Hilliard), p. 51. 1966: New York (Gordon and Breach).
7. M. Hillert, M. Cohen, and B. L. Averbach, Acta Met., 1961,9,536.
8. A. H. Geisler and J. B. Newkirk, Trans. Amer. Inst. Min. Met.Eng., 1949, 130, 101.
9. E. Biedermann and E. Kneller, Z. Metallkunde, 1956, 47, (1),289: (ll), 760.
10. P. J. Tufton Ph.D. Dissertation, Univ. Cambridge, 1963.11. R. M. Bozorth, "Ferromagnetism". 1951: New York (D. Van
Nostrand).12. W. Guertler and G. Rassmann, Metallwirtschaft, 1943,22,1.13. W. Dannohl and H. Neumann, Z. Metallkunde, 1938, 30,217.,14. J. A. Hugo and V. A. Phillips, Brit. J. Appl. Physics, 1963,40
202.15. U. Valdre, J. Sci. Instruments, 1962, 39, 278.16. V. A. Phillips and J. D. Livingston, Phil. Mag., 1962,7,969.17. M. F. Ashby and L. M. Brown, ibid., 1963,8, 1083.18. S. L. Sass, T. Mura, and J. B. Cohen, ibid., 1967, 16,679.19. V. Daniel and H. Lipson, Proc. Ray. Soc., 1943, [Al, 181, 368.20. A. Guinier, Acta Met., 1955,3,510.

Zone Formation in an Austenitic SteelContaining Aluminium and Titanium
F. G. J'Vilson
100, wherc po is the rcsistivity immediately follO\\ing
The early stages of ageing in a 25°" Ni 15°" Cr 0,8""AI 4"" Ti steel have been studied by resistivity andthin-foil techniques, and the results have been com-pared with those obtained on an aluminium-free steel.The form of the resistivity changes was found to besimilar to that observed in a 4°" Ti steel. Below 840 C,the resistivity increased to a ma'dmum which wascaused by the formation of coherent spherical zones.At 860 C, the formation of r' caused a resistivityincrease but this was due to the generation of coherencystrains at the y' austenite interface. Although struc-turally identical, a clear kinetic difference exists betweenordered zone and the y' precipitate. The addition ofaluminium suppressed the formation of cellularNi"Ti and reduced the amount of WidmanstattenT"i:1Ti at any temperature. although Fe~Ti was detectedas large grain-boundary particles at th~ higher ageingtemperatures. The spinodal temperature was increasedfrom 730 to 790 C and the zone solvus temperaturewas increased from 840 to 855 C. Below 730 C,aluminium reduced the rate of growth of the zonesand this was attributed to a lower quenched-in vacancyconcentration. At 860 C, the nucleation of "(' wasreduced by a factor of 30 by the presence of aluminiumand this was attributed to the fact that the chemicaldriving force for the nucleation of Lc.c. Ni"Ti is greaterthan for Ni:, (AI, Ti).
]n a recent resistivity and thin-foil electron-microscopeinvestigation I the kinctics of th.; early stages of precipitationin a 25"0 Ni-15°0 Cr--4°" Ti <1ustenitic stcel ""ere studied.rf 0,8"., AI is added to such a stcel. thc rapid 0\ crageing asso-iated WiOl the formation of cellular Ni"Ti is considerably
retarded.~·" However, the elrect of aluminium on the kineticsof zone formation in a titanium-bearing austenitic ·tcel is notkno\\ n, and the present il1\estigation was undertaken toobtain the relevant kinetic data and to compare themwith the kinetics of precipitation in an aluminium-free stp.el.
Experimental ProcedureThe stecl used had the following composition (wt._o.,)'
C Mn Si Ni Cr AI Ti N0·059 ]·13 0'34 25·15 15·39 0·86 430 0'01
Manuscript received 20 February 196~. F. G. Wilson. B.Eng., Ph.D., isin !he S\\ inden Research LaboratorieS. United S!eel Co .. ROlherham.York>.
16
The mcthod of preparing the wire for the rcslstlvltywork was identical to that used for the aluminium-free alloy.!
The apparatus used to measurc the resistivity was based onone originally designed by Colner and Zmeskal. I The modeof operation, which entailed solution-treating for 5 mi nat 1150' C in vacuum followed by qucnching in argon dircctto the isothermal ageing tcmperaturc, was described in thccarlier paper.l
The electron-microscope invcstigation was carricd outon separately agcd strip material which had becn solution-treated at 1150 C and qucnched directly into a salt bath.1
Experimental ResultsResistivity Changes
The rcsisti\it) changcs \\cre mcasured continuousl) at th.;ageing temperature and \\cre exprcsscd as a perccntage,-"pPothc quench and -"p = Pt - po, \\ here Pt is the resisti\ it) attime 1.
The cfTect of ageing tempcraturc on the changes in resis-tivity are shown in Figs. 1-3 and thc form of the changcswas Very similar to that obscl'\cd in the 4"" Ti steel.!
To cnsure that oxidation was not responsible for theresistivity increases, a numbcr of runs were repcated in dr)hydrogen and found to agrce with the results obtained inhigh-purity argon.
Optical MicrostructuresAged wire samples were examincd optically to observc any
large-scale morphological changcs associated with thc re i -ti it) changes. Cellular Ni:ITi precipitate \\as not obscl'\edat any temperaturc. At tcmperatures belo\\ 800 C a gcneraldarkening of the matrix accompanied overageing but reso-lution of individual precipitates \\as impossible.
E\en after 500 min at 840 C (Fig. 4(a» thc prcdominantprccipitate was ';', which \\as associatcd \\ ith darkening ofthe matrix. In addition. large angular grain-boundaryparticles, together with a few isolated particles \\ ithin thcgrains, \\cre observed. X-ra) diffraction on cxtractcd rcsiduesfrom aged specimens indicatcd that these particles wcrc h.c.p.Ni:ITi and Fe~Ti.
Ageing at 860 C caused considerable growth of the 'r'(Fig. 4 (h) and in addition needles of i:1Ti \\erc obsenedtogether with the large angular grain-boundary particlcs ofFe~Ti. After ageing at 900 C. y' was not observed and growthand coalescence of the Fe~Ti particles occurred with furtherprecipitation of Ni.1Ti (Fig. 4((') ).
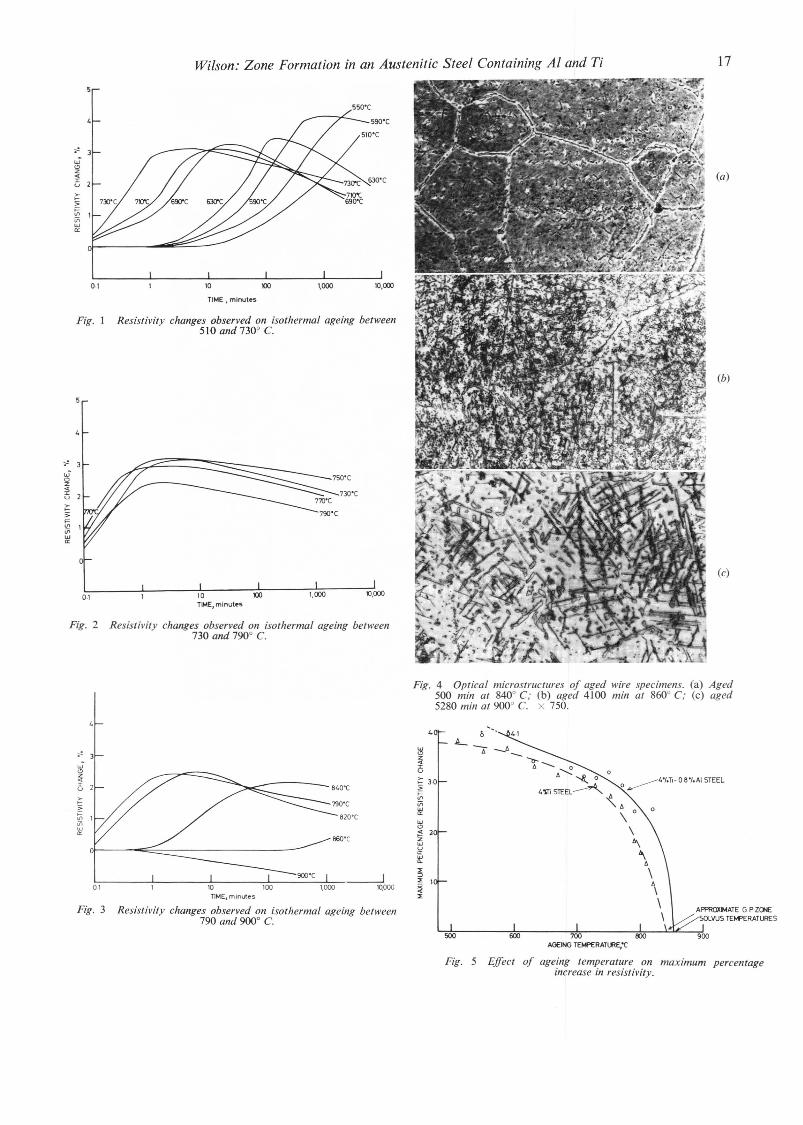
Wilson: Zone Formation in an Austenitic Steel Containing Al and Ti 17
(c)
(b)
(a)
10,000
73O'C
75O'C
1,000
71O'C
790'C
100
TIME. minute's
100·1
0·1
Fig, 1 Resistivity changes observed on isothermal ageing between510 and 7300 C,
>....;>
~ 1
'"wCl:
55O'C
Fig, 2 Resistivity changes observed on isothermal ageing between730 and 7900 C.
w'"z«ru
w·~«ru>....;>>='"inwCl:
Fig. 4 Optical microstructures of aged wire specimens. (a) Aged500 min at 8400 C; (b) aged 4100 min at 8600 C; (c) aged5280 min at 9000 C. x 750,
4 I>L-
" ~ t;z
W- «r
'" uz« ~ 3·0Iu 840'C ;>
>>='"•... 790'C in>=
>=w
'" 1 820'CCl:
::i w
'"Cl: ;!860'C z
wuCl:
~:E
------l ::>:E Ien 10,000 ~:E
Fig. 3 Resistivity changes observed on isothermal ageing between790 and 9000 C.
Fig. 5 Effect of ageing temperature on maximum percentageincrease in resistivity.

]8
(a)
(c)
Scssion I: Spinoda/ D(,(,olJlposi/ ion
/.~~. h L//i,('( 0/ (/g"iog {"O//>erolllJ'(' (10 {!I" \{,."('(or,,. (a) ·Ig,,';lOO lIIio 1II H-tO C. HO.OOO. (\O{" \(//>er/allic" re!/,,('(i(lo.)(b) -1g,,'; 1000 lIIio a{ l'-t0 C. l'0.000. (c) ·Ig,,'; 1000 lIIio(/{ l'1i0 C. 32.000. (d) Ag,,'; 1000 lIIill (/{ l'60 C 32.000.
Electron ;\ficroscop~In the -t"" Ti austenitic stecl' C'\cellcnl agreement \\as
found betwcen the morphologICal and rcsisti\ It) changes.The general form of (he resistivity changes in the presentalloy \\as similar to that obser\ed in the 4"" Ti steel and onthe basis that the resisti\'it) ma'lmum is due to the presenceof Lones of critical dia.' (~ 10 A) the e\trapolatlon sho\\nill Fig. 5 indicates thar the zone solvus temperature is ~855 C. Thc thin-foil electron-microscope examination con-firmed the agreement bet\\een the rcsisti\ it) maximum andthe presence of zones. especiall) belo\\ 820 C. Ho\\'e\er.after I min at 840 C the aged stcel contained Lones althoughdiffraction evidence of ordering \\as not obtained until aftcr
100 mill \\hen .... panicles. ~ 100 A in dia .. \\ere dctected(Fig. 6«((»). Ageing for 1000 min promotcd rapid gro\\ thof the .: (Fig. 6 (h) ) and. on occasions. tmcc amounts ofcellular Ni"Ti.
It can bc scen that thc rcsisti\it) and structural changes\\ere not compatiblc at this temperature. the presence of aline zone structure aftel' I min being associated \\ ilh a "erysmall resisti\ity increase. A similar diserepanc\ \\as obscl'\edIn the 4"" Ti steel at 820 C.'
10 e\ idence for ,Ill) Lone or .:' formation \\as obtainedafter 100 min at 860 C. the lack or precipitation confirmingthe resisti\it) results. Ho\\e\cr. ageing for 1000 min ,It
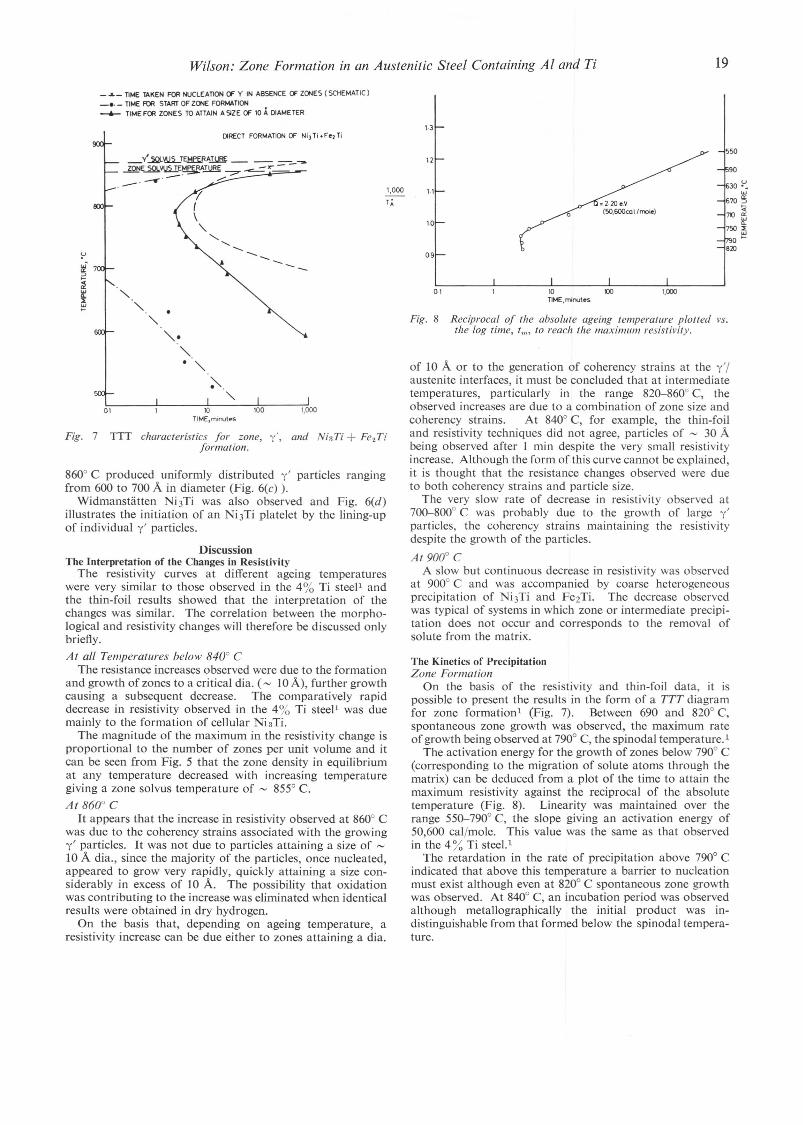
Wilson: Zone Formation in an Austenitic Steel Containing Al and Ti 19
_ .••._ TIME TAKEN FOR NUCLEATION ~ y' IN ABSENCE ~ Z()lES (SCHEMATIC)_0. _ TIME FOR START OF ZONE FORMATION.-.- TIME F<JI ZONES TO ATTAIN A SIZE ~ 10 A DIAMETER
DIRECT FORMATION OF Ni, Ti .F., Ti
',000 ,.,
T ;,
09
550
lO
The Kinetics of PrecipitationZone Formation
On the basis of the resistivity and thin-foil data, it ispossible to present the results in the form of a TTT diagramfor zone formation1 (Fig. 7). Between 690 and 8200 C,spontaneous zone growth was observed, the maximum rateof growth being observed at 7900 C, the spinodal temperature. 1
The activation energy for the growth of zones below 7900 C(corresponding to the migration of solute atoms through thematrix) can be deduced from a plot of the time to attain themaximum resistivity against the reciprocal of the absolutetemperature (Fig. 8). Linearity was maintained over therange 550-7900 C, the slope giving an activation energy of50,600 cal/mole. This value was the same as that observedin the 4 % Ti steeP
The retardation in the rate of precipitation above 7900 Cindicated that above this temperature a barrier to nucleationmust exist although even at 8200 C spontaneous zone growthwas observed. At 8400 C, an incubation period was observedalthough metallographically the initial product was in-distinguishable from that formed below the spinodal tempera-ture.
Fig. 8 Reciprocal of the absolute ageing temperature plotted vs.the log time, tm, to reach the maximum resistivity.
01 ~TIME.minut~s
of 10 A or to the generation of coherency strains at the y'/austenite interfaces, it must be concluded that at intermediatetemperatures, particularly in the range 820-8600 C, theobserved increases are due to a combination of zone size andcoherency strains. At 8400 C, for example, the thin-foiland resistivity techniques did not agree, particles of ~ 30 Abeing observed after I min despite the very small resistivityincrease. Although the form of this curve cannot be explained,it is thought that the resistance changes observed were dueto both coherency strains and particle size.
The very slow rate of decrease in resistivity observed at700-8000 C was probably due to the growth of large y'particles, the coherency strains maintaining the resistivitydespite the growth of the particles.
At 9000 CA slow but continuous decrease in resistivity was observed
at 9000 C and was accompanied by coarse heterogeneousprecipitation of Ni3Ti and FezTi. The decrease observedwas typical of systems in which zone or intermediate precipi-tation does not occur and corresponds to the removal ofsolute from the matrix.
~~..• 7
=>~~ "§ '"
" "-0"-.o ""-
~.
"Fig. 7 TIT characteristics for zone, y', and NiaTi + Fe.Ti
formation.
DiscussionThe Interpretation of the Changes in Resistivity
The resistivity curves at different ageing temperatureswere very similar to those observed in the 4% Ti steel1 andthe thin-foil results showed that the interpretation of thechanges was similar. The correlation between the morpho-logical and resistivity changes will therefore be discussed onlybriefly.At all Temperatures below 8400 C
The resistance increases observed were due to the formationand growth of zones to a critical dia. (~ lOA), further growthcausing a subsequent decrease. The comparatively rapiddecrease in resistivity observed in the 4% Ti steel1 was duemainly to the formation of cellular NiaTi.
The magnitude of the maximum in the resistivity change isproportional to the number of zones per unit volume and itcan be seen from Fig. 5 that the zone density in equilibriumat any temperature decreased with increasing temperaturegiving a zone solvus temperature of ~ 8550 C.At 8600 C
It appears that the increase in resistivity observed at 8600 Cwas due to the coherency strains associated with the growingy' particles. It was not due to particles attaining a size of ~10 A dia., since the majority of the particles, once nucleated,appeared to grow very rapidly, quickly attaining a size con-siderably in excess of 10 A. The possibility that oxidationwas contributing to the increase was eliminated when identicalresults were obtained in dry hydrogen.
On the basis that, depending on ageing temperature, aresistivity increase can be due either to zones attaining a dia.
8600 C produced uniformly distributed y' particles rangingfrom 600 to 700 A in diameter (Fig. 6(c) ).
Widmanstatten Ni3Ti was also observed and Fig. 6(d)illustrates the initiation of an Ni3Ti platelet by the lining-upof individual y' particles.
20 Session I: Spinodal Decomposifion
Austenite _. NiJTi
Between 870' C and the solvus temperature:
Bet wcen - 850 and 870' C:Austenite . y . Isolated i.\Ti needles.
The basic precipitation mechanisms are therefore verysimilar to those occurring in a 4°0 Ti steell but the additionof 0·8 0" AI promotes a number of kinetic modifications tothe precipitation \vhich will now be discussed in detail.
As expected, therefore. the higher-alloy steel possessed botha higher spinodal and zone solvus temperature than the Tisteel but it would appear that the y' soh'us temperatures werevery similar.
(ii) Below the zone solvus temperature the number ofzones in equilibrium at a given temperature would be expectedto be higher in the aluminium-bearing steel.
An estimation of the number of zones in equilibrium at agiven temperature can be obtained from a measurement ofthe resistivity peak, which is directly proportional to thedensity of zones of critical dia. (~ lOA). I t can be seen fromFig. 5 that the AI- Ti steel did in fact have a higher zonedensity than the Ti steel at all temperatures.
(iii) The atomic dia. of titanium and aluminium are verysimilar and, on the basis of a random walk model, the migra-tion rates of these elements would be expected to be verysimilar. In fact, below the respective spinodal temperatures,the activation energies for solute migration in the Ti and theAI- Ti alloys were identical within experimental error (49,000and 50,600 cal mole).
However, below 730 C, the rate of growth of zones to loAdia. was significantly lower in the AI Ti steel than in the Tisteel; this observation would not be expected solely from aconsideration of the respective solute contents.
The addition of trace elements to age-hardening alloys isknown to have a marked efl'ect on the rate of zone formation.This is well documented in non-ferrous systems~ and in theAI-Cu system, for example, the addition of only 0'01°;' Inmarkedly reduces the zone growth rate.H It is suggestcd thatthe effect of aluminium in the present alloy is a manifestationof the same phenomenon and is due to a reduction in theconcentration of quenched-in vacancies, thcreby limiting thetransport rate of the solute atoms.
The reason for the decrease in vacancy concentration uponthe addition of aluminium is less easy to explain, although itcan be discussed in qualitative terms. The atomic dia. foriron, titanium, and aluminium are 2·54, 2·93, and 2·85 A,respectively.!' In an austenitic steel containing 4"0 Ti, muchof the distortion associated with the titanium atoms \\ould beminimized by the formation of titanium-vacancy comple:\esat 1150 C. The reduction in the overall vacancy concentrationon the addition of aluminium could be explained as beingdue to the formation of aluminium-titanium complexe tominimize the solute strain energy. The association of thesmaller aluminium atom with a large titanium atom wouldprobably reduce the localized distortion without requiringthe formation of a vacancy in the vicinity of the titaniumatoms.
At temperatures above the spinodal for the Ti steel (730 Clbut belo\\ that for the AI- Ti steel (790 C) the rate of zonegro\\lh to 10 A dia. \\as much fast~r in the latter steel, thureversing the trend observed at lower temperatures. However.this eA'ect occurred because above 730 C in the Ti steel. therate at which zones attained a size of 10 A dia. \\as dependentnot only on the migration of solute but also on the nucleationof the zones because the chemical driving force for precipi-tation was much reduced.
At 860 C, the addition of AI to the Ti steel increased theincubation period for the nucleation of y' from 10 min to ~300 min, i.e. by a factor of 30. In addition the subsequentgrowth of -:' was also retarded: after 1000 min the averageparticle size was ~ 600 A compared with 800 A in the Tisteel. t
0'80" AI-4'30"0
Ti790 C855 C870' C
-. Independent nuclcation ofy' probably at dissolvingzone austenite interfaces
-1'10°0 Ti Steel730 C840 C870 C
. Zonesdissolve
. Zones
Spinodal temperatureG.P.-zone solvus temperature',' solvus temperature
Austenite
The Effect of Aluminium on the Precipitation Characteristics of a4°0 Ti Steel
The most obvious effect produced by the presence of 0'8 o~
AI on the ageing of a 400 Ti steel is the suppression of the
cellular reaction and a reduction in the amount of Widman-statten iJTi precipitate.~·:l However, the presence of alu-minium also has a more subtle influence on the precipitationwhich is not immediately apparent \\ ithout considering theresistivity and thin-foil data.
The addition of aluminium to a 40" Ti steel in eA'ect
increases the solute content and, on this basis alone, such asteel \\ould be expected to exhibit the following characteris-tics when compared with the aluminium-free steel.
(i) The Lone solvus and -( solvus temperatures wouldbe increased, together with the true solvus temperature.The effect of alloy content on the solvus temperatures isshown below:
y' Format ionThe G. P.-zone solvus temperature for the present alloy
was at ~ 8550 C and above this temperature direct nucleationof y' occurred after a considerable incubation period. They' solvus temperature occurred at ~ 870v C.
The transformation curve for y' formation (Fig. 7) indicatethat from 750 to 820' C zone formation preceded the formationof ,'. The effect of this precipitation sequence on the form ofthe resistivity curves has already been discussed.
Precipilaliol7 at 9000 CAt 9000 C. no zones or y were observed and direct formation
of h.c.p. NiJTi! and grain-boundary FezTi occurred after anincubation period.
Sequence of PrecipitationI t was demonstrated that in the case of a 40
0 Ti steel, it isvalid to differentiate between a zone and a -( precipitatealthough they are structurally identical. I The present workhas confirmed that there is a clear kinetic difference betweena zone. which forms by migration of solute atoms to producethe required structure, and a y' particle which forms after anincubation period by nucleation and growth. A similarkinetic differentiation has been made between zone formationand intermediate precipitate formation in an AI-Mg-Sialloy'; The precipitation sequences were temperature-dependent and from 700 to 8400 C. the proposed ageingsequence is:

Wilson: Zone Formation in an Austenitic Steel Containing Al and Ti 21
These data show the apparently anomalous effect thatabove the zone solvus temperature increasing the solutecontent in the form of added aluminium decreased thenucleation and growth rate of y'. One possible reason forthis is that the addition of AI reduces the quenched-invacancy concentration owing to the formation of titanium-aluminium complexes. Although this effect is important atlow temperatures, particularly below the spinodal, it is un-likely to account for a decrease in nucleation rate by a factorof 30 at 8600 C. Alternatively the nucleation barrier for theformation of f.c.c. Ni3(AI, Ti) may be greater than that forthe formation of f.c.c. Ni3Ti if the chemical driving forcefor the nucleation of Ni3Ti is greater than for Ni3(AI, Ti).Unfortunately no thermodynamic data exist to confirm thispoint.
ConclusionsA resistIVIty and thin-foil investigation has been carried
out to study the kinetics of precipitation in a 25 % Ni, 15% Crsteel containing 4 % Ti-0'8 % Al and the results have beencompared with those previously obtained on a 4 % Ti austeniticsteel.
At temperatures below ~ 8400 C, the growth of zones toa critical dia. (~ 10 A) causes the resistivity to increase to amaximum. At 8600 C the resistivity increase, observed afteran incubation period, is due to the formation of coherencystrains at the y'/austenite interface.
The number of zones in equilibrium decreases rapidlywith increasing temperature and the zone solvus temperatureis ~ 8550 C. The maximum rate of zone formation occursat 7900 C, the spinodal temperature, and between this tempera-ture and 8400 C the nucleation barrier, although positive,is so low that copious zone formation is still observed.
It has been found that the addition of 0·8 % AI to a 25 % Ni-15% Cr-4 % Ti austenitic steel produces the followingeffects on the kinetics of precipitation:
(1) The spinodal and zone solvus temperatures are increasedby the addition of Al although the y' solvus temperatureappears to be unaltered.
(2) Below the zone solvus temperature, the number of zonesin equilibrium at a gi'/en temperature is higher in the Al-Tisteel.
(3) Below the spinodal temperature of the Ti steel {730°C)the rate of growth of zones to 10 A dia, is considerably fasterthan that observed in the Al- Ti steel.
{4) Below 7300 C, the activation energies for solute migra-tion in the two alloys are identical and the difference in zonegrowth rate can be attributed to a lower quenched-in vacancyconcentration in the AI-Ti steel.
(5) At temperatures above the spinodal for the Ti steel(7300 C) but below that for the AI-Ti steel (7900 C) the rateof zone growth to 10 A dia. is faster in the latter steel, thusreversing the trend observed at lower temperatures. Thisis due to the presence of a nucleation barrier above 7300 Cin the Ti steel.
(6) At 8600 C the nucleation rate of y' is reduced by afactor of 30 by the addition of 0·8 % AI; the growth rate isalso reduced. These effects are attributed to the lowerquenched-in vacancy concentration in the presence of AI,and also to the greater chemical driving force for the nucleationof f.c.c. Ni3Ti compared with Ni3(Al, Ti).
(7) At 9000 C the direct formation of Ni3Ti (h.c.p.) ismuch reduced in the presence of 0·8 % AI and large angulargrain-boundary plates of FezTi are formed.
AcknowledgementsThe author wishes to thank Dc. F. H. Saniter, O.B.E.,
Director of Research, United Steel Companies, Ltd., forpermission to publish the paper and Mr. F. B. Pickering forhelpful discussions during the progress of the work.
ReferencesI. F. G. Wilson and F. B. Pickering, Acta Met., 1968, 16, 115.2. B. R. Clark and F. B. Pickering,J. Iron Steel Inst., 1967,205,70.3. F. G. Wilson and F. B. Pickering, ibid., 1966,204,628.4. W. H. Colner and O. Zmeskal, Trans. Amer. Soc. Metals, 1952,
44, 1, 158.5. N. F. Mott, J. Inst. Metals, 1937,60, 267.6. D. W. Pashley, M. H. Jacobs, and J. T. Vietz,Phil. Mag., 1967,
16, 51.7. A. Kelly and R. B. Nicholson, Progress Materials Sci. 1963 10,
(3), 151. ' ,8. K. M. Entwistle and A. J. Perry, J. Inst. Metals, 1966,94, 24.9. W. Hume-Rothery and G. V. Raynor, "The Structure of Metals
and Alloys ". 1962: London (Inst. Metals).
The Decomposition of ConcentratedAI-Zn Alloys
A. J. Ardell, K. ,Yutlall, and R. B. _YicllOlsoll
The decomposition of a series of AI Zn alloys has beeninvestigated by electron microscopy. Three of the alloysfall within the miscibility gap of the AI Zn system andshow a "modulated" structure on ageing which is foundto be not necessarily associated with spinodal decompo-sition. The fourth alloy decom;)oses by a eutectoid re-action to give a lamellar structure but when rapidlyquenched it gives a very fine mixture of the two phaseswhich is interpreted in terms ofspinodal decomposition.
The decomposition of supersaturated AI-Zn alloys has been,tudied extensi~ely by many techniques.' Recent electron-metallographic and X-ray ,tudies~·l sugge,t that the dilute(up to 15 al.-oo Zn) Lec. aluminium-rich alloys decompose10 gi~e the aluminium-rich s('lid solution and the 1'0110\\ing,eries of precipitates:
Spherical G.P. lones - rhombohedral '1. • cubic '1. • IlIlC.
The rhombohedral -, phase differs only ,lightly In latticeparameter from the cubic ''1. phase.
The more concentrated A -Zn allo\s ha\e been In\es-tigated less thoroughly. Graf and Lenormand4 sho\\ed thatan aged 22 al.-oo Zn alloy exhibited X-ray "sidc-band,".which are often associated \Vith spinodal decomposition.'Rundman and Hilliard6 ha~e recently used X-ray small-angle scattering 10 obtain con\ incing e\ idcnce that the samealloy does in fact decompose spinodally at room tempcrature.There has since been some discussion-·' of the interpretationof their results.
The most recent phase diagram for the AI-Zn systcmq.IO,ho~\s the existence of a second high-temperature Lec. phase.y. \\hich cxists over an appruximate composition rangc of~9-63 al.- 00 Zn and decompm,cs at 276 C by a eutcctoid re-action. This reaction has been ,tudied by Gal'\\ood andHopkins.'l who showed that more than one type of de-composition product occurred depending on the trans-formation temperature.
ExperimentalThe alloys used in the pre,ent ill\estigation were made
from high-purity materials and contained 28-4. 393. 50·3al.-oo Zn (corresponding. respecti\ely. to the aluminium-richside. the critical point. and the linc-rich side of the miscibilitygap) and 59·0 al.-oo Zn. which is the eutectoid composition.Extensive segregation was present in the cast blocks but por-tions of the ingot \\ere selected to gi\e strip material (arter hot
Manuscript rccci\cd J Juh I96R. A. J. Ardcll. B.S .. ~I.S.. Ph.I) .. i, inthe W. M. Ked Labor:110r} 01' ['ngineering :\'tatcriab. Calil'orniaInstilute 01'Teehnolog\. LJ.S.A. Prol'c,>or R. B. ~iehol>on. 1>1.'\..Ph.IJ.. A.I.M .. and K~·Nultall. R.Se.M.Se.. arc ill Ihe DepartJl",nlOI'Mctallurg). ral:ult) or Sci(:IlCt:. Lni\l?rsit) of ~la'h:ht:~tcr.
22
rolling) that difTcrcd by < ± 0·25 al.-"" Zn in compo,ition.from sample to ,ample. The three km -/inc allo), \\ere solu-lion-treated for! h at ~OO C and the eutectoid aliI" for .I hat 380 C. Because of the known tendency I'm ,\I-Zn alia), todecompose during qucnching to room tcmperature1:: 1:1 the~pecimens \\ere quenched from thc sl,lution-treatlllent tem-perature directly into the ageing bath halt or oil I. Aftcr agcingthey were quenched and storcd at -10 C ltl pI'C\ent furtherdecomposition at room temperature.
Thin foils \\erc prepared by the disc mcthod for the threeI()\~-/inc allovs. usin~ a linal eleetropolishing 'oluti(Hl of 3D""nitric acid al~d 70"o-melhyl alcohol at -~() C. I-oih from thceutectoid allo) \\CI-c prcpared using the \\ ind()\\ methl,d andan elcctropolishing ,olution of 15"" perchloric acid in methylalcohol at -50 C. Foils from partl\ decompo,ed allo" had atcndcncv to decompose further under oh~cn a I IIll) in theelectron-microscope and this produced a numher of 'puriot"e1fects on elcctron-difrraction patterns.
ResultsThe 28·-l, 39·3, and 503 at.-"" Zn Allo~s
Thc charactcristic, of thc dccompo~ition produch of tht:Ihrec lo\\-/inc alloys wt:re identified by quenching foils to'Ra C and ageing for limes of 7 sec to I min at that tcm-;crature. Fig~ I i~ an e,ample of thc micro~tructurt: (I'und inall three allovs. The structure has a "modulated" appcaranccand seems -to consist of plate-shapcd prccipitate,. Thcmorpholog) of the indi\ idual plates can be ,cen more c/carl)in Fig. 2. The diffrauion pattern from thi, area ,ho\\s I11reAec7ions \~hich arc split. I n general these characteri,tics arcsimilar to thosc for the '1. plate, in Ihe more dilute ,dlo)s.i.e. plates on : I1I : matrix planes \\ hich caust: ,atellite rc-flectioll'i by \ irtuc of their departure from cubic" mmetr). U
The modulated appearance is, ho\\e\cr. more mar:"ed thanin the dilute alloys.
The modulated structure is e\ iclently full) de\el(lped after7 sec (\\ hich \Vas thc shortcst ageing time \\e could use) andonlv coarsens with further ageing. The rapidity of dCL'ompo,i-tio~ and the observation of a modulated ,tructlll'C ,uggestthat the mode of precipitation is spinodal decompo,ition. Themain diO'erence bel\\een this and olher spinodal ,tructurcs inmetallic systems'4 is that the modulations lie parallel to : I11 :matri, planes rather than 100:.
The ncxt series of e.xperiments \\as designed w establishwhether therc was any sharp changc in the morpholl1g) of thcdecomposition product as the specimens \\ere aged for fi,cdtimes (30 sec) at successi\ely higher agcing temperatures.Typical micrographs of the 28-4"" alloy arc sho\\n in Fig . .I.Extensi\c homogeneous precipitation in a modulated form IS
obsened for an ageing temperature of 310 C: at 315 C fe\\erprecipitates are presenl. but these arc still apparentl\ hlHllOgC-

Ardell, Nulla", and Nicholson: Decomposition of Al-Zn Alloys 23
Fig. 2 Micrograph of the 28'4% Zn alloy aged 1 min at 280°C,showing a.'precipitate discs and the associated diffraction pattern.
neously nucleated; at 320°C only heterogeneous precipitationon dislocations is apparent. Clearly the range 310-320°C iscritical for this alloy. Similar results were found for the othertwo alloys, the critical ranges being 335-340°C for the 39·3%alloy and 310-320°C for the 50·3% alloy. These temperaturesare well within the ex+ ex' miscibility gap and could representeither points on the coherent phase boundary for ex+ ex', thechemical spinodal, or the coherent spinodal (see Cahn15 fora discussion of these concepts).
To distinguish between these possible interpretations of the"critical" temperature, experiments were carried out on the28-4% alloy. Samples were aged for 2 min at 280°C, quenchedto O°C, and then aged at 320°C. If the critical temperaturelies on the coherent spinodal, precipitation in the 'specimendirectly quenched to 320°C (Fig. 3(c) ) may have been pre-vented by the presence of a nucleation barrier to precipitationat this temperature. In that case the precipitate formed at280°C should undergo rapid growth on re-ageing at 320°C.On the other hand, if the critical temperature represents thecoherent phase boundary, the precipitate formed at 280°Cwill dissolve on re-ageing at 320°C. The results of the ex-periment are shown in Fig. 4, where it is apparent that theprecipitate has almost completely dissolved after 1 min at320°C. This suggests that the second hypothesis is correct.
If a specimen is aged for a long time at 320°C, either afterdirect quenching or after first ageing for 2 min at 280°C,large semi-coherent ex' particles are formed (Fig. 4(d», whichconfirms the interpretation of the re-ageing experiment. It isclear that there is a substantial nucleation barrier to theformation of the semi-coherent ex' phase at 320°C and that
(c)
Fig. 3 Micrographs of the 28'4% Zn alloy aged 30 sec at Ca) 310,(b) 315, and (c) 320°C, illustrating the existence of a "criticaltemperature" at ~ 315°C. The precipitates ill (c) have nucleatedheterogeneously on dislocations in the matrix.
coherent ex' particles formed at 280°C are not able to act asnuclei for the semi-coherent phase on re-ageing at 320°C.
Further experiments on the 39·3% and 50·3% alloys led tothe same conclusion; the critical temperatures represent thecoherent ex/ex' solvus.
The 59·0 at.-% Zn Eutectoid AlloyThe normal decomposition mode of this alloy produced a
lamellar structure, as seen in Fig. 5. The two phases are thealuminium-rich and the zinc-rich solid solutions and thestructure is entirely typical of other eutectoid decompositions.As the decomposition temperature was reduced the spacing ofthe lamellae decreased, as expected (cf. Figs. 5(a) and (b) ).However, at sufficientlylow decomposition temperatures, e.g.below room temperature, the structure of the decompositionproduct changed completely. The process became continuousrather than cellular and the two phases were precipitated inapproximately equiaxed form (Fig. 6). This structure coarsen-
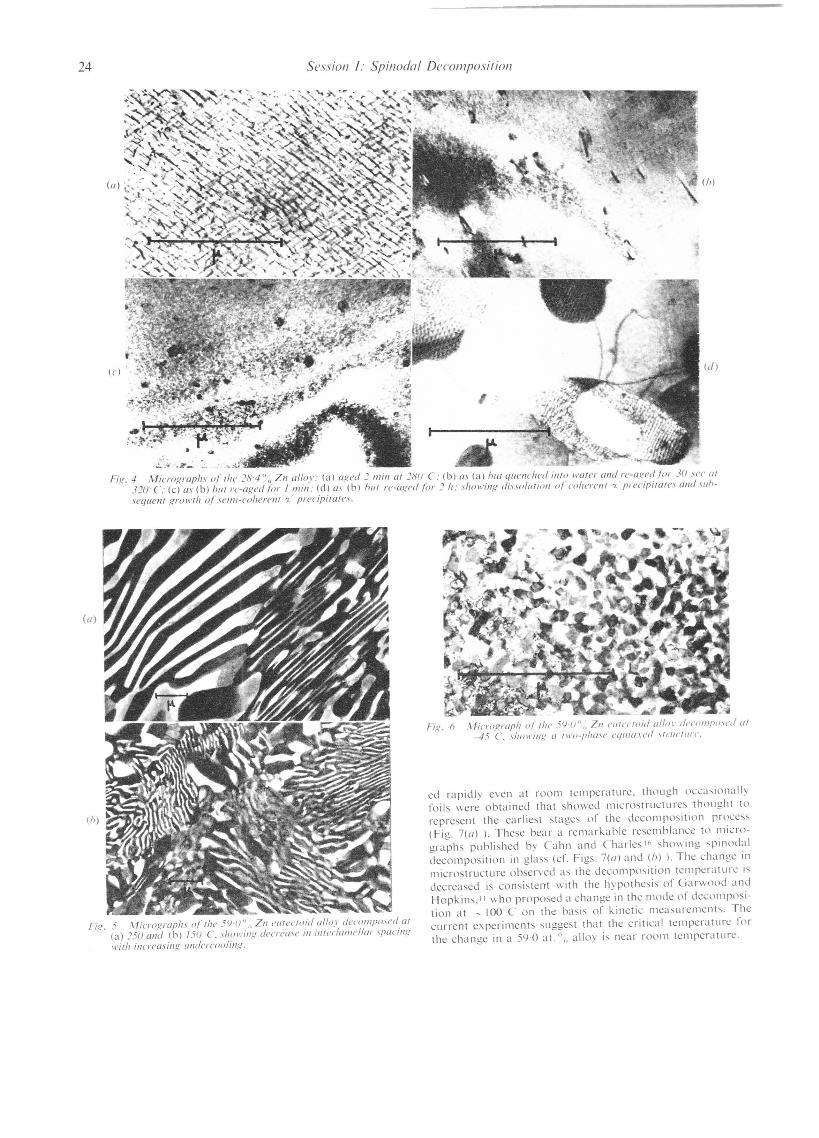
24 Session I: Spinodal Decomposilion
(h)
Id)
Fig.4 Micrograph.,' o( Ihe ]8·4° ° ZII alloy: (a) agcd] lIlill al 28U C: (b) as (a) In(/ qllellched ill/o lI'aler alld re-aged fiJi' 3(} ,lee {I/3]U C: (c) as (b) hilI rc-aged (or IlIIill: (d) as (b) hilI re-aged fi".] 11: sholl'illg dissollllioll o( cohaell/ '1.' precipi/{(/e.' alldlll/>-"eqllell/ groll'/h o( sellll-coherell/ '1.' precipilales.
(a)
(/»
Fi~, 5 \if icrogrophs o( Ihe 51)'(} " , ZII elllecwid allol' decolllpo.I'ed {I/(a) ]5(} alld (b) 15(} C. ,holl'illg decreme ill ill/erlalllellar I/){/cillf{with ill {Teasing III1i1ercoo/illg.
Fig. fJ \ficrograph o( I!/(' 51)'0°" ZII ,'IIIe(/oi'/ all''.l ,/eClllllpOI('d af--15 C. ,/roH'im: a {\\'O-p/I{/sc equiaxed ,{rflc/un'.
cd rapidly even at room temperature. thou~h occasionallyfoils were obtained that showed microstructures thou~ht torepresent the earliest sta~es of the decomposition proces(Fig. 7(a) ). These bear a remarkable resemblance to micro-~raphs published by Cahn and Charles 10 sho\\ in~ ~pinodaldecomposition in ~Iass (cl'. Fi~s. 7(a) and (h) }. The chan~e inmicrostructure observed as the decomposition temperature i~decreased is consistent with the hypothesis of Ganvood andHopkins.11 who proposed a change in the mode of decomposi-tion at ~ 100 C on the basis of kinetic measuremenh. Thecurrent experiments suggest that the critical temlleraturc forthe chan~e in a 59·0 at. "" alloy is near room temllerature.

Fig. 8 Part of the phase diagram of the Al-Zn system published inRe! (6), showing calculated spinodal curves6 and the experi-mental values for the coherent solubility curve obtained from thepresent work compared with "reversion" temperatures measuredby other workers.IB,I','O The dotted line is the proposed a/a.' co-herent solvlls.
25
60 70
"~3""\\'Q" \.\ \, \
'- \\ \
\ \+1\ \
\ \'\
'. \,I11"11I,
I + Johnson.Hu~hes, I.'and Barton I ,I
,012+ Carpenter and Garwood 11
3+ Lasek" 11
IX
10 20 30 40 SOAtomic Percent. Zinc
o
100
o
300
Du.. 200
~~•.0..E
f"-
Ardell, Nuttall, and Nicholson: Decomposition of Al-Zn Alloys400
(!J)
(.1)
Fig. 7 A comparison of (a) an earlier stage in the decomposition ofthe specimen in Fig. 6 and (b) a micrograph of spinodal decom-position in a glass.!6
DiscussionThere have been a number of attempts to relate the form
of the miscibility gap in the AI-Zn system to the metastablephase boundaries for G.P. zones and for 0('.1,3,17-21Thepossibility of spinodal decomposition has been implicit in thediscussion in several of these papers. We will now discussthese results in the light of the present observations.
Let us deal first with the non-eutectoid alloys. Comparingour results with those of Carpenter and Garwood,3 it is clearthat we are concerned with the decomposition of the high-temperature 0(phase into the aluminium-rich f.c.c. 0( solidsolution and the zinc-rich coherent rhombohedral 0(' phase,except for long ageing times at high temperatures, Fig. 4(d),where the latter phase is in its semi-coherent cubic form. Theexperiments clearly show the existence of "critical tem-peratures" in the nucleation behaviour of the decompositionproducts, and the re-ageing experiment (Fig. 3) indicates thatthese temperatures are to be identified with the coherent 0(/0('phase boundary rather than with the coherent spinodal. Themeasured critical temperatures for the three alloys are plottedin Fig. 8 which is taken in part from the paper by Rundmanand Hilliard6 and contains the chemical and coherent spinodalcurves calculated by these authors. (H should be pointed outthat the chemical spinodal curve has little meaning, since theearly stages of spinodal decomposition necessarily involve theproduction of coherent phases whereas the chemical spinodalrefers to non-coherent phases. Both spinodal curves are shownin Fig. 8 to illustrate the temperature depression of the co-herent spinodal with respect to the chemical spinodal causedby taking into account the elastic energy of the coherentphasesJ5).
At present it is not clear whether the rhombohedral formof the 0(' phase should be regarded as a second transition
phase or merely as the coherent form of the cubic 0(' transitionphase with the slight distortions of the lattice parametercaused by coherency strains. We shall assume that the latteris true, which means that the critical temperatures measuredcorrespond to the coherent phase boundary (as defined byCahnl5) for the 0(/0('phase equilibrium. As such, the measure-ments are in excellent agreement with "reversion" tempera-tures determined for a variety of alloys by Carpenter andGarwood2o and by Lasek 18 (Fig. 8), though in both casesthese authors interpreted their results in terms of the meta-stable solvus for G.P. zones rather than for 0('. However, it ispossible that there is only a small temperature difference be-tween these two and, furthermore, the present results suggestthat the heat-treatments used by Lasek 18would give a struc-ture consisting of rhombohedral 0(' rather than G.P. zones.The coherent 0(/0('phase boundary is also well positioned withrespect to the coherent spinodal calculated from thermo-dynamic data by Rundman and HilIiard.6 The critical points,which in theory should coincide, differ by only ~ 10 degC, andthis is further evidence for the correctness of our interpretation.However, it should be pointed out that substantially lower"reversion" temperatures have been reported by Borelius21and Johnson, Hughes, and Barton,'9 and their results cannotbe fitted to our curve in Fig. 8. These authors used indirectexperimental techniques, unsupported by metallographicevidence, and it is possible that they measured the G.P. zones-* 0(' transition (i.e. simply a less stable phase transformingto a more stable phase) which usually occurs in the range100-200° C on heating, rather than the true reversion of thestructure to a solid solution.
The question remains as to whether there is any evidenceof spinodal decomposition in the non-eutectoid alloys. Thereis no detectable change in the microstructure, (Fig. 3), nearthe calculated coherent spinodal temperature and we havealready seen that the apparent "modulated" structure is not
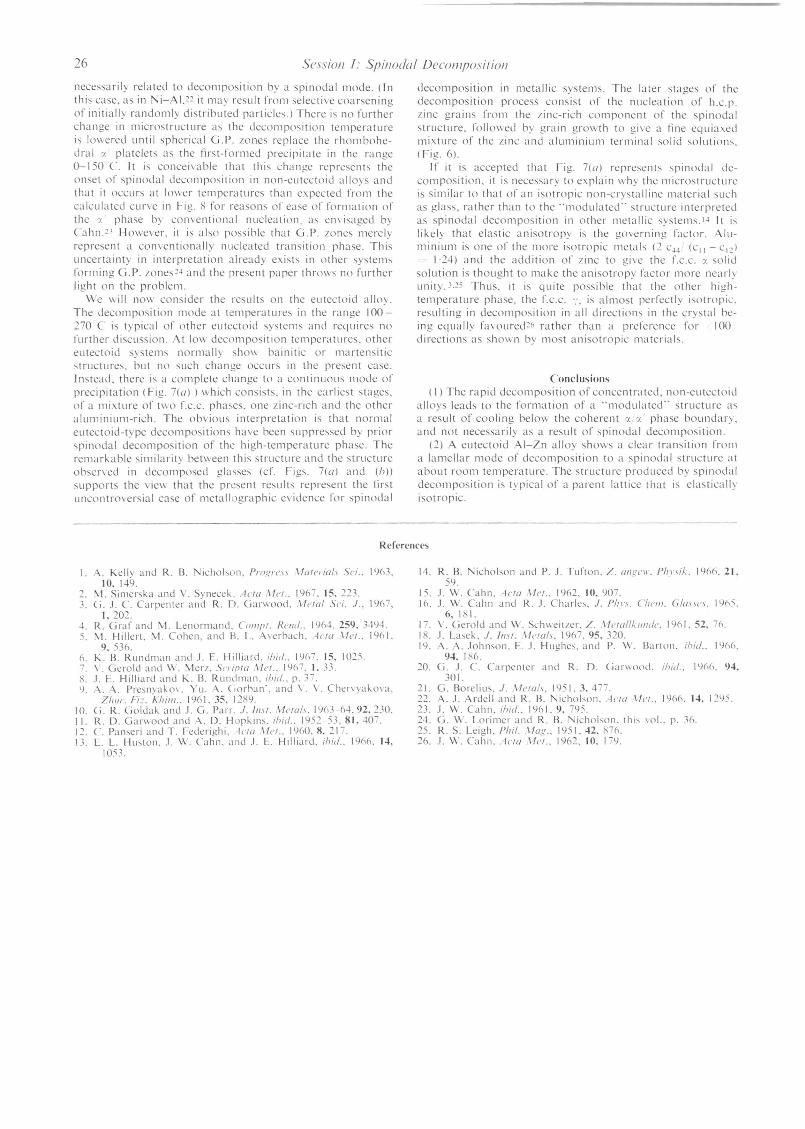
26 Sessio/l f: Spinoda/ Decolllposilion
necessarily related to decomposition by a spinodal mode. (Inthis case. as in Ni-AI.~~ it may result from selective coarseningof initially randomly distributed particles.) There is no furtherchange in microstructure as the decomposition temperatureis lo\\ered until spherical GY. zones replace the rhombohe-oral 'l. platelets as the first-formed precipitate in the range0-150 C. It is conceivable that this change represents theonset of spinodal decomposition in non-eutectoid alloys andthat it occurs at lower temperatures than expected from thecalculated curve in Fig. R for reasons of ease of formation ofthe 'l. phase b) cOll\entional nucleation, a~ ell\ isaged b)Cahn.23 However. it is also possible that G.!'. zones merelyrepresent a con\entionally nucleated transition phase. Thisuncertainty in interpretation already exists in other systemsforming G.P. zones~4 and the present paper throws no furtherlight on the problem.
We will nov\ consider the results on the eutectoid alloy.The decomposition mode at temperatures in the range 100-270 C is typical of other eutecroid systems and requires nofurther discussion. At low decomposition temperatures, othereutecroid systems normally sho\\ bainitic or martensiticstructures. but no such change occurs in the present case.lnstead. there is a complete change to a continuous mode ofprecipitation (Fig. 7(a) ) which consists. in the earliest stages,of a mixture of t\\ 0 Lc.c. phases, one zinc-rich and the otheraluminium-rich. The obvious interpretation is that normaleuteclOid-type decompositions have been suppressed by priorspinodal decomposition of the high-temperature phase. Theremarkable similarity between this structure and the structureobserved in decomposed glasses (cf. Figs. 7(a) ane! (h»supports the vie\\' that the present results represent the firstuncontroversial case of metallographic evidence for spinodal
decomposition in metallic systems. The later stages of thedecomposition process consist of the nucleation of h.c.p./inc grains from the zinc-rich component of the spinodalstructure. follo\\·ed by grain growth to give a fine equiaxedmixture of the zinc and aluminium terminal solid solutions.(Fig. 6).
If it is accepted that Fig. 7(11) represents spinodal de-composition. it is necessary to explain why the microstructureis imilar to that of an isotropic non-crystalline material suchas glass. rather than to the "modulated" structure interpretedas spinodal decomposition in other metallic systems.14 It islikely that elastic anisotropy is the governing factor. Alu-minium is one of the more isotropic metals (2 e44 (ell - CI~)
1·24) and the addition of zinc to give the f.c.c. 'l. solidolution is thought to make the anisotropy factor more nearl)
unity.3.~5 Thus. it is quite possible that the other high-temperature phase. the Le.c. ':. is almost perfectly isotropic.resulting in decomposition in all directions in the crystal be-ing equally favourecl~n rather than a preference for 100directions as sho\\ n by most anisotropic materials.
Conclusions(I) The rapid decomposition of concentrated. non-eutectoid
alloys leads to the formation of a "modulated" structure asa result of cooling below the coherent Cl. 'l. phase boundary,and not necessarily as a result of spinodal decomposition.
(2) A eutectoid AI-Zn alloy shows a clear transition froma lamellar mode of decomposition to a spinodal structure atabout room temperature. The structure produced by spinodaldecomposition is typical of a parent lattice that is elasticall)isotropic.
Reference!>
1. A. Kcll} and R. B. Nichoblln. Prugre.ls I/merial.1 Sei .. 1963.10. 1~9.
2. M. Simcrska and V. Synccck. ACI{/ .l/er .. 1967.15.223.3. G. J. C. CarpcIlIcr and R. D. Garwood, ,Hew/ Sei. J., 1967,
1.202.~. R. Graf and M. Lcnormand. ('''I/lpl. Helld .. 196~. 259. 3~94.5. \1. Hillcn. M. Cohen. and 13. L. A\crbach, .~ela 111'1.. 1%1.
9. 536.6. K. B. Rundman and .I. E. Hilliard. ihid .. 1967. IS, 102S.7. \'. Gcrold and W. Mcr/. SCl'lr"a Mer .. 1967, I. 33.~. J. E. Hilliard and K. B. Rundlllan. ihid .. p. r.9.. -\. A. Prc,n)a~o\. Vu. A. (,orban', and \. \. Chcl'\)ako\a.
ZII/lr. Fi:. KI;il/l .. 1961,35. 1289.10. G. R. Goldak and .I. G. Parr. J. 111.11. ,l/ef{i/.,. 1963 M, 92. 230.I I. R. D. Gal'\\ ood and A. D. Hopkin,. ihid .. 1952 53. 81• .+07.12. C. Pan,cri and T. Fcdcrighi. ~ew .l/er .. 1960. 8. 217.13. E. L. Huston . .I. W. Ca 1111.and .I. E. Hilliard. ihid .. 196(1. I~.
1053
14. R. B. 'icholson and P. .I. Tufton. Z. alll[ell'. Ph'·li". 1960.21.59.
15. .I. W. Cahn, .·ICla .l/er., 1962. 10.907.10. .I. W. Calll1 and R. .I. Charles, J. Ph".I. ('hel/l. G/{/I,I(',I. I96S.
6. 181.17. \'. Gerold and W. Sch\\ciIZCr. Z .. l/ewffhallile. 1961.52.76.18. .I. Lao;ck, J. 111.\1. 111'101.,. 1967.95.320.19. r\. A . .Iohn,on. E. .I. HlIghcs, and P. \0\'. Banon. ihid .. 1966.
94. 186.20. G . .I. C. Carpenter and R. D. Gal'\\ood. ihid., 1966. 9~.
301.21. G. Borelills. J. ,l/elOls, 1951.3.477.22. A . .I. Ardcll and R. B. Nicholson. ACla .I.[er., 1966•• 4, 129S.23. J. W. Cahn. ihid .. 1961. 9. 795.24. G. W. Lorimcr and R. B. T'ichol,on. thi, \ 01.. p. 30.25. R. S. Leigh. Phi!. \fag., 1951.42.876.26. .I. \0\'. Cahn .. ~Cla \1er .. 1962, 10. 179.
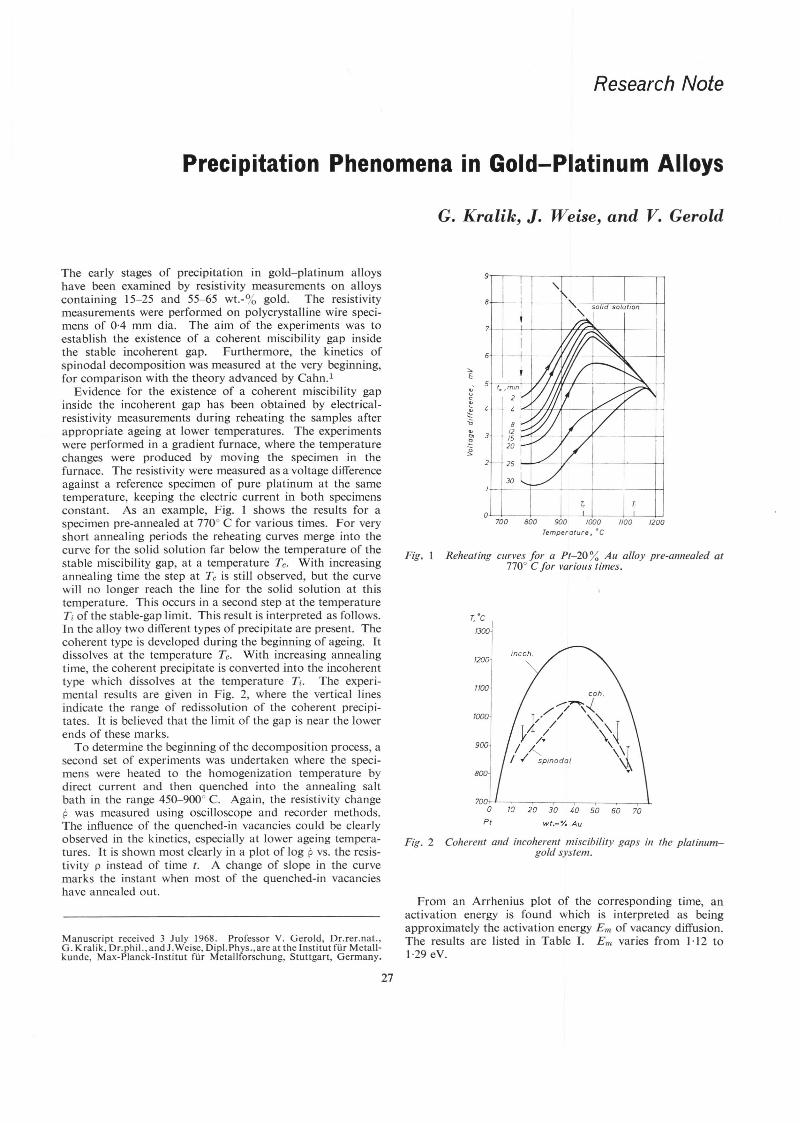
Research Note
Precipitation Phenomena in Gold-Platinum Alloys
G. Kralik, J. Weise, and V. Gerold
From an Arrhenius plot of the corresponding time, anactivation energy is found which is interpreted as beingapproximately the activation energy Em of vacancy diffusion.The results are listed in Table 1. Em varies from 1·12 to1·29 eV.
T,'c I/300"
Coherent and incoherent miscibility gaps ill the platinum-gold system.
900 1000 1100 1200Temperature J ·C
la 20 30 1,0 50 60 70
wt.-% Au
/lOO
1200
9
8
,.E~u
~::;:;; 8~
3/2
'" /5~ 20:g2 25
30
0700
Reheating curves for a Pt-20"/. Au alloy pre-annealed at7700 C for various times.
Fig. 2
Fig. I
Manuscript received 3 July 1968. Professor V. Gerold, Dr.rer.nat.,G. Kralik, Dr.phil.,andJ.Weise, DipI.Phys.,are al the !nstitut flir Metall-kunde, Max-Planck-lnstitut flir Metallforschung, Stuttgart, Germany.
The early stages of precIpitation in gold-platinum alloyshave been examined by resistivity measurements on alloyscontaining 15-25 and 55-65 wt.-% gold. The resistivitymeasurements were performed on polycrystalline wire speci-mens of 0·4 mm dia. The aim of the experiments was toestablish the existence of a coherent miscibility gap insidethe stable incoherent gap. Furthermore, the kinetics ofspinodal decomposition was measured at the very beginning,for comparison with the theory advanced by Cahn.1
Evidence for the existence of a coherent miscibility gapinside the incoherent gap has been obtained by electrical-resistivity measurements during reheating the samples afterappropriate ageing at lower temperatures. The experimentswere performed in a gradient furnace, where the temperaturechanges were produced by moving the specimen in thefurnace. The resistivity were measured as a voltage differenceagainst a reference specimen of pure platinum at the sametemperature, keeping the electric current in both specimensconstant. As an example, Fig. 1 shows the results for aspecimen pre-annealed at 7700 C for various times. For veryshort annealing periods the reheating curves merge into thecurve for the solid solution far below the temperature of thestable miscibility gap, at a temperature Te. With increasingannealing time the step at Te is still observed, but the curvewill no longer reach the line for the solid solution at thistemperature. This occurs in a second step at the temperatureTi of the stable-gap limit. This result is interpreted as follows.In the alloy two different types of precipitate are present. Thecoherent type is developed during the beginning of ageing. Itdissolves at the temperature Te. With increasing annealingtime, the coherent precipitate is converted into the incoherenttype which dissolves at the temperature Ti. The experi-mental results are given in Fig. 2, where the vertical linesindicate the range of redissolution of the coherent precipi-tates. It is believed that the limit of the gap is near the lowerends of these marks.
To determine the beginning of the decomposition process, asecond set of experiments was undertaken where the speci-mens were heated to the homogenization temperature bydirect current and then quenched into the annealing saltbath in the range 450-9000 C. Again, the resistivity changep was measured using oscilloscope and recorder methods.The influence of the quenched-in vacancies could be clearlyobserved in the kinetics, especially at lower ageing tempera-tures. It is shown most clearly in a plot of log p vs. the resis-tivity p instead of time t. A change of slope in the curvemarks the instant when most of the quenched-in vacancieshave annealed out.
27
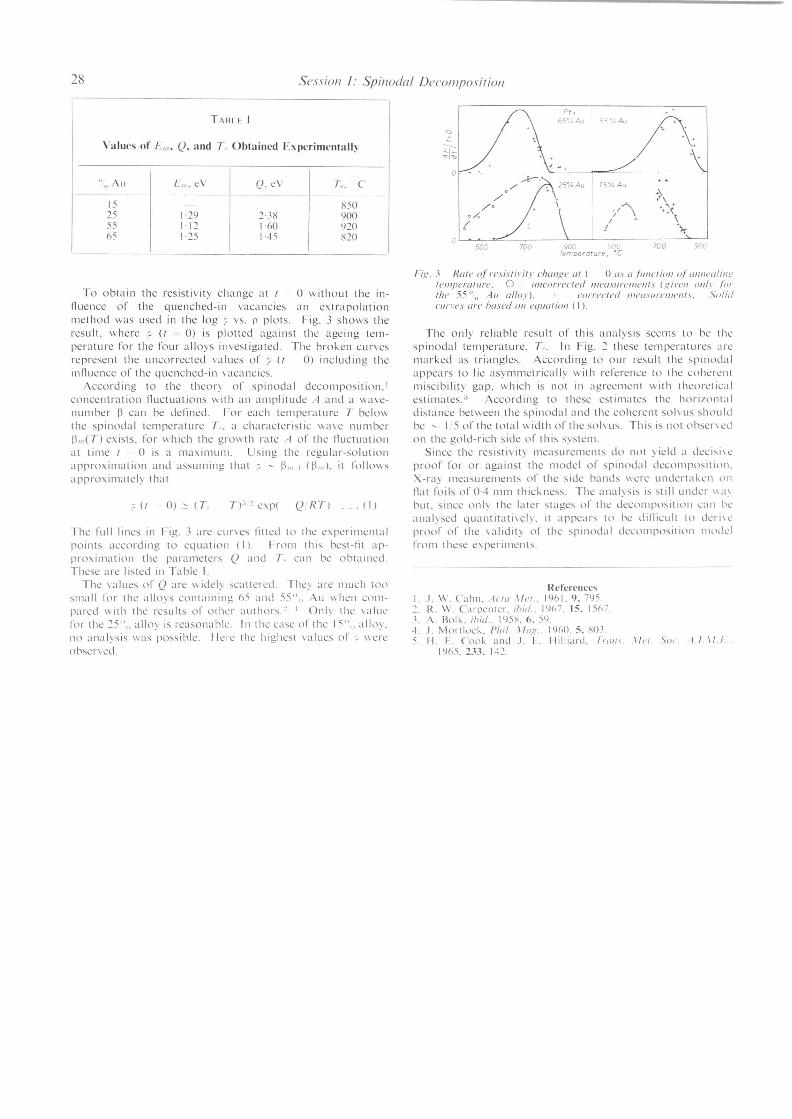
28 Session I: Spinodal Decolllposilion
TARI!: I
Values of Lm• Q, and L Obtained Experimentall~
"n All Lw. eV Q. eV T .. C-
15 R5025 [·29 nx 90055 [·12 1·60 92065 [·25 1-45 820 n
500 700
Pt.65~o Au
15%Au
900 sno-emoerature. °c
700
The full lines in Fig. 3 are cUJ'\es filled to the e,perimentalpoints according to equatioll (I). hOIll this best-fit ap-pro,imation the parameter, Q and T. can be obtained.These ;II-c listed in Ta ble I.
The \;liues of Q are" idely scallered. The) arc much too"mall for the alloys containing 65 ;Ind 55"" Au "hen com-pared \\ ith the results of olhcl' authors.~ , Only the "liuefor the 25"" alloy is reason;lblc. In the case of the 15"" allo),no analysis was possible. Ilcre the highest "liucs of ~ \\ereobser\ed.
To obtain the resistivity change at / 0 without the in-lluence of the quenched-in vacancies an extrapolationmethod was used in the log ~ vs. p plots. Fig. 3 shows theresult, where ~ (t 0) is plotted against the ageing tem-perature for the four alloys investigated. The broken curvesrepresent the uncorrected values of ~ (t 0) including theinlluence of the quenched-in \acancies.
According to the theory of spinodal decomposition.'concentration lluctuations "ith an amplitude A and a \\a\e-number 13can be defined. For each temperature T belo"the spinodal temperaturc T.. a characteristic "a\e number13m(T) e'(ists. for which the growth rate A of the lluctuationat time / 0 is a maximum. Using the regular-solutionapprtnimation and assuming that ~ ~ 13", I ([3",). it follo"sappro'(imatel) that
n" ~e,p( Q Rn . (I)
FiR. 3 Ra/I' ofresislil'ill' cl/(I/Ige al t 0 as a fil/lcrio// Or{//II/('ali//~II'I//{JI'I'{/I/(I'I'. 0 III/Co/TI'Cled //l('a.VIIrl'lI/c//ls (>:irl'// o//h forIhl' 55"" A tl aI/Ill'). COITalI'd 1I/('aSllrl'lI/t'//I.I. Solidc//n'('S are hosed 0// ('(1/f(llio/1 (I).
The only reliable result of this analysis seems to be thespinodal temperature. T.. In Fig. :'. these temperatures arcmarked as triangles. According to our result the spinodalappears to lie asymmetrically with rererence to the coherentmiscibility gap. which is not in agreement \\ ith theoreticalestimates." According to these estimates the horiLl)lltaldistance between the spinodal and the coherent soh us shouldbe ~ I 5 of the total" idth of the soh us. This is not obseJ'\ cdon the gold-rich side of this system.
Since the resistivity measurements do not) ield a decisi\eproof for or against the model of spinodal decomposition.X-ray measurements of the side bands \\ere underta"en onllat foils of 0-4 mm thic"ness. The anal)sis is still under \\a)but. since only the later stages of the decomposition can beanalysed quantitati\ely. it appears to be diflicult to tleri\cproof of the \alidity of the spinodal decomposition nllldelfrom these e,periments.
I~cfcrellc('"I .. 1. W. Ca 1111. Acla III'I .. 1%1.9.795., R. W. Carpenter. ibid., 1%7. IS, 1567.3. /\. Bolk. (hid .. 195X. 6. 59.--1.J. Mortlock. Phil. II1Ig., 1960.5. X03.5. 11. 1-.. Cook and J. L. Ililliard. h"l/I .. 11,,1. Soc .. 1.1. \1.1
196-.233. 1--12.
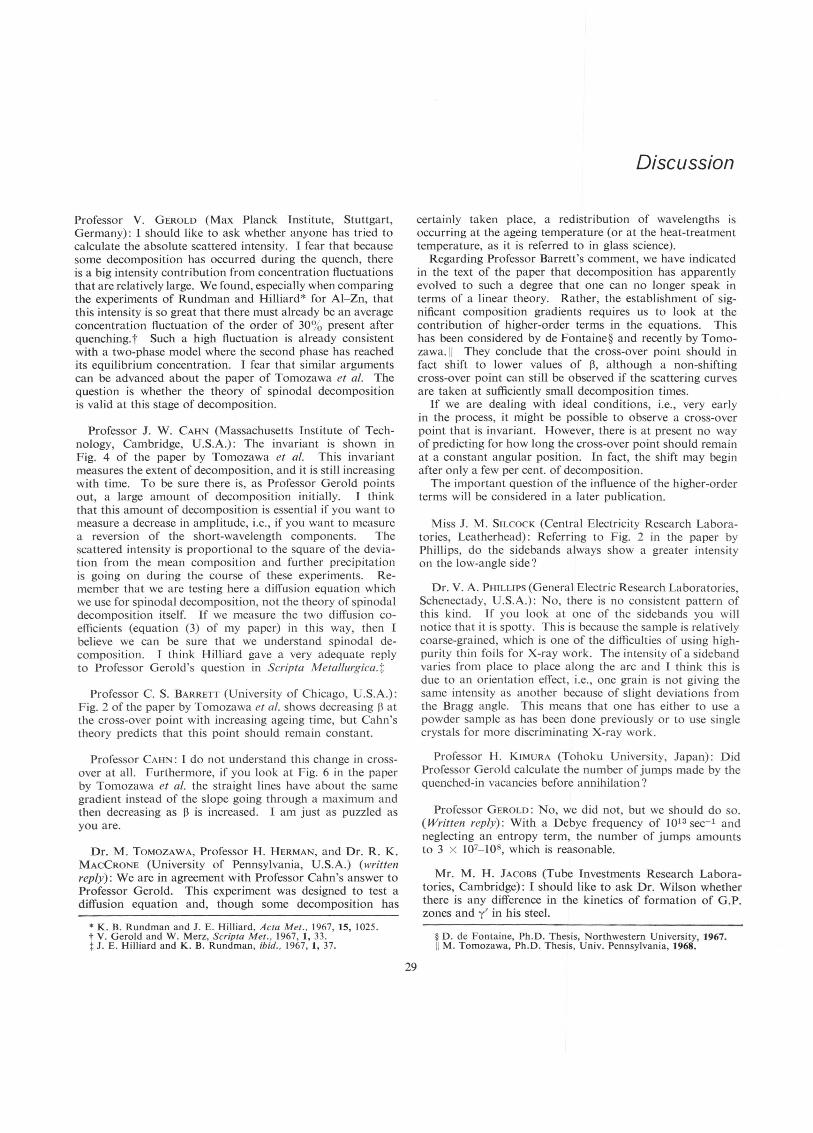
Professor V. GEROLD (Max Planck Institute, Stuttgart,Germany): I should like to ask whether anyone has tried tocalculate the absolute scattered intensity. 1fear that becausesome decomposition has occurred during the quench, thereis a big intensity contribution from concentration fluctuationsthat are relatively large. We found, especially when comparingthe experiments of Rundman and Hilliard* for Al-Zn, thatthis intensity is so great that there must already be an averageconcentration fluctuation of the order of 30% present afterquenching. t Such a high fluctuation is already consistentwith a two-phase model where the second phase has reachedits equilibrium concentration. 1fear that similar argumentscan be advanced about the paper of Tomozawa et al. Thequestion is whether the theory of spinodal decompositionis valid at this stage of decomposition.
Professor J. W. CAHN (Massachusetts Institute of Tech-nology, Cambridge, U.S.A.): The invariant is shown inFig. 4 of the paper by Tomozawa et at. This invariantmeasures the extent of decomposition, and it is still increasingwith time. To be sure there is, as Professor Gerold pointsout, a large amount of decomposition initially. I thinkthat this amount of decomposition is essential if you want tomeasure a decrease in amplitude, i.e., if you want to measurea reversion of the short-wavelength components. Thescattered intensity is proportional to the square of the devia-tion from the mean composition and further precipitationis going on during the course of these experiments. Re-member that we are testing here a diffusion equation whichwe use for spinodal decomposition, not the theory of spinodaldecomposition itself. If we measure the two diffusion co-efficients (equation (3) of my paper) in this way, then Ibelieve we can be sure that we understand spinodal de-composition. J think Billiard gave a very adequate replyto Professor Gerold's question in Scripta Metal/urgica.t
Professor C. S. BARRETT (University of Chicago, U.S.A.):Fig. 2 of the paper by Tomozawa et al. shows decreasing ~ atthe cross-over point with increasing ageing time, but Cahn'stheory predicts that this point should remain constant.
Professor CAHN: I do not understand this change in cross-over at all. Furthermore, if you look at Fig. 6 in the paperby Tomozawa et al. the straight lines have about the samegradient instead of the slope going through a maximum andthen decreasing as ~ is increased. I am just as puzzled asyou are.
Dr. M. TOMozAwA, Professor H. HERMAN, and Dr. R. K.MACCRONE (University of Pennsylvania, U.S.A.) (writtenreply): We are in agreement with Professor Cahn's answer toProfessor Gerold. This experiment was designed to test adiffusion equation and, though some decomposition has
• K. B. Rundman and J. E. HiIliard, Acta Met., 1967,15, 1025.t V. Gerold and W. Merz, Scripta Met., 1967, 1,33.t J. E. Hilliard and K. B. Rundman, ibid., 1967,1,37.
Discussion
certainly taken place, a redistribution of wavelengths isoccurring at the ageing temperature (or at the heat-treatmenttemperature, as it is referred to in glass science).
Regarding Professor Barrett's comment, we have indicatedin the text of the paper that decomposition has apparentlyevolved to such a degree that one can no longer speak interms of a linear theory. Rather, the establishment of sig-nificant composition gradients requires us to look at thecontribution of higher-order terms in the equations. Thishas been considered by de Fontaine§ and recently by Tomo-zawa.1I They conclude that the cross-over point should infact shift to lower values of ~, although a non-shiftingcross-over point can still be observed if the scattering curvesare taken at sufficiently small decomposition times.
If we are dealing with ideal conditions, i.e., very earlyin the process, it might be possible to observe a cross-overpoint that is invariant. However, there is at present no wayof predicting for how long the cross-over point should remainat a constant angular position. In fact, the shift may beginafter only a few per cent. of decomposition.
The important question of the influence of the higher-orderterms will be considered in a later publication.
Miss J. M. SILCOCK (Central Electricity Research Labora-tories, Leatherhead): Referring to Fig. 2 in the paper byPhillips, do the sidebands always show a greater intensityon the low-angle side?
Dr. V. A. PHILLIPS(General Electric Research Laboratories,Schenectady, U.S.A.): No, there is no consistent pattern ofthis kind. If you look at one of the sidebands you willnotice that it is spotty. This is because the sample is relativelycoarse-grained, which is one of the difficulties of using high-purity thin foils for X-ray work. The intensity of a sidebandvaries from place to place along the arc and I think this isdue to an orientation effect, i.e., one grain is not giving thesame intensity as another because of slight deviations fromthe Bragg angle. This means that one has either to use apowder sample as has been done previously or to use singlecrystals for more discriminating X-ray work.
Professor H. KIMURA (Tohoku University, Japan): DidProfessor Gerold calculate the number of jumps made by thequenched-in vacancies before annihilation?
Professor GEROLD: No, we did not, but we should do so.(Written reply): With a Debye frequency of 1013 sec-1 andneglecting an entropy term, the number of jumps amountsto 3 X 10⁷-108, which is reasonable.
Mr. M. H. JACOBS (Tube Investments Research Labora-tories, Cambridge): I should like to ask Dr. Wilson whetherthere is any difference in the kinetics of formation of G.P.zones and y' in his steel.
§ D. de Fontaine, Ph.D. Thesis, Northwestern University, 1967.11 M. Tomozawa, Ph.D. Thesis, Univ. Pennsylvania, 1968.
29
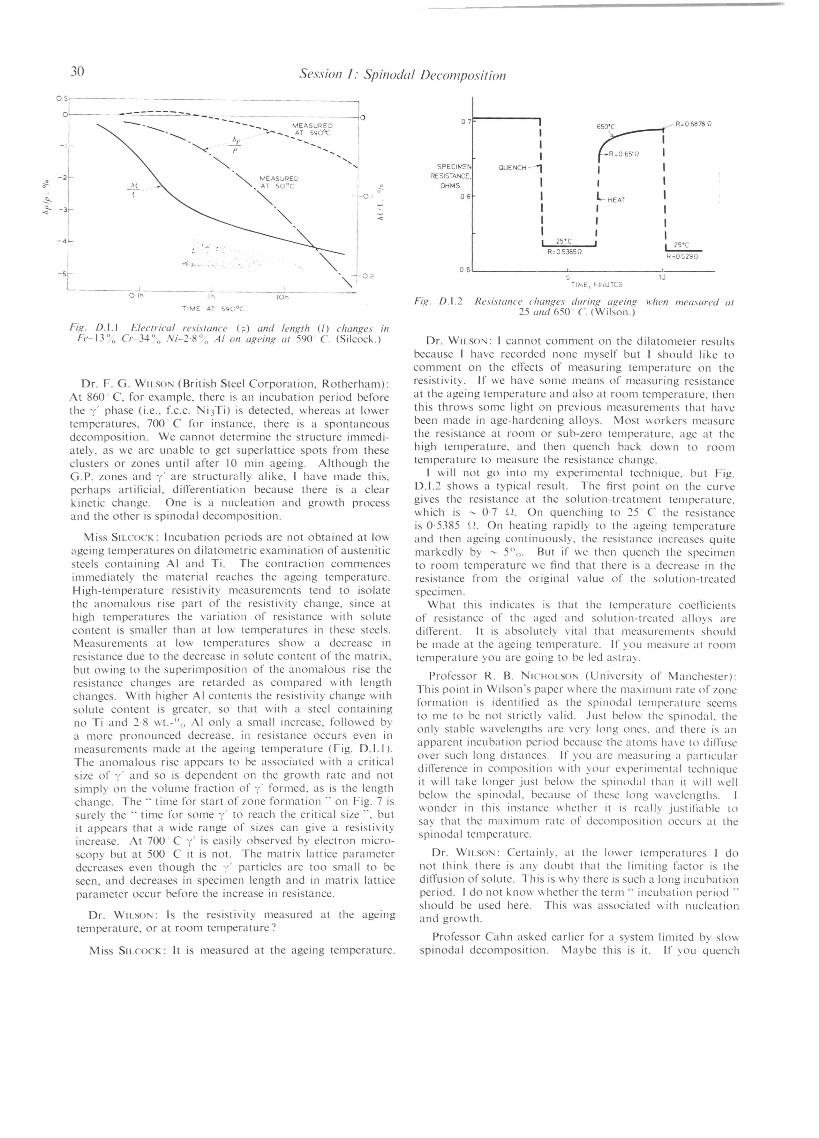
0 07
I650'C R"06B78Q
I III R"0651Q I
SPECIw.:::r>l QUENCH 4 I IRESISTANCE.
I IOHMS I06 I LHEAT t
I J II I II J II 25'C ~R"O 5385Q
R"0529()
055 10
TH"E) tv.1IlU T[~
Fi/(. 0.1.2 Re:';is{(J//ce clulll/(es dl/rin/( aRein/( when /ueuslIred at25 lInd 650 C. (Wilson.)
- .•..........••.
Session I: Spinodal Decomposition
IOh-~----
-- - ----_ MEASURED"':;..-__ ...AT 5900C
II h
TIME AT 590°C
.rj ~ "~'.:-.
.It(
IO-rh
30
05
0
-I
t- -2~
..s- -J"-~
:JFig. 0.1.1 Electrical resistance (F) and lengTh (/) changes in
Fe-13"o Cr-34°o Ni-2·go" AI on ageing aT 590 C. (Sileock.)
Dr. F. G. W'LSON (British Steel Corporation. Rotherham):At 860 C. for example, there is an incubation period beforethe y' phase (i.e., Lc.c. NijTi) is detected. whereas at lowertempcratures. 700 C for instance, there is a spontaneousdecomposition. We cannot determine the structurc immedi-ately. as we are unable to get superlattice spots from theseclusters or zones until after 10 min ageing. Although thcG.P. zones and y' are structurally alike, I have made this.perhaps artificial, differentiation because there is a clcarkinetic change. One is a nucleation and growth processand the other is spinodal decomposition.
Miss SILCOCK: Incubation periods are not obta ined at lowageing temperatures on dilatometric examination of austeniticsteels containing AI and Ti. The contraction commcncesimmediately the material reaches the ageing temperature.High-temperature resistivity mcasurements tend to isolatethe anomalous rise part of the resistivity change, since athigh temperatures the variation of resistancc with solutecontent is smaller than at 10\\ temperatures in these steels.Measurements at low temperatures show a decreasc inresistance due to the decrease in solutc content of the matrix,but owing to the superimposition of the anomalous rise theresistance changes are retarded as compared with lengthchangcs. With higher AI contents the resistivity change withsolute content is greater, so that with a steel containingno Ti and 2·8 wt.-"" AI only a small increase. followed bya more pronounced decrease. in resistance occurs even inmeasurements madc at the ageing temperature (Fig. 0.1.1).The anomalous rise appears to be associated with a criticalsizc of y' and so is dependent on the growth ratc and notsimply on the volume fraction of y' formed, as is thc Icngthchange. The" time for start of zone formation .. on Fig. 7 issurely the" time for some y' to reach the critical size ". butit appears that a wide range of sizes can give a resistivityincrease. At 700 C y' is easily observed by electron micro-scopy but at 500 C it is not. The matrix lattice parameterdecreases even though the y' particles are too small to beseen, and decreases in specimen length and in matrix latticeparameter occur before the increase in resistance.
Or. WILSON: Is the resistivity measured at the ageingtemperature, or at room temperature ')
Miss S'LCOCK: It is measured at the ageing temperature.
Or. W'LSON: I cannot comment on the dilatometer resultsbecause I have recorded none myself but I should likc tocomment on thc eA'ects of measuring temperature on theresistivity. If we have some means of measuring resistanceat the ageing tcmperature and also at room temperaturc. thenthis throws some light on previous measurements that havcbeen made in age-hardening alloys. Most workers measurethe resistance at room or sub-zero tcmperature. age at thchigh temperature. and then quench back down to roomtemperature to measure the resistance changc.
I will not go into my experimental technique. but Fig.D.1.2 shows a typical result. The first point on the curvcgives the resistance at the solution-treatment tcmpcraturc.which is - 0·7 il. On quenching to 25 C the resistanceis 0'5385 n. On heating rapidly to the agcing tcmpcratureand thcn ageing continuously, thc resistance increases quitemarkedly by - 5°". But if we then quench thc spccimento room temperature we find that thcre is a dccrcase in theresistance from the original valuc of the solution-treatedspecimen.
What this indicates is that the tcmperaturc coefficicntsof resistance of the aged and solution-treated alloys arcdifferent. It is absolutely vital that measurcments shouldbe made at the ageing temperature. If you mcasure at roomtempcrature you are going to bc Icd astray.
Professor R. B. NICHOLSON (Univcrsity of Manchcstcr):This point in Wilson's papcr where thc maximum ratc of zoncformation is identified as the spinodal tcmperature secmsto mc to be not stricti} valid. Just bclow the spinodal, thconly stable wavclengths arc very long oncs. and thcrc is anapparent incubation period because thc atoms ha\c to diffuscover such long distances. If you arc mcasuring a particulardifference in composition with your experimcntal tcchniqueit will take longer just below thc spinodal than it will wcllbelow the spinodal, becausc of thcsc long wavclengths. Iwonder in this instancc whether it is really justifiablc tosay that thc maximum rate of decomposition occurs at thcspinodal tempcrature.
Dr. WILSON: Certainly, at the lower tcmperaturcs I donot think there is any doubt that thc limiting factor is thcdiO'usion of solutc. This is why thcrc is such a long incubationperiod. I do not know whether thc term" incubation period ..should be used here. This was associated with nuclcationand growth.
Professor Cahn asked earlier for a system limited by slov.spinodal decomposition. Maybe this is it. If you quench

Discussion 31to a low enough temperature, of the order of 400 or 5000 C, theresult is that there is a slow zone formation. If you lookat corresponding thin foils, you cannot see any precipitationor any zone formation. For instance, at 5000 C after~ 1000 min, which corresponds to the maximum resistivity,there is no indication of the presence of zones. This pointis not really made clear by Miss Silcock's interpretation of theresistivity results.
Professor CAHN: Hilliard, Ruston, and I wrote a paper* onspinodal decomposition during continuous cooling andpart of this paper was the calculation of a C curve for thespinodal. There is a simple formula:t
!!T 2RT----Ts Q
where I! T is the undercooling below the spinodal at the noseof the C curve, Ts is the spinodal temperature, and Q is theactivation energy for diffusion. If you apply that formulato Fig. 7 of Wilson's paper you come up with a figure forQ of ~ 70 000 calories. This is quite a reasonable valuefor diffusion.
Dr. P. WILKES (University of Manchester): I should liketo ask Professor Cahn if it is possible to regard spinodaldecomposition and G.P. zone formation as limiting cases ofnucleation and growth? G.P. zone formation would thenbe when the nuclei are very small, and spinodal decompositionwould arise when the nuclei do not have a definite boundarybut a diffuse interface. Is it possible to look at it meaningfullyin this way?
Professor CAHN: No, I do not think so. But I do thinkG.P. zones are quite possibly spinodal decomposition wayoff on one side of the phase diagram. It is spinodal decom-position, but with a very small volume fraction. In thatregion the diffusion coefficient is changing very rapidlybecause, after all, it changes sign at the spinodal and youcannot use the simple linear solution for very long. De Fon-tainei has done a diffusion calculation for spinodal decom-position in the immediate vicinity of the spinodal when itis well to one side of the phase diagram. The solution de-
• E. L. Huston, J. W. Cahn, and J. E. Hilliard, Acta Met., 1966,14, 1053.
t J. W. Cahn, Trans. Met. Soc. A.I.M.E., 1968,242, 166.t D. de Fontaine, loc. cit.
composes asymmetrically and he gets computer results whichare very much like G.P. zones.
There is quite a distinction between nucleation and growthcompared with spinodal decomposition. This goes backall the way to Gibbs; he in fact looked at spinodal decom-position first. He simply considered the possibility of whatis necessary for a phase to be metastable. He found thatoutside the spinodal the phase could be metastable; a secondphase could form eventually but there was some barrierto its formation. Inside the spinodal, however, there wasno such barrier; the decomposition was quite simple. Ithink it is much simpler than nucleation and growth. Theinstant you get outside the spinodal you have to look fora barrier, diffusion is normal (i.e., it is positive), and so thesituations are quite distinct. I do not think there is anysimilarity.
Mr. R. D. GARWOOD (University of Cardiff): I wonderif Professor Nicholson is quite certain that continuousrecrystallization and/or grain growth of the quenchedZn-AI eutectoid alloy does not occur at room temperature.I think that the structure shown in Fig. 6 of the paper byArdell et al. may be the result of a secondary process takingplace after the alloy has transformed by a discontinuousor cellular reaction.
Professor NICHOLSON: No, if one is very successful with thequench and the spinodal process has not gone very farby the time the specimen is put in the microscope, it doesdecompose in a lamellar way starting at the surface of thespecimen and one gets a very fine lamellar decompositionproduct. This is quite stable as lamellae, so I do not thinkthat the structure in Fig. 6 is produced by spheroidization.
Professor CAHN: Is it possible that for the non-eutectoidalloys, one is crossing the spinodal at almost the same timeas the coherent phase boundary?
Professor NICHOLSON: Yes, I think it is perfectly possible.The two curves could be within ~ 5 or 10 degC of each other.I agree that this could well be an explanation of the modu-lated structures of the non-eutectoid alloys. This closeproximity of the two curves is well illustrated by ProfessorGerold's paper. We could only say from our experimentsthat we had crossed the coherent phase boundary but wemay well have crossed the spinodal at the same time.
Session //
Nucleation in Solids: (A) Brief Survey;(B) Cellular Precipitation*
l\... V. T" and D. Tllrnbull
According to simple nucleation theory the frequency ofhomogeneous nucleation of l.Instrained 13should be related tov" by the equation
Manuscript rccei\cd I April 1968. K. , . ~u._ Ph. D .. and Prot'essor D.Turnbull, Ph. D., are In the D,vh,on 01 Engineering and AppllcdPh)sics, Harvard Univcrsity, Cambridge. Mass .. U.S.A.:+. This section or th~ paper \\US prcs~ntl'd and discussed in Session VI.
The simple theory for nucleation in solid solid trans-formations is briefly surveyed, with special emphasis onthe key role of crystallographic misfit. Observations onthe development of the lamellar morphology of tinprecipitated from lead tin solid solutions are reviewedand interpreted.
I::. I/,·.r~k I exp [ /> (a,,)" (6G',.)~kTJ volume I timc '. (I)
\\herc 1/,. is the number of atoms per unil volumc in the '/phase . .r is the molc fraction of Ij composition in 'l.. f", is thejump frequenc) across the x 13interface. 6(;,. is the change inGihhs free energy in Ihe transformation per unit volume,/> is a constant depending on the shape of the nucleus. and itis supposed that v" is constant over the surface of thenucleus. Thus. the nucleation frequency falls as the exponen-tial of the cube of G".
The predictions of this simple theor) for the efrect of misfiton the nuclealion frequenc) have heen described else\\ here.'· 1..-,
The t(cneral conclusion is that for all but the smallest mi,fits(e.t(. - < 2 3"" d,lferences in atomic ;racin~,) quite largedepartures from equilibrium should be required for measur-ahle homogeneous nucleation of IlIls/millet! rl in 'l.. When tbemisfit is vcr) large. homogeneous nucleation should ,ometime,not he measurable under any condition.., 0\\ ing to negligibl)small values of /, I at the depar·tures fronl equilibrium ,-equiredfor appreciable \alues of the e'ponential term in v, ,.
The structural contribution to the interfacial tension canbe greatly reduced or eliminated entirely" hen the I> and it'>surroundint( matri" arc suitably strained. Thi.., crrect i,~robabl) tl;e most common moti\ation 1'01' the de\elopmentof transformation strains. At small values of the equilibriummisfit 8. the Jl nucleus is likel) to forn1 coherentl) since thestrain energ) required to eliminate the ,tructural part of v,-.\\hich rises rapidl) "ith '~al low 8. is n:latively small.
When 13 forms incoherently the ma~nitude of the trall'>-formation strains that develop \\ ill depend on the rates ofinterface or diirusion processes relative to the rates of strainrei ief by processes such as clisloca t ion g.enerat ion and move-ment and vacann di,rusion. For example. in precipitationprocesses onc of ~he principal methods for relievin~ strain isby diffusion of vacancies to the interface. If precipitation i..,lim ited by d ifrusion ,ia a \ aca ncy mecha n ism, appreciabletransformation strains are not likely to arise during nucleationsince the time constant for relieving them will be of the sameorder as that for precipitation. Ho\\ever. if the precipitation"ere efreeted by rapid interstitial difrusion from a dilutesolution. large transformation strains could develop in thenucleation and early growth stage.
Cahn and Hilliard'; showed that the chemical part of theinterfacia I tension should va n ish wit h in the com posi t ion rangedelineated by the spinodal curves. Thus, \\ithin this rangethere should be no thermodynamic barrier to the initiation ofprecipitation on a relatively fine scale. The departures from
comprehen,ively andhere ,ome features of
Brief Suneyrevie\\ed this suhject
present authol s surveyChristian I hascritically. The>pecial interest.
In a first-order solid-state I'hase change.'/ Il. the modeof transformation and the departure from equilihriumrequired for a mea,urahle rate of initial formation of Il \\ ithinperfectl) crystalline 'l. arc expected to depend criticall) uponthe cl"\slallographic misfit be(\;\een the t\"Cl pha,es. More,peciti~all)'. i~l those precipitation pmcesses in \\hich there isa continuit) of state, bet\\een 'l. and 13.the range of condition>\\ here the spinodal mode is possihle should be greater thesmaller is the misfit. In nucleation and gnl\\th processes thedeparture from equilibrium required for measurable homo-t(eneous nucleation of fl should, on the hasis of nucleation~heol'). rise sharply \\ith mi,f1t. These crrects reflect thee\pected marked dependence on misfit of coherenC) strainenergy and of the interfacial tcnsion, G", bct'H:en l.Instrained'l. and fl.
The variation of v,·. \\ ith misfit has been deduced fromdislocation models for interphase houndaries.~·:l Where themisflt is very large or the dislocation model is inapplicable. ithas been inferred intuitively that the magnitude of v" \\ illapproxima te tha t of the tension of h igh-a ngle gra in bounda riesin the x or 13phase. I I' the compositions of 'l. and Il arc d ifl'erent,there may be a chemical. v('~,. as \\ell as a misfit contribution.v·'~,. to the interfacial tension. For small misfits \\e expectthat'
32

Tu and Turnbull: Nucleation in Solids 33
equilibrium required to reach the spinodal range increaserapidly at all compositions with increasing misfit. Cahn7 hasdeveloped the theory for this effect.
In summary, simple nucleation theory seems to rule outmeasurable homogeneous nucleation in first-order solid-statephase changes at small departures from equilibrium and evenat extremely large departures from equilibrium for thenucleation of phases that are partly or wholly incoherent. Wesuppose that the nucleation which, in fact, usually occursquite close to equilibrium in these cases is heterogeneous innature. The common heterogeneous nucleation sites in solid-state transformations are free surfaces, grain and interphaseboundaries, grain edges and corners, and dislocations.Heterogeneous nucleation is recognized by its localization atthese sites and sometimes by its scale, since the spacing ofheterogeneities in well-annealed crystals is not likely to be< 10f.im.
Experience on the effect of misfit on the kinetics of solid-state transformations appears to be in qualitative agreementwith the predictions of simple nucleation theory. However,the interpretation of results is sometimes complicated bydifficulty in distinguishing between resistance to the formationor to the motion of the interface in transformations.8 Forexample, the fc.c. -* h.c.p. transformation in cobalt does notoccur at a measurable rate in small single crystals even thoughthe misfit across the close-packed planes is very slight. Itappears that the high resistance to transformation in this caseresults from the unavailability of dislocations which are re-quired for motion of the interface at appreciable rates. Thismay also be the explanation for the high resistance of smallsingle crystals of fc.c. iron alloys to the interior nucleation ofthe b.c.c. phase at low temperatures, though here the rela-tively large misfit should also make homogeneous nucleationdifficult.
A more definitive assessment of the role of misfit innucleation can be made from experience on phase changes attemperatures high enough for substitutional diffusive mech-anisms of interface motion and strain relief to occur atappreciable rates. Most experience of this sort is from studiesof the precipitation of substitutional solutes from solid solu-tion and it is in qualitative agreement with the prediction thatthe resistance to both homogeneous nucleation and spinodaldecomposition should increase sharply with increasing misfit.For example, the spinodal mechanism occurs readily insystems such as AI_Zn9,lO and Au-Pt,9 in which the misfitis relatively small. However, the Au-Ni system,9 in which themisfit is large, exhibits a very high resistance to the homo-geneous initiation of precipitation.
Studiesll of the kinetics of precipitation of cobalt fromdilute solutions of cobalt in copper indicate that the nuclea-tion frequency is negligible at small deviations from equi-librium, but it rises sharply to large values when the super-saturation ratio rises to values above 1·5-2-0. Cobalt particledensities of 1012_1017jcmS are reached. This large particledensity and its mode of development are characteristic of acopious homogeneous process, which is expected for thissystem in view of the small misfit of < 2 %.
On the other hand, it appears that the nucleation of phasesthat fit poorly with their parent solutions is infrequent andgenerally heterogeneous in nature even at large departuresfrom equilibrium. For example,12 the nucleation of the dia-mond cubic phase of silicon from dilute solutions of siliconin aluminium apparently occurs only heterogeneously, at leastat all supersaturation ratios < lQ-20. Another example isnucleation of the tetragonal phase of tin from fc.c. solutions of
tin in lead, which is localized principally at interfaces withinthe solution under most conditions.
After this brief survey of the general subject of nucleationin solids, we now turn to a more specific topic: the nucleationand growth at grain boundaries of precipitate lamellae whichgive rise to cellular precipitation.
Cellular PrecipitationIn cellular precipitation a semi-coherent preCIpItate
generally of the equilibrium phase, forms at a solid-solution(ex) grain boundary which is carried along by the growingprecipitate.1s The precipitate usually takes the form of separ-ated parallel lamellae, grouped into colonies or cells. Precipi-tate growth can be and often is effected almost wholly by thediffusion of solute along the moving cell boundary which is atthe same time an ex-ex grain boundary. The boundary may alsoplay a key role in facilitating the nucleation of the precipitate.
Two of the principal questions about the process are: howis it initiated at the grain boundary, and what is the mech-anism whereby the multiplication of lamellae occurs to forma given colony?
The investigations made of the crystallographic orientationrelations in the process indicate that a given set of parallellamellae within a colony exhibit a single and well-definedcrystallographic orientation and habit with respect to thesolid-solution grain in which they are embedded. Forexample, Speichl4 reported that Ni3Ti lamellae precipitatefrom an austenitic Fe-Ni-Ti alloy with the habit (lll)y andthe orientation relation (OO1)NisTi 11 (lllh and [010]NisTI 11[I1O]y. We have found15,16(a) that the habit plane of tinlamellae precipitated from Lc.c. lead-rich solutions is one ofthe {Ill} planes of the lead and the orientation relation is[OOl)sn 11 <llO>Pb and {31O}sn 11 {Ill }Pb. This relation wasmanifested by a sharp single-crystal Laue pattern, which alsoindicates that on Iy one of the four sets of {Ill }Pb planes andone of the three <11O>Pbdirections are selected by a particularfamily of parallel lamellae. Often, however, two or morefamilies of lamellae, with mutually perpendicular habits, areobserved on (IOO)Pb within a single cell.
The lamellae in a single family may have formed eitherfrom a single initial lamella by a branching mechanism or bythe nucleation in the special orientation of each individuallamella in the family. It appears, for example, that a branch-ing mechanism is principally responsible for the lamellationwithin a pearlite colony.l7 However, our microscopicobservations15,16(b) on the formation of tin cells from lead-tinsolutions strongly support the conclusion that in this caseeach member of a family of lamellae nucleates individuallyat the boundary. The evidence is as follows: (I) In the earlystages of precipitation many lamellae in the special orienta-tion appear, rather widely separated and with no apparentinterconnection, along the grain boundary. (2) Several of theearliest members of a family of lamellae extend all the wayback from the cell boundary to its starting position. (3) Nointerconnections between lamellae were observed in thesuccessive surfaces exposed as a cell was sectioned.
A family of tin lamellae appears to develop by the followingsequence.16(b) (I) A tin particle nucleates along the boundaryin the special orientation relation with one (say ex 1) of thesolid-solution grains forming the boundary. This means thatthe boundary (it was a symmetrical tilt-type boundaryseparating grains misoriented by rotation through an angle earound a [100) axis) must have been deformed locally to aposition parallel with the habit plane of ex 1 since it will not, onthe average, lie in the special position. This deformation may
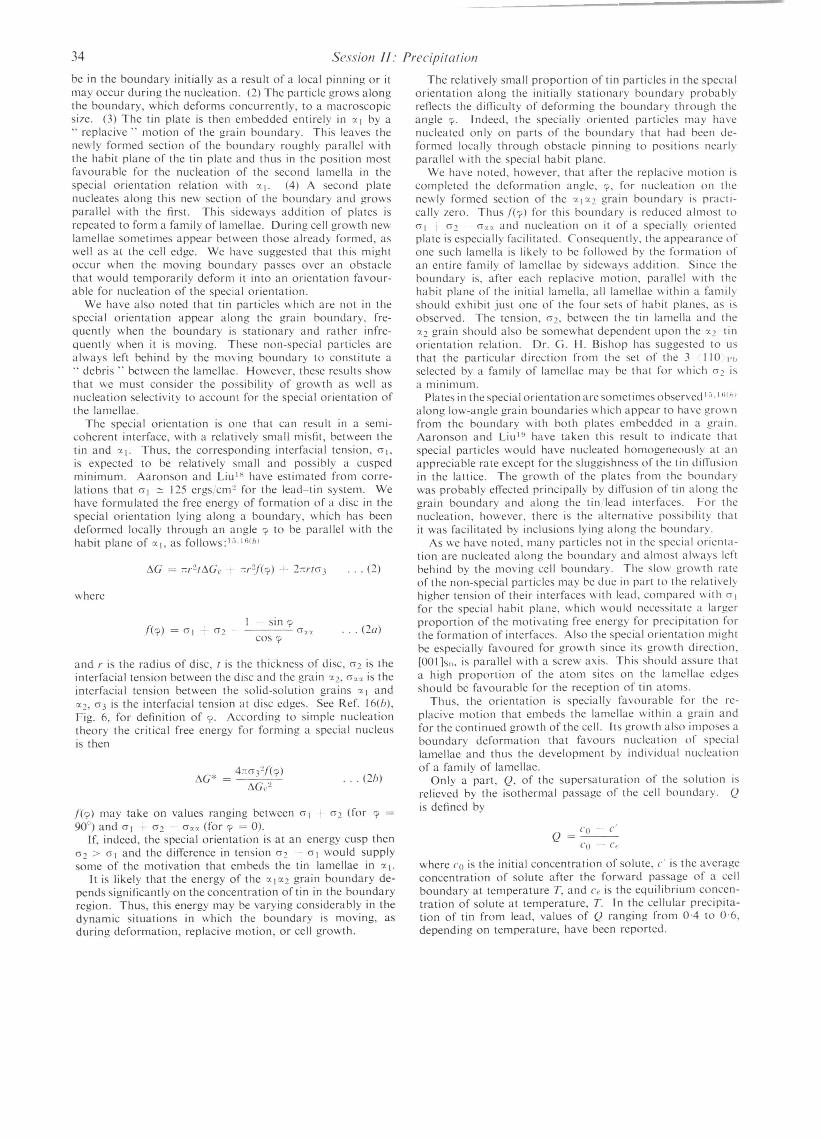
34 Session 11: Precipilal ion
and r is the radius of disc, r is the thickness of disc, (Jl is theinterfacial tension between the disc and the grain "Xl, Gn is theinterfacial tension between the solid-solution grains '1.1and(£2,G3 is the interfacial tension at disc edges. See Rer. 16(b),Fig. 6, for definition of 9. According to simple nucleationtheory the critical free energy for forming a special nucleusis then
/(",) may take on values ranging between GI . Gl (for <;> =90°) and GI T (J2 - G." (for 9 = 0).
If, indeed, the special orientation is at an energy cusp thenG2> G\ and the difference in tension Gl - GI would supplysome of the motivation that embeds the tin lamellae in "Xl.
Jt is likely that the energy of the '1.1(£2grain boundary de-pends significantly on the concentration of tin in the boundaryregion. Thus, this energy may be varying considerably in thedynamic situations in which the boundary is moving, asduring deformation, replacive motion, or cell growth.
be in the boundary initially as a result of a local pinning or itmay occur during the nucleation. (2) The particle grows alongthe boundary, which deforms concurrently, to a macroscopicsize. (3) The tin plate is then embedded entirely in '1.1by a.. replacive .. motion of the grain boundary. This leaves thenewly formed section of the boundary roughly parallel withthe habit plane of (he tin plate and thus in the position mostfavourable for the nucleation of the second lamella in thespecial orientation relation with "X\. (4) A second platenucleates along this new section of the boundary and growsparallel with the first. This sideways addition of plates isrepeated to form a family of lamellae. During cell growth newlamellae sometimes appear between those already formed, aswell as at the cell edge. We have suggested that this mightoccur when the moving boundary passes over an obstaclethat would temporarily deform it into an orientation favour-able for nucleation of the special orientation.
We have also noted that tin particles which are not in thespecial orientation appear along the grain boundary, fre-quently when the boundary is stationary and rather infre-quently when it is moving. These non-special particles arealways left behind by the moving boundary to constitute a.• debris" between the lamellae. However, these results showthat we must consider the possibility of growth as well asnucleation selectivity (0 account for the special orientation ofthe lamellae.
The special orientation is one that can result in a semi-coherent intcrface, with a relatively small misfit, bctween thetin and "XI. Thus, the corresponding interfacial tension, GI,is expected to be relatively small and possibly a cuspedminimum. Aaronson and Liu18 have estimated from corre-lations that Gt :::: 125 ergs/cm~ for the lead-tin system. Wehave formulated the free energy of formation of a disc in thespecial orientation lying along a boundary, which has beendeformed locally through an angle 9 to be parallel with thehabit plane of "XI, as follows;1'>.J(;(bl
Co c'
Co - Cl'Q
where Co is the initial concentration of solute, c· is the averageconcentration of solute after the forward passage of a cellboundary at temperature T, and Cl' is the equilibrium concen-tration of solute at temperature, T. In the cellular precipita-tion of tin from lead, values of Q ranging from 0-4 to 0,6,depending on temperature, have been reported.
The relatively small proportion of tin particles in the specialorientation along the initially stationary boundary probablyrenects the difficulty of deforming the boundary through theangle ,? Indeed, the specially oriented particles may havenucleated only on parts of the boundary that had been de-formed locally through obstacle pinning to positions nearlyparallel with the special habit plane.
We have noted. however. that after the replacive motion iscompleted the deformation angle. 9, for nucleation on thenewly formed section of the '1.1'1.2grain boundary is practi-cally zero. Thusf(?) for this boundary is reduced almost to(JI ~ G2 G,,, and nucleation on it of a specially orientedplate is especially facilitated. Consequently. the appearance ofone such lamella is likely to be followed by the formation ofan entire family of lamellae by sideways addition. Since theboundary is, after each replacive motion, parallel with thehabit plane of the initial lamella, all lamellae within a famil)should exhibit just one of the four sets of habit planes. as isobserved. The tension. Gl, between the tin lamella and the'1.1grain should also be somewhat dependent upon the '1.2 tinorientation relation. Dr. G. H. Bishop has suggested to usthat the particular direction from the set of the 3 110 1'1.>
selected by a family of lamellae may be that for which G2 isa mllllm um.
Pia tes in the special orienta t ion are somet imes observed \~.IIi(hl
along low-angle grain boundaries which appear to have grownfrom the boundary with both plates embedded in a grain.Aaronson and Liul9 have taken this result to indicate thatspecial particles would have nucleated homogeneously at anappreciable rate except for the sluggishness of the tin diO'usionin the lattice. The growth of the plates from the boundar)was probably effected principally by diffusion of tin along thegrain boundary and along the tin lead interfaces. For thenucleation, however. there is the alternative possibility thatit was facilitated by inclusions lying along the boundary.
As we have noted. many particles not in the special orienta-tion are nucleated along the boundary and almost always leftbehind by the moving cell boundary. The slow growth rateof the non-special particles may be due in part to the relativelyhigher tension of their interfaces with lead, compared with GIfor the special habit plane, which would neccssitate a largerproportion of the motivating free energy for precipitation forthe formation of interfaces. Also the special orientation mightbe especially favoured for growth since its growth direction,[OOI]sn, is parallel with a screw axis. This should assure thata high proportion of the atom sites on the lamellae edgesshould be favourable for the reception of tin atoms.
Thus, the orientation is specially favourable for the re-placive motion that embeds the lamellae within a grain andfor thc continued growth of the cell. Its growth also imposes aboundary deformation that favours nucleation of speciallamellae and thus the development by individual nucleationof a family of lamellae.
Only a part, Q. of the supersaturation of the solution isrelieved by the isothermal passage of the cell boundary. Qis defined by
... (2)
... (2b)
... (2a)sin 9
----Gncos 9
4;-:G3Y(<;»
!'J.C,.~!'J.C*
/(cp) = G\ -:- Gl
where
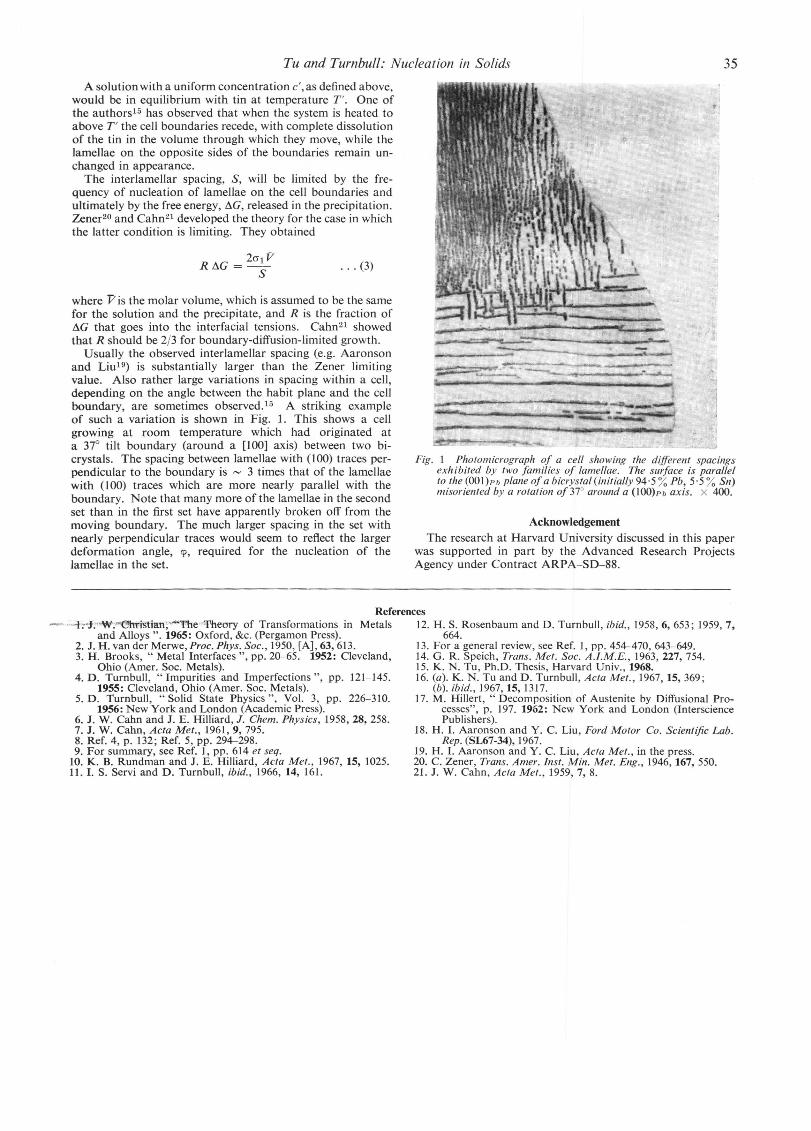
Tu and Turnbull: Nucleation in Solids 35
A solution with a uniform concentration c', as defined above,would be in equilibrium with tin at temperature T. One ofthe authors15 has observed that when the system is heated toabove T the cell boundaries recede, with complete dissolutionof the tin in the volume through which they move, while thelamellae on the opposite sides of the boundaries remain un-changed in appearance.
The interlamellar spacing, S, will be limited by the fre-quency of nucleation of lamellae on the cell boundaries andultimately by the free energy, !3.G, released in the precipitation.Zener20 and Cahn21 developed the theory for the case in whichthe latter condition is limiting. They obtained
... (3)
where V is the molar volume, which is assumed to be the samefor the solution and the precipitate, and R is the fraction of!3.G that goes into the interfacial tensions. Cahn21 showedthat R should be 2/3 for boundary-diffusion-limited growth.
Usually the observed interlamellar spacing (e.g. Aaronsonand Liu19) is substantially larger than the Zener limitingvalue. Also rather large variations in spacing within a cell,depending on the angle between the habit plane and the cellboundary, are sometimes observed.15 A striking exampleof such a variation is shown in Fig. I. This shows a cellgrowing at room temperature which had originated ata 37° tilt boundary (around a [100] axis) between two bi-crystals. The spacing between lamellae with (lOO) traces per-pendicular to the boundary is ~ 3 times that of the lamellaewith (lOO) traces which are more nearly parallel with theboundary. Note that many more of the lamellae in the secondset than in the first set have apparently broken off from themoving boundary. The much larger spacing in the set withnearly perpendicular traces would seem to reflect the largerdeformation angle, '1', required for the nucleation of thelamellae in the set.
,.... ---.JFig. 1 Photomicrograph of a cell showing the different spacings
exhibited by two families of lamellae. The surface is parallelto the (OOI)Pb plane of a bicrystal (initially 94·5 % Pb, 5·5 % Sn)misoriented by a rotation of 37° around a (I00)Pb axis. X 400.
AcknowledgementThe research at Harvard University discussed in this paper
was supported in part by the Advanced Research ProjectsAgency under Contract ARPA-SD-88.
ReferencesMetals 12. H. S. Rosenbaum and D. Turnbull, ibid., 1958,6,653; 1959,7,
664.13. For a general review, see Ref. 1, pp. 454-470, 643-649.14. G. R. Speich, Trans. Met. Soc. A.l.M.E., 1963,227,754.15. K. N. Tu, Ph.D. Thesis, Harvard Univ., 1968.16. (a). K. N. Tu and D. Turnbull, Acta Met., 1967, 15, 369;
(b). ibid., 1967,15,1317.17. M. Hillert, "Decomposition of Austenite by Diffusional Pro-
cesses", p. 197. 1962: New York and London (IntersciencePublishers).
18. H. I. Aaronson and Y. C. Uu, Ford Motor Co. Scientific Lab.Rep. (SL67-34), 1967.
19. H. I. Aaronson and Y. C. Liu, Acta Met., in the press.20. C. Zener, TraIlS. Amer. Inst. Min. Met. Eng., 1946,167,550.21. J. W. Cahn, Acta Met., 1959,7,8.
:-";f:-"W";,""<fui"istian;"""'TheTheory of Transformations inand Alloys ".1965: Oxford, &c. (Pergamon Press).
2. J. H. van der Merwe,Proc. Phys. Soc., 1950, [A], 63, 613.3. H. Brooks, " Metal Interfaces ", pp. 20-65. 1952: Cleveland,
Ohio (Amer. Soc. Metals).4. D. Turnbull, "Impurities and Imperfections ", pp. 121-145.
1955: Cleveland, Ohio (Amer. Soc. Metals).5. D. Turnbull, "Solid State Physics ", Vo!. 3, pp. 226-310.
1956: New York and London (Academic Press).6. J. W. Cahn and J. E. Hilliard, J. Chem. Physics, 1958,28,258.7. J. W. Cahn, Acta Met., 1961,9,795.8. Ref. 4, p. 132; Ref. 5, pp. 294-298.9. For summary, see Ref. 1, pp. 614 et seq.
10. K. B. Rundman and J. E. Hilliard, Acta Met., 1967, 15, 1025.11. I. S. Servi and D. Turnbull, ibid., 1966, 14, 161.
The Nucleation of Precipitatesin Aluminium AlloysG. iJ. Lor;mPI' alld R. B. SicllOlsoll
G.P. zones . 'i..,r
A ;\;ucication \>1 od clWc consider a solid solution A Bin \\hich the precipitation
sequence IS:
where -, and ;:Jarc the t\\O terminal solid solutions and G.P.lones, defined as a stable coherent segregate of B atoms inthe A matrix, arc formed as a transition precipitate. SinceG.P. /ones are less stable than ~:J.the concentrations of thetwo solid solutions in equilihrium with the t\\O phases issuch that 'i.',,,, ;;- 'i.,,, •.
Neglect in!! G. P. /one format ion and considering on I) thenucle;tion I~'cqucncy llf the ::Jphase /'" classical nucleationtheory predicts that the /, is given h)
. .. (I)Q",)o/ ,
\\here "'I is a factor that includes the \acanc) concentration;J.(I,.' is the activation energ) required to form the critical-si/cdnucleus ofdiametertl,.: kThas its usual meaning: and Q,,,. theacti\'ation energy for migration of solute ato illS. is involvedbccause the formation of::J in an 'i. matri, neccssaril) requireschanges in composition. Equation (I) is ohtained from aconsi'dera t ion of the free-energy changes in\ oh cd in nucleal inga [:J particle in an 'i. matrix by the formation of transientB-rich se!!re!!ates in the -, matrix to build up a .. quasl-steady -sta'te .~ distribution of embr) os. Because of the rapidred uct ion of the \ alue of J.(i " as the supersa tu 1''1 t ion i increases(i = cc:. \\here c is the solute content of the alloy andc:' is the equilibrium concentration at a temperature TL thenucleation rate is aver) st rang function of the supersaturat Ion,as sho\\ n in Fig. I. It is conventional to define a criticalsupersaturation i,· (or undercooling. J. T,.. from the solvustemperature T ,) where the homogeneous nucleation ratebecomes si!!nificallt in the context of the e'periment. Inthe present 'case homogeneous nucleation becomes importantif it exceeds the rate of heterogeneous nucleatIon. particularlyon dislocations. Typically, a quenched crystal contains10H 10" clll.cm :101' dislocation lines. The nucleation densityis of the order of 10" I 0" part icles per cm of d islocat ion andnucleation is complete in - 10:' sec. This gives a criticalnucleation rate for homogeneous nucleation. I"~", of- 101:' particles cm :1 sec i. In systems \\here the precipitatehas a similar crystal structure and lattice parameter to thematrix, the value of J.C~ is small and sensihle honKlgeneousnucleation rates can be obtained with undercoolings of the
A new theory of preCIpItate nucleation is developed.The basic features of the theory are the growth ofG.P. zones at low ageing temperatures and the abilityof these to transform to precipitates when the ageingtemperature is suddenly raised. The theory explainsall the major phenomena observed in homogeneouslydistributed precipitates in aluminium alloys, includinggrain-houndary structures and the effects of multipleheat-treatments. Examples are given from the systemsAl Cu and Al Ge.
Manuscript rceei\ed 24 April I%g. Professor R .. B. Nieholson. M.A ...Ph.D .. ano G. W. Lorimer B.A.Se.. Ph.I) .. are rn the I)epartment 01Mdallurgy, Faculty of S<.:icncc.Unl\Cr!'oil: of Nlanchcstcr.
The classical Iheon of nucleation of a phase transformation\\as developed 1'01:a vapour ·Iluid change but has heenpresented in modilied form for ~I solid . solid change.1
While the them) i., 'iuccessful in making quantitative pre-dictions about the nucleation rate in some 'iimple syslems.e.g. Cu Co,:' it is able 10 deal onl) qualitatively \\ith thee1l-ects of lattice defects and it has also failed to predictthe complexities obsened in the formalIon llf the so-called.. homogeneous" precipitates in age-hardening alloy s. Thelatter failure has been particularl) noticeable in the lastfe\\ veal's as a result of \\llrk on precipitate structures neargrail~ houndaries and the in\estigation of multi-stage heat-treatments.:t '. It has become ,~pparent that the normal., homogeneous" precipitation. and hence the normalproperties of an alloy, can he varied over a very wide rangeh\ seemin!!lv insignificant chan!!es in heat-treatment procedureil~ ~l \\a) -tl;at \\-ould not be ~xpected from the applicationof classical nucleation theory to the problem.
In the present paper we outline the development of ideasexpressed in earlier papers b) Embury and Nicholson" andLorimer and icholson7 and appl) them to a ne\\ stud)of precipitation in AI Ge and the hest-kno\\n of all age-hardening systems, AI-Cu.
ExperimentalThe \\ork \\as carried out using AI 3·9 \\t.-"" Cu and
A I 4·5 \\ 1.-"" Gc a Iloys prepared from superpurity-basealuminium. * The AI Cu system precipitates the \Veil-knownG.P. Lones, I)" and f)', as transition phases before the equi-librium () (CuAh). In the AI Ge system the diamond cubicGe precipitate is· preceded only by G.P. Lones.lll
• 1 he authors arc graterul to the BrillSh Aluminium Co. ResearchLahoralorics for sUJ1J1I~ing these allo~ •..•.
:16