the massachusetts financial services sector€¦ · · 2014-06-06the massachusetts financial...
TRANSCRIPT

A Complete Portfolio – Partners in Managing Assets and Fostering Innovation As of November 2013
The Massachusetts Financial Services Sector


1
Boston Financial Services Leadership Council
The Boston Financial Services Leadership Council, formed in 2010, brings together executives from the Boston financial services community with academic partners to advocate for the sector in Massachusetts, to shape relevant state and national policy, and to establish regional and global partnerships to support Boston’s role as a global finance center.
Association Partners

The Massachusetts Financial Services Sector Report was produced on behalf of the Boston Financial Services Leadership Council by:
About PwC US: PwC US helps organizations and individuals create the value they’re looking for. We’re a member of the PwC network of firms in 157 countries with more than 184,000 people. We’re committed to delivering quality in assurance, tax and advisory services. Tell us what matters to you and find out more by visiting us at www.pwc.com/US. Gain customized access to our insights by downloading our thought leadership app: PwC’s 365™ Advancing business thinking every day. Learn more about PwC by following us online: @PwC_LLP, YouTube, LinkedIn, Facebook and Google +.
Mass Insight Global Partnerships: Mass Insight creates competitive advantage for Massachusetts’ organizations through leadership groups, policy initiatives and partnerships that expand market opportunities. Key Initiatives include:
• Boston Financial Services Leadership Council. The Boston Financial Services Leadership Council, formed in 2010, brings together executives from the Boston financial services community with academic partners to advocate for the sector in Massachusetts, to shape relevant state and national policy, and to establish regional and global partnerships to support Boston’s role as a global finance center. The CEO-led Council is committed to advocating for national policy reform to improve the effectiveness of retirement savings programs and extend these programs to all Americans.
• Global Partnerships. Mass Insight and the council are working with Governor Deval Patrick and his administration to support the Commonwealth trade missions and expand partnerships with other major finance centers including London, Beijing, Shanghai and San Paolo.
• Advanced Cyber Security Center. A cross-sector collaboration hosted by the MITRE Corporation to address the most critical and sophisticated cyber security challenges.
Mass Insight Education is a nationally recognized non-profit affiliate which organizes education reform initiatives to raise math and science achievement and turn around failing schools.
© 2013 PricewaterhouseCoopers LLP, a Delaware limited liability partnership. All rights reserved. PwC US refers to the US member firm, and PwC may refer to either the PwC network of firms or the US member firm. Each member firm is a separate legal entity. Please see www.pwc.com/structure for further details.

In the Fall 2010, Mass Insight and PwC issued our first Financial Services Sector impact report. With new data for 2012, we are pleased to report continued progress for this critical sector in Massachusetts.
Massachusetts financial services firms are a key pillar of the state’s economy. Indeed, the financial services sector is a significant contributor to Gross State Product (GSP) of the five most clearly defined sectors and a major provider of jobs, tax revenue, and financing for business growth.
Mass Finance—our shorthand for the full range of businesses in financial services—represents a remarkable portfolio:
From community banks lending to small businesses…to venture capital and private equity funding the innovations in life sciences and technology…to global asset managers, mutual funds and insurance companies investing money and managing risk for businesses, institutions and individuals, in the region and around the world.
The opportunity for growth lies in helping to solve national—and global—retirement savings and risk management challenges as people live longer and need more savings and better investment choices—and institutions, businesses and government need more sophisticated ways to manage risk. The Boston Financial Services Leadership Council’s CEOs and executives are committed to new national policies to expand access to retirement savings in the U.S. and to help emerging countries like China build their own version of retirement and risk management systems. In doing so, Massachusetts firms will create the opportunities to grow our talent, our products, and our track record to compete for the management of these expanding national and global savings.
This economic impact report developed with the assistance of PwC attests to the strength of Mass Finance, which supports more than 165,000 direct jobs, including a leading share of middle-income, middle-class positions in our companies.
• Boston and the state’s financial services sector, which was the founder of venture capital and mutual funds, continues to be a national leader in these areas, as well as in asset management and insurance, and is a surprising and growing competitor with Connecticut in hedge funds.
• Mass Finance is the region’s window on the world. Along with our universities and teaching hospitals and our reputation for innovation, the sector is our most significant global network as our firms are hired by China and other countries to manage their new assets.
Finally, it’s important to note the exceptional civic leadership role that Boston’s financial services firms and executives play. Mass Insight has organized leadership for 20 years. One constant factor has been the participation of financial services executives who, due to the nature of their business supporting communities across all sectors, instinctively understand the importance of civic leadership.
William H. Guenther Chairman, CEO and Founder Mass Insight Global Partnerships November 2013
A letter from the Chairman of Mass Insight Global Partnerships
4
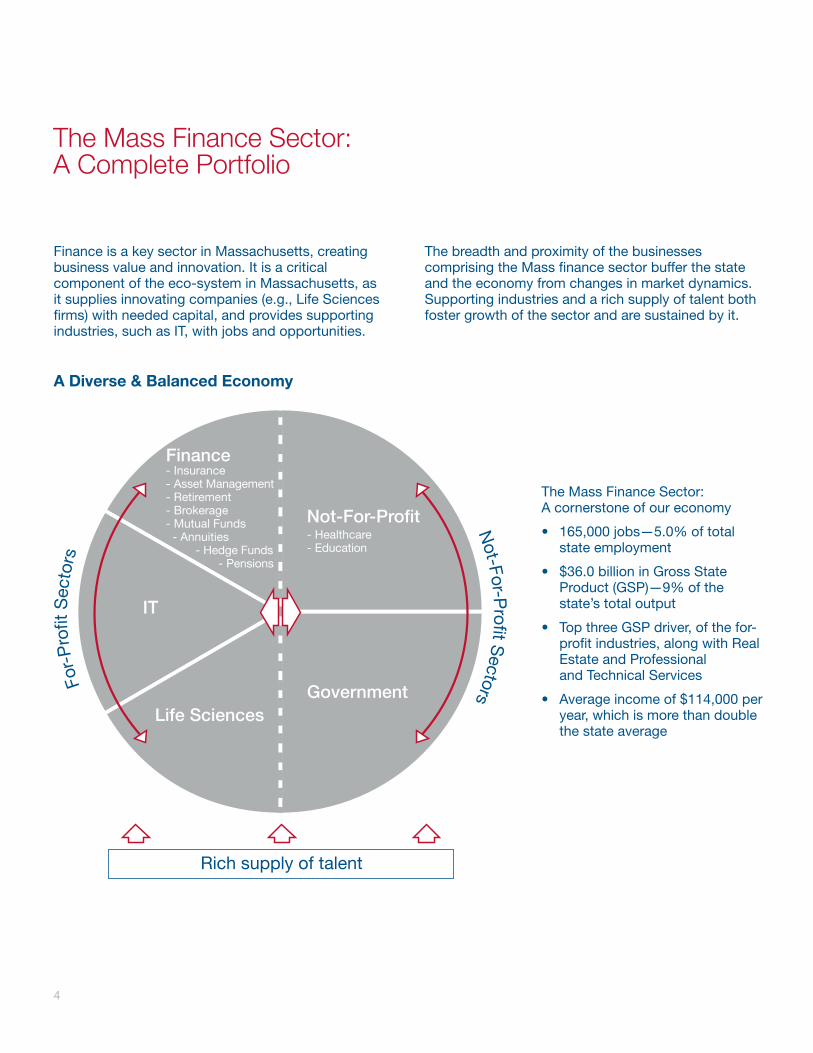
The Mass Finance Sector: A Complete Portfolio
Finance is a key sector in Massachusetts, creating business value and innovation. It is a critical component of the eco-system in Massachusetts, as it supplies innovating companies (e.g., Life Sciences firms) with needed capital, and provides supporting industries, such as IT, with jobs and opportunities. A Diverse & Balanced Economy
The breadth and proximity of the businesses comprising the Mass finance sector buffer the state and the economy from changes in market dynamics. Supporting industries and a rich supply of talent both foster growth of the sector and are sustained by it.
Not-For-P
rofit SectorsFo
r-P
rofit
Sec
tors
IT
Government
Not-For-Profit- Healthcare- Education
Finance- Insurance- Asset Management- Retirement- Brokerage- Mutual Funds - Annuities - Hedge Funds - Pensions
Life Sciences
Rich supply of talent
The Mass Finance Sector: A cornerstone of our economy
• 165,000 jobs—5.0% of total state employment
• $36.0 billion in Gross State Product (GSP)—9% of the state’s total output
• Top three GSP driver, of the for-profit industries, along with Real Estate and Professional and Technical Services
• Average income of $114,000 per year, which is more than double the state average

5
Mass Finance is a for-profit employment leader and delivers more middle income jobs
Employing approximately 165,000
• Finance is a key industry sector in Massachusetts, accounting for 5.0% of state employment.
• Finance forms the backbone of Massachusetts’ economy, along with the for-profit industries of IT and Life Sciences, as well as not-for-profit industries, such as Healthcare and Education.
For-Profit:
Industry Employed Percent of total MA employment
Finance & Insurance 165,900 5.0%
IT* 155,942 4.7%
Life Sciences** 69,677 2.1%
Not-For-Profit:
Industry Employed Percent of total MA employment
Health Care & Social Assistance 526,200 15.9%
Educational Services 178,100 5.4% * Includes the following: Computer and Electronic Product Manufacturing;
Software Publishers; Internet service providers, web search portals, and data processing services, and Computer Systems Design and related services.
** Includes the following: Pharmaceutical and Medicine Manufacturing, Medical Equipment and Supplies Manufacturing and Scientific R&D services.
Source: Bureau of Labor Statistics, 2012
Finance delivers more middle income jobs than other sectors
• Most of the citizens employed by the Finance industry have middle or high paying jobs. The charts on this page depict some representative jobs in Finance and its supporting industries.
• In 2012, the average salary for all occupations in Massachusetts was $55,600.
• The average 2012 wage for Massachusetts employees in the Financial Activities industries was $113,943. This represents a 4.1% increase from the average wage in 2011 and a 28.4% increase since 2005.
• The median wages for these occupations are presented meaning that half of employees with these occupations earn more than the salaries indicated. Additionally, the chart indicates that 75% of employees in these occupations earn in excess of the salaries presented on the right.
Massachusetts Finance Wages
Financial services Median 75%*
Financial Analysts $75,160 $54,920
Financial Managers $114,670 $83,540
Personal Financial Advisors $83,270 $59,230
Securities, Commodities, & Financial Services Sales Agents $106,610 $65,370
Supporting industries Median 75%*
Accountants & Auditors $69,820 $54,840
Legal Occupations $81,770 $55,290
Management Analysts $89,450 $67,590
* 75% of jobs earn higher than the amount indicated Source: Bureau of Labor Statistics, May 2012

6
Financial Institutions
Public Utilities
Insurance Companies
Corporations
14%
12%3%
71%
Source: Massachusetts Department of Revenue, FY2011 Annual Report0.0%
2.0%
4.0%
6.0%
8.0%
10.0%
12.0%
14.0%
Rea
l Est
ate
Pro
fess
iona
l and
Tech
nica
l Ser
vice
s
Fin
ance
and
Insu
ranc
e
Hea
lth C
are
and
Soc
ial A
ssis
tanc
e
Life
Sci
ence
s
Ed
ucat
iona
lS
ervi
cesIT
Not-for-profitFor-profit
Percent of total GSP
Source: Bureau of Economic Analysis, 2011
Mass Finance makes the leading contribution to Gross State Product of the five key sectors
Financial Institutions and Insurance Companies have provided an average of 26% of the taxes on Massachusetts businesses to the state over the last five years.
Taxes on Massachusetts Business 2007 – 2011 (Average)
Of the five key industries in Massachusetts (Financial Services, Life Sciences, IT, Healthcare and Education), Finance and Insurance had a leading contribution to GSP in 2011, with 9.2% of total state output. This is third in the state of the for-profit sectors behind Real Estate and Professional Services (of which a portion supports the Finance Industry).
Percent of total Massachusetts GDP by Industry in 2011

7
Mass Finance is a window to the global economy—with a New England footprint and a national presence in all key subsectors
PA
MA
CA
NY
NH
MA
CT RI
ME
NH
VT
MA
CT RI
54
3
2 1
Finance footprint in New England
Many of the nation’s most prominent financial institutions have headquarters or operations located in the New England region. Examples are shown in the chart below.
1. Greater Boston Area: JP Morgan, State Street, Brown Brothers Harriman, Boston Data Financial Services, Fidelity Investments, Liberty Mutual, John Hancock, BNY Mellon, Sovereign Bank/Santander
2. Western Mass: Liberty Mutual, Mass Mutual
3. Southern NH: Fidelity Investments, Liberty Mutual
4. Rhode Island: Fidelity Investments
5. Hartford, CT: The Hartford, Travelers
Massachusetts is among the top Financial Centers in the world, along with the cities indicated on the map shown below.
Sovereign Wealth Fund assets grew by more than 16% in 2012. Recent increases in the demand for global wealth management services create a number of opportunities for asset managers, including the abilitiy to provide differentiated, well-diversified product offerings to more customers across the globe. Large established financial institutions are best suited to meet the demands of this growing class of investors.
As one of these top financial centers, with significant asset management capabilities, Massachusetts is well positioned to manage the assets of foreign investors through vehicles such as Sovereign Wealth Funds, which continue to experience growth.
London
Hong Kong
Singapore
Shanghai TokyoBoston
New YorkSan Francisco
Chicago
Agg
rega
te A
sset
s un
der
Man
agem
ent
($tn
)
0
1
2
3
4
5
2008 2009 2010 2011 2012
Source: Preqin, 2012
Growth in Aggregate Sovereign Wealth Fund Assets under Management

8
Mass Finance: A retirement savings leader
While Massachusetts has long been the mutual fund capital and its birth place, it has also become a leader in managing retirement assets and alternative funds, and in servicing these products.
Boston is home to 3 of the top 10 retirement money managers, making it the number one cluster of market leaders
• Boston is home to 3 of the top 10 defined benefit/defined contribution money managers, per Pensions and Investments.
• In addition, Massachusetts is home to the top firm in Recordkeeping for Retirement Assets with $838B in assets and over 14 million participants. The next highest firm record keeps $300B in assets with 3 million participants, according to Pensions and Investments.
Top 10 Defined Benefit/Defined Contribution Money Managers
Company nameDefined Benefit AUM
Defined Contribution
AUMTotal Location
1. BlackRock Inc. $421,951 $275,789 $697,740 NY
2. State Street Global Advisors $394,929 $155,593 $550,522 MA
3. Fidelity Investments $40,405 $452,432 $492,837 MA
4. TIAA-CREF $372,285 $372,285 NY
5. Vanguard Group Inc. $18,434 $320,083 $338,517 PA
6. Northern Trust Global Investments $275,290 $36,753 $312,043 IL
7. Pacific Investment Management Co. LLC $160,439 $131,416 $291,855 CA
8. BNY Mellon Asset Management* $196,425 $58,503 $254,928 MA
9. Prudential Financial $107,836 $127,880 $235,716 NJ
10. Capital Research & Management Co. $215,945 $215,945 CA
All dollar values are in $ millions
* BNY Mellon’s asset management is based in Boston, while its headquarters is in New York
Source: Pensions and Investments, 2010
9
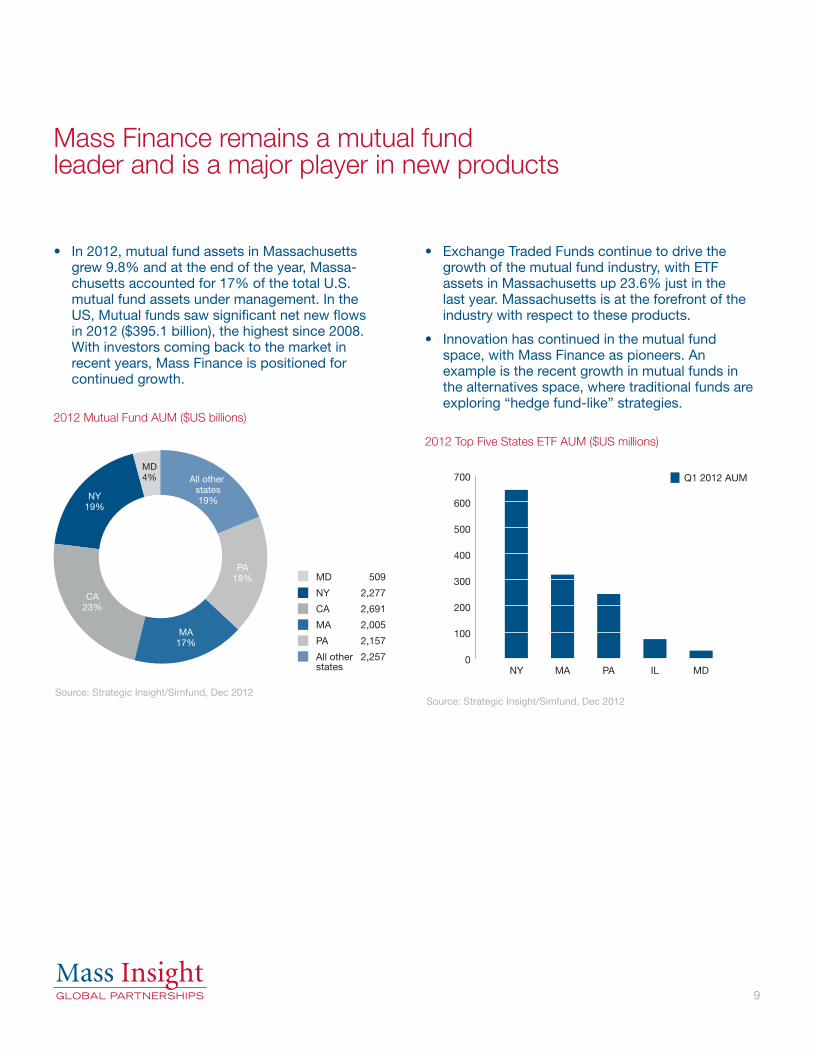
• In 2012, mutual fund assets in Massachusetts grew 9.8% and at the end of the year, Massa-chusetts accounted for 17% of the total U.S. mutual fund assets under management. In the US, Mutual funds saw significant net new flows in 2012 ($395.1 billion), the highest since 2008. With investors coming back to the market in recent years, Mass Finance is positioned for continued growth.
2012 Mutual Fund AUM ($US billions)
MD 509
NY 2,277
CA 2,691
MA 2,005
PA 2,157
All other 2,257states
NY19%
CA23%
MA17%
PA18%
All other states19%
MD4%
Source: Strategic Insight/Simfund, Dec 2012
• Exchange Traded Funds continue to drive the growth of the mutual fund industry, with ETF assets in Massachusetts up 23.6% just in the last year. Massachusetts is at the forefront of the industry with respect to these products.
• Innovation has continued in the mutual fund space, with Mass Finance as pioneers. An example is the recent growth in mutual funds in the alternatives space, where traditional funds are exploring “hedge fund-like” strategies.
2012 Top Five States ETF AUM ($US millions)
0
100
200
300
400
500
600
700
NY MA PA IL MD
Q1 2012 AUM
Source: Strategic Insight/Simfund, Dec 2012
Mass Finance remains a mutual fund leader and is a major player in new products
10
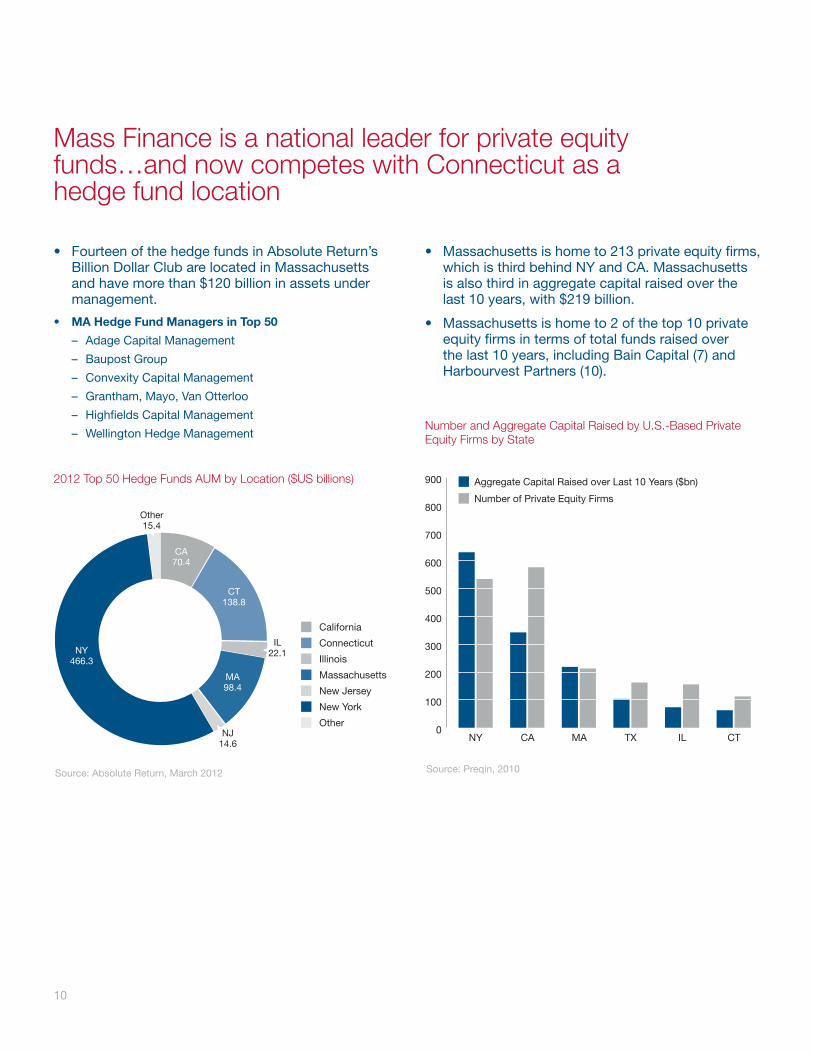
• Massachusetts is home to 213 private equity firms, which is third behind NY and CA. Massachusetts is also third in aggregate capital raised over the last 10 years, with $219 billion.
• Massachusetts is home to 2 of the top 10 private equity firms in terms of total funds raised over the last 10 years, including Bain Capital (7) and Harbourvest Partners (10).
Number and Aggregate Capital Raised by U.S.-Based Private Equity Firms by State
Source: Absolute Return, March 2012
California
Connecticut
Illinois
Massachusetts
New Jersey
New York
Other
CA70.4
CT138.8
IL22.1
MA98.4
NJ14.6
NY466.3
Other15.4
• Fourteen of the hedge funds in Absolute Return’s Billion Dollar Club are located in Massachusetts and have more than $120 billion in assets under management.
• MA Hedge Fund Managers in Top 50
– Adage Capital Management
– Baupost Group
– Convexity Capital Management
– Grantham, Mayo, Van Otterloo
– Highfields Capital Management
– Wellington Hedge Management
2012 Top 50 Hedge Funds AUM by Location ($US billions)
Mass Finance is a national leader for private equity funds…and now competes with Connecticut as a hedge fund location
Source: Preqin, 2010
0
100
200
300
400
500
600
700
800
900
NY CA MA CTILTX
Number of Private Equity Firms
Aggregate Capital Raised over Last 10 Years ($bn)

11
Massachusetts is a national leader for business-building venture capital
In each of the past 3 years, the state of Massachusetts has ranked second in the U.S. in terms of the total investment of venture capital.
Cumulative Venture Capital Investment By State (US$ millions) 2010 – 2012
Source: The MoneyTreeTM Report from PricewaterhouseCoopers and the National Venture Capital Association based on data provided by Thomson Reuters
0
10,000
20,000
30,000
40,000
50,000
NYCA MA WATX
The capital raised from VC activities is put to use by New England-based companies across a variety of industries, such as Biotechnology, IT and Life Sciences. New England based companies captured more than 12% of the total US venture capital raised in 2012.
Since 2010, total VC capital invested in Massachusetts has increased more than 27%.
2012 Venture Capital Investments Amount
Total VC Investments in the US $26,874,144,400
Total VC Investments in New England
– Biotechnology
– Software
– Medical Devices & Equipment
– Industrial/Energy
– IT Services
– All Others
$3,296,474,700
$267,584,700
$832,807,600
$473,084,700
$371,125,000
$184,774,000
$1,167,098,700
Total % of U.S. invested in New England 12.27% Source: The MoneyTreeTM Report from PricewaterhouseCoopers and the National Venture Capital Association based on data provided by Thomson Reuters

12
Massachusetts is a leader in the U.S. with respect to “savings banks” with over $70 billion in total deposits. In 2012, deposits at Massachusetts savings banks increased 22%. According to SNL, nationwide total deposits were up 8.5% in 2012.
Total Deposits in Savings Banks by State 2012 (US$ millions)
Mass Finance: A competitive banking sector
Massachusetts is a leader in asset custody and administration services due to the fact that the world’s largest custodian bank, BNY Mellon has a presence in the state in addition to State Street being headquartered in Boston.
Top US custodians (US$ trillions)
0
$10,000
$20,000
$30,000
$40,000
$50,000
$60,000
$70,000
$80,000
$90,000
NY NV MA TX NJ
Source: Annual Reports, 2012
0
5
10
15
20
25
30
BN
Y M
ello
n
Sta
te S
tree
t B
ank
JP M
orga
n
Citi
Nor
ther
n Tr
ust
Ass
ets
und
er c
usto
dy
($ t
rillio
n)
Source: Company Reports, 2012, SNL

13
Massachusetts is home to Liberty Mutual Insurance Group, the overall second largest Property & Casualty insurer in the US. Massachusetts is also home to two of the top 10 Life, Accident & Health Insurers in the US.
Top US Property & Casualty Insurers
Company nameNet
Premiums Written ($m)
US Market Share %
Location
1. State Farm Mutl Automobile Ins. 52,654 10.2% IL
2. Liberty Mutual 28,298 5.5% MA
3. Allstate Corp. 26,652 5.2% IL
4. Travelers Companies Inc. 22,696 4.4% MN
5. Berkshire Hathaway Inc. 20,236 4.0% NE
6. American International Group 23,596 3.6% NY
7. Farmers Insurance Group 18,311 3.6% CA
8. Nationwide Mutual Group 17,043 3.4% OH
9. Progressive Corp. 16,560 3.2% OH
10. USAA Insurance Group 13,286 2.6% TX
24. Hanover Insurance Group. 3,779 0.7% MA Source: SNL, 2012
Mass Finance: A strong presence in insurance
Top U.S. Life, Accident & Health Insurers
Company name Net Total Assets ($m)
US Market
Share %*Location
1. MetLife Inc. 562,191 16.0% NY
2. Prudential Financial Inc. 491,001 14.4% NJ
3. Jackson National Life Group 143,273 4.1% MI
4. New York Life Insurance Group 237,977 4.0% NY
5. ING Groep N.V 187,344 4.0% PA
6. Lincoln National 192,200 3.5% PA
7. Manulife Financial Corp. 252,189 3.5% MA
8. Massachusetts Mutual. 167,575 3.5% MA
9. AEGON NV 184,487 3.3% IA
10. Principal Financial Group Inc. 130,105 3.1% IA
42. FMR LLC. 20,843 0.3% MA
49. Sun Life Financial Inc. 63,280 0.3% MA * Market share determined by national direct premiums
Source: SNL, 2012

14
The Finance sector in Massachusetts has long had connections to academia and has employed and cultivated the top talent in finance along with the strong universities in the region.
• Massachusetts has been able to supply top talent to the Finance sector and is a critical piece of the “ecosystem”, as the state’s residents are among the most educated in the country.
• In 2011, Massachusetts ranked second in the number of Masters degrees awarded per 100 people at 0.43.
• Massachusetts is home to the country’s top graduate business schools including:
– Harvard University
– Massachusetts Institute of Technology
– Babson College
– Bentley University
– Boston College
– Boston University
– Brandeis University
– Northeastern University
– University of Massachusetts
Education: Cultivating and retaining top talent for Mass Finance
Masters Degrees Awarded (per capita) by State
Source: US Department of Education, 2011
0.0
0.2
0.4
0.6
0.8
1.0
1.2
1.4
1.6
1.8
DC MA NY AZ MO IL CT MI
Bachelors Degrees Awarded (per capita) by State
Source: U.S. Department of Education, 2011
0.0
0.2
0.4
0.6
0.8
1.0
1.2
1.4
1.6
1.8
NEIAMAVTNDUTRIDC