the mapping of 500 days of summer: a processual approach
TRANSCRIPT

Repositorium für die Medienwissenschaft
Chris LukinbealThe mapping of 500 DAYS OF SUMMER: A processualapproach to cinematic cartography2018https://doi.org/10.25969/mediarep/3462
Veröffentlichungsversion / published versionZeitschriftenartikel / journal article
Empfohlene Zitierung / Suggested Citation:Lukinbeal, Chris: The mapping of 500 DAYS OF SUMMER: A processual approach to cinematiccartography. In: NECSUS. European Journal of Media Studies, Jg. 7 (2018), Nr. 2, S. 97–120. DOI: https://doi.org/10.25969/mediarep/3462.
Erstmalig hier erschienen / Initial publication here:https://necsus-ejms.org/the-mapping-of-500-days-of-summer-a-processual-approach-to-cinematic-cartography/
Nutzungsbedingungen: Terms of use:Dieser Text wird unter einer Creative Commons -Namensnennung - Nicht kommerziell - Keine Bearbeitungen 4.0Lizenz zur Verfügung gestellt. Nähere Auskünfte zu dieser Lizenzfinden Sie hier:https://creativecommons.org/licenses/by-nc-nd/4.0
This document is made available under a creative commons -Attribution - Non Commercial - No Derivatives 4.0 License. Formore information see:https://creativecommons.org/licenses/by-nc-nd/4.0

EUROPEAN JOURNAL OF MEDIA STUDIES www.necsus-ejms.org
The mapping of ‘500 Days of Summer’: A processual approach to cinematic cartography
Chris Lukinbeal
NECSUS 7 (2), Autumn 2018: 97–120 URL: https://necsus-ejms.org/the-mapping-of-500-days-of-sum-mer-a-processual-approach-to-cinematic-cartography/ Keywords: cartography, cinema, mapping, topology, tour
Introduction
Film, media, and visual culture’s spatial turn has kindled interest in the rela-
tionship between cartography and cinema. This growing body of literature
has emphasised the similarities between the mediums as well as how cartog-
raphy and cinema may be productively combined. Castro describes this as
cinema’s ‘mapping impulse’, while Bruno calls cinema our ‘modern cartog-
raphy’, a ‘haptic way of site-seeing that turns pictures into an architecture’.[1]
While cinema and cartography have many similarities, they are also vastly
different. The difference lies in what constitutes the cartographic paradox:[2]
two mutually-related scopic regimes which informed each other’s develop-
ment during the European Renaissance. The first is projectionism, or cartog-
raphy’s objective view from above, and the second is perspectivalism, or lin-
ear perspective and the subjective view from below. One area of inquiry in
cinematic cartography taken up in this paper is how to conceptualise new
representational spaces that embrace this paradox.
In this paper, I engage cinematic cartography through mapping 500 Days
of Summer (2009). Critical cartography has criticised the epistemological fo-
cus in cartography on communication by arguing for a performative turn,
one that emphasises the iterative practices of production and consumption.
I first begin by addressing cinematic cartography in film studies as well as in
cartographic science. Then, I draw from de Certeau’s[3] two modes of spatial
narration, the map and the tour, as a basis through which to engage 500 Days

NECSUS – EUROPEAN JOURNAL OF MEDIA STUDIES
98 VOL 7 (2), 2018
of Summer. Where the map represents projectionism’s view from above, the
tour embodies the subjective view from below. Architecture and the mapping
production process provide the thematic premise through which to tour 500
Days of Summer. In contrast, a map of filmed locations provides the basis to
engage the geographies of the masculine gaze and millennial demography.
Finally, I embrace the cartographic paradox through presenting a carto-
graphic tour of 500 Days of Summer. This three-part affective geovisualisation
offers an example of how cartography can be put into practice to map cine-
matic space.
Cinematic cartography
Hallam and Roberts laud the use of GIS as a means to turn away from textual
analysis, which has dominated film studies.[4] To this end, they state, ‘what
is needed … is a critical mapping of the multifarious spatialities of film on the
one hand, and the expressly visual cultures of geography and cartography on
the other’.[5] However, Avezzù cautions against an uncritical deployment of
a cartographic paradigm in film studies. He points to the underlying anxiety
that comes with Cartesian logic and how this limits knowledge building and
extends and proliferates the crisis of cartographic reason.[6] While cinema
and cartography may seem an odd pairing, there is a logical connection to
make given that both have the ability to stitch together and visualise space,
place, and meaning. Castro used the phrase ‘mapping impulse’ to reference
cinema’s ‘particular way of seeing and looking at the world, a visual re-
gime’.[7] Castro argues that a mapping impulse enveloped early cinematog-
raphy through its use of various cartographic shapes like panoramas, atlases,
and aerial views. For Bruno, cinema offers ‘both an instrument and a route’
that redefines cartography as ‘its map of fragmentary e-movements opened
the way to a new geographical imagination of temporal traces’.[8] While car-
tography defines a location in absolute terms, cinema is a ‘mobile map’, a
‘complex tour of identifications – an actual means of exploration: at once a
housing for and a tour of our narrative and our geography’.[9]
Conley argues that in a broad sense films can be understood as maps in
that they are involved with locational imaging, or the representational prac-
tice that situates the viewing subject within the places they represent.[10] Car-
tography and cinema are both practices that involve the production, style,
and aesthetics of authorship, one the one hand, and the perception, cogni-

THE MAPPING OF ‘500 DAYS OF SUMMER‘
LUKINBEAL 99
tion, and valuation of representations for the viewer, on the other. The lan-
guage of maps and films are paradoxically similar and vastly different.
Whereas a map requires objects in space to be understood by their relation
to other objects, film, Conley argues, develops a topology of image facts that
behave like islands of meaning linked together by a narrative flow.[11] Key to
the concept of image fact is establishing shots. Establishing shots contextual-
ise image facts, creating a topology of places, events, and spectacles that con-
stitute the film’s map.
From a cartographic science perspective, Caquard and Taylor argue that
while there has been ‘substantial use of cartography in cinema’, the impact of
cinema on cartography has been minimal.[12] For them, interests in cinema
should focus on moving cartographic theory and practice forward, particu-
larly in relation to animated and dynamic maps and the role of emotion and
memory in mapping. While cartography removes the subjective position and
frequently denarrativises place,[13] cinema preserves the subjective position
and seeks narrative unity through a fragmented collection of image-
events.[14] What Caquard and Taylor find compelling is that combining cin-
ema with cartography affords the opportunity to rehumanise the map.[15]
Cartwright offers one way in which to re-narrativise the map, by using the
metaphor of theatre as a framing device to tell spatial stories.[16] The highly
structured space of theatrical narration and the three-act play provide a use-
ful starting point from which to engage mapping. Joliveau by contrast argues
that geospatial technologies are essential to tourists because they provide
semiautomatic indexicality.[17] Academics and everyday people are mapping
the indexicality between fictional places in films and real life.
Movie fans the world over have been charting, plotting, and sharing their
maps and film locations for quite some time. The internet is full of sites like
locationshub.com, movie-map.com, moviemaps.org, movie-locations.com,
and many more. These neogeographers seek to engage enthusiasm through
putting motion pictures back into places. National film institutes and aca-
demics have endeavoured to provide web maps of cinematic places in Aus-
tralia, Britain, Canada, Denmark, the Netherlands, and Spain. In contrast,
Degraff and Jameson provide an artistic interpretation of cinematic cartog-
raphy through detailed illustrations of the narrative flow of movies like Star
Wars (1977), Indiana Jones (1981), Back to the Future (1985), and Jaws (1975).[18]
They see cinematic cartography as a ‘nostalgia for the reality in which we
viewed those films’ and hope their maps ‘are pathways back to those mo-
ments’.[19] Cinematic cartography for them is immersive memory maps and

NECSUS – EUROPEAN JOURNAL OF MEDIA STUDIES
100 VOL 7 (2), 2018
emotional reengagements with the film. In contrast, the Mapping Cinemato-
graphic Territories project creates models through which to represent the
complex relationships between fictional narratives and the referential world.
Caquard and Fiset describe this project as a conversion of narratives into data
structures based on action, duration, type, and connection, for display on a
web map.[20] They emphasise the process through which this conversion
takes place as well as the accurate registration of fictional locations.
Whereas interest in cinematic cartography has focused on cross-discipli-
nary theoretical developments and applying spatial analysis to film, the epis-
temologies behind the mapping processes are not emphasised. Critical car-
tography has shown that maps as representations are social constructions that
are wrongly afforded ontological security. In the 1980-1990s Harley called
for an epistemological shift in how we understand and ascribe meaning to
maps. Rather than begin with maps as scientific, objective documents of
knowledge they should be viewed as a means through which hegemonies of
power-knowledge are ‘engineered, reified and legitimated in the map by
means of cartographic signs’.[21] Since this cultural turn an interest in post-
representational cartography, or a processual understanding of maps has
arisen.[22] The idea here is that rather than maps as inscriptions, the focus is
on understanding the process of mapmaking and the role of maps in every-
day life. Maps are never finished products but always in the process of be-
coming; they are by nature ontogenetic. An ontogenetic perspective posi-
tions maps as a ‘co-constitutive production between inscription, individual
and world; a production that is constantly in motion, always seeking to ap-
pear ontologically secure’.[23] This shift is a movement away from maps as a
static end product coded with power relations, ideology, and bias, to one that
looks at mapping as an ongoing cultural process. Rather than dismiss maps
as (a) vessels through which to transfer spatial knowledge or (b) reinforce
power relations, the ontogenetic perspective views both perspectives as con-
stitutively inside the ontogenesis of mapping. Cartography is, therefore,
‘both representations and practices (read: performances) simultaneously’.[24]
De Certeau describes two modes of spatial narration: the map and the
tour.[25] With the former, one is seeing and ordering places from above; with
the latter one is narrating the embodied practice of going and doing. Where
seeing from above is associated with maps as representations, the embodied
going and doing is about practice and touring. Moreover, a focus on the prac-
tice of map production ‘gets at issues around the translation of tangible urban
topography into the film medium’.[26] It does so through the use of image

THE MAPPING OF ‘500 DAYS OF SUMMER‘
LUKINBEAL 101
facts that are derived from filmed locations, and then those image facts are
stitched into a topology to produce a unified narrative space that structures
the cinematic landscape. For cartography, topology is the invariance of spa-
tial properties that remain constant when an object undergoes a spatial trans-
formation. In the case of cinema, the spatial transformation revolves around
the conversion of filmed locations into narrative space. Topological space
carries the quality of propinquity with this conversion and has the ‘capacity
to dissolve boundaries, to make proximate that which was far away and in
doing so not only rearrange our meta-physics or intimacy and distance, but
also endanger any and all systems of order that rely upon distinction and
separation’.[27] Cinematic topologies are discovered through the mapping
process and through touring filmed locations.
Touring 500 Days of Summer
Touring requires ‘movement through space, where subjectivity, experience,
emotions, knowledge, and valuation of the traveller plays a central role.’[28]
Every Saturday at Pershing Square something extraordinary happens that
runs counter to Los Angeles’ horizontal-autopia reputation: architectural
walking tours. Hosted by the LA Conservancy, tours traverse the historic
downtown, Broadway Theatre District, and surrounding environs. Los Ange-
les is ‘the city that American intellectuals love to hate’,[29] and emblematic
of the fragmented dis-located postmodern cityscape embodied by the archi-
tectural conundrum of its Westin Bonaventure.[30] Where Chicago reflects
the old school of American urban studies with staid patterns of concentric-
rings, Los Angeles is keno capitalism laid out on a grid, a ‘non-contiguous
collage of parcelized, consumption-oriented landscapes devoid of conven-
tional centers’.[31] Part of Los Angeles’ postmodern urban form is its down-
town architectural palimpsest history. The downtown area’s early modern
architecture on display through the LA Conservancy tours provides the aes-
thetic for 500 Days of Summer, and includes Romanesque revival (the Brad-
bury Building, though with a Victorian interior), the ornamental Beaux Arts
(Tom’s favourite, the Continental Building), and elegant Art Deco (Eastern
Columbia Lofts). More likely to be portrayed as some other American city,
downtown Los Angeles is the original cinematic else-where and else-when.
500 Days of Summer is a cult classic romantic comedy, featuring the manic-
pixie-dream-girl Zooey Deschanel as Summer and Joseph Gordon-Levitt as

NECSUS – EUROPEAN JOURNAL OF MEDIA STUDIES
102 VOL 7 (2), 2018
Tom, the millennial-hipster-hopeless-romantic-aspiring-architect. The film
was initially set in San Francisco; however, that changed when Joseph Gor-
don-Levitt and Director Marc Webb happened to take one of those Saturday
morning LA Conservancy walking tours, and the script was re-written for
downtown Los Angeles. The locations chosen for the film were so impressive
that Location Manager Michael Chickey won the California On Location
Award for features in 2009. The impact of the LA Conservancy tour is writ
large on the film: historic architecture dominates the film. The centrality of
Angels Knoll and its view is emblematic of the storyline: Tom only sees what
he wants to see. Tom only sees the historic architectural buildings but not the
parking lot which Summer points out to him. Tom is also unable to see be-
yond his expectations of hopeless romance. The view from Angels Knoll is a
veritable who’s who of Los Angeles architectural history, including the Con-
tinental Building (1903), the Grand Central Market (1917), the Million Dollar
Theatre (1918), the Bradbury Building (1893), and the grand art deco pyramid
that is City Hall (1928). The film is a tour of Los Angeles’ downtown cinematic
landscape through a non-linear narrative that disrupts temporality while re-
lying on its architecture to ground its realism.
Data used to map 500 Days of Summer came from Film L.A., a non-profit
agency that issues film permits. The mapping process begins with geocoding,
or placing the 54 film permit addresses on a map. One of the first issues that
arise in the geocoding process is that data can be flawed because permits do
not always align with what is in the film. In 500 Days of Summer, Ikea of Bur-
bank can be identified but has no film permit record. Locations used in pro-
duction can also be edited out, which happened to a scene shot at the Grand
Central Market. Film permits do not differentiate between interior and exte-
rior shots, which can makes it difficult to recognise a location. A house in San
Pedro is assumed to be where Summer grew up, but could not be verified.
Permits are issued per day, creating multiple records at sixteen locations. Ad-
dresses can be incorrectly entered, with a standard error being incorrect ad-
dress direction (N, S, E, W). A directional error in the film permits occurred
at 104 E 4th Street, where a non-descript glass building can be seen in Google
Street View (Figure 1). This location does not fit the architectural aesthetic of
the film. 104 W 4th Street, however, is the Barclay Hotel, which doubles as
Tom’s coffee shop (Figure 2). 54 film permits translated into 29 geocoded
locations, and of those 21 were indexically referenced to the film’s narrative.

THE MAPPING OF ‘500 DAYS OF SUMMER‘
LUKINBEAL 103
Following the process of geocoding comes ground truthing and indexing.
Ground truthing is where the cartographer checks to see if what was placed
on the map can be found at that location on the ground. Ground truthing is
accomplished by traveling to the location or done remotely through Google
Street View. Interior locations were accessed through Google photospheres
at the Barclay Hotel and the Redwood Bar and Grill (Fig. 2). Checking tem-
poral change at a filmed location can also be done through Google Street
View back to the time 500 Days of Summer was produced in 2008. Ground
truthing is a cartographically motivated tour through the city. The mapping
Fig. 1: Non-descript office building at 104 E 4th Street (©Google Street View 2017).
Fig. 2: The Barclay Hotel Lobby viewed through Google Street View (©Google Street View, image by Craig Sauer).

NECSUS – EUROPEAN JOURNAL OF MEDIA STUDIES
104 VOL 7 (2), 2018
process offers an extra-textual methodology to explore the film’s architec-
ture as well as what was framed out of the mise en scène.
Indexing is the cartographic process of cinematic ground truthing. Index-
ing is fundamentally about building a topological relationship between a lo-
cation’s form in cinematic and mapped space. Some locations are easier to
index than others, in particular locations with high production value and
lengthy cinematic resumes. Indexing can be complicated by places doubling
for others, like the Barclay Hotel’s lobby playing a coffee shop (Fig. 2), or the
Point Fermin Lighthouse in San Pedro standing in for a wedding in San Di-
ego.
Though it is easy to recognise locational stars like the Bradbury Building
for its role in Blade Runner (and 76 other IMDb titles), other locational stars
from 500 Days of Summer include the Quality Café (Catch Me If You Can and
fifteen other IMDb titles), the Barclay Hotel (As Good As It Gets and eleven
other IMDb titles), and by far the most used location outside a studio or back-
lot in LA, Griffith Park (Rebel Without a Cause and 720 other IMDb titles). With
cinematic topologies created every day in Los Angeles, it may be better to
conceive of these topologies as weather patterns that come and go in differ-
ent neighbourhoods and districts. In Los Angeles, a cinematic front has
stalled over Tom’s neighbourhood and does not look likely to stop any time
soon (Fig. 3). The architectural locations chosen for the production of 500
Days of Summer may seem idiosyncratic, but in terms of Los Angeles’ cine-
matic space, this film lies in its heartland. The point is that the topologies
exposed through indexing do not reside just at locations, or points. Cinematic
topologies also spread sequentially down linear paths and diffuse horizon-
tally through and beyond polygons through establishing, panning and track-
ing, wide angle and deep focus shots.
THE MAPPING OF ‘500 DAYS OF SUMMER‘
LUKINBEAL 105
Indexing cinematic locations expose how topologies traverse time. Playing
the role of Tom and Summer’s place of work is the Fenton building, a loca-
tion with a unique local history. Its fourth floor was once Roseland Roof, a
famous taxi-dancehall in the 1930-1950s. During the era of prohibition re-
formers closed down brothels, and when the jazz age arrived so did dance
academies where for one song men could purchase a lesson for ten cents.
These lessons were referred to as taxi-dancing, and although the building has
been renovated, the neon dancing girls’ sign remains (Fig. 4). Tom’s favourite
location, the park bench at Angels Knoll, is situated between Los Angeles’ past
and future. The park is bordered by Angels Flight, a century-old funicular
that transports people from the top of Bunker Hill to its base at the Grand
Central Market. Bunker Hill, once the most fashionable neighbourhood with
lavish Victorian homes, later fell on hard times. During the 1930-1950s the
Victorians fell into disrepair and became ‘pulp fiction’s mean streets and film
noir’s ground zero’.[32] Beginning in 1955, Bunker Hill became the longest
redevelopment project in Los Angeles history. Angels Knoll, long slated for
redevelopment, was closed in 2013. Handel Architects’ $1.2 billion-dollar
mixed-use project will completely redesign Angels Knoll while preserving
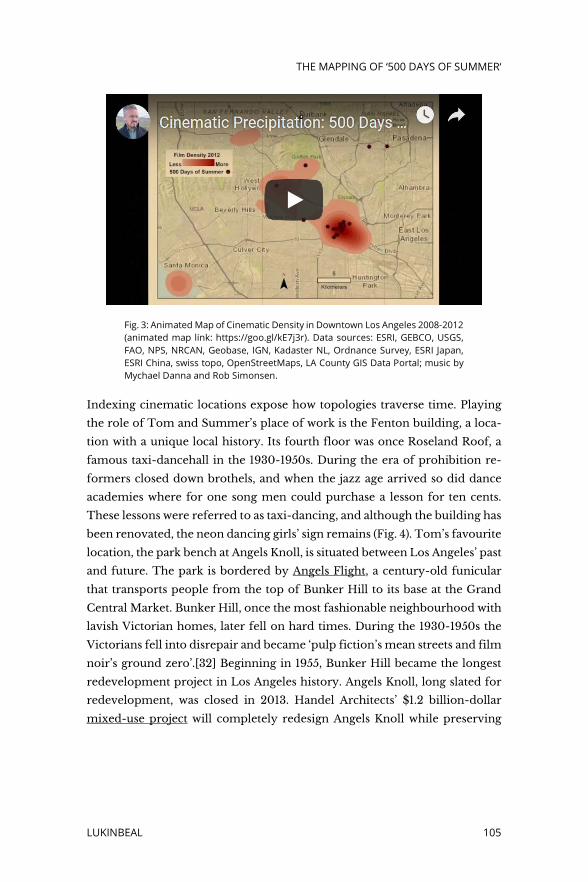
Fig. 3: Animated Map of Cinematic Density in Downtown Los Angeles 2008-2012 (animated map link: https://goo.gl/kE7j3r). Data sources: ESRI, GEBCO, USGS, FAO, NPS, NRCAN, Geobase, IGN, Kadaster NL, Ordnance Survey, ESRI Japan, ESRI China, swiss topo, OpenStreetMaps, LA County GIS Data Portal; music by Mychael Danna and Rob Simonsen.

NECSUS – EUROPEAN JOURNAL OF MEDIA STUDIES
106 VOL 7 (2), 2018
Angels Flight. Tom’s favourite spot will become just another postmodern
menagerie in downtown Los Angeles (Fig 5).
Through the indexing process, stories about how a film becomes an arena of
practice and place-making were uncovered. Film location-based websites are
great resources for identifying hard-to-recognise locations. However, most
of these websites are just location lists with general descriptions. For more
nuanced information about how filmed locations are toured and practiced,
film buffs fill the void. Take Ila Fox, a Zooey Deschanel look-a-like, who cre-
ated the 500 Days of Summer Project where she recreates Summer’s fashion
and re-enacts scenes from the film. Her catalogue of fashion, location, and
production design constitute a geography of an enthusiast where she is the
Fig. 4: The Fenton Building 1939 and 2017 (©Los Angeles Public Library 1939 and Google Street View 2017).
Fig. 5: Angels Knoll 2018 and its future as Angels Landing (2018 imagery by Google Earth, SIO, US Navy, NGA, GEBCO, LDEO, Landsat, Copernicus; and An-gels Landing imagery by Handel Architects).

THE MAPPING OF ‘500 DAYS OF SUMMER‘
LUKINBEAL 107
expert of all things Summer. Pablo Valdivia and Nina Mohan’s role-playing
exploration provides an intimate re-enactment and tour of the events from
the movie. Pablo and Nina remind us that place itself is a thrown-together-
ness of events, emotions, and entanglements[33] and, in the case of down-
town Los Angeles, places have deeply resonantcinematic legacies. Engaged
cinematic cartographers are busy making places and memories out of filmed
locations. Where Ila, Nina, and Pablo provide nuanced cases of engagement,
thousands more leave tender traces on Instagram’s locations at the film’s em-
blematic park bench (Fig. 6).
Fig. 6: Instagram Locations: (500) Days of Summer bench.

NECSUS – EUROPEAN JOURNAL OF MEDIA STUDIES
108 VOL 7 (2), 2018
Engagement with a film’s location is a topophilic expression, ‘a means of self-
discovery’,[34] an emotional remapping of the ‘pathways back to those mo-
ments’ when the film was first watched.[35] Topophilia is a part of the place-
making activities individuals engage in on the cinematic streets of Los Ange-
les. Like many films, 500 Days of Summer, is a topophilic expression where the
‘film seems almost entirely an excuse to construct an architectonic view in
motion of the city and its surroundings’.[36] These mapping impulses are a
reciprocal relationship between us and the environment, a movement
through self and space. Indexing involves strolling down the paths produced
by film viewers on their inferential walks and verisimilar activities that pro-
duce palimpsest urban cinematographies.
Mapping 500 Days of Summer
A cartographical analysis of a film has two foci: it can situate film within an
era and place; it can accentuate and sharpen textual analysis. In figure 7 the
map of 500 Days of Summer presents film locations organised by the spatial
domain of characters and two pivotal events. A majority of the filmed loca-
tions are in downtown where Tom lives and works. This love story is reflec-
tive of the era and place of the millennial generation within the urban core
of Los Angeles and epitomises the idea of the ‘millennial city’.[37] A genera-
tional analysis is based on the idea that a cohort, in this case those born be-
tween 1981-1996, share similar social characteristics that can be reflective of
the social geography in a city.
An analysis of Tom’s neighbourhood was conducted using ESRI’s tapestry
segmentation data, which classifies neighbourhoods by 68 unique socioeco-
nomic characteristics. Tom’s neighbourhood is emblematic of millennials
and is classified as ‘metro renters’. This neighbourhood is characterised by
highly mobile, well-educated single people in their late twenties and thirties
who spend a large part of their money on clothes, rent, and technology.
Metro renters live close to work, use public transportation, are interested in
the fine arts, strive to be sophisticated, take risks, work long hours, and are
focused on social status. Metro renters also enjoy bars, restaurants, yoga, shop
at Whole Foods, The Gap, and Banana Republic. Tom’s spatial domain is suit-
able for pedestrian living, with the furthest distance between locations being
one-and-a-half kilometres from his work to the Civic Centre. Tom’s down-

THE MAPPING OF ‘500 DAYS OF SUMMER‘
LUKINBEAL 109
town area is comprised of the two zip codes that experienced the largest in-
flux of millennials from 2011-2016. The two zip codes are also ranked
amongst the most gentrified in the country since 2000.[38]
Summer’s apartment is one block from the high rises on Wilshire Boule-
vard in the densely-populated Koreatown. It is a five-and-a-half-kilometre
commute to the Fenton Building for Summer. Given that Summer is a mil-
lennial she probably takes the subway from the Wilshire / Normandie station
to Pershing Square and walks for a 30-minute commute. Pershing Square is
also just one block from Angels Knoll. Rachel’s neighbourhood of Eagle Rock
is well-suited for the overall millennial atmosphere of the film as well. Where
else would Tom have grown-up but in the neighbourhood LA Weekly de-
clared ‘on hipster overload’?[39] Eagle Rock’s main thoroughfare, York
Boulevard, was designated by Conde Nast Traveler as ‘LA’s Coolest Street’.[40]
With a median age of 35, this gentrified central-city neighbourhood is unaf-
fordable for most middle-class Americans. Rachel’s average American-sized
home is estimated by Zillow.com to cost $1,501,939, while the US median
home price was $368,500.[41]
A cartographic analysis of the characters and narrative activity reveals how
the masculine gaze of the protagonist/Director/viewers becomes territorial-
ised. Here, the hegemony of the male gaze is socially and spatially repro-
duced through Tom, who commands the stage and narrative action.[42] The
Fig. 7: Map of 500 Days of Summer.

NECSUS – EUROPEAN JOURNAL OF MEDIA STUDIES
110 VOL 7 (2), 2018
male protagonist/Director/viewers also command the axis mundi of the film:
the park bench. The park bench approximates the centre of the narrative’s
geography by providing the image fact for the opening and closing scenes of
the film. The park bench also approximates the centre of all film production,
thus reaffirming the masculine gaze in the formation of the film’s cinematic
landscape. Further, the female other, Summer and Rachel, serve as Constitu-
tive Dependents for the masculine Dominant, Tom, and thus are spatially po-
sitioned outside his domain and only engaged/viewed/framed to advance his
narrative.[43] The density of filmed locations in downtown shows the spatial
dominance of Tom’s positionality in the narrative. Even the romantic jaunts
occur in Tom’s domain, with the lone exception being to Ikea in Burbank.
Tom’s failure to win the girl in his spatial domain is part of the twist of this
otherwise standard ‘boy meets girl’ storyline. However, a happy ending must
meet the approval of the male gaze: Tom meets Autumn within his domain
at the Bradbury Building in the epilogue. The connotative play of female-as-
season – from Summer to Autumn – reaffirms the masculine Dominant and
its subordination of the feminine other to a transitory state.
A cartography tour of 500 Days of Summer
Aitken and Craine argue that cartography should draw from cinema’s lan-
guage to produce affective geovisualisations.[44] The International Carto-
graphic Association defines geovisualisation as ‘approaches from visualiza-
tion (ViSC), exploratory data analysis (EDA), and geographic information sys-
tems (GISystems) to provide theory, methods and tools for visual explora-
tion, analysis, synthesis, and presentation of geospatial data’.[45] An affective
geovisualisation, by contrast, is one that elicits and visualises ‘”affective
meaning” – the perceptions, interpretations, and expectations one ascribes to
a specific topological and social setting’.[46] Cinematic cartographies as af-
fective geovisualisations embrace points as relational topologies, lines as pro-
jectiles of flight, and spaces warped by narrative engagement. Spatial topol-
ogies, in general, are built on structures and their ontologies. Cinematic space
is structured through narration, focal length, shot scale, and other conven-
tions. Cartography is structured by geometric rules of projection, scale, and
other conventions.
An affective geovisualisation for cinematic cartography requires a mobile
map that embraces cinema’s narration and is grounded by Cartesian space

THE MAPPING OF ‘500 DAYS OF SUMMER‘
LUKINBEAL 111
through indexing. Below a three-act affective geovisualisation of 500 Days of
Summer is presented (Tables 1, 2, 3 and Figures 8, 9, 10). This cartographic tour
follows Cartwright’s suggestion of using narration as an organisational struc-
ture.[47] More specifically, it uses Snyder’s Save the Cat interpretation of Hol-
lywood’s narrative structure.[48] Snyder’s highly popular and widely influ-
ential book details the structure behind recent Hollywood movies regardless
of genre. Snyder details fifteen beats, or critical events, that must occur and
when they should occur in a three-act narrative. The fifteen beats are used as
temporal markers in the narrative and indexically linked to their location of
production.
Using the Save the Cat structure provides an ordered sequence through
which to narrate the place-based events associated with 500 Days of Summer.
The beat sheet is split into its corresponding three acts. These beats and lo-
cations are identified through pop-up windows in the Google Earth fly-
through. The pop-up windows reinforce the association between cinema and
cartography by stating the beat by name, describing and showing the beat,
and referencing its location. The opening and closing image beats provide
snapshot views similar to that seen in the film. The projectile path provides
a feeling of the propinquity of characters, events, and places whereas the
voiceover stitches the beats with their location and narrative event. Through
voice, text, and images in motion, this cartographic tour offers an affective
geovisualisation of 500 Days of Summer.
Fig. 8: Act I of 500 Days of Summer (animated map link: https://goo.gl/PiBZL6, Imagery by Google Earth).

NECSUS – EUROPEAN JOURNAL OF MEDIA STUDIES
112 VOL 7 (2), 2018
Table 1: Act I of 500 Days of Summer.
Beat #
Name Snyder’s account of the beat
Location Narrative Summary
1 Opening-Image
First impression of what the movie is about.
Angels Knoll Tom and Summer sit at the park bench at Angels Knoll.
2 Set-Up Characters in the A-Story are intro-duced.
Canadian Building
Eagle Rock Neighborhood
San Pedro Neighborhood
Griffith Park
Tom is at his apartment in crisis over his rela-tionship with Summer. Through a montage we see Summer and Tom growing up very differ-ently.
3 Theme-Stated
A secondary char-acter states the thematic premise of the movie.
Rachel’s House, Eagle Rock Neigh-borhood
Rachel, ‘Just because some stupid girl likes the same stupid music as you doesn’t mean she’s your soul mate.’
4 Catalyst A life-changing moment occurs.
Fenton Build-ing
Tom falls in love with Summer in the elevator at work.
5 Debate The hero debates what to do as a re-sult of the life-changing moment.
Barclay Hotel Will Tom ask Summer out on a date?

THE MAPPING OF ‘500 DAYS OF SUMMER‘
LUKINBEAL 113
Table 2: Act II of 500 Days of Summer.
Beat #
Name Snyder’s account of the beat
Location Narrative Summary
6 Break-into-Two
The hero makes a decision, leaves act one, and enters the antithesis of act one, which is act two.
Redwood Bar and Grill
Tom and Summer have drinks which lead to an awkward exchange about whether Tom likes her just as a friend or not.
7 B-Story The B-Story gives us a break from the A-Story.
Eagle Rock Rachel advises Tom about relationships.
8 Fun-and-Games
This is the ‘prom-ise of the premise’ where the most entertaining sec-tion of the movie appears.
Ikea, Burbank
San Fernando Building
Fine Arts Building
Tom and Summer act like a couple and go out on dates.
9 Midpoint The stakes are raised, often in ei-ther a false victory or false defeat. The Midpoint is the opposite of the All is Lost beat.
Koreatown Tom spends the night at Summer’s where she opens up about her hopes and dreams.
10 Bad-Guys-Close-In
The bad guys re-group, and the hero’s team is now in perfect sync.
Civic Plaza
Broadway Bar
Quality Cafe
Tom first dances to his success in getting Sum-mer to love him. Later, Summer tells Tom, ‘I think we should stop seeing each other.’
11 All-is-Lost Here, we catch a whiff of loss or death as the hero’s life descends into shambles.
Million Dollar Theatre
Tom is all alone watch-ing a movie.

NECSUS – EUROPEAN JOURNAL OF MEDIA STUDIES
114 VOL 7 (2), 2018
Table 3: Act III of 500 Days of Summer.
Beat #
Name Snyder’s account of the beat
Location Narrative Summary
12 Dark Night of the Soul
How does the hero feel about what transpired in the All is Lost beat?
Fenton Build-ing
Quality Cafe
At work, Tom is asked to channel his depression and write grieving cards. Tom goes on a blind date but ends up talking about Summer.
13 Break-into-Three
The A- and B-Story intertwine, and the hero pre-vails.
Union Station
Point Fermin Lighthouse, San Pedro
Tom boards a train to San Diego where he meets Summer. They are both going to attend a co-worker’s wedding. Tom and Summer dance at the wedding.
14 Finale The story is wrapped up, and lessons are learned.
Koreatown Tom attends Summer’s party where reality does not align with his expec-tations.
15 Final Image
Opposite opening image and proof that change has oc-curred.
Angels Knoll Tom and Summer at Angels Knoll but this time we know they have separated.
16 Epilogue This is not one of Snyder’s beats but an add-on to sat-isfy the masculine gaze.
Bradbury Building
Tom meets Autumn, and she agrees to go on a date.

THE MAPPING OF ‘500 DAYS OF SUMMER‘
LUKINBEAL 115
Conclusion
Film studies have explored the use of cartographic logic to expand upon the-
ories and methodological practices. In contrast, cartographic science has
drawn on film studies to consider how to improve mapping practices related
to emotion, affect, and memory. Themes associated with georeferencing and
indexing, applications of the narrative structure onto maps, and the produc-
tion of online cinematic spatial databases have been the prominent outcomes
Fig. 9: Act II of 500 Days of Summer (animated map link: https://goo.gl/FM4t42, Imagery by Google Earth).
Fig. 10: Act III of 500 Days of Summer (animated map link: https://goo.gl/KWJ2nZ, Imagery by Google Earth).

NECSUS – EUROPEAN JOURNAL OF MEDIA STUDIES
116 VOL 7 (2), 2018
of putting cinema into cartographic practice. Central processes of cinematic
mapping include geocoding, ground truthing, and indexing. Where ge-
ocoding is the process of inscribing data onto a map, it is fraught with sub-
jective decisions that determine what will appear on a map. With ground
truthing, the cartographer seeks to validate the geocoding process on the sur-
face of the earth. Indexing is cinematic ground truthing. Indexing builds a
topological relationship between cinematic and mapped locations based on
the image facts presented at a location.
This paper situates cinematic cartography at the intersection of represen-
tation and practice, the objective view from above and the subjective view
from below. It does so by using the two spatial narrative modalities of the
map and the tour to engage in an analysis of 500 Days of Summer. Through
touring, we are actively engaged with going and doing, with the aesthetic en-
semble of the locations that underlie a film’s geography. Touring positions
the spatial narration within a subjective view from below where we are mov-
ing within and amongst the filmed locations in their urban context. Touring
turns filmed locations into topological places that resonant with meaning,
engagement, and purpose. The LA Conservancy now includes its own 500
Days of Summer architectural tour – but the tour extends to the era of film noir
detectives like Marlowe (1969) with his lair at the Bradbury building, taxi-
dancing at the Fenton Building, and flophouses at Bunker Hill. The tour also
extends to the postmodern future that will soon wipe away Angels Knoll, cre-
ating the aesthetic for Deckard to roam the city.[49] Topologies expose how
cinematic landscapes are ongoing practices of place-making where filmed
locations are turned into centres of felt values[50] through playful perfor-
mances like Ila Fox’s 500 Days of Summer Project, or Pablo Valdivia’s and
Nina Mohan’s role-playing exploration of downtown Los Angeles.
Cartography as a mode of inscription removes the performative aspect of
the tour. Through an objectified view from above, a cartographic analysis
provides a means through which to situate a film as a cultural document re-
flective of a place and era. 500 Days of Summer is the millennial’s Annie Hall
(1977), and the film’s narrative footprint in Los Angeles offers a case study in
millennial urban geography. Cities across the US and world are adept at mar-
keting and creating new urban spaces for this generation by borrowing reci-
pes from planners like Richard Florida. A cartographic analysis also ex-
pounds upon the power-knowledge configurations embedded within a film’s
narrative. The centrality of the masculine gaze in this narrative is enhanced

THE MAPPING OF ‘500 DAYS OF SUMMER‘
LUKINBEAL 117
through cartographic analysis and shows how the gaze becomes territorial-
ised into a gendered logic of dominant and inferior people, places, and activ-
ities. A cartographic analysis, therefore, not only enhances and corroborates
a textual analysis, it can cross-correlate a film’s narrative with other spatio-
temporal data.
The affective geovisualisation presented in this paper drew from two
modes of spatial narration (the tour and map) to engage the cartographic par-
adox. This geovisualisation is a tour structured by the narrative beats and
Google Earth’s three-dimensional modelling of Los Angeles. Whereas 500
Days of Summer used a non-linear narrative, the cartographic tour reorganises
the film into a linear narrative for the sake of clarity. This tour shows scenes
from the film’s narrative in sequential order and places those scenes within
their production location. The production locations and how they are viewed
are determined by an objective cartographic view that seeks to re-present
them factually as they are in the landscape. However, the movement and nar-
ration along the flight path represent the subjective view of the tour.
The cinematic landscape of 500 Days of Summer resonates with the tasks
of film production and tour(ist) consumption.Through touring, we deploy
cartography as a verb. This approach incorporates the production and con-
sumption practices that constitute the ongoing formation of the cinematic
landscape in 500 Days of Summer.In contrast, with cartography as a noun, we
inscribe meaning onto a representational form. This form is used for situat-
ing a film in time and place or to elaborate on the film’s textual meaning.Us-
ing animated geovisualisation techniques, the cartographic paradox can be
engaged through the use of combining the spatial narrative formats of the
map and tour.
Author
Dr. Chris Lukinbeal is an Associate Professor in the School of Geography and
Development and the Director of Geographic Information Systems Technol-
ogy at the University of Arizona. He has published three books and over 50
academic papers and book chapters on film, media, cartography, and land-
scape studies. As a cartographer, he has published over 100 maps and per-
forms contract work as a GIS professional. He is an editor of the forthcoming
book Media’s Mapping Impulse. He is also an editor of the Media Geography at
Mainz book series and an associate editor for the journal Geohumanities.

NECSUS – EUROPEAN JOURNAL OF MEDIA STUDIES
118 VOL 7 (2), 2018
References
Aitken, S. and Craine, J. ‘Guest editorial: Affective geovisualizations’, Directions Magazine: A Magazine
for GIS Professionals, Vol. 4, No. 1, 2006: https://www.directionsmag.com/article/3015 (accessed 14
November 2018).
Arnwine, C. and Lerner, J. ‘Cityscapes: Introduction’, Wide Angle, Vol. 19, No. 4, 1997: 1-7.
Avezzù, G. ‘Film history and “cartographic anxiety”’ in At the borders of (film) history: Temporality, archae-
ology, theories, edited by A. Beltrame, G. Fidotta, and A. Mariani. Udine: Forum, 2015: 423-430.
Bruno, G. ‘Ramble city: Postmodernism and Blade Runner’, October, Vol. 41, 1987: 61-74.
_____. The atlas of emotion: Journeys in art, architecture, and film. New York: Verso, 2002.
Caquard, S. ‘Cartography III: A post-representational perspective on cognitive cartography’, Progress in
Human Geography, Vol. 39, No. 2, 2014: 225-235.
Caquard, S. and Fiset, J. ‘How can we map stories? A cybercartographic application for narrative car-
tography’, Journal of Maps, Vol. 10, No. 1, 2014: 18-25.
Caquard, S. and Taylor, F. ‘What is cinematic cartography?’, The Cartographic Journal, Vol. 46, No. 1,
2009: 5-8.
Cartwright, W. ‘Applying the theatre metaphor to integrated media for depicting geography’, The Car-
tographic Journal, Vol. 46, No. 1, 2009: 24-35.
Castro, T. ‘Cinema’s mapping impulse: Questioning visual culture’, The cartographic Journal, Vol. 46,
No. 1, 2009: 9-15.
_____. ‘Mapping the city through film: From “topophilia” to urban mapscapes’ in The city and the mov-
ing image, edited by R. Koeck and L. Roberts. London: Palgrave Macmillan, 2010: 144-155.
Conley, T. Cartographic cinema. Minneapolis: University of Minnesota Press, 2007.
Davis, M. City of quartz: Excavating the future in Los Angeles. New York: Verso.
Dawson, J. Los Angeles’s Bunker Hill: Pulp fiction’s mean streets and film noir’s ground zero!. Stroud: The
History Press, 2012.
de Certeau, M. The practice of everyday life. Berkeley: University of California Press, 1988.
Dear, M. ‘Los Angeles and the Chicago school: Invitation to a debate’, City and Community, Vol. 1, No. 1,
2002: 5-32.
DeGraff, A. and Jameson, A. Cinemaps: An atlas of 35 great movies. Philadelphia: Quirk Books, 2017.
Del Casino, V. and Hanna, S. ‘Beyond the “binaries”: A methodological intervention for interrogating
maps as representational practices’, ACME: An International e-Journal for Critical Geographies, Vol.
4, No. 1, 2006: 34-56.
Dixon, D. and Jones, J. ‘The tactile topologies of contagion’, Transactions of the Institute of British Geogra-
pher, Vol. 40, No. 2, 2014: 223-234.
Finn, J. and Lukinbeal, C. ‘Musical Cartographies: Ritmos de los Barrios de la Habana’ in Sound, society
and the geography of popular music, edited by O. Johansson and T. Bell. Surrey: Ashgate, 2009: 127-
144.
Giaccardi, E. and Fogli, D. ‘Affective geographies: Toward richer cartographic semantics for the geo-
spatial web’, Proceedings of the working conference on advance visual interfaces. Napoli: 2008: 173-180
(doi, 10.1145/1385569.1385598 ).
Gunnarsson, L. ‘The dominant and its constitutive other: Feminist theorizations of love, power and
gendered selves’, Journal of Critical Realism, Vol. 15, No. 1, 2016: 1-20.
Hallam, J. and Roberts, L (eds). Locating the moving image: New approaches to film and place. Bloomington:
Indiana University Press, 2014.
Harley, J. ‘Deconstructing the map’, Cartographica, Vol. 26, No. 2, 1989: 1-20.
Heath, S. Questions of cinema. Bloomington: Indiana University Press, 1981.
Hoberman, N. ‘Gentrification nation: Downtown LA is fastest gentrifying area in the US report says’,
The Real Deal: Los Angeles Real Estate News, 5 March 2018: https://there-
aldeal.com/la/2018/03/05/gentrification-nation-downtown-la-is-fastest-gentrifying-area-in-the
-us-report-says/ (accessed 14 November 2018).

THE MAPPING OF ‘500 DAYS OF SUMMER‘
LUKINBEAL 119
Jameson, F. Postmodernism, or, the cultural logic of late capitalism. Durham: Duke University Press, 1991.
Jay, M. Downcast eyes: The denigration of vision in the twentieth century French thought. Berkeley: University
of California Press, 1993.
Joliveau, T. ‘Connecting real and imaginary places through geospatial technologies: Examples from
set-jetting and art-oriented tourism’, The Cartographic Journal, Vol. 46, No. 1, 2009: 36-45.
Kitchin, R. and Dodge, M. ‘Rethinking maps’, Progress in Human Geography, Vol. 31, No. 3, 2007: 331-344.
MacEachren, A. and Menno-Jan, K. ‘Research challenges in geovisualization’, Cartography and Geo-
graphic Information Science, Vol. 28, No. 1, 2001: 3-12.
Massey, D. For space. London: Sage, 2005.
Moos, M., Pfeiffer, D., and Vinodrai, T (eds). The millennial city: Trends, implications, and prospects for
urban planning and policy. New York: Routledge, 2018.
Mulvey, L. Visual and other pleasures. London: Palgrave Macmillan, 1989.
Pickles, J. A history of spaces: Cartographic reason, mapping and the geo-coded world. London: Routledge,
2004.
Romero, D. ‘Eagle rock is one of America’s “hottest neighborhoods”’, LA Weekly, 15 January 2014:
http://www.laweekly.com/news/eagle-rock-is-one-of-americas-hottest-neighborhoods-4314851
(accessed 14 November 2018).
Snyder, B. Save the cat: The last book on screenwriting that you’ll ever need. Studio City: Michael Wiese
Productions, 2005.
Tuan, Y. Space and place. Minneapolis: University of Minnesota Press, 1977.
US Census. ‘New residential sales’, The United States Census Bureau: https://www.census.gov/construc-
tion/nrs/pdf/newressales.pdf (accessed 14 November 2018).
Notes
[1] Castro 2009; Bruno 2002, pp. 8-9.
[2] Pickles 2004.
[3] de Certeau 1988.
[4] Hallam & Roberts 2014.
[5] Ibid., p. 25.
[6] Avezzù 2015.
[7] Castro 2009, p. 10.
[8] Bruno 2002, p. 270.
[9] Ibid., p. 71.
[10] Conley 2007.
[11] Ibid.
[12] Caquard & Taylor 2009, p. 5.
[13] Jay 1993.
[14] Heath 1981.
[15] Caquard & Taylor 2009, p. 7.
[16] Cartwright 2009.
[17] Joliveau 2009.

NECSUS – EUROPEAN JOURNAL OF MEDIA STUDIES
120 VOL 7 (2), 2018
[18] Degraff & Jameson 2017.
[19] Ibid., p. 9.
[20] Caquard & Fiset 2014.
[21] Harley 1989, p. 6.
[22] Caquard 2014.
[23] Kitchin & Dodge 2007, p. 335.
[24] Del Casino & Hanna 2006, p. 36.
[25] de Certeau 1988.
[26] Arnwine & Lerner 1997, p. 6.
[27] Dixon & Jones 2014, p. 5.
[28] Finn & Lukinbeal 2009, p. 128.
[29] Davis 2006, p. 21.
[30] Jameson 1991.
[31] Dear 2002, p. 24.
[32] Dawson 2012, p. 1.
[33] Massey 2005.
[34] Castro 2010, p. 145.
[35] Degraff & Jameson 2017, p. 9.
[36] Bruno 2002, p. 369.
[37] Moos & Pfeiffer & Vinodrai 2018.
[38] Hoberman 2018.
[39] Romero 2014.
[40] Ibid.
[41] As of July 2018 for Zillow.com and April 2018 for the US Census.
[42] Mulvey 1989.
[43] Gunnarsson 2016.
[44] Aitken & Craine 2006.
[45] MacEachren & Kraak 2001, p. 3.
[46] Giaccardi & Fogli 2008.
[47] Cartwright 2009.
[48] Snyder 2005.
[49] Bruno 1987.
[50] Tuan 1977.