the major factors affecting the economic …
TRANSCRIPT

THE MAJOR FACTORS AFFECTING THE ECONOMIC DEVELOPMENT
AND THE PROGRESS OF EAST AFRICAN COMMUNITY
A Thesis
Presented to
the Department of Business and Business Education
Emporia Kansas State College
In Partial Fulfillment of the
Requirements for the Degree
Master of Science In Business
by
Duncan CH Njoroge
Hay 1975
(1 )- ~2l~ ch t
EVEN THOUGH I AM FORBIDDEN
I HAVE WALKED OUT THE HALLOW WORLD
AND CLIMBED TO THE TOP OF THE HIGHEST HILL
AND SEEN A CLEAR BLUE SKY
AND MANY OTHER TH loNGS YOU HAVE NOT DREAMED OF
AND WHILE STROLLING MY WONDERS AND FEARS OF
KNOWING THE TRUTH
I TOUCHED THE REALITY OF MAN
II
ACKNOWLEDGEMENTS
The writer wishes to express his gratitude to Dr Rodney
Mitchel and Dr Ira Martel with a special note of recognition
and to Dr Raymond Russell for their valuable advice and suggesshy
tions in the writing of this study
Grateful appreciation is given to my wife Marty Muchene
my brother Richard Njoroge and Erustus Gachee for their conshy
tributions to this paper
D C M N
iii
TABLE OF CONTENTS
Page
LIST OF TABLES v I i
LIST OF MAPS x
Chapter
1 INTRODUCTION bullbullbullbullbullbullbullbullbullbullbullbullbull
THE PROBLEM AND DEFINITIONS OF TERMS USED bull 2
Statement of the Problem bullbullbullbull 2
Importance of the Study bull 3
Limitations of the Study 3
Assumptions 3
DEFINITIONS OF TERMS USED It
Arusha It
Dar-es-Salaam It
Duka It
E A C or E Abullbullbull It
Gazetted Township bullbull 5
Great Rift Valley bullbull 5
Kampala bull 5
Municipal ities Grade A amp B Townships 5
Na i rob i 6
Non-African 6
Pound bull 6
iv
Chapter
2
v
Page
Settlers 6
Shillings 6
Swah i 1i bull 7
t1ETHODS OF PROCEDURE 7
PLAN OF STUDY bull bull bull bull bull bull 7
THE REVIEW OF RELATED LITERATURE 9
EAST AFRICAN GEOGRAPHY 11
Regional Survey bull 11
The Nyika Plateau 12
Lake Victoria Basin 15
THE ECONOMY middot 15
Subsistence Economy middot 15
The Public Sector bull 16
Excessive Expectations for Publ ic Service 17
POPULATION DISTRIBUTION 19
Urban Population 21
PEOPLE 22
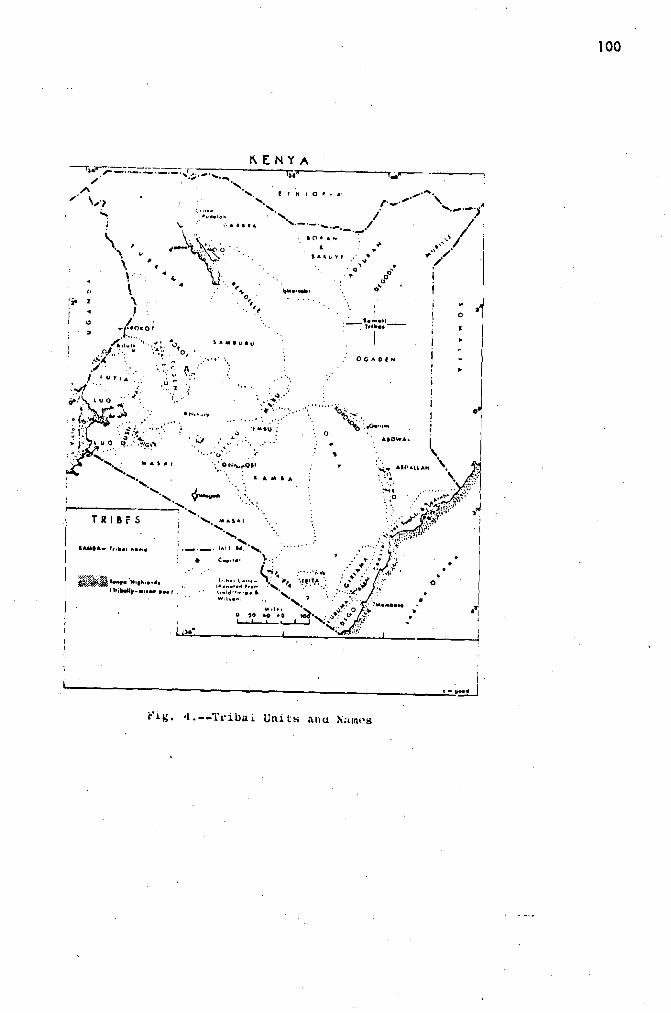
The Tribal Classification 24
HistorIcal Clusters bull 25
AFRICAN HERITAGE 26
The Extended Family bullbullbullbullbullbullbullbull 27
THE ECONOMIC ACTIVITIES OF EAST AFRICA 30
THE DISTRIBUTION OF TRADING ACTIVITY 32
Na i rob i bull middot 32
Mombasa 35
Dar-es-Salaam 36
Chapter
3
4
5
vi
Page
Kampa 1a bull bull 37
Others 37
~OMMUNICATION ACTIVITY 38
Rail Transportation 41
Sea Transportation 42
Air Transportation 42
CQmmunlcation Media 43
SUMMARY bull bull 43
DE~IGN OF THE STUDY 45
lAST AFRICAN ELITE 45
URBAN ELITE OPINION bullbullbullbullbullbullbullbullbullbull 48
OPINIONS AND ATTITUDES bullbullbullbullbullbullbullbullbullbull 50
ANALYSIS OF DATA bullbullbullbullbullbullbullbullbullbullbullbullbullbull 52
The Education Factor 55
Country Where Education Was Obtained 58
The Factor of Religion bullbullbullbullbullbull 60
The Factor of Voluntary Association bullbull 63
The Tribal Factor bullbullbull 65
ELITE OPINIONS AND ATTITUDES 77
SU~MARY AND CONCLUSIONS bullbull 85
SUMMARY bull bull bull 86
CONCLUSIONS 88
Survey of Literature 88
Analysis of Findings 89
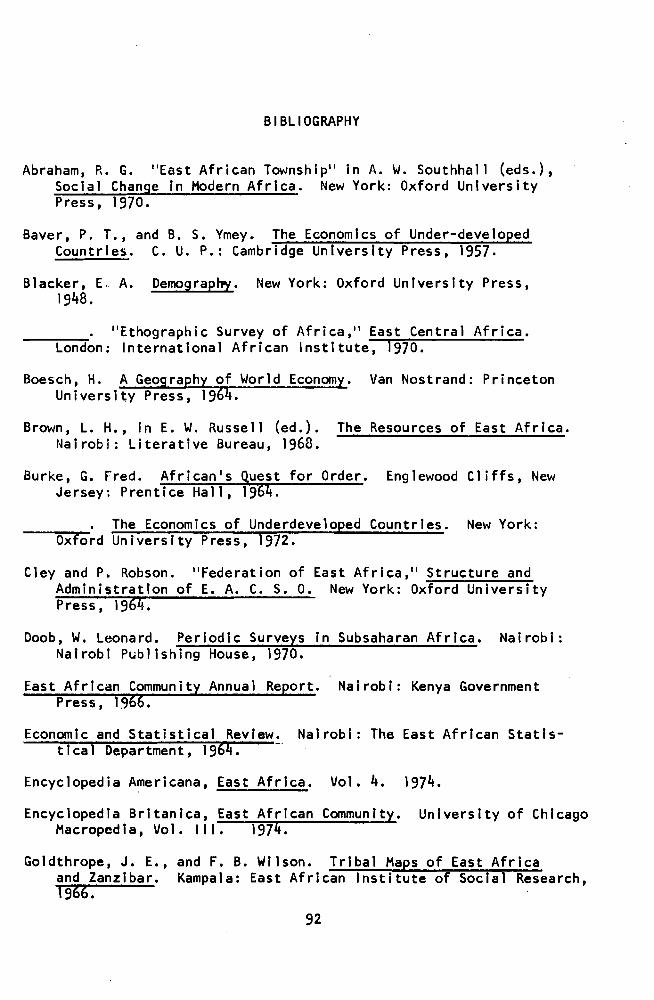
BIBLIOGRAPHY bullbullbullbullbullbullbullbull 91
APPENDIX bullbullbullbullbullbullbullbullbullbull 95
LI ST OF TABLES
Table Page
1 Mean Population Estimates Per Space Land (1968) bull bull 19
2 The Distribution of the African and the IINon-Afrlcan In Proportion by Cities 1968 bull bull bull bull 23
3 Transportation In East Africa (1963-73) 40
4 Co~municatlon Media (Thousands) 1963 43
5 Ea~t African Elite Age Factor By Percent 53
6 Ea~t African Elite Occupation Factor Sample by Percentage Distribution bullbullbullbullbullbullbullbullbullbullbull 54
7 East African Elite Specific Occupation Factor by Percent bull bull bull bull 56
8 East African Elite Education Factor By Percent (1972) bullbull 57
9 East African Elite Where Educated bullbullbullbull 59
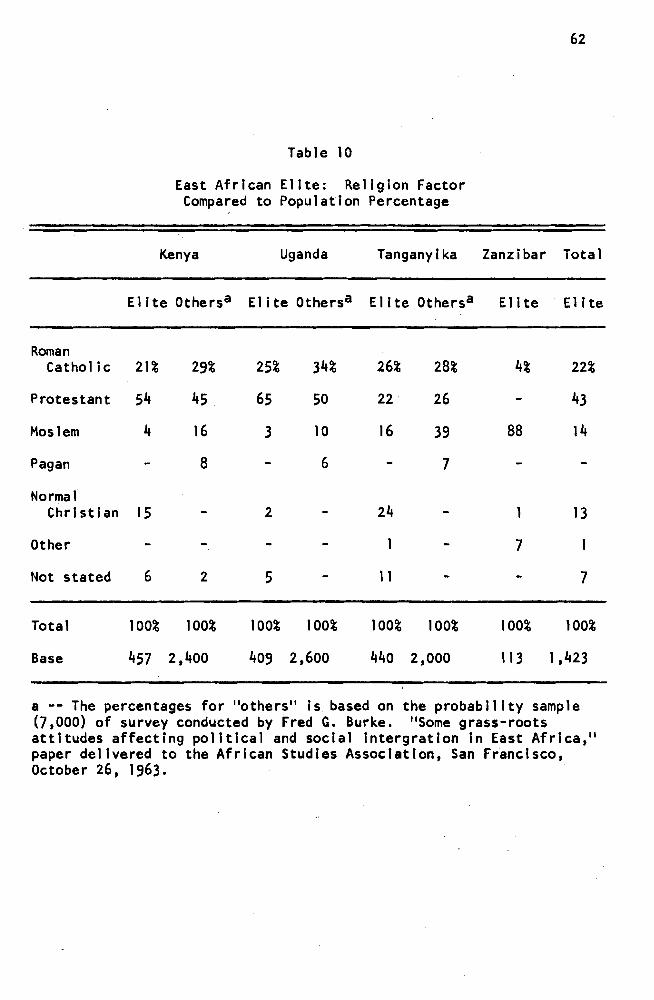
10 Ea~t African Elite Religion Factor Compared to Population Percentage bullbullbullbullbullbullbull 62
11 East African Elite Voluntary Associations Factor By Percent 64
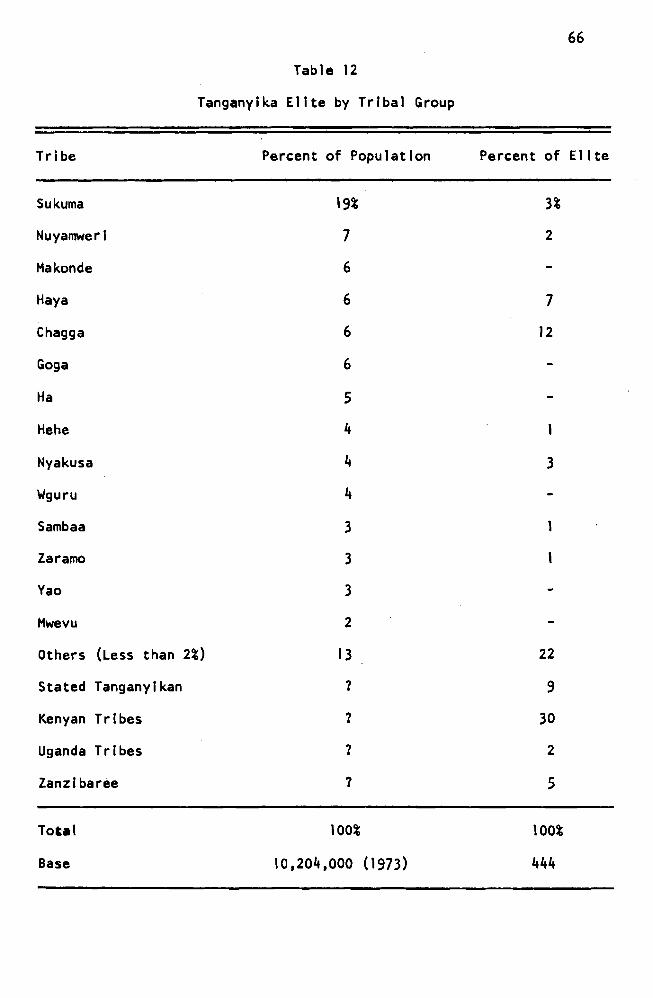
12 Tanganyika Elite by Tribal Group 66
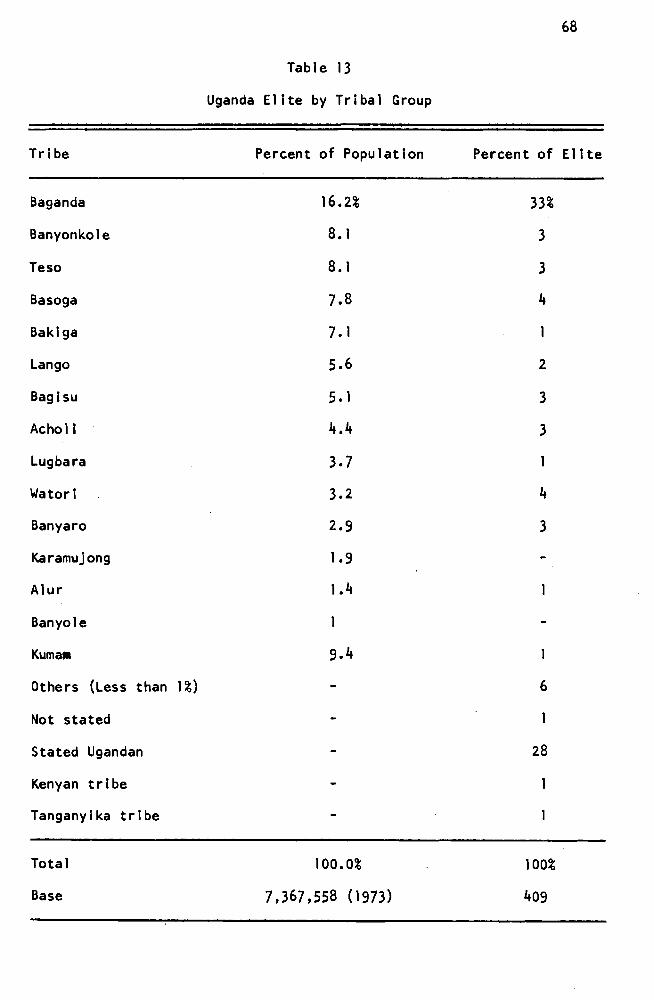
13 Ugand3 Elite by Tribal Group 68
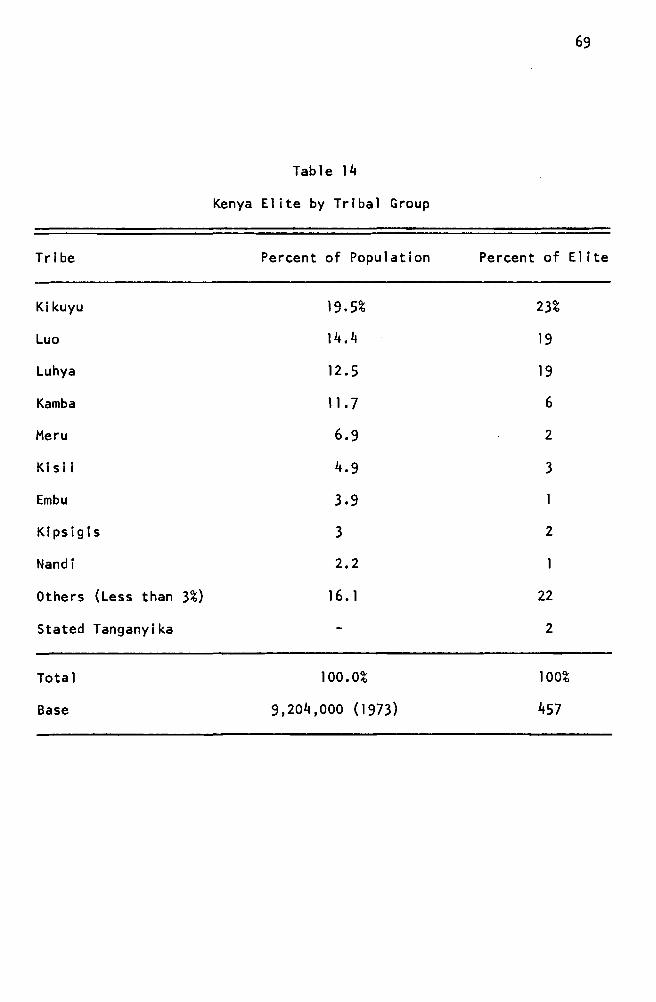
14 Kenya Elite by Tribal Group bullbull 69
15 Question 1 What in your opinion is the most Important problem facing our country at the present time1 70
16 Question 2 All things considered how satisfied are you with your present standard of llvlng--very sati~fied fairly satisfied somewhat dissatisfied
71or ~ery dissatisfied bull bull bull bull bull bull bull bull bull bull bull bull bull bull bull bull
vii
viii
Table Page
17 Qupstion 3 Do you think political matters should be left to the government or should people like yourself take some active part in political affairs 72
18 Question 4 Which one of the following do you think our country needs most at the present time more schools more hospitals more housing more factories or mere roads bull bull bull bull bull bull 73
19 Qu~stion 5 Now which one do you think our country fleeds most an honest government without corrpution ~ government that gets things done fair distribution of wealth national unity or individual freedom 74
20 Question 6 Which do you prefer--government ownership or private ownership of major Industries bull bull bull 75
21 Question 7 As you know there are many different ways in which African states can establish closer ties amoog themselves Which of the following ways would you favor an organization for settl ing disputes b~tween African governments closer economic relations political federation African military organization cultural exchanges 76
22 Sacle 1 It does not help much to try to prevent crops being damaged by insects and diseases such los ses can neve r rea 11 y be preven ted bullbull bull 77
23 Scale 2 A man should never marry a woman who does not belong to his tribe 78
24 Scale 3 People have it within their power to bring harm and misfortune to others through magic 78
25 Scale 4 Science and knowledge are useful of course but many important matters can never be positively understood by the human mind bull bull 79
26 Scale 5 A man ought always to obey his traditional chief 80
27 Scale 6 Government and politics are so complicated that the average man cannot really understand what is going on bullbullbullbullbull 80
28 S~~le 7 If I had the choice I would prefer to be given a small sum immediately rather than be promised a very large sum one year from now bull bull bull bull bull 81
ix
Table Page
29 Scale 8 A woman IS place is in the home bullbull 82
30 Sccle 9 The traditional ways of the past are the 82best
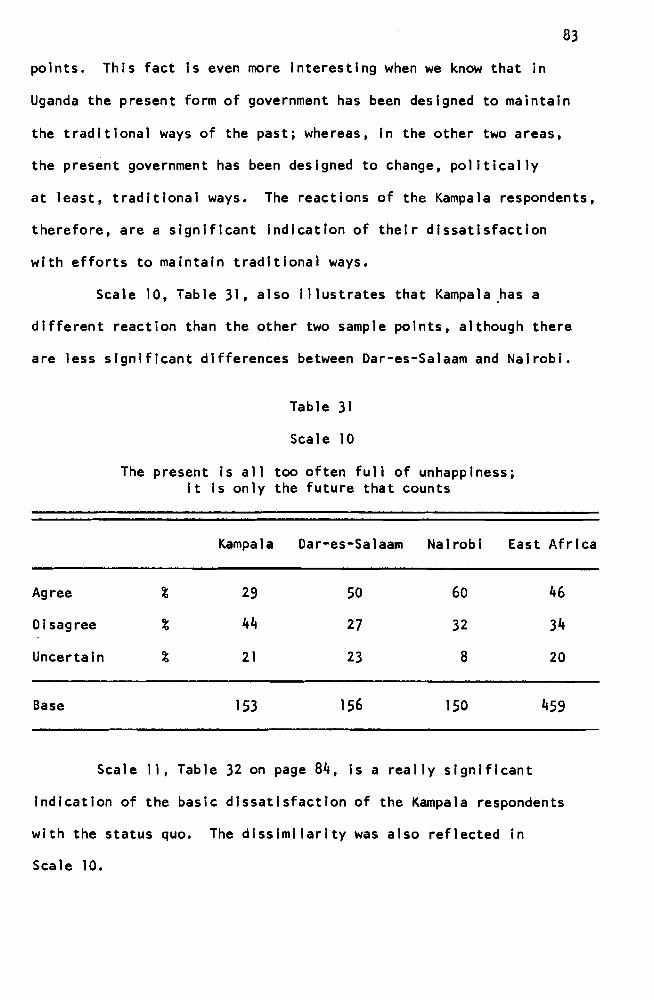
31 Scale 10 The present is all too often full of unhappiness it is only the future that counts 83
32 Scale 11 The government is doing all it can to develop our country bullbullbullbullbull 84
Chapter 1
INTRODUCTI ON
East Africa (Kenya Uganda Tanzania) is a land of great
variety (covering 683000 square miles) in physical features clishy
mate human type economic development and political evolution
al ike There are few places on earths surface ~here in the space
of a few hu~dred miles one can experience such a range of conshy
trasts O~e can pass from high mountain snow to the deepest lake-
filled troughs alive with tropical vegetation from the invigorating
climate of the highland areas to the dusty heat of rift valley (one
hundred to two hundred miles wide) or from bustling modern cities
to countrysid~ There are great differences in trade activities
from one area to another Finally there are in East Africa
conflicts of triLal and racial interests present in all parts of
the continent and great contrasts in the types of states which
have emerged from the race of independence 1
Politically with the exceptions of Ruanda and Burundi
Somalia Ethi~pia and Zambia the territories have been under Britshy
ish rule for many years and Engl Ish is the official language Most
of Kenya was a crown colony except the coastal strip which was a
lEI izabeth Hopkins Conflict of Tribal and Raciai Conshyflict in Stanley and Burke (eds) Transformation of East Africa (New York B~sic Books Printers 1966) p 375
2
protectorate while Tanganyika was administered by the British
under Uni~ed Nations trusteeship2 The British territories have
enjoyed common markets and certain services such as publ ic comshy
munications administered by East African Common Services today
known as the East African Community
East Africa is the meeting point for all the contlnents
major 1ingJistic groups Even Cl ick Language is represented
in Central Tanzania The three greatest sub-races (of African
origin) ar~ the Nilotics Nilo-himites and the Bantus 3
THE PROBLEM AND DEFINITIONS OF TERMS USED
Statement of the Problem
This study was designed to
1 Analyze the factors which have slowed the economic
development of the East African community
2 Identify the major problems encountered In economic
systems in East Africa
3 Determine the problems in developing the economic growth
of the comm~nity
4 Identify economic reconstruction needs
2Cloey and P Robson Federation of East Africamiddot Structure and Administration of E A C S O (New York Oxford University Press 1964) p 37
3W T W Morgan lEast Africa Its People and Resources People (New York Oxford University Press 1969) p 33
3
Importance 0f the Study
The economy of the East Africa community Is growing at a
high rate as projected yet the majority of the citizens of the
community remain on the poverty level In order to explain this
paradox we will look at the problems tending to withhold economic
success from many members of the community
Limitatlo~s of the Study
The study has the following limitations the data in
this study are limited to that available at the William Allen
White Library at Emporia Kansas State College and through their
facilities through interlibrary loans As Indicated in much of
the relevant data surveyed much of the available material is not
current 4
Assumptions
Certain assumptions underlie this study These assumptions
can be summarized as follows
1 The environment in which the desired economy operates
is such t~at the beneficiary does not readily appreciate the value
of change and thus lacks interest in It
2 The East African citizen is suspicious of accepting
the change to more progressive socioeconomic standards
4
DEFINITIONS OF TERMS USED
Arusha
The capital city of East African Community (1967 Declarashy
tlon)5
Dar-es-Salaam
Capital and largest city in Tanzania It is also one of
6the chief port cities of East Africa
Duka
Small shops normally operated by a single family7
E A C or Eo A
Abbreviation for East African Community Is an economic
organizaticn consisting of three member countries of Kenya Uganda
and Tanzania (associate members include Zambia Ethiopia Somal ia
and Burundi) The existing community is based on a treaty signed
in Kampala on June 6 1967 to preserve and re-establish a large
part of the corporative relationship that was disappearing 8
5A W Southhall Growth of Urban Society Dar-es-Salaam (New York Oxford University Press 1969) p 483
6 Ibid p 481
7J bull Keezan Warren International Marketing Channels Less Develo ed Countries (Englewood Cliffs New Jersey Prentice Hall Incorporated 197 p 309
8Andr~w M Kamark liThe East African Community The Ecoshynomics of African Development (New York Praegam Incorporated 1971) p 5C
5
Gazetted Township
Go~ernment official papers classifying towns population
by residenc~9
Great Rift Valley
Geologically this structure is called a Ilgra ben 1I This
valley exte~ds as a series of depressions from Syria through the
Dead Sea (the surface is nearly 1300 feet below sea-level) to
Africa In East Africa It divides into two branches western
and eastern Igneous activities and volcanoes are associated with
the rift valley forming such peaks as Kllimanjaro these are now 10
dead
Kampala
Th~ capital and the largest city in Uganda It was made
the capital In 1962 when Uganda previously a British protectorate
bull d d IIbecame an In epen ent nation
Municipalities Grade A amp B Townships
Gr~de A -- Municipal towns these towns have populations
above sixty thousand
Grade B -- Townships under local government authorities
12Normally these towns have populations below sixty thousand
9Rbull ~ Abraham IIEast African Townshipl In A W Southhall (ed ) Social Chane in Modern Africa (New York Oxford University Press 197D) p 33
lOE P Seggerson Physiography of East Africa (Nairobi Na I rob I Pless 1962) p 10
Ilsouthhall op cit p 477 12Abraham loc cit
bull 6
Nairobi
The capital and the largest city In Kenya with a population
13nearing one million people according to the 1971 population census
Non-African
A resident who is an Immigrant from other continents besides
Africa The majority of Non-Africans are Europeans and Asians
(Indians)14
Pound
East African sterling currency (Pound~) 1 ~ bull shs 20
Equivalent to $28 u S currency 1975 15
Settlers
European immigrants farmers to the East Afrlca 16
Shillings
East ~frican sterling currency (shs) shs 20 z l~ 17
13Southhall op cit p 469
14Abraham loc cit Non-Africans comprise people (male or female) of European or American origin Arabs Indians and Far East Asians
15K~nya Newsletter issued by Section of Embassy Republic of Kenya Jashington D C Vol 3 No5 (1975) p 28
16Ellzabeth Hopkins IRacial Minorities in British East Africa in Stanley and Burke (eds) Transformation of East Africa (New York Basic Books Printers 1966) p 87
17Kenya Newsletter loco cit
7
Swahili
A language of the coastal population of East Africa roughly
from Southern Somalia to Mozanlbique and including Zanzibar and
the Comoro Islands It Is spoken by about 15 million people as
a first langu~ge this includes the people In East Africa and
Congo (Klns~asa)18
METHODS OF PROCEDURE
All the published materials listed below were extensively
reviewed Thl~ included library review of both periodicals and
relevant st~dies The writing of this report is thus based on
the Information provided by the following
1 Periodicals books pamphlets and microfilm from the
William Allen White Library of the Emporia Kansas State College
2 Xeroxed materials and books that were secured through
the inter-library loan and from friends
3 uata collected specifically for use In this study by
the Marco Survey Ltd Nairobi Kenya
4 Periodicals Issued by the information section of the
Embassy of the Republic of Kenya Washington D C
PLAN OF STUDY
In the preceding section the purpose of this study Its
importance the limitations assumptions definitions of terms
18Encyclopedia Americana Swahili Vol 26 (1974) p 85
8
and methods of procedure have been outlined Related literature
largely stu~ies of structure with regard to economic development
in East Africa is presented in Chapter 2 Chapter 3 presents a
background of pertinent economic facts concerning East Africa
Chapter 4 deals with an analysis of factors In Chapter 5 the
data is summarized and conclusions are drawn
Chapter 2
THE REVIEW OF RELATED LITERATURE
British East Africa was the name applied to the territories
In East Africa before they achieved Independence The territories
Included the ~olonles and the protectorate of Kenya the United
NatIons trust territory of Tanganyika and Uganda These territories
had a total area of 682469 square mlles l British East Africa was
economicalya system of joint services The East Africa High
Commission which consisted of the Governors of Kenya Tanganyika
and Uganda was responsible for the administration of public services
and functions common to territories including currency roads
customs apd communications Each territory1s government retained
responsibility for local services such as health education and
police 2
After World War I I nationalist feeling was strong throughout
British East Africa As the deadline for Independence approached
Britain attempted to form a federation of East Africa but separate
nationalist aspirations made this Imposslble 3 Tanganyika was the
IEncyclopedla Americana East Africa Vol 4 (1974) p 578
2East Africa Geographical Journal Vol 129 Part 2 1963 pp 140-155
3Abull Ro~berg and A Segal East African Federation IIlntershynational Concll iatlon11 1963 p 30
9
10
4first of the four territories to achieve Independence In 1961
Uganda became independent In- 1962 The following year Kenya and
Zanzibar entered the ranks of Independent states Tanganyika and
Zanzibar merged In 1964 and adopted the name United Republic of
Tanzania 5
After Tanganyika became Independent the East African
High Commission was suceeded by the East African Common Services
Organizatior which performed the same functions as its predecessors 6
Finally the East African Common Services became the East AfrIcan
Community The East African Community was formed to establish a
customs union to facilitate the industrial development of the
area and to carryon research activities and common services preshy
vlously controlled by the East African Common Services organization
The community was re-establlshed by a treaty signed by three member
nations In Kampala Uganda on June 6 1967 7
The community provides for free intercommunity trade and
a system of c~nmon external tariffs there Is also a system of
transfer tnxes that may be Imposed on certain commodities Imported
from other members by a country with a trade deficit wIthIn the
other two members Transportation and communications services
are handled by community corporations for raIlways harbors post
4 Ibid p 8 5 IbId p 12 bull
6Encyclopedia Britanlca East African Community University o~ Chicago Macropedia Vol I I I (1974) p 754
7The East African East African Common Services Report (Nairobi Kenya Government Press 1966) p 3
I I
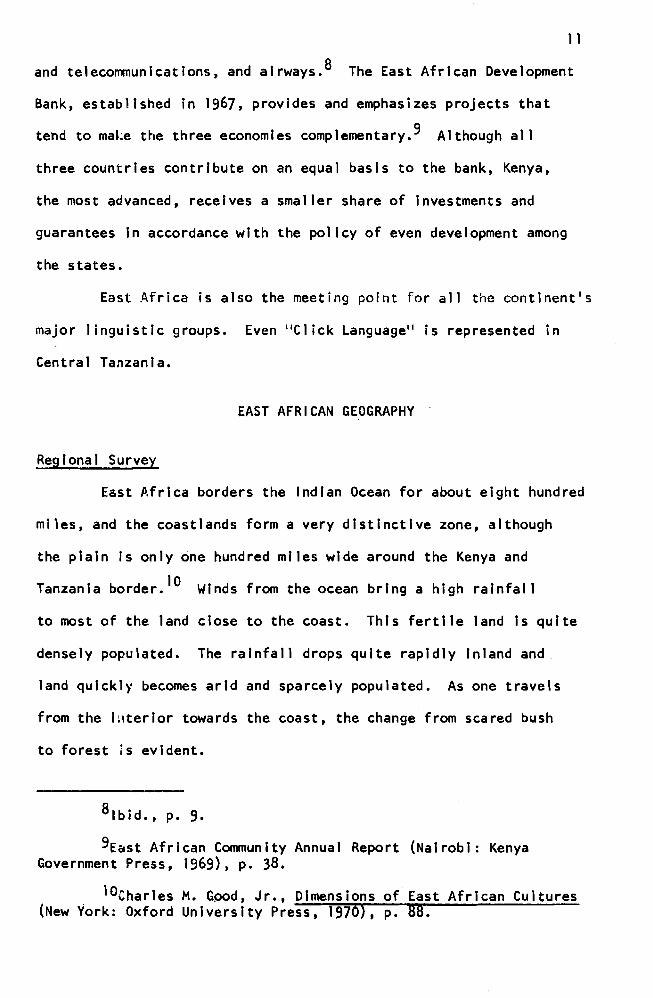
and telecommunications and alrways8 The East African Development
Bank established in 1967 provides and emphasizes projects that
tend to make the three economies complementary9 Although all
three countries contribute on an equal basis to the bank Kenya
the most advanced receives a smaller share of Investments and
guarantees In accordance with the policy of even development among
the states
East Africa is also the meeting point for all the continents
major linguistic groups Even Click Language l is represented in
Central Tanzania
EAST AFRICAN GEOGRAPHY
Regional Survey
East Africa borders the Indian Ocean for about eight hundred
miles and the coastlands form a very distinctive zone although
the plain Is only one hundred miles wide around the Kenya and
Tanzania border IO Winds from the ocean bring a high ralnfal I
to most of the land close to the coast This fertile land Is quite
densely populated The rainfall drops quite rapidly Inland and
land quickly becomes arid and sparcely populated As one travels
from the Iterior towards the coast the change from scared bush
to forest is evident
8 Ibid p 9
9East African Community Annual Report (Nairobi Kenya Government Press 1969) p 38
IOCharles H Gpod Jr Dimensions of East African Cultures (New York Oxford University Press 1970) p 8B
12
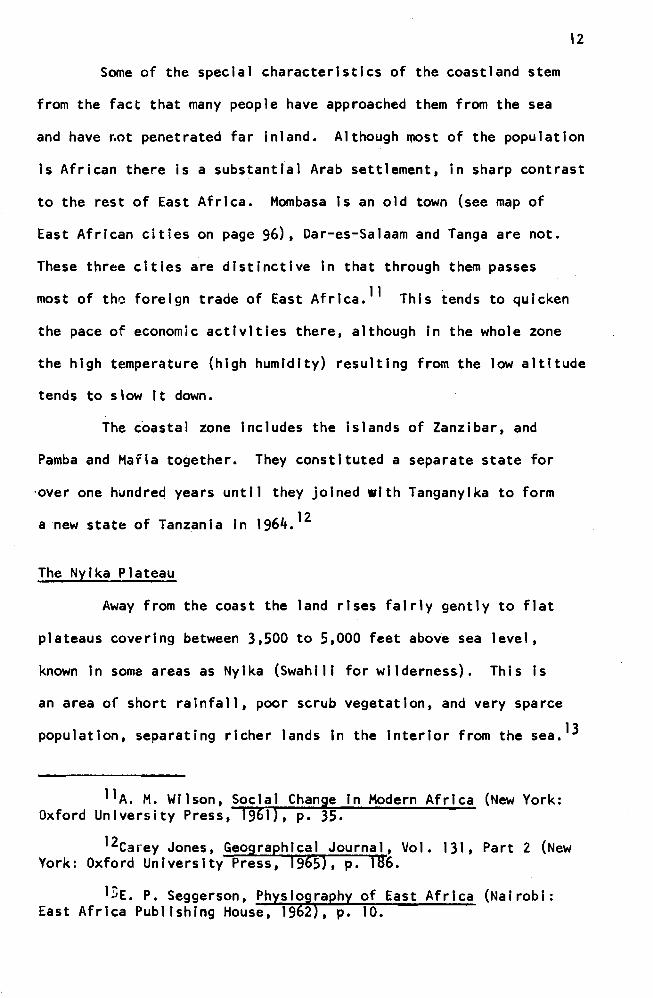
Some of the special characteristics of the coastland stem
from the fact that many people have approached them from the sea
and have ~ot penetrated far inland Although most of the population
is African there is a substantial Arab settlement in sharp contrast
to the rest of East Africa Mombasa Is an old town (see map of
East African cities on page 96) Dar-es-Salaam and Tanga are not
These three cities are distinctive In that through them passes
most of the foreign trade of East Afrlca ll This tends to quicken
the pace of economic activities there although In the whole zone
the high temperature (high humidity) resulting from the low altitude
tends to slow It down
The coastal zone Includes the islands of Zanzibar and
Pamba and Mafia together They constituted a separate state for
middotover one hundred years until they joined with Tanganyika to form
anew state of Tanzania in 1964 12
The Nyika Plateau
Away from the coast the land rises fairly gently to flat
plateaus covering between 3500 to 5000 feet above sea level
known In some areas as Nyika (Swahili for wilderness) This is
an area of short rainfall poor scrub vegetation and very sparce
13population separating richer lands In the Interior from the sea
llA M Wilson Social Change In Hodern Africa (New York Oxford University Press 1961) p 35
12Carey Jones Geographical Journal Vol 131 Part 2 (New York Oxford University Press 1965) p 186
lnE P Seggerson Physiography of East Africa (Nairobi East Africa Publishing House 1962) p 10
13
It is broken by mountain ranges notably Usambara and Pare mountains
Taita h1115 where relief brings about a higher rainfall and where
more people have settled Further south it is broken by a zone
of lowland in the basins of the Ruaha and Rufingi rivers where
settlement Is discouraged by periodic floods and disease rather
than by low r3infall Water scarce in East Africa is abundant
there and cen be controlled This area offers promise for future
agricultural development In the south of Tanzania the plateau
reappears but the rainfall exceeds thirty inches in most years
and much of the land is under cultlvatlon 14 The rainfall Is
unreliable soil is poor and the area is remote from central
economic life in Tanzania 15
Th~ highland south of the Nylka has recent volcanic rocks
It stands up as highlands reaching to 19500 feet including
KilimanJaro Mt Kenya and Elgon (see map on page 14) From the
land over seven thousand feet above sea level it extends three
hundred miles westward almost to the shore of Lake Victoria Although
It Is brokpfl by the lINorth Rift Valleyll (not shown in the map)
the floor of which in places lies six thousand feet below the land
to either side 16 In this highland heavy rainfall and fertile
volcanic soils provide excellent conditions for agriculture Much
14gt H Johnson Rainfall in East Africa Q F R Vol 5 88 (Nairobi East Africa Publishing House 1962) pp 1-9
IS ibid p 10
16Seggerson Ope cit p 10
ofx-----_ - -~~ -----------~
QOO 000 ~I)
-==----=-----shy
~ )00 -OOOt
Wi~Z1 ~ OOOt -0001
u
o
z
o
15
of the land Is under cultivation but the fruit of this agricultural
production is offset by the dense population 17
Lake Victoria Basin
The land falls slightly northward from the central plateau
of Tanzania towards the Lake Victoria Basin and the densIty of
the population is increased greatly The Basin is one of the
richest zores of East Africa supporting over a quarter of the
population of the regIon The country receives more rain and
has more fertile soil than that to the south and advantage has
been taken of its agricultural opportunities The land around
the lake in some ways forms a single unIt although it is divided
among the thr~estates This region Is densely settled by farmers
who produce much cotton as well as animal food crops also bananas
(Uganda) a~d coffee providing a green landscape all year around 18
THE ECONOMY
Subsistence Economy
In terms of the actIvity of an average East African man
or woman the subsistence element in East African economies is
probably still domlnent 19 That is to say the amount of time
the average East African spends on activities that merely keep
17w T W Morgan and N M Shaffer Distribution and Density (New York Oxford University Press 1966) p 36
18 Ibld p 38
19~ F Johnson The Sta Ie Food Economics of Tro ical Africa (Stanford Californ a Stan ord UnIversity Press 1970 p 142
16
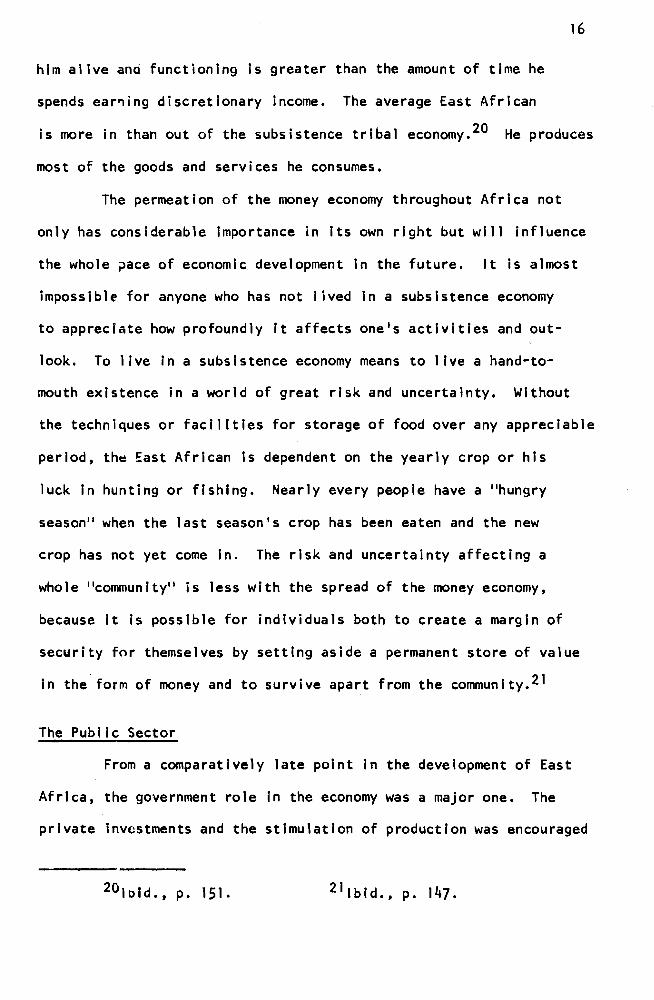
him alive ana functioning is greater than the amount of time he
spends ear~ing discretionary income The average East African
is more in than out of the subsistence tribal economy20 He produces
most of the goods and services he consumes
The permeation of the money economy throughout Africa not
only has considerable importance in Its own right but will influence
the whole pace of economic development In the future It is almost
impossible for anyone who has not lived in a subsistence economy
to appreciate how profoundly it affects ones activities and outshy
look To live in a subsistence economy means to live a hand-toshy
mouth existence in a world of great risk and uncertainty Without
the techniques or facilities for storage of food over any appreciable
period the East African is dependent on the yearly crop or his
luck In hunting or fishing Nearly every people have a hungry
season ll when the 1ast season I s crop has been eaten and the new
crop has not yet come In The risk and uncertainty affecting a
whole community is less with the spread of the money economy
because It is possible for individuals both to create a margin of
security for themselves by setting aside a permanent store of value
In the form of money and to survive apart from the communlty21
The Public Sector
From a comparatively late point In the development of East
Africa the government role in the economy was a major one The
private investments and the stimulation of production was encouraged
20 Ibid p 151 21 Ibid p 147
17
by the gov~rnment The corollary of this Is the continuing imporshy
tance of the government as employer and of the publicly owned
sector generally in the national accounts
In East Afri ca Ilcurrent government expend i tures run over
15 percent of the gross national expenditure 1I22 If one adds the
operations of the railway electricity authorities ports etc
and the investments in the whole part public sector the total
approaches Hone-third of the gross domestic product-II Together
they are therefore the dominant economic influence in the money
economy of East Africa 23 Many East Africans expect the state
or public agency to be their employer This has the effect of
reinforcing o~e of the worst heritages of colonialism--the East
Africans arceptance of the idea that the best job to have is a
government post
Excessive Expectations for Public Service
The paternalistic attitude of colonial administration
particularly after World War II also left behind the habit of
expecting co~siderable benefit from free public services--free
schools iree medical services free or subsidized electricity
and subsidized housing 24
22Enclc loped ia Amer icana East Afr ica Vol 4 (1974) p 576
23 Ioid p 577
24Abull H Jamal The Critical Phase of Emerged African States (Afairasi East African Publishing House 1965) p 101
18
The colonial government provided most of this for East
Africa1s cities--usually at the expense of the lIagr icultural popushy
lation I But with the growth of the cities and the legitimate
pol itical de~and for the expansion and extension of these services
throughout the land it becomes financially impossible to maintain
them on the uneconomic basis of the past It is also economic
nonsense to consume resources In subsidies rather than use them
for economic development 25
Thr~ughout the world pressure for such services Is present
The way it is kept in line with what Is economically feasible Is
either to charge the economic price or to hand over responsibility
for the services to the local government concerned in which case
the citizens can make a choice between paying higher taxes or using
26the money for other purposes But with the usual East African
centralization of responsibility for these services in the national
government this economic calculus does not occur so Immediately
and directly Pressure for the services thus tends to lead the
East African governments constantly to Increase their expenditures
for them and to give lower priority to other investments that might
In fact re~ult In faster growth of the national income 27
25Ibid bullbull p 129
26 1bid p 159
~~ 71bid p 179
19
POPULATION DISTRIBUTION
Accorciing to the mid-year population estimates for 1968
the population of East Africa was 268 mllllon 28 Based on the
total land area of 642252 square miles mean populatIon density
of forty-two persons per square mile is obtained When compared
with the m~jor countries of Europe and Asia the mean population
of East Africa is very low According to the 1961 census India
had a total population of 438 million on an area of 126 mil lion
square miles with a mean population density of 319 persons per
square mile 29
Table
Mean Population Estimates Per Space Land (1968)
Estimated Total Land Area Population Mean Population
(Square Mi les) 1968 Per Square Mile
Kenya 219789 9104000 41
Tanzania 342171 10325000 30
Uganda 80292 7367000 92
Regional Population
The population of East Africa may be broadly divided into
three main categories first those around the shores of Lake
2EOxford Economic Atlas East African Community (New York Oxford University Press 1972) pp 174216 and 221
29lbid
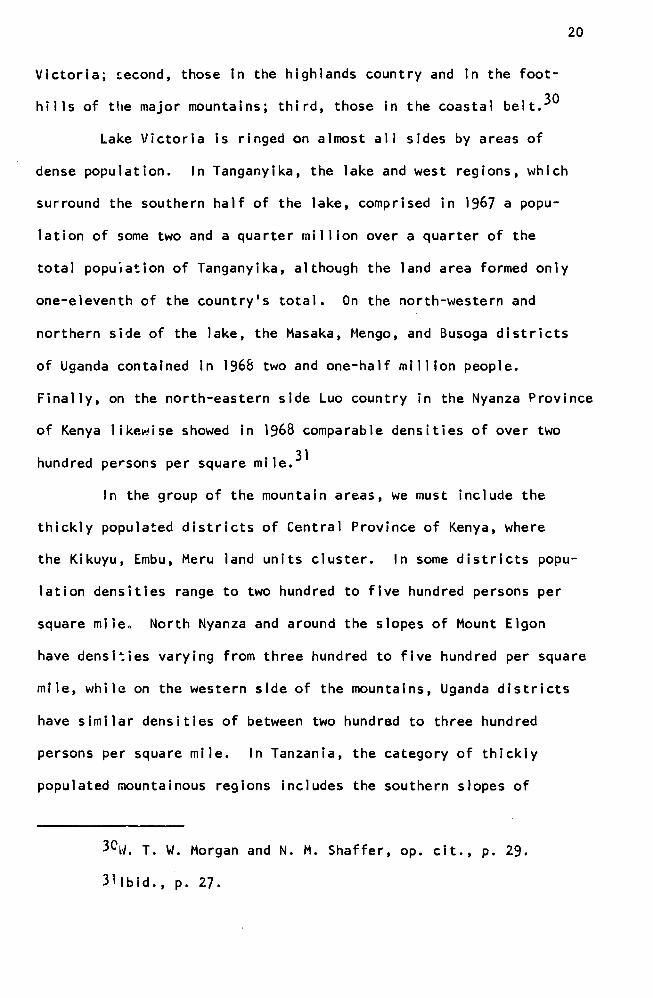
20
Victoria ~econd those In the highlands country and In the footshy
hills of the major mountains third those in the coastal belt 30
Lake Victoria Is ringed on almost all sides by areas of
dense population In Tanganyika the lake and west regions which
surround the southern half of the lake comprised in 1967 a popushy
lation of some two and a quarter million over a quarter of the
total popuialon of Tanganyika although the land area formed only
one-eleventh of the countrys total On the north-western and
northern side of the lake the Masaka Mengo and BU50ga districts
of Uganda contained in 196B two and one-half million people
Finally on the north-eastern side Luo country in the Nyanza Province
of Kenya likewise showed In 1968 comparable densities of over two
hundred persons per square mile 31
In the group of the mountain areas we must include the
thickly populated districts of Central Province of Kenya where
the Kikuyu Embu Meru land units cluster In some districts popushy
lation densities range to two hundred to five hundred persons per
square mlleo North Nyanza and around the slopes of Mount Elgon
have densl~ies varying from three hundred to five hundred per square
mile whil~ on the western side of the mountains Uganda districts
have similar densities of between two hundred to three hundred
persons per square mile In Tanzania the category of thickly
populated mountainous regions includes the southern slopes of
30w T W Morgan and N M Shaffer op cit p 29
31Ibid p 27
21
Kilimanjaro ard Mount Meru and Livingstone Mountain in Southern
Highlands 32
The coastal belt consisting of a strip of low lying country
constitutes o~r third region of highly populated density This
area has beell subject to substantial immigration The population
was attracted not only to coastal cities but also by the large
sisal and sugar industrial plants oil refinery and shipping labor
which have drawn immigrant labor from all parts of East Africa 33
Urban Population
Precise international comparisons tend to be vitalized
by the fact that the destination of urban population varied from
country to country and from census to census It Is also true
that urbanization of the population of East Africa is extremely
low
In the Tanzania census of 1968 thirty-three Igazetted
townships were defined which comprises an aggregate population
of 664072 persons of all races or 51 percent of the total popushy
lation of the country34 Of this population over a third were
In Dar-es-Salaam (228742) and Tanga (138053)
In Uganda the census of 1968 contained as gazetted townshy
shlps those which comprised an aggregate population of 409075
32Seggerson Ope cit p 138
33lbid p 139
34Rbull G Abraham East African Townshlp In A W Southhall (ed ) Social Change in Modern Africa (New York Oxford University Press 1970) p 300
22
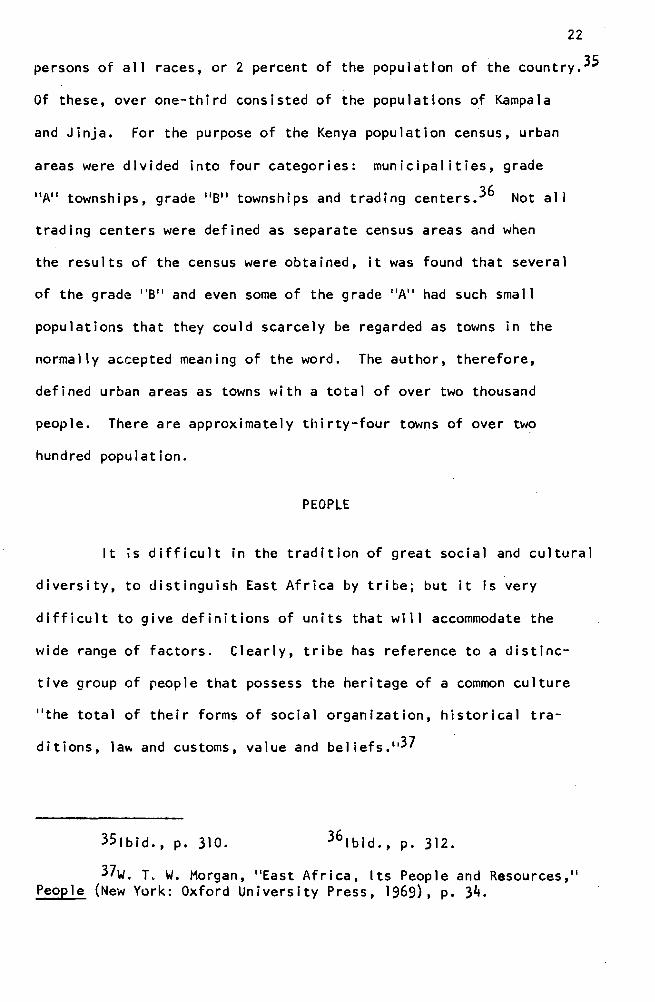
persons of all races or 2 percent of the population of the country35
Of these over one-third consisted of the populations of Kampala
and Jinja For the purpose of the Kenya population census urban
areas were divided into four categories municipalities grade
A townships grade B townships and trading centers 36 Not all
trading centers were defined as separate census areas and when
the results of the census were obtained it was found that several
of the grade B and even some of the grade A II had such small
populations that they could scarcely be regarded as towns in the
normally accepted meaning of the word The author therefore
defined urban areas as towns with a total of over two thousand
people There are approximately thirty-four towns of over two
hundred population
PEOPLE
It is difficult in the tradition of great social and cultural
diversity to distinguish East Africa by tribe but it Is very
difficult to give definitions of units that will accommodate the
wide range of factors Clearly tribe has reference to a distincshy
tlve group of people that possess the heritage of a common culture
lithe total of their forms of social organization historical trashy
ditions la~ and customs value and beliefs 1I37
35Ibid p 310 36 Ibid p 312
37w T W Morgan East Africa Its People and Resources People (New York Oxford University Press 1969) p 34
23
ThuD it is necessary to be somewhat arbitrary in disshy
tinguishing the various people of East Africa The term tribes
has the same sort of imprecise usefulness difficult to define
specifically as the term c lass in western industrial ized
countries 38 The late Dr Leaky (archeologist and sociologist)
classifies East African people into three distinctive parts
They are broadly classified on III inguistic and traditional basis ll
I into Nllotes Nilo-hlmites and Bantus 39 Such distinctions are
i 1 1 Table 2 1I The 0 1st r ibut ion of the Af r ican and the IINon-Af r ican ll
I in proportion by Cities4 1968 0
I 1 1
Country African INon-Afr Ican ll
Tanzania 4 1 721
Uganda 30 850
Kenya 53 850
very adequa~e to the actlvltes and interests which are of concern
to the people themselves in their ordinary lives For example
the Luo (nilotic) with their communal living society and with a
mixed economy of agriculture do not resemble the Masai (nlloshy
hlmltes) with their pastoral economy who are non-farmers they
~ 38 10 id p 36 39Ibid p 38
4UR G Abraham op cit p 318 IINon-African ll comprises people (male or female) of European or American origin Arabs Indians and Far East Asians
24
do not eat sea food The Bantus In East Africa (found mainly on
the southern hemispheres of Africa) have an exceptionally wide
range of cultures and economic systems 41
The Tribal Iassification
The term East African people identifies about 11110 different
people in the mainland Tanzania about 35 in Kenya and about 37
In Uganda42 Of these five comprise over a million people each
forty-threp exceed one hundred thousand people The smallest
tribes contdln only a few hundred people but their culture intershy
mediate zo~es are generally between one and another 43 Blackers
book of East African lIdemography provides an adequate overall
account of the traditional culture and social system of perhaps
thirty of these tribes 44
A number of larger and Important tribes remain still
undescribed by modern standard needs Published studies of social
and economic changes In recent decades are fewer even for those
people such as Kikuyu and Chagga where change has been most
radical Most books dealing with the traditional cuiture of East
African people were written many years ago and are not reliable
41Morgan Ope cit p 40 42 1bid p 36
43E A Blacker lIDemographyl1 (New York Oxford University Press 1948) p 43 The best general surveys of available Inforshymation are contained In the volume of the lIEthographic Survey of Africa (East Central Africa) 11 (London International African Institute 1970) p 70
441 bId p 79
25
guides for the study of people of East Africa in the second half
of the twentieth century
Historical Clusters
Although some tribes remain as little more than names on
the enthographlc map It Is possible to group the better known
people Into clusters which are identifiable In terms of common
historical traditions linguistic similarities and certain related
social Institutions and values As far as present knowledge goes
the following clusters are fairlyclear Only the larger tribes
are indlca~ed In the lists
Tribal names are given in their root forms
(a) Nilotes--Acholi Alur Lango Luo Padhola (b) Nilo-Hamites--(eastern Nilotes)
1 Teso Cluster--Karamojong Teso Turkana 2 Kalegln-Elgeyo Kipsiqis Nandi Tuqen 3 Masal Cluster--Arusha Masal Samburu 4 Tatoq Cluster--Barabalg
(c) Inter-custrlne Bantu--Ganda Ha Haya Klga Nkole Njoro Rundl Rwanda Soya Toro
(d) Elgon Bantu--Aisu Lugya (e) North Eastern Bantu--Chagga Embu Gusli (kissl)
Kamba Kikuyu Meru Mbere (f) Coast Bantu-Bondei Olgo Mljikenda Sambaa Zigua (g) Nyamwezi Cluster--Bena Hehe Sangu (h) Luguru Cluster--Kaguru Luguru Ngru4(I) Rouma Cluster--Makinde Makua Mawia 5
In no case are all the people of a cluster identical In
their econOOlic system In terms of their traditional economic
systems and the exploitation of the natural resources a more undershy
standable classification can be made In the following way
45 1bId p 15
26
A Primary Pastoral Economy with little or no agrlculture-shyBarabaig Boran Masal Redille Saburu Somalia Pastoral suk Turkana
B Mixed Pastoral and Agricultural Economy I Pastoral Ism predominant--Aogo Karamojong Klpsiqis
Kuna Nandi 2 Agriculturalism predomlnant--Arusha Bela Klssl
Ha Hehe Iraqw Iramba Kamba Lango Luqbata North Luhya Luo Njakjusa Padhola Rangl Hlgland Suk Sukuma Teso Tugen Turu
C Mainly Agricultural Economy with minor pastoral Interests--Acholl Alur Chagga Embu Alsu Kikuyu Nyoro Sambaa Toro
D Primary Agricultural Economy with little or no husshybandry--Digo Ganda Haya Klga K~gjO Makua Ngorl Ngindo Nyanwaz Soga Yao Zaramo Zlqua
There have been great basic changes that have occurred in
the last two decades toward a greater development of agricultural
Interest slight disappearance of tribal territories (traditions
of belief) due density Increasing demand for cash income and
greater att~nton to crop production husbandry by government and
47commercial concerns
AFRICAN HERITAGE
In general African cultural social background relevant
to economic development is very different from that of any other
developing region of the world Because of Africas geography
great size and climate It was after 1900 that the Influence of
the rest of the world began to reach most of Africa South of
Sahara 48
46 I bid p 2I bull 47Morgan Ope cit p 36
48~ K~ Schneider In W R Bascom and M J Herskovlts Continuity and Change In East African Cultures (Chicago University of Chicago Press 1959) pp 144-167
27
Perhaps there is a need to break the old African tradishy
tional heritage that Is passed to modern Africa A study of the
old African economy shows that it was one In which the methods of
production were simple and the units of production were small
The mlddle-nlen were both hated and Indlspensible Agricultural
progress was seriously impeded by the perpetuation of communal
right-over land 49 Chronic underemployment was one of Its basic
problems and despite moral exhortations among the people the
propensity to save was low It was an economy heavily dependent
on foreign sources for improved Industrial and agricultural methods
and to so~e extent for capital 50 The ambitious young men often
preferred careers In the professions and government service Men
here wrongly pinned their hopes on industrialization and economic
nationalism to absorb Its growing population Industrialization
was slow to come and the blessing of economic nationalism proved
to be mixed 51
The Extende~ Family
Perhaps even more Important than economic outlook both
positively and negatively Is the Inheritance of the continuing
strength of the tribal ties to which nearly all East Africans are
subject To begin with one must consider the L1neage Systems
49bld p 152
seA I Richard Economic Development and Tribal (Nairobi East African Publishing House 1969) p 78
Change
51lndustrlallzatlon In East Africa 5th Edition by United Africa Press Natrobl 1966 p 87
Published
28
or extended familyll--under which an individual has deep ties with
and feels obligation to a large number of people beyond the nuclear
family of the fathers mother and chlldren 52 Good fortune is
shared with m~ny others and In crisis one Individual can calion
help from many others
UnfCrtunately in terms of potential economic development
the extended family has many drawbacks It tends to discourage
Individual enterprise and Initiative as the burden of family
53obligations rise with the degree of an indlviduals success
There are other drawbacks Family crises tend to prevent
accumulation of capital or drain away the discretionary purchasing
power 54 The people with small incomes find it hard to comprehend
the greater cost of living of individuals with higher incomes
The age structure for the East African population is sigshy
nificant for as In most underdeveloped countries a large proshy
portion of the population is not of working age 55 Children of
fourteen years or under account for about 45 percent of the total
population which is comparable with the figure for Nigeria or
Brazil and in East Africa many children assist in picking cotton
or herding cattle Nevertheless productivity Is generally far
lower than that of adults and as increasing numbers of children
52UNESCO 11Popuiation Movements in East Africa in K M Barbour an~ R M Prethero (eds) Essay on African Population Routledge and Kegan (New York Oxford University Press 1961) p 96
53Ibid p 98 54( bid p 100
55L H Brown in E W Russell (ed) The Resources of East Africa (Nairobi Llterative Bureau 1968) p 102
29
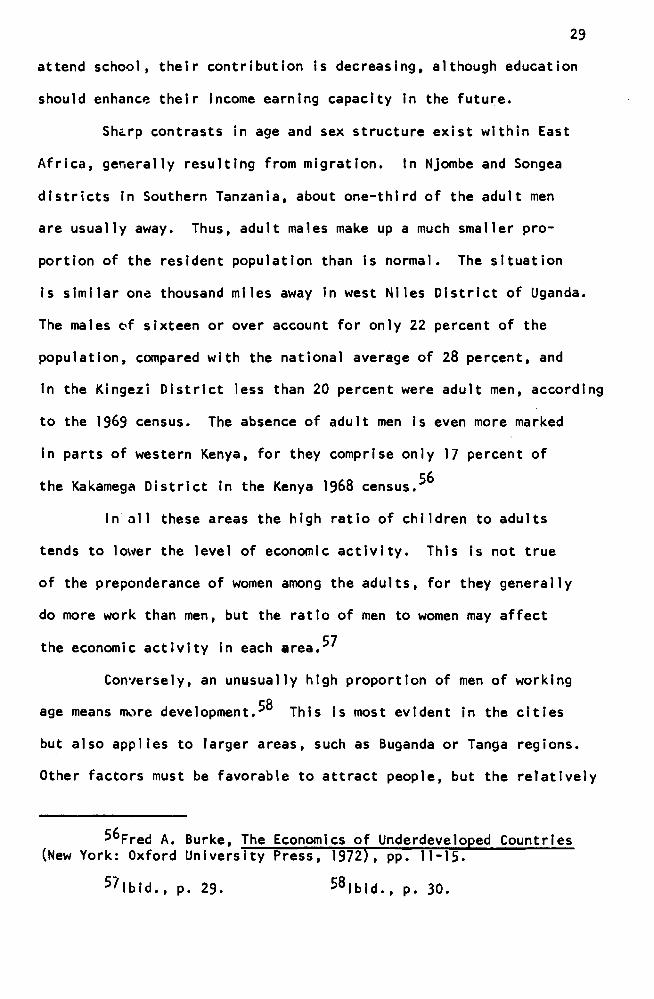
attend school their contribution is decreasing although education
should enhan~p their income earning capacity in the future
Sh~rp contrasts in age and sex structure exist within East
Africa generally resulting from migration In NJombe and Songea
districts in Southern Tanzania about one-third of the adult men
are usually away Thus adult males make up a much smaller proshy
portion of the resident population than is normal The situation
is similar on~ thousand miles away in west Niles District of Uganda
The males of sixteen or over account for only 22 percent of the
population compared with the national average of 28 percent and
In the Kingezi District less than 20 percent were adult men according
to the 1969 census The absence of adult men Is even more marked
in parts of western Kenya for they comprise only 17 percent of
56the Kakamega District In the Kenya 1968 census
In Q1I these areas the high ratio of children to adults
tends to lo~er the level of economic activity This is not true
of the preponderance of women among the adults for they generally
do more work than men but the ratio of men to women may affect
57the economic activity in each area
Con~ersely an unusually high proportion of men of working
age means ~)re development 58 This is most evident in the cities
but also applies to larger areas such as Buganda or Tanga regions
Other factors must be favorable to attract people but the relatively
56Fred A Burke The Economics of Underdeveloped Countries (New York Oxford University Press 1972) pp 11-15
57 58Ibid p 29 Ibid p 30
30
high level of activity In areas such as Buganda is certainly related
to the age and sex and especially to the numerous Immigrant men
who either work as laborers or grow cash crops on their own account
there rather than In their home area
THE ECONOMIC ACTIVITIES OF EAST AFRICA
Trading Is an extremely Important economic activity even
though It Is not Itself productlve 59 By redistributing goods It
increases their value and It provides much employment in the process
Yet trading is sometimes omitted In studies In marketing geography
partly because of little data available on internal trade in East
Afrlca 60 However the main tradIng pattern of the regIon may be
outlined
Trade plays a smaller part In East African life than in
that of more highly developed regIons where peoples wants are
greater and where they satisfy few of their own requirements It
Is less Important even than in West Africa where It forms the
main Inter~st of an enormous number of people 61 Most East African
people produce theIr own food and cannot afford to buy many other
goods Nevertheless some goods are now sold In many parts of the
region and the proceeds are used to buy goods produced elsewhere
Commerce Is thought to contribute about 10 percent of all paid
59M Andrew Kamark The Economics of African Development (New York Praeger 1971) p 68
60 1bld p 98
61 Abull I Richard Economic Development and Tribal Change (Nairobi East African publishing House 1969) p 83
31
employment This commerce was mainly introduced since 1900 but
It has been superimposed on the traditional pattern of small-scale
trade which has not been entirely superceded
The Importance of trade In East African life has greatly
increased thrQugh the development of new forms of exchange which
Involve selling of goods for cash and buying goods produced far
away Ori31nally such trade consisted almost entirely of sales
for export overseas and the purchase of imported goods but today
an increased volume of sales Is to other parts of East Africa and
many of the commodities purchased have been produced within the
reglon 62
ThIs type of trade has provided the main basis for urban
development Both the large cities and the small towns of the
regions owe much of their present Importance to their trading
function even though many originated as administrative stations
within most rural areas the settlement pattern Is highly dispersed
and the clusters of bui ldlngs which are sometimes termed villages
usually consst mainly of IIdukas 163 Host of these small trading
centers grew up to handle the Import and export trade although
many now serve as markets for local trade
In review of a survey conducted by Keegan East Africa dukas
are very small carry one hundred items and occupy no more than
62Dbull A Hawks Official Journals East African Trade (Nairobi East Afric~ Publishing House 1963) p 10
63Warren J Keegan Multinational Marketing (New Jersey Prentice Hall Incorporated 1974) pp 308-9
32
fifty to seventy-five square feet 64 This indicates that the dukas
were operating on an average gross margin of approximately 12 percent
which is considered to be lower cost form of distributlon 65 The
East African duka Is highly Inefficient as a form of distribution
because the sales per person in the duka are much lower to keep
the duka developing significantly with the community economy
THE DISTRIBUTION OF TRADING ACTIVITY
Nairobi
The most important center of trade In East Africa Is Nairobi
A photograph of Nairobi Is provided on page 33 to give an example
of the modern cities of Africa Administration manufcaturlng and
commerce are three main functions of the city and are all comparable
In importace each employing more than fifty thousand people 66
The 1960 survey of distribution recorded one thousand wholesalers
In and out of a total for Kenya of three thousand It recorded two
thousand retail establishments compared with similar numbers In the
next nine towns of the country together 67 The value of all sales
by these ~airobi traders in 1960 was shs 400 billlon 68
T~e great Importance of Nairobi as a trading center Is
related to the fact that it performs trading functions at several
levels In some fields It serves the whole of East Africa and
64 Ib id p 308 65 Ibid p 309
66Mcrgan op cit p 70 67 Ibld p 72
6RKenya Chamber of Commerce Trade (Nairobi Kenya Governshyment Press 1973) p 5
34
in more ways it serves Kenya and Uganda and a small part of
Tanzania
In retail trade Nairobi serves a large area part of which
is relatively prosperous Its pre-eminence has probably hindered
the growth uf neighboring towns such as Limuru and Ruiru as shopping
centers Even Thlka thirty miles north of Nairobi Is more Important
in manufacturing than In trade 69 Much of the retail trade of
Nairobi however Is dependent on the large population and purchasing
power of the city itself Many people obtain their living by supplying
the needs of the administrations Industrial workers and even the
establishment of groups of up to thirty shops at various points
throughout-the higher class suburbs 70
The iMportance of Nairobi Is trade and Is related to Its
functions as the capital of Kenya and In some respects as administrashy
tive center for East Africa There Is a close relationship In which
its Importance In such fields as banking and Insurance are also
involved T~o other factors which favor Nairobi more than possible
rivals SLch as Mombasa are Its centrality in both Kenya and East
Africa and Its location on the eastern edge of the most prosperous
part of the region No town Is better placed to serve the whole
of Kenya or to serve all countries especially since means of comshy
munication have been on Nairobi The country south and west is
sparcely populated but In that to the north and east much purchasing
power Is concentrated There are substantial ve~y affluent European
69 Ibld p 6
70Ibld p 9
35
and African settlements which are of increasing significance as
71cash Income rl5es
Mombasa
Mombasa is not only the leading port In East Africa but
also a major center of trade The first function has led to the
second and the two together have enabled it to become the second
city of Kelya with a population of 380000 (1969 Census)72
Although many importing and exporting firms have headquarters in
Nairobi and their goods are consigned directly to or from the
port many others have offices in Mombasa and compete successfully
for the trade of a large part of East Africa Most traders in
Moshi for example and many in Kisumu or Kampala obtain supplies
through Mombasa importers The export marketing trade provides
much employment outside the port area far apart from private firms
concerned mainly with exports The Uganda Coffee and Lint Marketing
Board has large warehouses In Mombasa 73
Mombasa functions In retail and local wholesalers markets
but this activity Is small in relation to its size Its sphere
of Influence is inevitably reduced by its coastal location while
much of its immediate inner land is arid and sparcely populated
The ships calling at the port provide extra trade for they generally
71A M Wilson Social Change In Modern African Trade (New York Oxford University Press 1961) p 193
720xford Economic Atlas (New York Oxford University Press 1974) p lQ7
73Encyclopedia Americana East Africa Vol 4 (1974) p 579
36
take on some supplies and their crews and passengers often spend
some time clshore However this is of small Importance In comshy
parison with the export trade
Dar-es-Salaam
In some ways Dar-es-Salaam combines the functions of Nairobi
and Mombasa since it Is both the capital and the leading port of
74Tanzania Each of these roles encourages trade and the city
is much the most Important center of trade In the country On
the other hand It does not dominate the whole country as much
as Nairobi and Mombasa together dominate Kenya for both North
and South have only limited marketing connections with It Arusha
and Moshi have closer tradIng links with Kenya cities and with
the port of Tanga Bukoba has closer ties with Uganda and Kenya
and Mowara Region Is often linked physically with the capital only
by sea and It is therefore commercially Independent to some extent
Dar-es-Salaam also plays a smaller role than Nairobi and Mombasa
combined It Is comparable In size with the latter and Its inhabishy
tants are very much dependent on Its trading functions It is the
main center of import export and wholesale trade for the area
of 280000 square miles and a population of 19 million people 75
It Is also the center of small-scale wholesale and retail trade
for the coastal region while the purchasing power of the city populashy
tion is sufficient to support a wide range of specialized shops
74B F Joh~son The Sta Ie Food Economics of Tro leal Africa Tanzania (Stanford Stan or UnIversity Press 9 p 131
7Ibid p 26
37
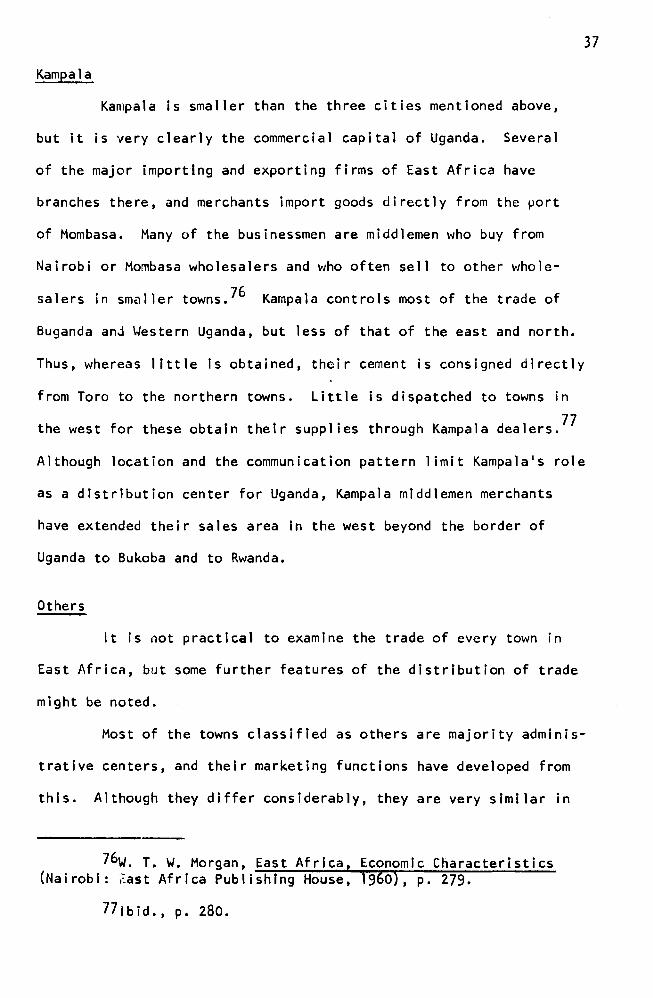
Kampala
Kampala is smaller than the three cities mentioned above
but it is very clearly the commercial capital of Uganda Several
of the major importtng and exporting firms of East Africa have
branches there and merchants import goods directly from the port
of Mombasa Many of the businessmen are middlemen who buy from
Nairobi or Mombasa wholesalers and who often sell to other wholeshy
salers in sm~ller townsJ6 Kampala controls most of the trade of
Buganda and Western Uganda but less of that of the east and north
Thus whereas little is obtained their cement is consigned directly
from Toro to the northern towns Little is dispatched to towns in
77the west for these obtain their supplies through Kampala dealers
Although location and the communication pattern limit Kampalas role
as a distribution center for Uganda Kampala middlemen merchants
have extended their sales area in the west beyond the border of
Uganda to Bukoba and to Rwanda
Others
It is not practical to examine the trade of every town in
East Africa but some further features of the distribution of trade
might be noted
Most of the towns classified as others are majority adminisshy
trative centers and their marketing functions have developed from
this Although they differ considerably they are very similar in
76W T W Morgan East Africa Economic Characteristics (Nairobi ~ast Africa Publishing House 1960) p 279
77ibid p 280
38
appearance In addition to administrative functions these towns
provide services such as hospitals and they have generally become
centers of local communication The features tend to enhance their
roles In trade The size and importance of these trading centers
is generally related to the size population and propensity of the
areas they serve Most of these towns are newly created Their
populations range from between three thousand to six thousand and
they have rather less than one hundred shops most along a single
main street 78 All are retailers but many also sell goods to traders
from the countryside and buy some local agricultural products
Mo~t of the towns created are very young and they came into
existence due ~o the scarcity of land These towns are scattered
throughout East Africa and vary In both size and frequency with
the density of population and the local level of income
COMMUNICATION ACTIVITY
Transportation has become an Important economic activity
Official estimates place Its contribution to the Gross Domestic
Product of East Africa at ~45 million which accounts for 61 percent
of the total 79
Road Transportation
Road and rail transportation are probably roughly comshy
parable as sources of Income In East Africa although they differ
78~NESCO Opt cit p 96
790xford Economic Atlas (Oxford Oxford University Press 1966) pp 174216221
39
greatly in structure Road transportation is operated mainly on a
very small scale but there are so many small operators that the
number of people earning a living in road transportation Is very
large SO Motor vehicles came Into general use in the 1920s but
the greatest expansion of road transportation came thirty years
later Today there are many more vehicles per head of population
than in Nigeria or even Egypt approximately six persons per cad IISl
In Table 3 on page 40 road transportation shows that the majority
are private cars but the figure for vans lorries and busses undershy
states the volume of commercial road transportation Cars on many
East Africa roads are used legally or otherwise as taxis proshy
viding many people with good incomes This Is especially well shy
developed in Uganda and helps to explain the small number of busses
there Within each country road transportation activity Is heavily
concentrated In the most prosperous areas especially around the
capital Traffic counts show a far greater intensity on roads around
Nairobi M0mbasa Kampala Jlnja Dar-es-Salaam and Tanga than
elsewhere
The overall Importance and the pattern of road transportation
are both affected by the nature of the road network Road building
has been assisted by the character of the earth in many areas
simple earth murram road serving very well for light traffic
Although few roads are tarred the road network is ~uch better
than In countries such as Sudan and in much of East Africa is
SOlbid pp 147 174 193
81Ibid pp 147 174 183 193
40
Tab Ie 3
Transportation in East Africa (1963-73)82
Kenya Tanzania Uganda Totals
Thousand miles of roads of which bitumen surfaced
(thousands units 000)
Private Vehicles Commercial
Lorries Vans Busses
1963 Flgur~s Private Commercial
Ra 11-Track (In kilometers)
Rail-Vehicles (units 000)
Air-Craft (units 000)
Sea Transportation
nd -- No data available
522
22
1002 295 104 82 26
440 90
962 km
163
05
nd
409
22
726 304 11 I 74 22
220 80
3782 km
42
nd bull nd
39 I
07
619 208 64 70 17
180 60
1 160 km
72
04
nd
1322
5 I
2345 80 1
840 230
59 km
17
82 Ibid pp 174216221
41
adequate for the demand made upon it 83 Some areas without roads
notably in central and western Tanzania are found In other areas
many roads 3re Impassable In the wet season but themiddotdlstrlbutlon
of road transportation activity Is related mainly to factors other
than the roads themselves
Rail Transportation
In spite of competition from the roads railways of East
Africa still undertake most long-distance movement of bulk loads
All are operated by East African Railways Corporation on behalf
of the three governments The rail works employ more than eighty
thousand people
The entire railway system covers 5895 kilometers all
being meter gauge and virtually all single track 84 The East
African Railway Corporation Road Services Is operated mainly In
Uganda and Tanzania although a nucleus of road services between
Mombasa and Nairobi was established to provide express services
for certain commodities
The railway has been Increasing at a moderate rate over
the past few years Between 1965-1971 passenger number rose by
an average of 66 percent per year While the corresponding growth
85rate of freight was approximately 10 percent
83 lbld pp 147 174 193
84 IbId p 39
85Ibld pp 147 174 193
42
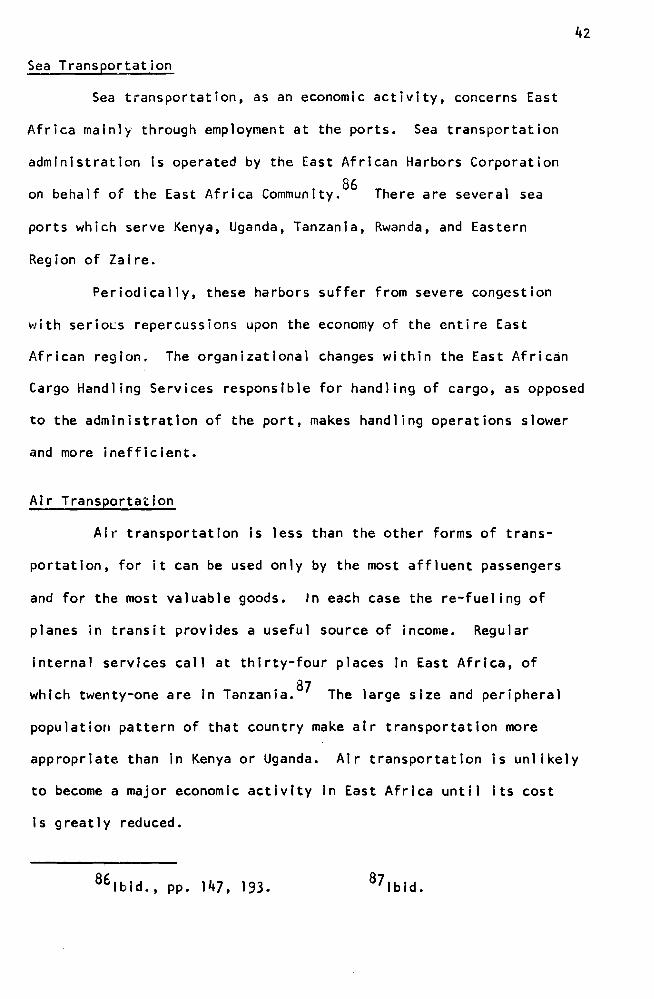
Sea Transportation
Sea transportation as an economic activity concerns East
Africa mainly through employment at the ports Sea transportation
administration is operated by the East African Harbors Corporation
on behalf of the East Africa community86 There are several sea
ports which serve Kenya Uganda Tanzania Rwanda and Eastern
Region of Zaire
Periodically these harbors suffer from severe congestion
with serio~s repercussions upon the economy of the entire East
African region The organizational changes within the East African
Cargo Handling Services responsible for handling of cargo as opposed
to the administration of the port makes handling operations slower
and more inefficient
Air Transportation
Air transportation is less than the other forms of transshy
portatlon for it can be used only by the most affluent passengers
and for the most valuable goods In each case the re-fuellng of
planes in transit provides a useful source of income Regular
internal services call at thirty-four places In East Africa of
which twenty-one are In Tanzania 87 The large size and peripheral
populatiofl pattern of that country make air transportation more
appropriate than in Kenya or Uganda Air transportation is unl ikely
to become a major economic activity In East Africa until Its cost
Is greatly reduced
86 Ibld bullbull pp 147 193 87 lbld bull
43
Communication Media
Communication media includes television radio receivers
telephones and dally newspapers These sources are growing at a
88rate of 10 percent per year The growth In urban areas Is higher
than In rurai areas No current data are avaIlable
Tab Ie 4
Communication Medla89 (Thousands) 1963
Kenya Uganda TanzanIa
Television 22 1 100 00
Rad 10 Reef Ivers 70 I 400 300
Telephones 6 1 6 1 32
Da II y Newspapers 190 123 83
SUMMARY
This review of literature was divided Into eight areas which
are pertinent to this study It was designed to provide background
Information related to
A East African Political Environment
1 Regional Survey
2 Nyika Plateau
3 Lake Victoria Basin
88Morgan East Africa Economic Characteristics p 36
890xford Economic Atlas Ope cit Table 1
44
B The Economy
1 Subsistence Economy
2 The Public Sector
3 Excessive Expectations for Public Service
C Population Distribution
1 Regional Population
2 Urban Population
D People
1 Tribal Classification
2 Historical Clusters
E African Heritage
1 The Extended Family
F Understanding the Economic Activities of East Africa
G The Distribution of Trading Activity
1 Na I rob I
2 Mombasa
3 Dar-es-Salaam
4 Kampala
H Communication Activity
1 Road Transportation
2 Rail Transportation
3 Sea Transportation
4 Air Transportation
5 Communication Media
Chapter 3
DESIGN OF THE STUDY
EAST AFRICAN ELITE
This survey was conducted and certain Information provided
to the argument of the study However difficulties of conducting
research 11 the formerly British-controlled territories of East Africa
are no different from those encountered elsewhere only more intense
because of lack of basic bench-mark data and basic socloeconomic
data Stratified probabil ity sampling in more advanced societies
can be designed in many ways Voters rolls rate-payers registers
and the like are usually up-to-date and easily available to the
researchers Such data do not exist in East Africa I Survey
research must be designed therefore on what data are available
There is little constructive value In the criticisms of the purist
that sampling techniques used in Africa do not fit acceptable
Western standards 2 It Is true that they do not but Leonard Doob
states that lithe scholarly or scientific gains to be derived from
ILeonard W Doob Periodic Surve s In Sub-Saharan Africa (Nairobi Nairobi Publishing House Hay 11 1970 p 3 bull
21~id p IS
45
46
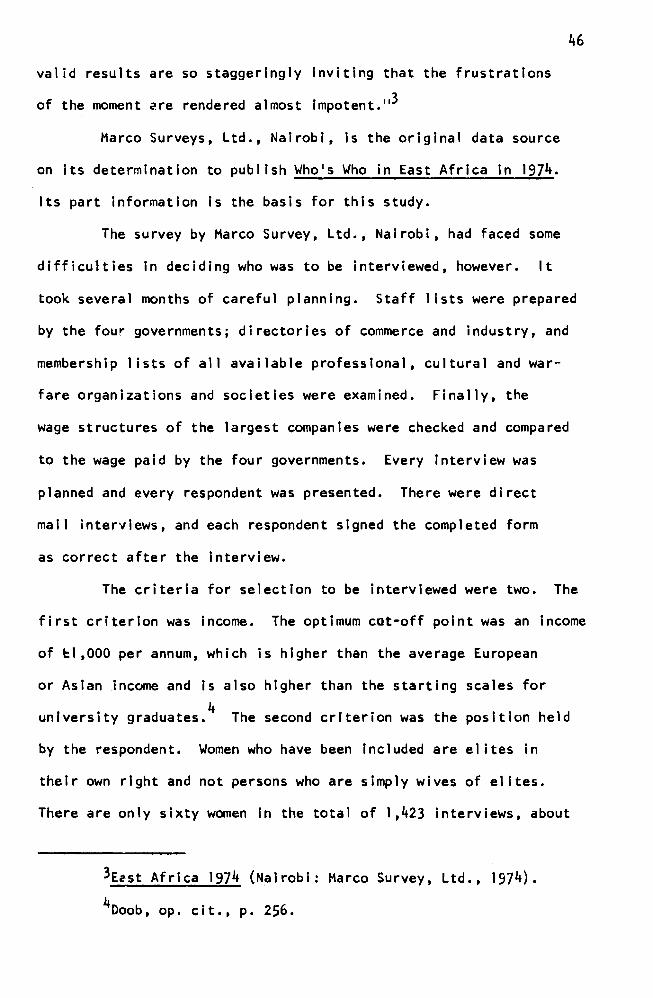
valid results are so staggeringly inviting that the frustrations
of the moment Cre rendered almost Impotent- 1I3
Marco Surveys Ltd Nairobi Is the original data source
on its determination to publish Whomiddots Who in East Africa In 1974
Its part information Is the basis for this study
The survey by Marco Survey Ltd Nairobi had faced some
difficulties in deciding who was to be interviewed however It
took several months of careful planning Staff lists were prepared
by the four governments directories of commerce and industry and
membership 1ists of all available professional cultural and warshy
fare organizations and societies were examined Finally the
wage structures of the largest companies were checked and compared
to the wage paid by the four governments Every Interview was
planned and every respondent was presented There were direct
mall intervIews and each respondent signed the completed form
as correct after the interview
The criteria for selection to be interviewed were two The
first criterion was income The optimum cot-off point was an income
of ~I 000 per annum which is higher than the average European
or Asian income and Is also higher than the starting scales for
4university graduates The second criterion was the position held
by the respondent Women who have been Included are el ites In
their own right and not persons who are simply wives of elites
There are only sixty women in the total of 1423 Interviews about
3Eest Africa 1974 (Nairobi Marco Survey Ltd 1974)
4Doob Ope cit p 256
47
4 percent so sex was not used as a basts of tabulating the socloshy
economic data
This data Is presented on a comparative basis to Illustrate
by the basic =lassiflcation data the differences and similarities
of the African elite of the three countrles--Kenya Uganda and
Tanganyika Zanzibar has been Included and treated separately In
most of the tables
This study Is divided Into three parts The first Is an
analysis of the elite In East Africa based on the basic classificatory
data that w~s collected In the original research for Whos Who in
East Africu5 and additional studies which In addition to describing
the elite give Insight Into their opinions attitudes and beliefs
The second is a survey of urban elite opinions on basic social
and economl~ problems and technical assistance It Is based on a
stratified probability sample of those who most closely resemble
the elite in three African capital cities The third describes a
survey which Is beginning to provide research Into changing attitudes
and knowledge that will temporal orientation determlnlsm 11 The
sample will be described at the beginning of the second part for
each of these surveys and a few sample tables will be given to
Illustrate some of the results of this research
Approximately 6 percent of the Africans listed for Intershy
view refu~ed to be Interviewed There were numerous reasons given
for refusing but the chief factors were education and personal
reasons claiming that they were not Important enough to be included
5Marco Survey op cit p 19
Na I rob I
URBAN ELITE OPINION
Order (Englewood Cliffs chapter 4
A recent study poses the hypothesis that the role of the
Standard codes were used to clarify the data and cards
be said that the attitudes and opinions expressed In answer to
East Africa to test the attitudes and opinions of the city African
The interviews were conducted by permanent senior research
48
6Fred G Burke Africans Quest New Jersey Prentice Hall Incorporated
questions are those of the elite but they do represent the opinions
and education The respondent had to have had some secondary edushy
affairs and social problems The sample was stratified by age
the interviews were conducted or had many years of residence there
Inevitably some of those listed were not available for Interview
on certain questions Involving his personal life International
cation and had to be at least eighteen years of age It cannot
a stratified robability sample in each of the capital cities of
Five attempts were made In every case of this type before giving
city in Africa is that of generator communicator Innovator and
Intergrator 6 The research accepted this hypothesis and designed
were punched for 80-column ICT data-processing equipment in
up An estimated 10 percent of those listed were no t avai lable ll
assistants All of these have at least a Bachelor of Arts degree
for interview for one reason or another
or its equivalent and are either nationals of the country in which
49
and attitudes of a probability sample of urban African eighteen
and over who has had some secondary education and who lives in
one of the capital cities of East Africa Therefore the opinions
of this group will be closer to those of the elite than a sample
based on the population as a whole
The people interviewed were chosen in the following manner
Each city including peri-urban and dormitory areas was divided
into geographical units using a grid method on a base map Each
square of the grid was numbered except for those that were in
the business area--marshalling yards ocean and the like--and 10
percent of the squares were chosen by using a table of random numbers
The number of units of housing In each was then determined and
the quota was divided proportionately between each The interval
between units was determined and a starting point selected
The interviewers continued Interviewing to the set interval
until the quota was completed Three callbacks were made where
necessary for each respondent before declaring that interview
void The household was defined as that group which regularly
takes its meals together The head of the household was Intershy
viewed to determine how many In the household of either sex were
over eighteen and had had some secondary school education Those
were then listed and the person to be interviewed was selected
by a system of random numbers Only one person was Interviewed
In each household If the unit did not have at least one person
as defined by education the interviewer then proceeded to the
next household by the fixed interval Ten percent of the intershy
views were checked by field supervisors The Interviews were
50
conducted i~ English for the most part but some Swahili was used
in Dar-es-Salaam
The questionnaires were pretested in each of the capital
cities and the questions were modified where necessary The
translation of Swahili was made in the usual way of two separate
translators who worked from Engl ish to Swahil i and vlce versa
The interviews were conducted from September 15 to October
5 1974 The tables have been shortened for prInting convenience
by grouping items that have less than 5 percent response Into the
category 1I0thers 11 Percentages were rounded to the nearest whole
number or if the percentage was too small in a subsample whole
numbers were given in parentheses
OPINIONS AND ATTITUDES
The following is a description of a few of the questions
which were used in pretesting a series of eighteen questions in
three capital cities of East Afrlca to establish eight scales to
assess opinions and attitudes about temporal orientation governshy
ment confidence and optimism science and determinism conception
of people politics and tribalism or traditionalism It is Intended
that the scales when adequately tested revised and evaluated
can be used for per lodlc surveys at least fixed intervals over
1I7the next five years Such surveys will provide scales that can
be used to measure social change and that can be used to compare
7Gordon H Wilson liThe Transformation of East Africa Basic Scale for Periodic Research (New York Basic Books Printer 1971) p 456
51
data from the three capital cities and also to compare the basic
data between the elite of the urban areas and probability samples
from selected rural areas
The pretests were carried out in Nairobi Kampala and
Dar-es-Salaam Each was based on a probability sample of 150
people stratified by age eighteen and over and education The
respondent must have had some secondary education In fact the
sample for the pretests were chosen on the same basis as the survey
described In the third part A probabilIty sample of this type
Is unavoid~bly composed mostly of males young adults who are
relatively wealthy engaged In the more skilled occupations and
professIons representing the politically and socially Important
members of the community It closely resembles the elIte described
In the second part of this chapter The research selected only
a few questions to Illustrate the possible value of the results
It Is patently evident however that though these one-shotll
results are
bull merely interesting or suggestive they will become significant and really helpful when comparative data are obtained over a period of time so that trends knowledge and public ftplnlon can be detected and measured by established scales
8 b t d p 456
Chapter 4
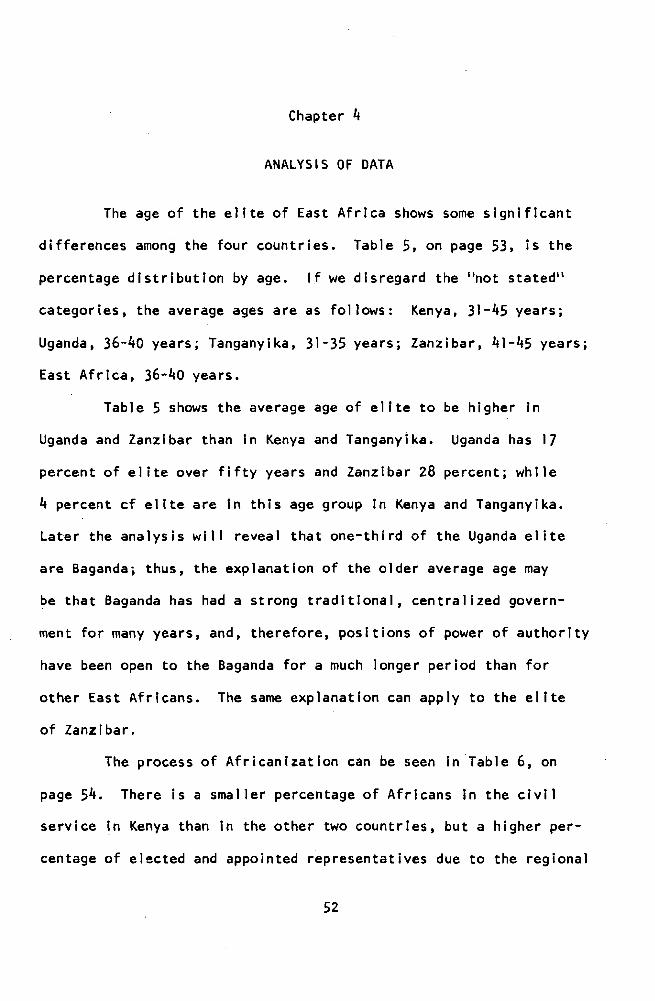
ANALYSlS OF DATA
The age of the elite of East AfrIca shows some sIgnIfIcant
differences among the four countries Table 5 on page 53 is the
percentage distribution by age If we disregard the not stated
categories the average ages are as follows Kenya 31-45 years
Uganda 36-40 years Tanganyika 31-35 years Zanzibar 41-45 years
East Africa 36-40 years
Table 5 shows the average age of elIte to be higher In
Uganda and Zanzibar than In Kenya and Tanganyika Uganda has 17
percent of elite over fifty years and ZanzIbar 28 percent whIle
4 percent cf elIte are In this age group In Kenya and Tanganyika
Later the analysis will reveal that one-third of the Uganda elite
are Baganda thus the explanation of the older average age may
be that Baganda has had a strong traditional centralized governshy
ment for many years and therefore posItions of power of authority
have been open to the Baganda for a much longer period than for
other East Africans The same explanation can apply to the elite
of Zanz rbar
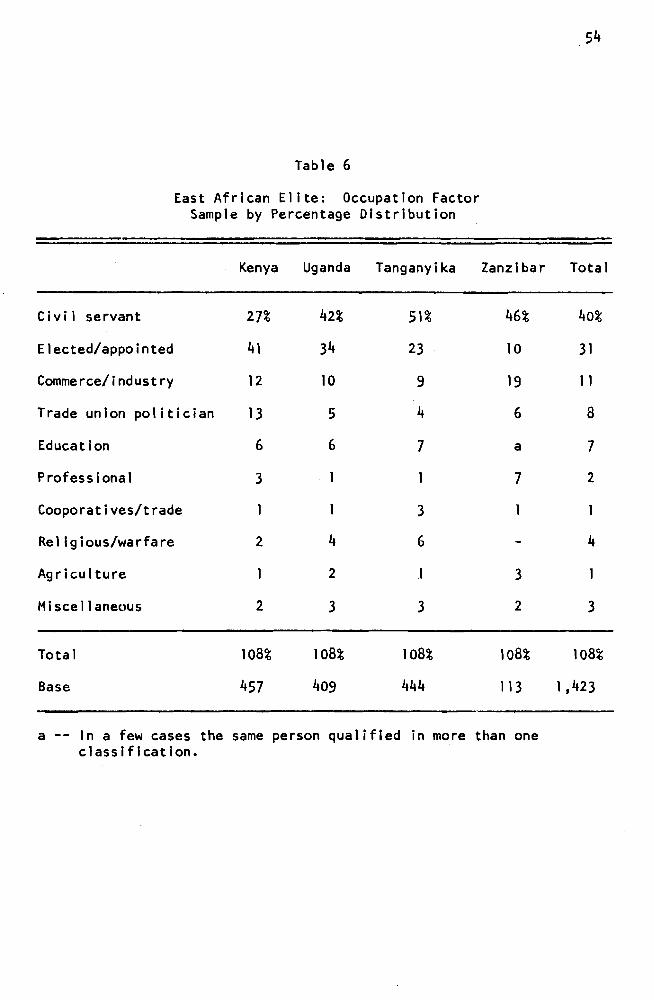
The process of Africanlzatlon can be seen In Table 6 on
page 54 There Is a smaller percentage of Africans in the civil
service In Kenya than In the other two countries but a higher pershy
centage of elected and appointed representatives due to the regional
52
53
Table 5
East African Elite Age Factor By Percent
Kenya Uganda Tanganyika Zanzibar Total
Up to 25 years 5 1 1 2 3
26-30 years 18 15 18 8 16
31-35 years 26 15 21 5 17
36-40 years 21 20 20 9 20
41-45 years 12 16 11 17 14
46-50 years 4 8 8 5 6
51-55 years 2 9 2 10 4
56-60 years 1 4 2 8 3
61-65 years 1 3 - 7 2
66 and over a 1 - 3
Not stated 10 8 17 26 14
Total 100 100 100 100 100
Base 457 409 444 113 1423
a -shy Less than 5 percent
54
Table 6
East African Elite Occupation Factor Sample by Percentage Distribution
Kenya Uganda Tanganyika Zanz Ibar Total
Civi 1 servant 27 42 51 46 40
Electedappointed 41 34 23 10 31
Commerceindustry 12 10 9 19 11
Trade union politician 13 5 4 6 8
Education 6 6 7 a 7
Professional 3 I I 7 2
Cooporatlvestrade I I 3
Religiouswarfare 2 4 6 - 4
Agriculture I 2 1 3
Miscellaneous 2 3 3 2 3
Total 108 108 108 108 108
Base 457 409 444 113 1423
a -- In a few cases the same person qualified in more than one classification
55
form of government Kenya also has a higher percentage of elite
who qualify as trade unionists
There are several ways of describing occupations Civil
servants for example can be in medical education or other
services Table 7 on page 56 gives occupations of the elite
in East Africa by a different set of criteria
The Education Factor
Tabl~ 8 on page 57 shows that in the categories University
and above East Africa rates 25 percent--with Kenya 25 percent
Uganda 24 percent Tanganyika i9 percent and Zanzibar 32 percent
The high number in the last country is accounted for in Table 7
IIEast African Elite Where Educated A higher percentage were
educated in the United Kingdom and IndiaPakistan (52 percent)
because of lack of local secondary schools Another factor is that
a well established social class structure was part of pre-independence
culture The upper class in Zanzibar and to some extent those
among the Baganda could afford overseas education whereas those
from other countries were dependent on financial help from governshy
ment sources
There was a higher percentage of elected or appointed represhy
sentatives In Kenya and this category was not so highly educated
as the Icivtl servant of a ll others categories It can be seen
that there are more electedappointed representatives than civil
servants or others in the lowest categories of education In the
highest educational brackets we have more civil servants in the
elite of all three countries than in the other two classifications
55
form of government Kenya also has a higher percentage of elite
who qualify as trade unionists
There are several ways of describing occupations Civil
servants for example can be in medical education or other
services Table 7 on page 56 gives occupations of the elite
In East Africa by a different set of criteria
The Education Factor
Tabl~ 8 on page 57 shows that In the categories University
and above East Africa rates 25 percent--wlth Kenya 25 percent
Uganda 24 percent Tanganyika 19 percent and Zanzibar 32 percent
The high number in the last country is accounted for in Table 7
IIEast African Elite Where Educated 1I A higher percentage were
educated in the United Kingdom and IndiaPakistan (52 percent)
because of lack of local secondary schools Another factor is that
a well established social class structure was part of pre-Independence
culture The upper class In Zanzibar and to some extent those
among the Baganda could afford overseas education whereas those
from other countries were dependent on financial help from governshy
ment sources
There was a higher percentage of elected or appointed represhy
sentatives n Kenya and this category was not so highly educated
as the llcivll servant of lIa ll others ll categories It can be seen
that there are more electedappointed representatives than civil
servants or others in the lowest categories of education In the
highest educational brackets we have more civil servants in the
elite of all three countries than in the other two classifications
56
Table 7
East African Elite Specific Occupation Factor By Percent
Kenya Uganda Tanganyika Zanzibar Total
Education (administration) 5 4 6 7 5
Education (teacher) I 3 1 2 2
Medical practicing 4 5 3 5 4
Sciences 1 I I 2
Lawjudicial 1 6 2 8 2
Accountancy 2 1 2
Farmer 1 2 I 3
Entrepreneur 2 2 I 9 2
Senior executive 34 36 61 44 45
Junior administrator 7 14 14 3 1I
Legislator (only) 38 20 7 8 21
Partyunion officials 13 5 4 6 8
Editorsartauthors 1 1 I 5
Clergy senior 1 3 4 - 2
Others (unclassified) 2 5 3 2 3
-Base (all Africans
Interviewed) 457 409 444 113 1423
57
Table 8
East African Elite Education Factor By Percent (1972)
Educational Level Reached Kenya Uganda Tanganyika Zanzibar Total
No formal education
Attended junior secondary 22 13 8 21 15
Attended sen lor secondary 21 18 23 13 20
Obtained certificate of secondary 12 8 3 10 8
Obtained higher certificate high school a a a - a
Nonunlverslty technical studies 5 7 19 6 10
Nonunlverslty teaching studies 4 6 7 - 5
University studies non-graduate - 22 20 17 17
University studies 1st degree 17 15 16 26 17
Post-graduate university ma s te r I s deg ree 5 7 2 4 7
Post-graduate university studies higher degree 2 2 1 2 1
Not stated I - I I a
-Base (all Africans
Interviewed) 457 409 444 113 1423
a -- Less than 5 percent
58
Civil servants In Uganda are more highly qualified than In the
other three countries 59 percent have university education In
Kenya 56 percent In Tanganyika 42 percent and in Zanzibar 56
percent have university education Elected and appointed represhy
sentatives generally have less education In Kenya 22 percent
Uganda 37 percent and in Tanganyika 26 percent (Zanzibar could
not be tabulated) have university education Uganda Is still the
highest among the three countries
Country Where Ed~catlon Was Obtained
Table 9 on page 59 gives details about the country In
which the respondent was educated In his final year of education
It can be seen that the highest percentage of the elite were edushy
cated in local East African schools (58 percent) The United Kingdom
came next (28 percent) followed by the United States (7 percent)
IndiaPakistan and other African countries There are very sigshy
nificant differences between the East African countries however
which are worth noting Zanzibar and Uganda have many more elite
who were edycated overseas and in the United Kingdom particularly
than the other countries Kenya had fewer by 10 percent than
the next lowest which was Tanganyika
It would be a waste of effort to detail all of the East
African schools attended by the East African elite There were
nearly one ~undred What is significant however is to show that
out of this total only a few schools account for handful accounts
for more than 5 percent of the elite In each country and moreover
this handful accounts for a very significant percentage of the elite
59
Table 9
East African Elite Where Educated
Country Educated Kenya Uganda Tanzania Zanzibar Total
East Africa only 67 54 57 42 58
Afrlca--outslde East Afrt ca 3 4 4 1 4
The U S 8 5 8 2 7
The U K 18 38 27 38 28
IndiaPakistan 4 3 3 14 4
Austral la New Zealand a - - - a
Canada - a - - a
Western Continent Europe Ie Germany Norway 1 1 3 2 2
USSRChina or Eastern European Countries - - a - a
Elsewhere outside Afr lea
Not stated 1 - a 2
Total 103 106 100 100 100
Base (All AfrIcan Interviews) 457 409 444 113 1423
a -shy Less than 5 percent
60
The Factor of Rellslon
This survey did not Include Zanzibar and therefore the
paper Is unable to provide comparative figures for Zanzibar of East
Africa as a whole One would logically expect to find relatively
61
the same number of elite as the general percentage for the popushy
lation as a whole In each religious grouping
Table 10 on page 62 is complicated by the category among
the elite of Inormal Chrlstlan1I which did not appear In the first
survey This category has been added because many of the sophisshy
ticated Africans were educated In Christian schools so they do not
regard themselves as pagan and yet they do not belong to any formal
church The category IInormal Christian or simply Christian is
used to describe them We can generalize that fewer Moslems are
among the elite than one would reasonably expect from the above
figures particularly In Tanganyika Fewer Roman Catholics in
Kenya and Uganda are among the elite than one would reasonably
expect from the above figures about the proportions to be expected
Moslem education In East Africa Is less than education
among the other religions Protestant missions have been strongest
in education since earliest times In East Africa and this Is
reflected in Table 10 Even In government schools in the old colonial
tradition the Church of England as the state church dominated
the educational field In the British System and in England today
1Ireligion is taught along with the three Rl s This will explain
the larger number of Protestants In the population as a whole and
among the elite of Uganda and Kenya Zanzibar of course Is a
Moslem country Most of the 7 percent 1I0 ther ll in Zanzibar were
Bahal The white fathers of Tanganyika dominated the field of edushy
cation in early German times and remained a powerful force throughshy
out the Trusteeship period
62
Table 10
East African Elite Religion Factor Compared to Population Percentage
Kenya Uganda Tanganyika Zanzibar Total
Elite Othersa Elite Othersa Elite Othersa Elite Elite
Roman Catholic 21 29 25 34 26 28 4 22
Protestant 54 45 65 50 22 26 43
Moslem 4 16 3 10 16 39 88 14
Pagan 8 6 7
Normal Christian 15 2 24 13
Other 7
Not stated 6 2 5 1I 7
Total 100 100 100 100 100 100 100 100
Base 457 2400 409 2600 440 2000 113 1423
a -- The percentages for others is based on the probability sample (7000) of survey conducted by Fred G Burke Some grass-roots attitudes affecting political and social Intergratlon In East Africa paper delivered to the African Studies Association San Franclsco October 26 1963
63
The Factor of Voluntary Associations
The degree to which Individuals In African societies join
groups of voluntary association is a measure of social change The
comparison between the four countries which is given in Table 11
on page 64 shows significant differences between them Tribal
associations are much stronger in Kenya than elsewhere 21 percent
as against 2 percent to 8 percent In Zanzibar Tanganyika and Uganda
This underlines the felt need of the Africans of Kenya for security
among their own people in the face of Insecurities of the old
colonial system and Its concomitant privileged European and Asian
classes Nowhere else in East Africa was the position of the
settler or trader so strong Moreover political parties were
banned In Kenya on a national basis until comparatively recently
although district associations were encouraged by the administration
Kenya elite rate highest In political party membership (35
percent) as against 17 percent to 22 percent and trade union membershy
ship (20 percent) as against 5 percent to 12 percent
Uganda elite join more groups of voluntary associations
than the elIte of other countries The average Uganda elite has
membership In two groups Kenya 1-7 Zanzibar 1~6 and Tanganyika
1-5 Moreover the kind of groups that the Uganda elite support
are more sophisticated The Uganda elite rate much higher In
religious (16 percent) versus 6 percent to 9 percent professional
(15 percent) versus 4 percent and cultural (16 percent) versus
6 percent to 11 percent The Uganda elite Is only second to the
Zanzibar elite (42 percent) as members of social clubs (36 percent)
but significantly higher than the Kenya elite (23 percent) and the
64
Table 11
East African Elite Voluntary Associations Factor By Percent
Kenya Uganda Tanzania Zanzibar Total
Member of a tribal association 21 8 3 2 10
Religious societyunion 6 16 6 9 9
Business society 5 8 6 11 6
Professional society 9 15 4 15 9
Academic society 12 20 7 17 13
Political party 34 21 22 9 25
Charitable organization 5 13 12 42 10
Social club 23 36 25 9 29
Sporting club 6 16 11 15 11
Other organizations 11 4 5 10 8
Cultural organizations 6 16 11 10 11
Trade union 20 5 12 5 12
Belong to none 18 17 33 17 22
Total a 176 195 157 165 175
Base (All African interviews) 457 409 444 113 1423
a -- Many individuals belong to more than one group
65
Tanganyika elite (25 percent) One In three of the Tanganyika
elite (33 percent) does not belong to many voluntary associations
compared to only 17 percent or 18 percent for the elite who do not
belong to at least one society In the other East African countries
Business is presented equally in each of the four countries
Table 11 Is one of the most significant of the survey The
Uganda elite of whom one in three was Baganda have had University
at Kampala for many years It was once the only center for higher
education In East Africa Therefore culture In the western sense
was for many years a factor of influence on elite of Uganda which
was not available in either Kenya or Tanganyika
The Tribal Factor
The percentage of the elite In each country by tribe
compared to the percentage of the population represented by that
tribe should give an Interesting Index of the degree to which
the tribe has progressed and Indirectly of the Influence of Its
members
The first significant fact which emerges Is that 9 percent
called themselves Tanganyikansll and would not use the label tribe 11
We can only assume that the actual percentage by tribe of this group
Is about the same as described In Table 12 on page 66 with the
obvious Inclusion of some who are of mixed percentage The most
significant fact Is that there were 30 percent who belonged to Kenya
tribes 2 percent Ugandans and 5 percent Zanzlbarees No other
East African country had as high percentages In these categories
That amounts to 37 percent who were of tribes other than those of
66
Table 12
Tanganyika ElIte by TrIbal Group
Tri be Percent of PopulatIon Percent of ElIte
Sukuma 19 3
Nuyamwerl 7 2
Hakonde 6
Haya 6 7
Chagga 6 12
Gaga 6
Ha 5
Hehe 4 1
Nyakusa 4 3
Wguru 4
Sambaa 3
Zaramo 3
Yao 3
Hwevu 2
Others (Less than 2) 13 22
Stated Tanganylkan 9
Kenyan Tr t bes 30
Uganda TrIbes 2
Zanzlbaree 5
Toeal 100 100
Base 10204000 (1973) 444
67
Tanganylkans The major tribe the Sukuma represents one in five
of the Tanganyika population yet has only one In thirty-three
among the elite There are twice as many Chagga among the elite
as their tribal percentage would warrant Surprisingly the Haya
have more than their share although all the rest have fewer except
the ve ry sma 11 Ilothe r ll t r i bes who have nea r 1y tw Ice as many
In Uganda we would expect to find the Baganda over represhy
sented in the elite (see Table 13 on page 68) They have like
the Chagga twice as many (33 percent) as the tribe percentage would
warrant (162 percent) An even higher percentage 28 percent
claimed to be IIUgandans a classification not recorded in the official
census figure Only 1 percent are from Tanganyika and 1 percent
from Kenya Unlike Tanganyika the smaller tribes which each
represent less than 1 percent each of the population have only
half as many elite (6 percent) as their combined percentage (94)
would expect Tanganyika had twice as many The Watoro was the
only other tribe In which the percentage of the elite exceeded
that of the tribe 4 to 32
Kenya Is unique In that there are several tribal groups
that exceed their quota of elite and by almost the same ratio (see
Table 14 on page 69) The Luhya have a slight margin by ratio
over Luo and Kikuyu The Kamba Mero and Embu related tribal
groups are all seriously under their expected percentages Like
Tanganyika but unlike Uganda the small tribal groups--each of
less than 3 percent of the total population but represent 161
percent of It--have 22 percent of the elite A high percentage
of this group of the elite are from the numerous coastal tribes
68
Table 13
Uganda Elite by Tribal Group
Tribe Percent of Population
-Baganda 162
Banyonkole 8 I
Teso 8 I
Basoga 78
Baklga 7 I
Lango 56
Baglsu 5 I
Acho I I 44
Lugbara 37
Wator i 32
Banyaro 29
Karamujong 19
Alur 14
Banyole
Kuma 94
Others (Less than 1) -Not stated
Stated Ugandan -Kenyan tribe
Tanganyika tribe
Total 1000
Base 7367558 (1973)
Percent of Elite
33
3
3
4
2
3
3
4
3
6
28
100
409
69
Table 14
Kenya Elite by Tribal Group
Tri be Percent of Population Percent of Elite
-Kikuyu
Luo
Luhya
Kamba
Meru
Kis i i
Embu
Klpsigis
Nandi
Others (Less than 3)
Stated Tanganyika
195
144
125
117
69
49
39
3
22
16 1
23
19
19
6
2
3
2
22
2
Total 1000 100
Base 9204000 (1973) 457
70
Table 15
Question
What in your opinion is the most important problem facing our country at the present time
Na i rob i Dar-es-Salaam Kampala Total
Education
Poverty-famine
Unemployment
Economic development
High cost of living
Border disputes Inter-African disputes
Pol itical instabi 1ity
Tr i ba 1ism
Land apportionment
Publ ic laziness
Other problems
Don1t knownot stated Refused to answer
22
13
41
6
10
3
2
3
2
2
29
24
6
24
3
6
4
2
28
18
18
12
9
5
3
2
5
3
27
19
18
14
8
3
3
4
2
Total 109 105 105 105
Base 389 451 395 1235
71
Table 16
Question 2
All things considered how satisfied are you with your present standard of 1ivlng--very satisfied fairly satisfied
somewhat dissatisfied or very dissatisfied
Nairobi Dar-es-Sa1aam Kampala Total
Very satisfied
Fairly satisfied
Somewhat dissatisfied
Very dissatisfied
Don I t know
Refused to answer
6 13 4 8
32 50 25 36
32 26 37 31
29 11 32 24
Total 100 100 100 100
Base (a 11 intervi ews) 389 451 395 1235
72
Table 17
Question 3
Do you think political matters should be left to the government or should people like yourself take
some active part in political affairs
Nairobi Dar-es-Salaam Kampala Total
Left to government 26 24 13 21
People to take an active part 72 72 73 72
Other answers 4 2
Dont know 2 8 3
Refused to answer 2 2
Total 100 100 100 100
Base 389 451 395 1235
73
Table 18
Question 4
Which one of the following do you think our country needs most at the present time more schools more hospitals
more housing more factories or more roads
Nairobi Dar-es-Salaam Kampala Total
More schools 40 44 51 45
More factories 40 37 28 35
More hospitals 17 10 15 14
More housing 1 6 5 4
More roads 2 3 1 2
Don I t know
Total 100 100 100 100
Base 389 451 395 1235
74
Table 19
Question 5
Now which one do you think our country needs most an honest government without corruption a government that gets things done fair distribution of wealth
national unity or individual freedom
Nairobi Dar-es-Salaam Kampala Total
An honest government wIthout corruption 44 38 51 44
A government that gets things done 23 18 17 20
National unity 22 20 17 19
Individual freedom 6 14 6 9
Fair distribution of wealth 5 9 8 8
Don I t know
Refused to answer
Total 100 100 100 100
Base 389 451 395 1 235
75
Table 20
Question 6
Which do you prefer--government ownership or private ownership of major industries
Nairobi Dar-es-Salaam Kampala Total
Government ownership 51 43 38 44
Private ownership 38 38 31 36
Mixed (voluntary answer) 10 18 29 19
Don I t know
Refused to answer - - 1shy
Total 100 100 100 100
Base 389 451 395 1235
76
Table 21
Quest Ion 7
As you know there are many different ways In which African states can establish closer ties among themselves Which of the
following ways would you favor an organization for settling disputes between African governments
closer economic relations political federation African military
organization cultural exchanges
Nairobi Dar-es-Salaam Kampala Total
Favor 94 96 85 92
Oppose 3 3 9 5
Don I t know 2 1 4 2
Refused to answer 1 - 2
Total 100 100 100 100
Base 389 451 395 1235
-Closer economic relations 22 49 53 41
Political federation 26 39 27 31
An organization for settling disputes between African governments 34 32 15 28
An African military organization 15 18 11 15
Cultural exchanges 3 10 3 6
Don I t know
Total 100 149 110 121
Base 366 432 337 1135
77
(8 percent) only 2 percent are Tanganylkans and the Ugandans did
not rate statistically
ELITE OPINIONS AND ATTITUDES
Not only does Scale 1 Table 22 Illustrate a sound basic
knowledge of modern methods to prevent crops from being damaged
It also Illustrates a similarity of knowledge between the three
sample areas which are widely separated geographically Scale 1
will be Invaluable when comparing the results of our first rural
study the field work of which has been completed and Is at the
stage of processing
Table 22
Scale
It does not help much to try to prevent crops being damaged by Insects and diseases such losses can
never really be prevented
Kampala Dar-es-Salaam Nairobi East Africa
Agree 8 12 12 11
Disagree 88 85 87 86
Uncertain 4 3 3
Base 153 156 150 459
Scale 2 Table 23 on page 78 also Illustrates but not
so conclusively similarities between the three areas Nairobi
had 17 percent agree whereas Dar-es-Salaam had only 10 percent
with Kampala somewhere Inbetween One could say therefore that
78
there Is a higher degree of tribalism among the elite of Nairobi
than among the elite of Dar-es-Salaam
Table 23
Scale 2
A man should never marry a woman who does not belong to hIs tribe
Kampala Dar-es-Salaam Nairobi East Af rl ca
Agree 12 10 17 13
Disagree 81 83 80 82
Uncertain 7 7 3 5
Base 153 156 150 459
While Scale 3 Table 24 shows a similarity between the
three areas It shows that the respondents of Nairobi are much
Table 24
Scale 3
People have It within their power to bring harm and misfortune to others through magic
Kampala Dar-es-Salaam Nairobi East Africa
Agree 26 28 30 28
Disagree 45 46 61 51
Uncertain 29 26 9 21
Base 153 156 150 459
79
more sophisticated In regard to magic than in the other sample
points and that fewer are uncertain A significant number In each
area however believe that magic can be used to bring harm and
misfortune to others
Scale 4 Table 25 shows a consensus between the three
areas but shows an over all unfavorable knowledge about science
and knowledge The majority 83 percent believe that many imporshy
tant matters can never be positively understood by the human mind
The question can provide a very useful comparison In changing patterns
of knowledge regarding science In the future
Table 25
Scale 4
Science and knowledge are useful of course but many important matters can never be positively
understood by the human mind
Kampala Dar-es-Salaam Nairobi East Africa
Agree 80 79 86 83
Disagree 9 12 13
Uncertain 11 9 6
Base 153 156 150 459
Scale 5 Table 26 on page 80 shows an unfavorable public
opinion about the role of traditional chiefs and the dichotomy caused
by loss of status in recent years by traditional chiefs whose roles
have been largely taken over by the political appointee of the
ruling party The question will also provide useful comparative
80
data between ruralurban areas and will be useful In the future to
measure changes in attitudes and opinions about traditional chiefs
Table 26
Scale 5
A man ought always to obey his traditional chief
Kampala Dar-es-Salaam Nairobi East Africa
Agree 42 38 45 42
Disagree 42 46 49 46
Uncertain 15 16 6 12
Base 153 156 150 459
Scale 6~ Table 27 not only shows an area of new problems
for East African elite but also the wide divergence of response
Table 27
Scale 6
Government and politics are so complicated that the average man cannot really understand what Is going on
Kampala Dar-es-Salaam Nairobi East Africa
Agree 81 65 72 72
Disagree 16 24 22 21
Uncertain 3 11 6 7
Base 153 156 150 459
81
between the three sample points In Kampala 81 percent agree
with the statement and only 3 percent are uncertain whereas In
Dar-es-Salaam 67 percent agree while II percent are uncertain
The statement will provide a useful measure In future of the attl shy
tude of the elite toward government In each of the three sample
points
Scale 7 Table 28 Is a new problem of Investment and
saving which as you can see has brought out differences between
the three sample points and will provide In the future a useful
measure of changing attitudes toward savings and the postponement
of rewards
Table 28
Scale 7
If I had the choice I would prefer to be given a small sum Immediately rather than be promised a very
large sum one year from now
Kampala Dar-es-Salaam Nairobi East Africa
Agree 62 54 62 60
Disagree 24 37 30 30
Uncertain 14 9 B 10
Base 153 156 150 459
There are other examples above of similarities and dlsshy
similarities which are even better than Scale 8 Table 29 on page 82
It does show however a close correspondence between Kampala and
Nairobi while Dar-es-Salaam shows a more tolerant attitude In
82
their response to this statement Once again the comparison between
urban and rural areas should show an Interesting and significant
difference
Table 29
Scale 8
A womans place Is in the home
Kampala Dar-es-Salaam Nairobi East Africa
Agree 45 36 45 42
Disagree 46 61 51 52
Uncertain 9 3 4 5
Base 153 156 150 459
Scale 9 Table 30 shows significant statistical differences
between the response from Kampala and those of the other two sample
Table 30
Scale 9
The traditional ways of the past are the best
Kampala Oar-es-Salaam Nairobi East Africa
Agree 15 33 33 27
01 sag ree 68 58 56 61
Uncertain 17 9 11 12
Base 153 156 150 459
83
points This fact Is even more Interesting when we know that in
Uganda the present form of government has been designed to maintain
the traditional ways of the past whereas In the other two areas
the present government has been designed to change politically
at least traditional ways The reactions of the Kampala respondents
therefore are a significant Indication of their dissatisfaction
with efforts to maintain traditional ways
Scale 10 Table 31 also Illustrates that Kampala has a
different reaction than the other two sample points although there
are less significant differences between Dar-es-Salaam and Nairobi
Table 31
Scale 10
The present Is all too often full of unhappiness It Is only the future that counts
Kampala Dar-es-Salaam Nairobi East Africa
Agree 29 50 60 46
Disagree 44 27 32 34
Uncertain 21 23 8 20
Base 153 156 150 459
Scale 11 Table 32 on page 84 Is a really significant
Indication of the basic dissatisfaction of the Kampala respondents
with the status quo The dissimilarity was also reflected in
Scale 10
84
Table 32
Scale 11
The government Is doing all It can to develop our country
Kampala Dar-es-Salaam Nairobi East Africa
Agree 51 86 84 74
Disagree 21 5 10 12
Uncertain 28 9 6 14
Base 153 156 150 459
Chapter 5
SUMMARY AND CONCLUSIONS
The purposes of this study were to
1 Analyze the factors which have slowed the economic
development of East African communities
2 Identify the major problems encountered In economic
systems In East Africa
3 Determine the problems in developing the economic growth
of the community
4 Identify economic reconstruction needs
All the published materials listed below were extensively
reviewed The review Included library research over both periodicals
and some relevant studies The writing of this report Is thus based
on the Information provided by the following documents
1 Periodicals books pamphlets mlcroflshe from the
William Allen White Library of the Emporia Kansas State College
2 Xeroxed materials and books that were secured through
the Inter-library loans
3 Report collected by the Marco Survey Ltd Nairobi
4 Periodicals Issued by the Information section of the
Embassy of the Republic of Kenya Washington D C
In order to determine the social and economic problems of
East Africa a questionnaire-Interview method was used In total
85
86
1423 elites were I~ervlewed Approximately 6 percent of the
elites listed for interview refused to be interviewed
The Interviews were conducted by permanent senior research
assistants
The data collected were compiled (using standard codes to
clarify the data and computer cards were punched for BO-column
I C T data processing equipment In Nairobi) summarized and
interpreted
Finally conclusions were reached
SUMMARY
British East Africa was the name applied to the territories
in East Africa before It achieved Its Independence The territories
cover a total area of 682469 square miles which was divided into
three parts Kenya Uganda and Tanganyika They all became indeshy
pendent by 1963
The communities continued economic ties among each other
and on June 6 1967 at Kampala the three member nations signed
a treaty which was to re-establish the community
East Africa enjoys a great deal of economic advantages
l It borders the Indian Ocean which provides a cheap means of
exporting and ImportlDg goods 2 It Is a meeting point for trade
(east and central African trades)
East Africa Is divided Into five geographic regions (which
provide a variety of climates)
1 coast region
2 Nylka region or Savanah region
87
3 East and West Highlands
4 Lake Victoria region
Due to the Influehce of the cultural traditions the subshy
slstance element in East African economics is still dominant This
is evident in most of the rural areas The public sector of East
African community plays a very great part In developing the economy
The public sector Is expected to be major employers In the community
and Is expected to provide free public services--free school free
medical services free or subsidized public utilities and housing
On an average scale the population of East Africa is yet
low A clear study shows this Is not true In some locations which
are densely populated varying from two hundred to five hundred
people per s~ure mile The population In urban cities of East
Africa Is still low and the people do not consider cities to be
their home Details show that the major East African cities have
over 50 percent of all the urban population while the minor cities
are far less than 50 percent of the total urban population
Standardization of East African people Is too difficult
due to the fact that the population Is composed of a variety of
sub-races whose traditions differ from each other among the tribes
The sub-races classified are
1 Nilotes
2 Nilo-Hamltes
3 Inter-cush Ite
4 Bantus
Based upon the sub-races of East African people the traditional
heritage carried frnom one generation to the other makes the economy
88
of the community hard to work In Perhaps even more important on
the economic outlook is the Inheritance of continuing extended
family contrasts In age and sex
The study shows that trading Is an extremely important
economic activity even though it Is not Itself productive The
trade Itudy has shown that trade has been playing a smaller part
in East Africa and for those operating Its economic efficiency is
very low The greatest part of trading activities is located in
the major East African cities This conclusion has led to the fact
that the majority of the people are living In rural areas where
means of traveling to cities are difficult for them and the lack
of money has probably created the situation where people have to
live subsistently
CONCLUSIONS
The conclusions of the survey of literature and the analysis
of findings follow
Survey of Literature
If It Is correct as suggested by Kamark that the economic
lives of rural Africans are not Influenced by environmental conshy
dltlons more than by cultural disposition then this would mean
that the Introduction for new technology should bring about economic
changes relatively unhIndered by cultural conservatlsm1 That
Is to say the potentIalIties of natural resources can be more
IKamark M Andrews The Economics of African Development (New York Praeger Incorporated 1967) p 79
89
effectively tapped by the Introduction of new methods and undershy
standing and new forms of organization of production It may be
objected that this In fact has not occurred In East Africa and
precisely some would say because of limitations of cultural
conservatlsm 11 But closer studies quite strongly suggest that
where people can see the advantages to themselves of economic changes
2that are both feasible and safe then the changes do occur Thus
African people have accepted changes first and most radically (indeed
they have often deliberately sought them) In the more favorable
areas where the possibilities of new technology and new Ideas are
more readily applicable and where people are exposed to external
influences and have access to modern communicatIons and living styles
The type of national economic progress which is to emerge
the longer-term political goals the roots of nationhood In the
multiplicity of subcultures and naturally uneconomical tribal ties
out of which national culture is forged remain the crucial unanswered
questIons whIch affect the economic progress of East Africa
Analysis of Findings
The results of the analysis has shown that the elite of
East Africa have advanced to a more desIrable socloeconomlc way
of thinkIng ThIs conclusion has led the author to suggest that
perhaps the integrating forms of tribes can be worked out beginning
with the East African elite for however much too depends ultimately
on local and tribal support they have more chance to see above
2 Ibid p 98
90
the disadvantages of these functions The middle class is still
small flexible mobile and unstable not yet clearly or acceptably
dlfferentl~ted from strata above or below The mass of unskilled
workers are the most temporary and the least Involved If no efforts
or attempts are applied the society will inevitably continue to
live In their life of ethnically based networks and subcultural
pockets
16
AHdflJ )O 118 18
BIBLIOGRAPHY
Abraham R G East African Townshipl in A W Southhall (eds) Social Change In Modern Africa New York Oxford University Press 1970
Baver P T and B S Ymey The Economics of Under-developed Countries C U P Cambridge University Press 1957
Blacker E A Demography New York Oxford University Press 1948
Ethographic Survey of Africa East Central Africa London International African Institute 1970
Boesch H A Geography of World Economy Van Nostrand Princeton University Press 1964
Brown L H in E W Russell (ed) The Resources of East Africa Nairobi Literative Bureau 1968
Burke G Fred Africanls Quest for Order Englewood Cliffs New Jersey~ Prentice Hall 1964
The Economics of Underdeveloped Countries New York OxfOrd University Press 1972
Cley and P Robson IFederation of East Afrlca11 Structure and Administration of E A C S O New York Oxford University Press 1964
Doob W Leonard Periodic Surveys in Subsaharan Africa Nairobi Nairobi Publishing House 1970
East African Community Annual Report Nairobi Kenya Government Press 1966
Economic and Statistical Review Nairobi The East African Statlsshytlcal Department 1964 _
Encyclopedia Americana East Africa Vol 4 1974
Encyclopedia Brltanlca East African Community University of Chicago Macropedla Vol I II 1974
Goldthrope J E and F B Wilson Tribal Maps of East Africa and Zanzibar Kampala East African institute of Social Research 1966
92
93
Good M Cha~les Jr Dimensions of East African Cultures New York Oxford University Press 1970
Gulliver P H Labor Migration in a Rural Economy Kampala E A I S R 1955
Harlow V and E M Chi lver History of East Africa Vol II Oxford Clerendon 1962
Hawks D A IIEast Afrlca1I Trade and Industry Official Journal of Association of East African Industries Nairobi Nairobi Publishing House 1963
Hopkins Elizabeth IIConflict of Tribal and Racial Conflict in Stanley and Burke (eds) Transformation of East Africa New York Basic Books Printers 1966
Industrialization in East Africa 5th Edition Nairobi United Africa Press 1966
Jamal A H The Critical Phase of Emerged African States Afalrasl East African Publishing House 1965
Johnson B F The Staple Food Economics of Tropical Africa Stanford California Stanford University Press 1970
Johnson D H Rainfall in East Africa Q F R Vol 5 Nairobi East African Publishing House 1968
Jones Carey Geographical Journal Vol 131 Part 2 New York Oxford University Press 1965
Kamark M Andrew liThe East African Community The Economics of East African Development New York Praegam Incorporated 1971
Kenya Chamber of Commerce Trade Nairobi Kenya Government Press 1973 --~
Lewis William Allen The Theory of East African Literature Nairobi Bureau Annual Report 1965-6
Morgan W T W IIEast Africa Its People and Resources II People New York Oxford University Press 1969
Morgan W T W and N M Shaffer Distribution and Density New York Oxford University Press 1970
Myrdel Uninnar An International Economy Problem and Prospects New York Harper 1969
OConner A N An Economic Geography of East Africa New York Preager 1966
94
Oxford Economic Atlas East African Community New York Oxford University Press 1972
Reed Moyer and Hullanderc Stanley Markets In Developing Economies Illinois R D Irwin 1968
Republ ic of Kenya Newsletter Washington D C 1975 Vol 3 No5
Richard A I Economic Development and Tribal Change Nairobi East African Publishing House 1969
Rosberg A and A Segal East African Federation Internatlonal Conciliation 1963
Samson H W The Climate of East Africa Nairobi Memoirs Vol II I No2
Schneider in W R Bascom and M J Herskovits Continuity and Change in East African Cultures Chioago University of Chicago Press 1959
Seggerson E P Physiography of East Africa Nairobi Press 1962
Southhall A W Growth of Urban SocletyI Dar-esmiddotSalaam New York Oxford University Press 1969
The East African East African Common Services Report Nairobi Kenya Government Press 1966
Thompson B W The Climate of Africa Nairobi Oxford University Press 1965
UNESCO Populatlon Movements in East Afrlca in K M Barbour and R M Prethere (eds) Essay on African Population Routledge and Kegan New York Oxford University Press 1961
Walder D Problems of Economic Development of East Africa In E A G Robinson (ed) Economic Development of South Sahara London McMillan 1964
Warren J Keezan International Marketing Less Developed Countries Englewood Cliffs New Jersey Prentice Hall Incorporated 1974
Wilson A M Social Change In Modern Africa New York University of Oxford Press 1961
Wilson M Gordon liThe Transformation of East Africa Basic Scale for Periodic Research New York Basic Books Printer 1971
S6
XION3ddf
bull
96
URSAN CENTERS
- bullbullbullo1
IL RUdDIf---J -
( L KENYA I
I I I
hlo10bull I I J
- Tllo
Tflgflylfl
-Dodo TAN3ANYllltA
It
bull Imp ~1 bull
JII
~ ~t - bullKlIer
~ ~ JIOlJLAIO
~ ~~ ~ (0 C~CV ~oo Lindl ~ a CO (1(( 00(tOO
c ~tCC a oocmiddot ~~ L Ny ~tWllra1 c ~~(V( 0 ~J(JC~ ~ l(l~5 7~ ~~~~ i~j~) ~J r =X 0 1 ~O _-A- J 0 100 bull - -
mil bull~~ ~__-- _ llo
l6
bull
o
MII bullbullbullbullbullbull bullbullbullbullbullbulll1li bull bull ~ =
middot1
bullbullbull bullbull~ pound
-w
)
umiddot~middot middotmiddotMI
c
gt amp c o
ImiddotUmiddotmiddot middotmiddot0 L
1 bull l
)
L
~
middotmiddotmiddotmiddot1 L
~
~
1 ~
~ ~ I ~ L ~
i 1 middotmiddotmiddotrmiddotmiddotI bull bull ~
I r j L
-r Y
I~ bull CL -J II w 1
VINVZNVl
eII_
fbullbull bull~1
~ r
z
c
o
11Ie
) 11111_0 -shy
N a n s
~______
middot~middot(1 -bullbull
__rr~)
I
I
I I I
~ I ~
I I I ~ I
vaNv~n
66
o
1 IIit
c
Cl
S iII III J
Ibullbullbull middot1t-11 1 114bullc ~~1
bull
001
INZN1L
10 l
r
01 bull 1middot ) l pltllI1 -tpn I I c
o
z
o
bull
J I
lt
- Njoroge 1975
- Njoroge 1975 pt2
-

(1 )- ~2l~ ch t
EVEN THOUGH I AM FORBIDDEN
I HAVE WALKED OUT THE HALLOW WORLD
AND CLIMBED TO THE TOP OF THE HIGHEST HILL
AND SEEN A CLEAR BLUE SKY
AND MANY OTHER TH loNGS YOU HAVE NOT DREAMED OF
AND WHILE STROLLING MY WONDERS AND FEARS OF
KNOWING THE TRUTH
I TOUCHED THE REALITY OF MAN
II
ACKNOWLEDGEMENTS
The writer wishes to express his gratitude to Dr Rodney
Mitchel and Dr Ira Martel with a special note of recognition
and to Dr Raymond Russell for their valuable advice and suggesshy
tions in the writing of this study
Grateful appreciation is given to my wife Marty Muchene
my brother Richard Njoroge and Erustus Gachee for their conshy
tributions to this paper
D C M N
iii
TABLE OF CONTENTS
Page
LIST OF TABLES v I i
LIST OF MAPS x
Chapter
1 INTRODUCTION bullbullbullbullbullbullbullbullbullbullbullbullbull
THE PROBLEM AND DEFINITIONS OF TERMS USED bull 2
Statement of the Problem bullbullbullbull 2
Importance of the Study bull 3
Limitations of the Study 3
Assumptions 3
DEFINITIONS OF TERMS USED It
Arusha It
Dar-es-Salaam It
Duka It
E A C or E Abullbullbull It
Gazetted Township bullbull 5
Great Rift Valley bullbull 5
Kampala bull 5
Municipal ities Grade A amp B Townships 5
Na i rob i 6
Non-African 6
Pound bull 6
iv
Chapter
2
v
Page
Settlers 6
Shillings 6
Swah i 1i bull 7
t1ETHODS OF PROCEDURE 7
PLAN OF STUDY bull bull bull bull bull bull 7
THE REVIEW OF RELATED LITERATURE 9
EAST AFRICAN GEOGRAPHY 11
Regional Survey bull 11
The Nyika Plateau 12
Lake Victoria Basin 15
THE ECONOMY middot 15
Subsistence Economy middot 15
The Public Sector bull 16
Excessive Expectations for Publ ic Service 17
POPULATION DISTRIBUTION 19
Urban Population 21
PEOPLE 22
The Tribal Classification 24
HistorIcal Clusters bull 25
AFRICAN HERITAGE 26
The Extended Family bullbullbullbullbullbullbullbull 27
THE ECONOMIC ACTIVITIES OF EAST AFRICA 30
THE DISTRIBUTION OF TRADING ACTIVITY 32
Na i rob i bull middot 32
Mombasa 35
Dar-es-Salaam 36
Chapter
3
4
5
vi
Page
Kampa 1a bull bull 37
Others 37
~OMMUNICATION ACTIVITY 38
Rail Transportation 41
Sea Transportation 42
Air Transportation 42
CQmmunlcation Media 43
SUMMARY bull bull 43
DE~IGN OF THE STUDY 45
lAST AFRICAN ELITE 45
URBAN ELITE OPINION bullbullbullbullbullbullbullbullbullbull 48
OPINIONS AND ATTITUDES bullbullbullbullbullbullbullbullbullbull 50
ANALYSIS OF DATA bullbullbullbullbullbullbullbullbullbullbullbullbullbull 52
The Education Factor 55
Country Where Education Was Obtained 58
The Factor of Religion bullbullbullbullbullbull 60
The Factor of Voluntary Association bullbull 63
The Tribal Factor bullbullbull 65
ELITE OPINIONS AND ATTITUDES 77
SU~MARY AND CONCLUSIONS bullbull 85
SUMMARY bull bull bull 86
CONCLUSIONS 88
Survey of Literature 88
Analysis of Findings 89
BIBLIOGRAPHY bullbullbullbullbullbullbullbull 91
APPENDIX bullbullbullbullbullbullbullbullbullbull 95
LI ST OF TABLES
Table Page
1 Mean Population Estimates Per Space Land (1968) bull bull 19
2 The Distribution of the African and the IINon-Afrlcan In Proportion by Cities 1968 bull bull bull bull 23
3 Transportation In East Africa (1963-73) 40
4 Co~municatlon Media (Thousands) 1963 43
5 Ea~t African Elite Age Factor By Percent 53
6 Ea~t African Elite Occupation Factor Sample by Percentage Distribution bullbullbullbullbullbullbullbullbullbullbull 54
7 East African Elite Specific Occupation Factor by Percent bull bull bull bull 56
8 East African Elite Education Factor By Percent (1972) bullbull 57
9 East African Elite Where Educated bullbullbullbull 59
10 Ea~t African Elite Religion Factor Compared to Population Percentage bullbullbullbullbullbullbull 62
11 East African Elite Voluntary Associations Factor By Percent 64
12 Tanganyika Elite by Tribal Group 66
13 Ugand3 Elite by Tribal Group 68
14 Kenya Elite by Tribal Group bullbull 69
15 Question 1 What in your opinion is the most Important problem facing our country at the present time1 70
16 Question 2 All things considered how satisfied are you with your present standard of llvlng--very sati~fied fairly satisfied somewhat dissatisfied
71or ~ery dissatisfied bull bull bull bull bull bull bull bull bull bull bull bull bull bull bull bull
vii
viii
Table Page
17 Qupstion 3 Do you think political matters should be left to the government or should people like yourself take some active part in political affairs 72
18 Question 4 Which one of the following do you think our country needs most at the present time more schools more hospitals more housing more factories or mere roads bull bull bull bull bull bull 73
19 Qu~stion 5 Now which one do you think our country fleeds most an honest government without corrpution ~ government that gets things done fair distribution of wealth national unity or individual freedom 74
20 Question 6 Which do you prefer--government ownership or private ownership of major Industries bull bull bull 75
21 Question 7 As you know there are many different ways in which African states can establish closer ties amoog themselves Which of the following ways would you favor an organization for settl ing disputes b~tween African governments closer economic relations political federation African military organization cultural exchanges 76
22 Sacle 1 It does not help much to try to prevent crops being damaged by insects and diseases such los ses can neve r rea 11 y be preven ted bullbull bull 77
23 Scale 2 A man should never marry a woman who does not belong to his tribe 78
24 Scale 3 People have it within their power to bring harm and misfortune to others through magic 78
25 Scale 4 Science and knowledge are useful of course but many important matters can never be positively understood by the human mind bull bull 79
26 Scale 5 A man ought always to obey his traditional chief 80
27 Scale 6 Government and politics are so complicated that the average man cannot really understand what is going on bullbullbullbullbull 80
28 S~~le 7 If I had the choice I would prefer to be given a small sum immediately rather than be promised a very large sum one year from now bull bull bull bull bull 81
ix
Table Page
29 Scale 8 A woman IS place is in the home bullbull 82
30 Sccle 9 The traditional ways of the past are the 82best
31 Scale 10 The present is all too often full of unhappiness it is only the future that counts 83
32 Scale 11 The government is doing all it can to develop our country bullbullbullbullbull 84
Chapter 1
INTRODUCTI ON
East Africa (Kenya Uganda Tanzania) is a land of great
variety (covering 683000 square miles) in physical features clishy
mate human type economic development and political evolution
al ike There are few places on earths surface ~here in the space
of a few hu~dred miles one can experience such a range of conshy
trasts O~e can pass from high mountain snow to the deepest lake-
filled troughs alive with tropical vegetation from the invigorating
climate of the highland areas to the dusty heat of rift valley (one
hundred to two hundred miles wide) or from bustling modern cities
to countrysid~ There are great differences in trade activities
from one area to another Finally there are in East Africa
conflicts of triLal and racial interests present in all parts of
the continent and great contrasts in the types of states which
have emerged from the race of independence 1
Politically with the exceptions of Ruanda and Burundi
Somalia Ethi~pia and Zambia the territories have been under Britshy
ish rule for many years and Engl Ish is the official language Most
of Kenya was a crown colony except the coastal strip which was a
lEI izabeth Hopkins Conflict of Tribal and Raciai Conshyflict in Stanley and Burke (eds) Transformation of East Africa (New York B~sic Books Printers 1966) p 375
2
protectorate while Tanganyika was administered by the British
under Uni~ed Nations trusteeship2 The British territories have
enjoyed common markets and certain services such as publ ic comshy
munications administered by East African Common Services today
known as the East African Community
East Africa is the meeting point for all the contlnents
major 1ingJistic groups Even Cl ick Language is represented
in Central Tanzania The three greatest sub-races (of African
origin) ar~ the Nilotics Nilo-himites and the Bantus 3
THE PROBLEM AND DEFINITIONS OF TERMS USED
Statement of the Problem
This study was designed to
1 Analyze the factors which have slowed the economic
development of the East African community
2 Identify the major problems encountered In economic
systems in East Africa
3 Determine the problems in developing the economic growth
of the comm~nity
4 Identify economic reconstruction needs
2Cloey and P Robson Federation of East Africamiddot Structure and Administration of E A C S O (New York Oxford University Press 1964) p 37
3W T W Morgan lEast Africa Its People and Resources People (New York Oxford University Press 1969) p 33
3
Importance 0f the Study
The economy of the East Africa community Is growing at a
high rate as projected yet the majority of the citizens of the
community remain on the poverty level In order to explain this
paradox we will look at the problems tending to withhold economic
success from many members of the community
Limitatlo~s of the Study
The study has the following limitations the data in
this study are limited to that available at the William Allen
White Library at Emporia Kansas State College and through their
facilities through interlibrary loans As Indicated in much of
the relevant data surveyed much of the available material is not
current 4
Assumptions
Certain assumptions underlie this study These assumptions
can be summarized as follows
1 The environment in which the desired economy operates
is such t~at the beneficiary does not readily appreciate the value
of change and thus lacks interest in It
2 The East African citizen is suspicious of accepting
the change to more progressive socioeconomic standards
4
DEFINITIONS OF TERMS USED
Arusha
The capital city of East African Community (1967 Declarashy
tlon)5
Dar-es-Salaam
Capital and largest city in Tanzania It is also one of
6the chief port cities of East Africa
Duka
Small shops normally operated by a single family7
E A C or Eo A
Abbreviation for East African Community Is an economic
organizaticn consisting of three member countries of Kenya Uganda
and Tanzania (associate members include Zambia Ethiopia Somal ia
and Burundi) The existing community is based on a treaty signed
in Kampala on June 6 1967 to preserve and re-establish a large
part of the corporative relationship that was disappearing 8
5A W Southhall Growth of Urban Society Dar-es-Salaam (New York Oxford University Press 1969) p 483
6 Ibid p 481
7J bull Keezan Warren International Marketing Channels Less Develo ed Countries (Englewood Cliffs New Jersey Prentice Hall Incorporated 197 p 309
8Andr~w M Kamark liThe East African Community The Ecoshynomics of African Development (New York Praegam Incorporated 1971) p 5C
5
Gazetted Township
Go~ernment official papers classifying towns population
by residenc~9
Great Rift Valley
Geologically this structure is called a Ilgra ben 1I This
valley exte~ds as a series of depressions from Syria through the
Dead Sea (the surface is nearly 1300 feet below sea-level) to
Africa In East Africa It divides into two branches western
and eastern Igneous activities and volcanoes are associated with
the rift valley forming such peaks as Kllimanjaro these are now 10
dead
Kampala
Th~ capital and the largest city in Uganda It was made
the capital In 1962 when Uganda previously a British protectorate
bull d d IIbecame an In epen ent nation
Municipalities Grade A amp B Townships
Gr~de A -- Municipal towns these towns have populations
above sixty thousand
Grade B -- Townships under local government authorities
12Normally these towns have populations below sixty thousand
9Rbull ~ Abraham IIEast African Townshipl In A W Southhall (ed ) Social Chane in Modern Africa (New York Oxford University Press 197D) p 33
lOE P Seggerson Physiography of East Africa (Nairobi Na I rob I Pless 1962) p 10
Ilsouthhall op cit p 477 12Abraham loc cit
bull 6
Nairobi
The capital and the largest city In Kenya with a population
13nearing one million people according to the 1971 population census
Non-African
A resident who is an Immigrant from other continents besides
Africa The majority of Non-Africans are Europeans and Asians
(Indians)14
Pound
East African sterling currency (Pound~) 1 ~ bull shs 20
Equivalent to $28 u S currency 1975 15
Settlers
European immigrants farmers to the East Afrlca 16
Shillings
East ~frican sterling currency (shs) shs 20 z l~ 17
13Southhall op cit p 469
14Abraham loc cit Non-Africans comprise people (male or female) of European or American origin Arabs Indians and Far East Asians
15K~nya Newsletter issued by Section of Embassy Republic of Kenya Jashington D C Vol 3 No5 (1975) p 28
16Ellzabeth Hopkins IRacial Minorities in British East Africa in Stanley and Burke (eds) Transformation of East Africa (New York Basic Books Printers 1966) p 87
17Kenya Newsletter loco cit
7
Swahili
A language of the coastal population of East Africa roughly
from Southern Somalia to Mozanlbique and including Zanzibar and
the Comoro Islands It Is spoken by about 15 million people as
a first langu~ge this includes the people In East Africa and
Congo (Klns~asa)18
METHODS OF PROCEDURE
All the published materials listed below were extensively
reviewed Thl~ included library review of both periodicals and
relevant st~dies The writing of this report is thus based on
the Information provided by the following
1 Periodicals books pamphlets and microfilm from the
William Allen White Library of the Emporia Kansas State College
2 Xeroxed materials and books that were secured through
the inter-library loan and from friends
3 uata collected specifically for use In this study by
the Marco Survey Ltd Nairobi Kenya
4 Periodicals Issued by the information section of the
Embassy of the Republic of Kenya Washington D C
PLAN OF STUDY
In the preceding section the purpose of this study Its
importance the limitations assumptions definitions of terms
18Encyclopedia Americana Swahili Vol 26 (1974) p 85
8
and methods of procedure have been outlined Related literature
largely stu~ies of structure with regard to economic development
in East Africa is presented in Chapter 2 Chapter 3 presents a
background of pertinent economic facts concerning East Africa
Chapter 4 deals with an analysis of factors In Chapter 5 the
data is summarized and conclusions are drawn
Chapter 2
THE REVIEW OF RELATED LITERATURE
British East Africa was the name applied to the territories
In East Africa before they achieved Independence The territories
Included the ~olonles and the protectorate of Kenya the United
NatIons trust territory of Tanganyika and Uganda These territories
had a total area of 682469 square mlles l British East Africa was
economicalya system of joint services The East Africa High
Commission which consisted of the Governors of Kenya Tanganyika
and Uganda was responsible for the administration of public services
and functions common to territories including currency roads
customs apd communications Each territory1s government retained
responsibility for local services such as health education and
police 2
After World War I I nationalist feeling was strong throughout
British East Africa As the deadline for Independence approached
Britain attempted to form a federation of East Africa but separate
nationalist aspirations made this Imposslble 3 Tanganyika was the
IEncyclopedla Americana East Africa Vol 4 (1974) p 578
2East Africa Geographical Journal Vol 129 Part 2 1963 pp 140-155
3Abull Ro~berg and A Segal East African Federation IIlntershynational Concll iatlon11 1963 p 30
9
10
4first of the four territories to achieve Independence In 1961
Uganda became independent In- 1962 The following year Kenya and
Zanzibar entered the ranks of Independent states Tanganyika and
Zanzibar merged In 1964 and adopted the name United Republic of
Tanzania 5
After Tanganyika became Independent the East African
High Commission was suceeded by the East African Common Services
Organizatior which performed the same functions as its predecessors 6
Finally the East African Common Services became the East AfrIcan
Community The East African Community was formed to establish a
customs union to facilitate the industrial development of the
area and to carryon research activities and common services preshy
vlously controlled by the East African Common Services organization
The community was re-establlshed by a treaty signed by three member
nations In Kampala Uganda on June 6 1967 7
The community provides for free intercommunity trade and
a system of c~nmon external tariffs there Is also a system of
transfer tnxes that may be Imposed on certain commodities Imported
from other members by a country with a trade deficit wIthIn the
other two members Transportation and communications services
are handled by community corporations for raIlways harbors post
4 Ibid p 8 5 IbId p 12 bull
6Encyclopedia Britanlca East African Community University o~ Chicago Macropedia Vol I I I (1974) p 754
7The East African East African Common Services Report (Nairobi Kenya Government Press 1966) p 3
I I
and telecommunications and alrways8 The East African Development
Bank established in 1967 provides and emphasizes projects that
tend to make the three economies complementary9 Although all
three countries contribute on an equal basis to the bank Kenya
the most advanced receives a smaller share of Investments and
guarantees In accordance with the policy of even development among
the states
East Africa is also the meeting point for all the continents
major linguistic groups Even Click Language l is represented in
Central Tanzania
EAST AFRICAN GEOGRAPHY
Regional Survey
East Africa borders the Indian Ocean for about eight hundred
miles and the coastlands form a very distinctive zone although
the plain Is only one hundred miles wide around the Kenya and
Tanzania border IO Winds from the ocean bring a high ralnfal I
to most of the land close to the coast This fertile land Is quite
densely populated The rainfall drops quite rapidly Inland and
land quickly becomes arid and sparcely populated As one travels
from the Iterior towards the coast the change from scared bush
to forest is evident
8 Ibid p 9
9East African Community Annual Report (Nairobi Kenya Government Press 1969) p 38
IOCharles H Gpod Jr Dimensions of East African Cultures (New York Oxford University Press 1970) p 8B
12
Some of the special characteristics of the coastland stem
from the fact that many people have approached them from the sea
and have ~ot penetrated far inland Although most of the population
is African there is a substantial Arab settlement in sharp contrast
to the rest of East Africa Mombasa Is an old town (see map of
East African cities on page 96) Dar-es-Salaam and Tanga are not
These three cities are distinctive In that through them passes
most of the foreign trade of East Afrlca ll This tends to quicken
the pace of economic activities there although In the whole zone
the high temperature (high humidity) resulting from the low altitude
tends to slow It down
The coastal zone Includes the islands of Zanzibar and
Pamba and Mafia together They constituted a separate state for
middotover one hundred years until they joined with Tanganyika to form
anew state of Tanzania in 1964 12
The Nyika Plateau
Away from the coast the land rises fairly gently to flat
plateaus covering between 3500 to 5000 feet above sea level
known In some areas as Nyika (Swahili for wilderness) This is
an area of short rainfall poor scrub vegetation and very sparce
13population separating richer lands In the Interior from the sea
llA M Wilson Social Change In Hodern Africa (New York Oxford University Press 1961) p 35
12Carey Jones Geographical Journal Vol 131 Part 2 (New York Oxford University Press 1965) p 186
lnE P Seggerson Physiography of East Africa (Nairobi East Africa Publishing House 1962) p 10
13
It is broken by mountain ranges notably Usambara and Pare mountains
Taita h1115 where relief brings about a higher rainfall and where
more people have settled Further south it is broken by a zone
of lowland in the basins of the Ruaha and Rufingi rivers where
settlement Is discouraged by periodic floods and disease rather
than by low r3infall Water scarce in East Africa is abundant
there and cen be controlled This area offers promise for future
agricultural development In the south of Tanzania the plateau
reappears but the rainfall exceeds thirty inches in most years
and much of the land is under cultlvatlon 14 The rainfall Is
unreliable soil is poor and the area is remote from central
economic life in Tanzania 15
Th~ highland south of the Nylka has recent volcanic rocks
It stands up as highlands reaching to 19500 feet including
KilimanJaro Mt Kenya and Elgon (see map on page 14) From the
land over seven thousand feet above sea level it extends three
hundred miles westward almost to the shore of Lake Victoria Although
It Is brokpfl by the lINorth Rift Valleyll (not shown in the map)
the floor of which in places lies six thousand feet below the land
to either side 16 In this highland heavy rainfall and fertile
volcanic soils provide excellent conditions for agriculture Much
14gt H Johnson Rainfall in East Africa Q F R Vol 5 88 (Nairobi East Africa Publishing House 1962) pp 1-9
IS ibid p 10
16Seggerson Ope cit p 10
ofx-----_ - -~~ -----------~
QOO 000 ~I)
-==----=-----shy
~ )00 -OOOt
Wi~Z1 ~ OOOt -0001
u
o
z
o
15
of the land Is under cultivation but the fruit of this agricultural
production is offset by the dense population 17
Lake Victoria Basin
The land falls slightly northward from the central plateau
of Tanzania towards the Lake Victoria Basin and the densIty of
the population is increased greatly The Basin is one of the
richest zores of East Africa supporting over a quarter of the
population of the regIon The country receives more rain and
has more fertile soil than that to the south and advantage has
been taken of its agricultural opportunities The land around
the lake in some ways forms a single unIt although it is divided
among the thr~estates This region Is densely settled by farmers
who produce much cotton as well as animal food crops also bananas
(Uganda) a~d coffee providing a green landscape all year around 18
THE ECONOMY
Subsistence Economy
In terms of the actIvity of an average East African man
or woman the subsistence element in East African economies is
probably still domlnent 19 That is to say the amount of time
the average East African spends on activities that merely keep
17w T W Morgan and N M Shaffer Distribution and Density (New York Oxford University Press 1966) p 36
18 Ibld p 38
19~ F Johnson The Sta Ie Food Economics of Tro ical Africa (Stanford Californ a Stan ord UnIversity Press 1970 p 142
16
him alive ana functioning is greater than the amount of time he
spends ear~ing discretionary income The average East African
is more in than out of the subsistence tribal economy20 He produces
most of the goods and services he consumes
The permeation of the money economy throughout Africa not
only has considerable importance in Its own right but will influence
the whole pace of economic development In the future It is almost
impossible for anyone who has not lived in a subsistence economy
to appreciate how profoundly it affects ones activities and outshy
look To live in a subsistence economy means to live a hand-toshy
mouth existence in a world of great risk and uncertainty Without
the techniques or facilities for storage of food over any appreciable
period the East African is dependent on the yearly crop or his
luck In hunting or fishing Nearly every people have a hungry
season ll when the 1ast season I s crop has been eaten and the new
crop has not yet come In The risk and uncertainty affecting a
whole community is less with the spread of the money economy
because It is possible for individuals both to create a margin of
security for themselves by setting aside a permanent store of value
In the form of money and to survive apart from the communlty21
The Public Sector
From a comparatively late point In the development of East
Africa the government role in the economy was a major one The
private investments and the stimulation of production was encouraged
20 Ibid p 151 21 Ibid p 147
17
by the gov~rnment The corollary of this Is the continuing imporshy
tance of the government as employer and of the publicly owned
sector generally in the national accounts
In East Afri ca Ilcurrent government expend i tures run over
15 percent of the gross national expenditure 1I22 If one adds the
operations of the railway electricity authorities ports etc
and the investments in the whole part public sector the total
approaches Hone-third of the gross domestic product-II Together
they are therefore the dominant economic influence in the money
economy of East Africa 23 Many East Africans expect the state
or public agency to be their employer This has the effect of
reinforcing o~e of the worst heritages of colonialism--the East
Africans arceptance of the idea that the best job to have is a
government post
Excessive Expectations for Public Service
The paternalistic attitude of colonial administration
particularly after World War II also left behind the habit of
expecting co~siderable benefit from free public services--free
schools iree medical services free or subsidized electricity
and subsidized housing 24
22Enclc loped ia Amer icana East Afr ica Vol 4 (1974) p 576
23 Ioid p 577
24Abull H Jamal The Critical Phase of Emerged African States (Afairasi East African Publishing House 1965) p 101
18
The colonial government provided most of this for East
Africa1s cities--usually at the expense of the lIagr icultural popushy
lation I But with the growth of the cities and the legitimate
pol itical de~and for the expansion and extension of these services
throughout the land it becomes financially impossible to maintain
them on the uneconomic basis of the past It is also economic
nonsense to consume resources In subsidies rather than use them
for economic development 25
Thr~ughout the world pressure for such services Is present
The way it is kept in line with what Is economically feasible Is
either to charge the economic price or to hand over responsibility
for the services to the local government concerned in which case
the citizens can make a choice between paying higher taxes or using
26the money for other purposes But with the usual East African
centralization of responsibility for these services in the national
government this economic calculus does not occur so Immediately
and directly Pressure for the services thus tends to lead the
East African governments constantly to Increase their expenditures
for them and to give lower priority to other investments that might
In fact re~ult In faster growth of the national income 27
25Ibid bullbull p 129
26 1bid p 159
~~ 71bid p 179
19
POPULATION DISTRIBUTION
Accorciing to the mid-year population estimates for 1968
the population of East Africa was 268 mllllon 28 Based on the
total land area of 642252 square miles mean populatIon density
of forty-two persons per square mile is obtained When compared
with the m~jor countries of Europe and Asia the mean population
of East Africa is very low According to the 1961 census India
had a total population of 438 million on an area of 126 mil lion
square miles with a mean population density of 319 persons per
square mile 29
Table
Mean Population Estimates Per Space Land (1968)
Estimated Total Land Area Population Mean Population
(Square Mi les) 1968 Per Square Mile
Kenya 219789 9104000 41
Tanzania 342171 10325000 30
Uganda 80292 7367000 92
Regional Population
The population of East Africa may be broadly divided into
three main categories first those around the shores of Lake
2EOxford Economic Atlas East African Community (New York Oxford University Press 1972) pp 174216 and 221
29lbid
20
Victoria ~econd those In the highlands country and In the footshy
hills of the major mountains third those in the coastal belt 30
Lake Victoria Is ringed on almost all sides by areas of
dense population In Tanganyika the lake and west regions which
surround the southern half of the lake comprised in 1967 a popushy
lation of some two and a quarter million over a quarter of the
total popuialon of Tanganyika although the land area formed only
one-eleventh of the countrys total On the north-western and
northern side of the lake the Masaka Mengo and BU50ga districts
of Uganda contained in 196B two and one-half million people
Finally on the north-eastern side Luo country in the Nyanza Province
of Kenya likewise showed In 1968 comparable densities of over two
hundred persons per square mile 31
In the group of the mountain areas we must include the
thickly populated districts of Central Province of Kenya where
the Kikuyu Embu Meru land units cluster In some districts popushy
lation densities range to two hundred to five hundred persons per
square mlleo North Nyanza and around the slopes of Mount Elgon
have densl~ies varying from three hundred to five hundred per square
mile whil~ on the western side of the mountains Uganda districts
have similar densities of between two hundred to three hundred
persons per square mile In Tanzania the category of thickly
populated mountainous regions includes the southern slopes of
30w T W Morgan and N M Shaffer op cit p 29
31Ibid p 27
21
Kilimanjaro ard Mount Meru and Livingstone Mountain in Southern
Highlands 32
The coastal belt consisting of a strip of low lying country
constitutes o~r third region of highly populated density This
area has beell subject to substantial immigration The population
was attracted not only to coastal cities but also by the large
sisal and sugar industrial plants oil refinery and shipping labor
which have drawn immigrant labor from all parts of East Africa 33
Urban Population
Precise international comparisons tend to be vitalized
by the fact that the destination of urban population varied from
country to country and from census to census It Is also true
that urbanization of the population of East Africa is extremely
low
In the Tanzania census of 1968 thirty-three Igazetted
townships were defined which comprises an aggregate population
of 664072 persons of all races or 51 percent of the total popushy
lation of the country34 Of this population over a third were
In Dar-es-Salaam (228742) and Tanga (138053)
In Uganda the census of 1968 contained as gazetted townshy
shlps those which comprised an aggregate population of 409075
32Seggerson Ope cit p 138
33lbid p 139
34Rbull G Abraham East African Townshlp In A W Southhall (ed ) Social Change in Modern Africa (New York Oxford University Press 1970) p 300
22
persons of all races or 2 percent of the population of the country35
Of these over one-third consisted of the populations of Kampala
and Jinja For the purpose of the Kenya population census urban
areas were divided into four categories municipalities grade
A townships grade B townships and trading centers 36 Not all
trading centers were defined as separate census areas and when
the results of the census were obtained it was found that several
of the grade B and even some of the grade A II had such small
populations that they could scarcely be regarded as towns in the
normally accepted meaning of the word The author therefore
defined urban areas as towns with a total of over two thousand
people There are approximately thirty-four towns of over two
hundred population
PEOPLE
It is difficult in the tradition of great social and cultural
diversity to distinguish East Africa by tribe but it Is very
difficult to give definitions of units that will accommodate the
wide range of factors Clearly tribe has reference to a distincshy
tlve group of people that possess the heritage of a common culture
lithe total of their forms of social organization historical trashy
ditions la~ and customs value and beliefs 1I37
35Ibid p 310 36 Ibid p 312
37w T W Morgan East Africa Its People and Resources People (New York Oxford University Press 1969) p 34
23
ThuD it is necessary to be somewhat arbitrary in disshy
tinguishing the various people of East Africa The term tribes
has the same sort of imprecise usefulness difficult to define
specifically as the term c lass in western industrial ized
countries 38 The late Dr Leaky (archeologist and sociologist)
classifies East African people into three distinctive parts
They are broadly classified on III inguistic and traditional basis ll
I into Nllotes Nilo-hlmites and Bantus 39 Such distinctions are
i 1 1 Table 2 1I The 0 1st r ibut ion of the Af r ican and the IINon-Af r ican ll
I in proportion by Cities4 1968 0
I 1 1
Country African INon-Afr Ican ll
Tanzania 4 1 721
Uganda 30 850
Kenya 53 850
very adequa~e to the actlvltes and interests which are of concern
to the people themselves in their ordinary lives For example
the Luo (nilotic) with their communal living society and with a
mixed economy of agriculture do not resemble the Masai (nlloshy
hlmltes) with their pastoral economy who are non-farmers they
~ 38 10 id p 36 39Ibid p 38
4UR G Abraham op cit p 318 IINon-African ll comprises people (male or female) of European or American origin Arabs Indians and Far East Asians
24
do not eat sea food The Bantus In East Africa (found mainly on
the southern hemispheres of Africa) have an exceptionally wide
range of cultures and economic systems 41
The Tribal Iassification
The term East African people identifies about 11110 different
people in the mainland Tanzania about 35 in Kenya and about 37
In Uganda42 Of these five comprise over a million people each
forty-threp exceed one hundred thousand people The smallest
tribes contdln only a few hundred people but their culture intershy
mediate zo~es are generally between one and another 43 Blackers
book of East African lIdemography provides an adequate overall
account of the traditional culture and social system of perhaps
thirty of these tribes 44
A number of larger and Important tribes remain still
undescribed by modern standard needs Published studies of social
and economic changes In recent decades are fewer even for those
people such as Kikuyu and Chagga where change has been most
radical Most books dealing with the traditional cuiture of East
African people were written many years ago and are not reliable
41Morgan Ope cit p 40 42 1bid p 36
43E A Blacker lIDemographyl1 (New York Oxford University Press 1948) p 43 The best general surveys of available Inforshymation are contained In the volume of the lIEthographic Survey of Africa (East Central Africa) 11 (London International African Institute 1970) p 70
441 bId p 79
25
guides for the study of people of East Africa in the second half
of the twentieth century
Historical Clusters
Although some tribes remain as little more than names on
the enthographlc map It Is possible to group the better known
people Into clusters which are identifiable In terms of common
historical traditions linguistic similarities and certain related
social Institutions and values As far as present knowledge goes
the following clusters are fairlyclear Only the larger tribes
are indlca~ed In the lists
Tribal names are given in their root forms
(a) Nilotes--Acholi Alur Lango Luo Padhola (b) Nilo-Hamites--(eastern Nilotes)
1 Teso Cluster--Karamojong Teso Turkana 2 Kalegln-Elgeyo Kipsiqis Nandi Tuqen 3 Masal Cluster--Arusha Masal Samburu 4 Tatoq Cluster--Barabalg
(c) Inter-custrlne Bantu--Ganda Ha Haya Klga Nkole Njoro Rundl Rwanda Soya Toro
(d) Elgon Bantu--Aisu Lugya (e) North Eastern Bantu--Chagga Embu Gusli (kissl)
Kamba Kikuyu Meru Mbere (f) Coast Bantu-Bondei Olgo Mljikenda Sambaa Zigua (g) Nyamwezi Cluster--Bena Hehe Sangu (h) Luguru Cluster--Kaguru Luguru Ngru4(I) Rouma Cluster--Makinde Makua Mawia 5
In no case are all the people of a cluster identical In
their econOOlic system In terms of their traditional economic
systems and the exploitation of the natural resources a more undershy
standable classification can be made In the following way
45 1bId p 15
26
A Primary Pastoral Economy with little or no agrlculture-shyBarabaig Boran Masal Redille Saburu Somalia Pastoral suk Turkana
B Mixed Pastoral and Agricultural Economy I Pastoral Ism predominant--Aogo Karamojong Klpsiqis
Kuna Nandi 2 Agriculturalism predomlnant--Arusha Bela Klssl
Ha Hehe Iraqw Iramba Kamba Lango Luqbata North Luhya Luo Njakjusa Padhola Rangl Hlgland Suk Sukuma Teso Tugen Turu
C Mainly Agricultural Economy with minor pastoral Interests--Acholl Alur Chagga Embu Alsu Kikuyu Nyoro Sambaa Toro
D Primary Agricultural Economy with little or no husshybandry--Digo Ganda Haya Klga K~gjO Makua Ngorl Ngindo Nyanwaz Soga Yao Zaramo Zlqua
There have been great basic changes that have occurred in
the last two decades toward a greater development of agricultural
Interest slight disappearance of tribal territories (traditions
of belief) due density Increasing demand for cash income and
greater att~nton to crop production husbandry by government and
47commercial concerns
AFRICAN HERITAGE
In general African cultural social background relevant
to economic development is very different from that of any other
developing region of the world Because of Africas geography
great size and climate It was after 1900 that the Influence of
the rest of the world began to reach most of Africa South of
Sahara 48
46 I bid p 2I bull 47Morgan Ope cit p 36
48~ K~ Schneider In W R Bascom and M J Herskovlts Continuity and Change In East African Cultures (Chicago University of Chicago Press 1959) pp 144-167
27
Perhaps there is a need to break the old African tradishy
tional heritage that Is passed to modern Africa A study of the
old African economy shows that it was one In which the methods of
production were simple and the units of production were small
The mlddle-nlen were both hated and Indlspensible Agricultural
progress was seriously impeded by the perpetuation of communal
right-over land 49 Chronic underemployment was one of Its basic
problems and despite moral exhortations among the people the
propensity to save was low It was an economy heavily dependent
on foreign sources for improved Industrial and agricultural methods
and to so~e extent for capital 50 The ambitious young men often
preferred careers In the professions and government service Men
here wrongly pinned their hopes on industrialization and economic
nationalism to absorb Its growing population Industrialization
was slow to come and the blessing of economic nationalism proved
to be mixed 51
The Extende~ Family
Perhaps even more Important than economic outlook both
positively and negatively Is the Inheritance of the continuing
strength of the tribal ties to which nearly all East Africans are
subject To begin with one must consider the L1neage Systems
49bld p 152
seA I Richard Economic Development and Tribal (Nairobi East African Publishing House 1969) p 78
Change
51lndustrlallzatlon In East Africa 5th Edition by United Africa Press Natrobl 1966 p 87
Published
28
or extended familyll--under which an individual has deep ties with
and feels obligation to a large number of people beyond the nuclear
family of the fathers mother and chlldren 52 Good fortune is
shared with m~ny others and In crisis one Individual can calion
help from many others
UnfCrtunately in terms of potential economic development
the extended family has many drawbacks It tends to discourage
Individual enterprise and Initiative as the burden of family
53obligations rise with the degree of an indlviduals success
There are other drawbacks Family crises tend to prevent
accumulation of capital or drain away the discretionary purchasing
power 54 The people with small incomes find it hard to comprehend
the greater cost of living of individuals with higher incomes
The age structure for the East African population is sigshy
nificant for as In most underdeveloped countries a large proshy
portion of the population is not of working age 55 Children of
fourteen years or under account for about 45 percent of the total
population which is comparable with the figure for Nigeria or
Brazil and in East Africa many children assist in picking cotton
or herding cattle Nevertheless productivity Is generally far
lower than that of adults and as increasing numbers of children
52UNESCO 11Popuiation Movements in East Africa in K M Barbour an~ R M Prethero (eds) Essay on African Population Routledge and Kegan (New York Oxford University Press 1961) p 96
53Ibid p 98 54( bid p 100
55L H Brown in E W Russell (ed) The Resources of East Africa (Nairobi Llterative Bureau 1968) p 102
29
attend school their contribution is decreasing although education
should enhan~p their income earning capacity in the future
Sh~rp contrasts in age and sex structure exist within East
Africa generally resulting from migration In NJombe and Songea
districts in Southern Tanzania about one-third of the adult men
are usually away Thus adult males make up a much smaller proshy
portion of the resident population than is normal The situation
is similar on~ thousand miles away in west Niles District of Uganda
The males of sixteen or over account for only 22 percent of the
population compared with the national average of 28 percent and
In the Kingezi District less than 20 percent were adult men according
to the 1969 census The absence of adult men Is even more marked
in parts of western Kenya for they comprise only 17 percent of
56the Kakamega District In the Kenya 1968 census
In Q1I these areas the high ratio of children to adults
tends to lo~er the level of economic activity This is not true
of the preponderance of women among the adults for they generally
do more work than men but the ratio of men to women may affect
57the economic activity in each area
Con~ersely an unusually high proportion of men of working
age means ~)re development 58 This is most evident in the cities
but also applies to larger areas such as Buganda or Tanga regions
Other factors must be favorable to attract people but the relatively
56Fred A Burke The Economics of Underdeveloped Countries (New York Oxford University Press 1972) pp 11-15
57 58Ibid p 29 Ibid p 30
30
high level of activity In areas such as Buganda is certainly related
to the age and sex and especially to the numerous Immigrant men
who either work as laborers or grow cash crops on their own account
there rather than In their home area
THE ECONOMIC ACTIVITIES OF EAST AFRICA
Trading Is an extremely Important economic activity even
though It Is not Itself productlve 59 By redistributing goods It
increases their value and It provides much employment in the process
Yet trading is sometimes omitted In studies In marketing geography
partly because of little data available on internal trade in East
Afrlca 60 However the main tradIng pattern of the regIon may be
outlined
Trade plays a smaller part In East African life than in
that of more highly developed regIons where peoples wants are
greater and where they satisfy few of their own requirements It
Is less Important even than in West Africa where It forms the
main Inter~st of an enormous number of people 61 Most East African
people produce theIr own food and cannot afford to buy many other
goods Nevertheless some goods are now sold In many parts of the
region and the proceeds are used to buy goods produced elsewhere
Commerce Is thought to contribute about 10 percent of all paid
59M Andrew Kamark The Economics of African Development (New York Praeger 1971) p 68
60 1bld p 98
61 Abull I Richard Economic Development and Tribal Change (Nairobi East African publishing House 1969) p 83
31
employment This commerce was mainly introduced since 1900 but
It has been superimposed on the traditional pattern of small-scale
trade which has not been entirely superceded
The Importance of trade In East African life has greatly
increased thrQugh the development of new forms of exchange which
Involve selling of goods for cash and buying goods produced far
away Ori31nally such trade consisted almost entirely of sales
for export overseas and the purchase of imported goods but today
an increased volume of sales Is to other parts of East Africa and
many of the commodities purchased have been produced within the
reglon 62
ThIs type of trade has provided the main basis for urban
development Both the large cities and the small towns of the
regions owe much of their present Importance to their trading
function even though many originated as administrative stations
within most rural areas the settlement pattern Is highly dispersed
and the clusters of bui ldlngs which are sometimes termed villages
usually consst mainly of IIdukas 163 Host of these small trading
centers grew up to handle the Import and export trade although
many now serve as markets for local trade
In review of a survey conducted by Keegan East Africa dukas
are very small carry one hundred items and occupy no more than
62Dbull A Hawks Official Journals East African Trade (Nairobi East Afric~ Publishing House 1963) p 10
63Warren J Keegan Multinational Marketing (New Jersey Prentice Hall Incorporated 1974) pp 308-9
32
fifty to seventy-five square feet 64 This indicates that the dukas
were operating on an average gross margin of approximately 12 percent
which is considered to be lower cost form of distributlon 65 The
East African duka Is highly Inefficient as a form of distribution
because the sales per person in the duka are much lower to keep
the duka developing significantly with the community economy
THE DISTRIBUTION OF TRADING ACTIVITY
Nairobi
The most important center of trade In East Africa Is Nairobi
A photograph of Nairobi Is provided on page 33 to give an example
of the modern cities of Africa Administration manufcaturlng and
commerce are three main functions of the city and are all comparable
In importace each employing more than fifty thousand people 66
The 1960 survey of distribution recorded one thousand wholesalers
In and out of a total for Kenya of three thousand It recorded two
thousand retail establishments compared with similar numbers In the
next nine towns of the country together 67 The value of all sales
by these ~airobi traders in 1960 was shs 400 billlon 68
T~e great Importance of Nairobi as a trading center Is
related to the fact that it performs trading functions at several
levels In some fields It serves the whole of East Africa and
64 Ib id p 308 65 Ibid p 309
66Mcrgan op cit p 70 67 Ibld p 72
6RKenya Chamber of Commerce Trade (Nairobi Kenya Governshyment Press 1973) p 5
34
in more ways it serves Kenya and Uganda and a small part of
Tanzania
In retail trade Nairobi serves a large area part of which
is relatively prosperous Its pre-eminence has probably hindered
the growth uf neighboring towns such as Limuru and Ruiru as shopping
centers Even Thlka thirty miles north of Nairobi Is more Important
in manufacturing than In trade 69 Much of the retail trade of
Nairobi however Is dependent on the large population and purchasing
power of the city itself Many people obtain their living by supplying
the needs of the administrations Industrial workers and even the
establishment of groups of up to thirty shops at various points
throughout-the higher class suburbs 70
The iMportance of Nairobi Is trade and Is related to Its
functions as the capital of Kenya and In some respects as administrashy
tive center for East Africa There Is a close relationship In which
its Importance In such fields as banking and Insurance are also
involved T~o other factors which favor Nairobi more than possible
rivals SLch as Mombasa are Its centrality in both Kenya and East
Africa and Its location on the eastern edge of the most prosperous
part of the region No town Is better placed to serve the whole
of Kenya or to serve all countries especially since means of comshy
munication have been on Nairobi The country south and west is
sparcely populated but In that to the north and east much purchasing
power Is concentrated There are substantial ve~y affluent European
69 Ibld p 6
70Ibld p 9
35
and African settlements which are of increasing significance as
71cash Income rl5es
Mombasa
Mombasa is not only the leading port In East Africa but
also a major center of trade The first function has led to the
second and the two together have enabled it to become the second
city of Kelya with a population of 380000 (1969 Census)72
Although many importing and exporting firms have headquarters in
Nairobi and their goods are consigned directly to or from the
port many others have offices in Mombasa and compete successfully
for the trade of a large part of East Africa Most traders in
Moshi for example and many in Kisumu or Kampala obtain supplies
through Mombasa importers The export marketing trade provides
much employment outside the port area far apart from private firms
concerned mainly with exports The Uganda Coffee and Lint Marketing
Board has large warehouses In Mombasa 73
Mombasa functions In retail and local wholesalers markets
but this activity Is small in relation to its size Its sphere
of Influence is inevitably reduced by its coastal location while
much of its immediate inner land is arid and sparcely populated
The ships calling at the port provide extra trade for they generally
71A M Wilson Social Change In Modern African Trade (New York Oxford University Press 1961) p 193
720xford Economic Atlas (New York Oxford University Press 1974) p lQ7
73Encyclopedia Americana East Africa Vol 4 (1974) p 579
36
take on some supplies and their crews and passengers often spend
some time clshore However this is of small Importance In comshy
parison with the export trade
Dar-es-Salaam
In some ways Dar-es-Salaam combines the functions of Nairobi
and Mombasa since it Is both the capital and the leading port of
74Tanzania Each of these roles encourages trade and the city
is much the most Important center of trade In the country On
the other hand It does not dominate the whole country as much
as Nairobi and Mombasa together dominate Kenya for both North
and South have only limited marketing connections with It Arusha
and Moshi have closer tradIng links with Kenya cities and with
the port of Tanga Bukoba has closer ties with Uganda and Kenya
and Mowara Region Is often linked physically with the capital only
by sea and It is therefore commercially Independent to some extent
Dar-es-Salaam also plays a smaller role than Nairobi and Mombasa
combined It Is comparable In size with the latter and Its inhabishy
tants are very much dependent on Its trading functions It is the
main center of import export and wholesale trade for the area
of 280000 square miles and a population of 19 million people 75
It Is also the center of small-scale wholesale and retail trade
for the coastal region while the purchasing power of the city populashy
tion is sufficient to support a wide range of specialized shops
74B F Joh~son The Sta Ie Food Economics of Tro leal Africa Tanzania (Stanford Stan or UnIversity Press 9 p 131
7Ibid p 26
37
Kampala
Kampala is smaller than the three cities mentioned above
but it is very clearly the commercial capital of Uganda Several
of the major importtng and exporting firms of East Africa have
branches there and merchants import goods directly from the port
of Mombasa Many of the businessmen are middlemen who buy from
Nairobi or Mombasa wholesalers and who often sell to other wholeshy
salers in sm~ller townsJ6 Kampala controls most of the trade of
Buganda and Western Uganda but less of that of the east and north
Thus whereas little is obtained their cement is consigned directly
from Toro to the northern towns Little is dispatched to towns in
77the west for these obtain their supplies through Kampala dealers
Although location and the communication pattern limit Kampalas role
as a distribution center for Uganda Kampala middlemen merchants
have extended their sales area in the west beyond the border of
Uganda to Bukoba and to Rwanda
Others
It is not practical to examine the trade of every town in
East Africa but some further features of the distribution of trade
might be noted
Most of the towns classified as others are majority adminisshy
trative centers and their marketing functions have developed from
this Although they differ considerably they are very similar in
76W T W Morgan East Africa Economic Characteristics (Nairobi ~ast Africa Publishing House 1960) p 279
77ibid p 280
38
appearance In addition to administrative functions these towns
provide services such as hospitals and they have generally become
centers of local communication The features tend to enhance their
roles In trade The size and importance of these trading centers
is generally related to the size population and propensity of the
areas they serve Most of these towns are newly created Their
populations range from between three thousand to six thousand and
they have rather less than one hundred shops most along a single
main street 78 All are retailers but many also sell goods to traders
from the countryside and buy some local agricultural products
Mo~t of the towns created are very young and they came into
existence due ~o the scarcity of land These towns are scattered
throughout East Africa and vary In both size and frequency with
the density of population and the local level of income
COMMUNICATION ACTIVITY
Transportation has become an Important economic activity
Official estimates place Its contribution to the Gross Domestic
Product of East Africa at ~45 million which accounts for 61 percent
of the total 79
Road Transportation
Road and rail transportation are probably roughly comshy
parable as sources of Income In East Africa although they differ
78~NESCO Opt cit p 96
790xford Economic Atlas (Oxford Oxford University Press 1966) pp 174216221
39
greatly in structure Road transportation is operated mainly on a
very small scale but there are so many small operators that the
number of people earning a living in road transportation Is very
large SO Motor vehicles came Into general use in the 1920s but
the greatest expansion of road transportation came thirty years
later Today there are many more vehicles per head of population
than in Nigeria or even Egypt approximately six persons per cad IISl
In Table 3 on page 40 road transportation shows that the majority
are private cars but the figure for vans lorries and busses undershy
states the volume of commercial road transportation Cars on many
East Africa roads are used legally or otherwise as taxis proshy
viding many people with good incomes This Is especially well shy
developed in Uganda and helps to explain the small number of busses
there Within each country road transportation activity Is heavily
concentrated In the most prosperous areas especially around the
capital Traffic counts show a far greater intensity on roads around
Nairobi M0mbasa Kampala Jlnja Dar-es-Salaam and Tanga than
elsewhere
The overall Importance and the pattern of road transportation
are both affected by the nature of the road network Road building
has been assisted by the character of the earth in many areas
simple earth murram road serving very well for light traffic
Although few roads are tarred the road network is ~uch better
than In countries such as Sudan and in much of East Africa is
SOlbid pp 147 174 193
81Ibid pp 147 174 183 193
40
Tab Ie 3
Transportation in East Africa (1963-73)82
Kenya Tanzania Uganda Totals
Thousand miles of roads of which bitumen surfaced
(thousands units 000)
Private Vehicles Commercial
Lorries Vans Busses
1963 Flgur~s Private Commercial
Ra 11-Track (In kilometers)
Rail-Vehicles (units 000)
Air-Craft (units 000)
Sea Transportation
nd -- No data available
522
22
1002 295 104 82 26
440 90
962 km
163
05
nd
409
22
726 304 11 I 74 22
220 80
3782 km
42
nd bull nd
39 I
07
619 208 64 70 17
180 60
1 160 km
72
04
nd
1322
5 I
2345 80 1
840 230
59 km
17
82 Ibid pp 174216221
41
adequate for the demand made upon it 83 Some areas without roads
notably in central and western Tanzania are found In other areas
many roads 3re Impassable In the wet season but themiddotdlstrlbutlon
of road transportation activity Is related mainly to factors other
than the roads themselves
Rail Transportation
In spite of competition from the roads railways of East
Africa still undertake most long-distance movement of bulk loads
All are operated by East African Railways Corporation on behalf
of the three governments The rail works employ more than eighty
thousand people
The entire railway system covers 5895 kilometers all
being meter gauge and virtually all single track 84 The East
African Railway Corporation Road Services Is operated mainly In
Uganda and Tanzania although a nucleus of road services between
Mombasa and Nairobi was established to provide express services
for certain commodities
The railway has been Increasing at a moderate rate over
the past few years Between 1965-1971 passenger number rose by
an average of 66 percent per year While the corresponding growth
85rate of freight was approximately 10 percent
83 lbld pp 147 174 193
84 IbId p 39
85Ibld pp 147 174 193
42
Sea Transportation
Sea transportation as an economic activity concerns East
Africa mainly through employment at the ports Sea transportation
administration is operated by the East African Harbors Corporation
on behalf of the East Africa community86 There are several sea
ports which serve Kenya Uganda Tanzania Rwanda and Eastern
Region of Zaire
Periodically these harbors suffer from severe congestion
with serio~s repercussions upon the economy of the entire East
African region The organizational changes within the East African
Cargo Handling Services responsible for handling of cargo as opposed
to the administration of the port makes handling operations slower
and more inefficient
Air Transportation
Air transportation is less than the other forms of transshy
portatlon for it can be used only by the most affluent passengers
and for the most valuable goods In each case the re-fuellng of
planes in transit provides a useful source of income Regular
internal services call at thirty-four places In East Africa of
which twenty-one are In Tanzania 87 The large size and peripheral
populatiofl pattern of that country make air transportation more
appropriate than in Kenya or Uganda Air transportation is unl ikely
to become a major economic activity In East Africa until Its cost
Is greatly reduced
86 Ibld bullbull pp 147 193 87 lbld bull
43
Communication Media
Communication media includes television radio receivers
telephones and dally newspapers These sources are growing at a
88rate of 10 percent per year The growth In urban areas Is higher
than In rurai areas No current data are avaIlable
Tab Ie 4
Communication Medla89 (Thousands) 1963
Kenya Uganda TanzanIa
Television 22 1 100 00
Rad 10 Reef Ivers 70 I 400 300
Telephones 6 1 6 1 32
Da II y Newspapers 190 123 83
SUMMARY
This review of literature was divided Into eight areas which
are pertinent to this study It was designed to provide background
Information related to
A East African Political Environment
1 Regional Survey
2 Nyika Plateau
3 Lake Victoria Basin
88Morgan East Africa Economic Characteristics p 36
890xford Economic Atlas Ope cit Table 1
44
B The Economy
1 Subsistence Economy
2 The Public Sector
3 Excessive Expectations for Public Service
C Population Distribution
1 Regional Population
2 Urban Population
D People
1 Tribal Classification
2 Historical Clusters
E African Heritage
1 The Extended Family
F Understanding the Economic Activities of East Africa
G The Distribution of Trading Activity
1 Na I rob I
2 Mombasa
3 Dar-es-Salaam
4 Kampala
H Communication Activity
1 Road Transportation
2 Rail Transportation
3 Sea Transportation
4 Air Transportation
5 Communication Media
Chapter 3
DESIGN OF THE STUDY
EAST AFRICAN ELITE
This survey was conducted and certain Information provided
to the argument of the study However difficulties of conducting
research 11 the formerly British-controlled territories of East Africa
are no different from those encountered elsewhere only more intense
because of lack of basic bench-mark data and basic socloeconomic
data Stratified probabil ity sampling in more advanced societies
can be designed in many ways Voters rolls rate-payers registers
and the like are usually up-to-date and easily available to the
researchers Such data do not exist in East Africa I Survey
research must be designed therefore on what data are available
There is little constructive value In the criticisms of the purist
that sampling techniques used in Africa do not fit acceptable
Western standards 2 It Is true that they do not but Leonard Doob
states that lithe scholarly or scientific gains to be derived from
ILeonard W Doob Periodic Surve s In Sub-Saharan Africa (Nairobi Nairobi Publishing House Hay 11 1970 p 3 bull
21~id p IS
45
46
valid results are so staggeringly inviting that the frustrations
of the moment Cre rendered almost Impotent- 1I3
Marco Surveys Ltd Nairobi Is the original data source
on its determination to publish Whomiddots Who in East Africa In 1974
Its part information Is the basis for this study
The survey by Marco Survey Ltd Nairobi had faced some
difficulties in deciding who was to be interviewed however It
took several months of careful planning Staff lists were prepared
by the four governments directories of commerce and industry and
membership 1ists of all available professional cultural and warshy
fare organizations and societies were examined Finally the
wage structures of the largest companies were checked and compared
to the wage paid by the four governments Every Interview was
planned and every respondent was presented There were direct
mall intervIews and each respondent signed the completed form
as correct after the interview
The criteria for selection to be interviewed were two The
first criterion was income The optimum cot-off point was an income
of ~I 000 per annum which is higher than the average European
or Asian income and Is also higher than the starting scales for
4university graduates The second criterion was the position held
by the respondent Women who have been Included are el ites In
their own right and not persons who are simply wives of elites
There are only sixty women in the total of 1423 Interviews about
3Eest Africa 1974 (Nairobi Marco Survey Ltd 1974)
4Doob Ope cit p 256
47
4 percent so sex was not used as a basts of tabulating the socloshy
economic data
This data Is presented on a comparative basis to Illustrate
by the basic =lassiflcation data the differences and similarities
of the African elite of the three countrles--Kenya Uganda and
Tanganyika Zanzibar has been Included and treated separately In
most of the tables
This study Is divided Into three parts The first Is an
analysis of the elite In East Africa based on the basic classificatory
data that w~s collected In the original research for Whos Who in
East Africu5 and additional studies which In addition to describing
the elite give Insight Into their opinions attitudes and beliefs
The second is a survey of urban elite opinions on basic social
and economl~ problems and technical assistance It Is based on a
stratified probability sample of those who most closely resemble
the elite in three African capital cities The third describes a
survey which Is beginning to provide research Into changing attitudes
and knowledge that will temporal orientation determlnlsm 11 The
sample will be described at the beginning of the second part for
each of these surveys and a few sample tables will be given to
Illustrate some of the results of this research
Approximately 6 percent of the Africans listed for Intershy
view refu~ed to be Interviewed There were numerous reasons given
for refusing but the chief factors were education and personal
reasons claiming that they were not Important enough to be included
5Marco Survey op cit p 19
Na I rob I
URBAN ELITE OPINION
Order (Englewood Cliffs chapter 4
A recent study poses the hypothesis that the role of the
Standard codes were used to clarify the data and cards
be said that the attitudes and opinions expressed In answer to
East Africa to test the attitudes and opinions of the city African
The interviews were conducted by permanent senior research
48
6Fred G Burke Africans Quest New Jersey Prentice Hall Incorporated
questions are those of the elite but they do represent the opinions
and education The respondent had to have had some secondary edushy
affairs and social problems The sample was stratified by age
the interviews were conducted or had many years of residence there
Inevitably some of those listed were not available for Interview
on certain questions Involving his personal life International
cation and had to be at least eighteen years of age It cannot
a stratified robability sample in each of the capital cities of
Five attempts were made In every case of this type before giving
city in Africa is that of generator communicator Innovator and
Intergrator 6 The research accepted this hypothesis and designed
were punched for 80-column ICT data-processing equipment in
up An estimated 10 percent of those listed were no t avai lable ll
assistants All of these have at least a Bachelor of Arts degree
for interview for one reason or another
or its equivalent and are either nationals of the country in which
49
and attitudes of a probability sample of urban African eighteen
and over who has had some secondary education and who lives in
one of the capital cities of East Africa Therefore the opinions
of this group will be closer to those of the elite than a sample
based on the population as a whole
The people interviewed were chosen in the following manner
Each city including peri-urban and dormitory areas was divided
into geographical units using a grid method on a base map Each
square of the grid was numbered except for those that were in
the business area--marshalling yards ocean and the like--and 10
percent of the squares were chosen by using a table of random numbers
The number of units of housing In each was then determined and
the quota was divided proportionately between each The interval
between units was determined and a starting point selected
The interviewers continued Interviewing to the set interval
until the quota was completed Three callbacks were made where
necessary for each respondent before declaring that interview
void The household was defined as that group which regularly
takes its meals together The head of the household was Intershy
viewed to determine how many In the household of either sex were
over eighteen and had had some secondary school education Those
were then listed and the person to be interviewed was selected
by a system of random numbers Only one person was Interviewed
In each household If the unit did not have at least one person
as defined by education the interviewer then proceeded to the
next household by the fixed interval Ten percent of the intershy
views were checked by field supervisors The Interviews were
50
conducted i~ English for the most part but some Swahili was used
in Dar-es-Salaam
The questionnaires were pretested in each of the capital
cities and the questions were modified where necessary The
translation of Swahili was made in the usual way of two separate
translators who worked from Engl ish to Swahil i and vlce versa
The interviews were conducted from September 15 to October
5 1974 The tables have been shortened for prInting convenience
by grouping items that have less than 5 percent response Into the
category 1I0thers 11 Percentages were rounded to the nearest whole
number or if the percentage was too small in a subsample whole
numbers were given in parentheses
OPINIONS AND ATTITUDES
The following is a description of a few of the questions
which were used in pretesting a series of eighteen questions in
three capital cities of East Afrlca to establish eight scales to
assess opinions and attitudes about temporal orientation governshy
ment confidence and optimism science and determinism conception
of people politics and tribalism or traditionalism It is Intended
that the scales when adequately tested revised and evaluated
can be used for per lodlc surveys at least fixed intervals over
1I7the next five years Such surveys will provide scales that can
be used to measure social change and that can be used to compare
7Gordon H Wilson liThe Transformation of East Africa Basic Scale for Periodic Research (New York Basic Books Printer 1971) p 456
51
data from the three capital cities and also to compare the basic
data between the elite of the urban areas and probability samples
from selected rural areas
The pretests were carried out in Nairobi Kampala and
Dar-es-Salaam Each was based on a probability sample of 150
people stratified by age eighteen and over and education The
respondent must have had some secondary education In fact the
sample for the pretests were chosen on the same basis as the survey
described In the third part A probabilIty sample of this type
Is unavoid~bly composed mostly of males young adults who are
relatively wealthy engaged In the more skilled occupations and
professIons representing the politically and socially Important
members of the community It closely resembles the elIte described
In the second part of this chapter The research selected only
a few questions to Illustrate the possible value of the results
It Is patently evident however that though these one-shotll
results are
bull merely interesting or suggestive they will become significant and really helpful when comparative data are obtained over a period of time so that trends knowledge and public ftplnlon can be detected and measured by established scales
8 b t d p 456
Chapter 4
ANALYSlS OF DATA
The age of the elite of East AfrIca shows some sIgnIfIcant
differences among the four countries Table 5 on page 53 is the
percentage distribution by age If we disregard the not stated
categories the average ages are as follows Kenya 31-45 years
Uganda 36-40 years Tanganyika 31-35 years Zanzibar 41-45 years
East Africa 36-40 years
Table 5 shows the average age of elIte to be higher In
Uganda and Zanzibar than In Kenya and Tanganyika Uganda has 17
percent of elite over fifty years and ZanzIbar 28 percent whIle
4 percent cf elIte are In this age group In Kenya and Tanganyika
Later the analysis will reveal that one-third of the Uganda elite
are Baganda thus the explanation of the older average age may
be that Baganda has had a strong traditional centralized governshy
ment for many years and therefore posItions of power of authority
have been open to the Baganda for a much longer period than for
other East Africans The same explanation can apply to the elite
of Zanz rbar
The process of Africanlzatlon can be seen In Table 6 on
page 54 There Is a smaller percentage of Africans in the civil
service In Kenya than In the other two countries but a higher pershy
centage of elected and appointed representatives due to the regional
52
53
Table 5
East African Elite Age Factor By Percent
Kenya Uganda Tanganyika Zanzibar Total
Up to 25 years 5 1 1 2 3
26-30 years 18 15 18 8 16
31-35 years 26 15 21 5 17
36-40 years 21 20 20 9 20
41-45 years 12 16 11 17 14
46-50 years 4 8 8 5 6
51-55 years 2 9 2 10 4
56-60 years 1 4 2 8 3
61-65 years 1 3 - 7 2
66 and over a 1 - 3
Not stated 10 8 17 26 14
Total 100 100 100 100 100
Base 457 409 444 113 1423
a -shy Less than 5 percent
54
Table 6
East African Elite Occupation Factor Sample by Percentage Distribution
Kenya Uganda Tanganyika Zanz Ibar Total
Civi 1 servant 27 42 51 46 40
Electedappointed 41 34 23 10 31
Commerceindustry 12 10 9 19 11
Trade union politician 13 5 4 6 8
Education 6 6 7 a 7
Professional 3 I I 7 2
Cooporatlvestrade I I 3
Religiouswarfare 2 4 6 - 4
Agriculture I 2 1 3
Miscellaneous 2 3 3 2 3
Total 108 108 108 108 108
Base 457 409 444 113 1423
a -- In a few cases the same person qualified in more than one classification
55
form of government Kenya also has a higher percentage of elite
who qualify as trade unionists
There are several ways of describing occupations Civil
servants for example can be in medical education or other
services Table 7 on page 56 gives occupations of the elite
in East Africa by a different set of criteria
The Education Factor
Tabl~ 8 on page 57 shows that in the categories University
and above East Africa rates 25 percent--with Kenya 25 percent
Uganda 24 percent Tanganyika i9 percent and Zanzibar 32 percent
The high number in the last country is accounted for in Table 7
IIEast African Elite Where Educated A higher percentage were
educated in the United Kingdom and IndiaPakistan (52 percent)
because of lack of local secondary schools Another factor is that
a well established social class structure was part of pre-independence
culture The upper class in Zanzibar and to some extent those
among the Baganda could afford overseas education whereas those
from other countries were dependent on financial help from governshy
ment sources
There was a higher percentage of elected or appointed represhy
sentatives In Kenya and this category was not so highly educated
as the Icivtl servant of a ll others categories It can be seen
that there are more electedappointed representatives than civil
servants or others in the lowest categories of education In the
highest educational brackets we have more civil servants in the
elite of all three countries than in the other two classifications
55
form of government Kenya also has a higher percentage of elite
who qualify as trade unionists
There are several ways of describing occupations Civil
servants for example can be in medical education or other
services Table 7 on page 56 gives occupations of the elite
In East Africa by a different set of criteria
The Education Factor
Tabl~ 8 on page 57 shows that In the categories University
and above East Africa rates 25 percent--wlth Kenya 25 percent
Uganda 24 percent Tanganyika 19 percent and Zanzibar 32 percent
The high number in the last country is accounted for in Table 7
IIEast African Elite Where Educated 1I A higher percentage were
educated in the United Kingdom and IndiaPakistan (52 percent)
because of lack of local secondary schools Another factor is that
a well established social class structure was part of pre-Independence
culture The upper class In Zanzibar and to some extent those
among the Baganda could afford overseas education whereas those
from other countries were dependent on financial help from governshy
ment sources
There was a higher percentage of elected or appointed represhy
sentatives n Kenya and this category was not so highly educated
as the llcivll servant of lIa ll others ll categories It can be seen
that there are more electedappointed representatives than civil
servants or others in the lowest categories of education In the
highest educational brackets we have more civil servants in the
elite of all three countries than in the other two classifications
56
Table 7
East African Elite Specific Occupation Factor By Percent
Kenya Uganda Tanganyika Zanzibar Total
Education (administration) 5 4 6 7 5
Education (teacher) I 3 1 2 2
Medical practicing 4 5 3 5 4
Sciences 1 I I 2
Lawjudicial 1 6 2 8 2
Accountancy 2 1 2
Farmer 1 2 I 3
Entrepreneur 2 2 I 9 2
Senior executive 34 36 61 44 45
Junior administrator 7 14 14 3 1I
Legislator (only) 38 20 7 8 21
Partyunion officials 13 5 4 6 8
Editorsartauthors 1 1 I 5
Clergy senior 1 3 4 - 2
Others (unclassified) 2 5 3 2 3
-Base (all Africans
Interviewed) 457 409 444 113 1423
57
Table 8
East African Elite Education Factor By Percent (1972)
Educational Level Reached Kenya Uganda Tanganyika Zanzibar Total
No formal education
Attended junior secondary 22 13 8 21 15
Attended sen lor secondary 21 18 23 13 20
Obtained certificate of secondary 12 8 3 10 8
Obtained higher certificate high school a a a - a
Nonunlverslty technical studies 5 7 19 6 10
Nonunlverslty teaching studies 4 6 7 - 5
University studies non-graduate - 22 20 17 17
University studies 1st degree 17 15 16 26 17
Post-graduate university ma s te r I s deg ree 5 7 2 4 7
Post-graduate university studies higher degree 2 2 1 2 1
Not stated I - I I a
-Base (all Africans
Interviewed) 457 409 444 113 1423
a -- Less than 5 percent
58
Civil servants In Uganda are more highly qualified than In the
other three countries 59 percent have university education In
Kenya 56 percent In Tanganyika 42 percent and in Zanzibar 56
percent have university education Elected and appointed represhy
sentatives generally have less education In Kenya 22 percent
Uganda 37 percent and in Tanganyika 26 percent (Zanzibar could
not be tabulated) have university education Uganda Is still the
highest among the three countries
Country Where Ed~catlon Was Obtained
Table 9 on page 59 gives details about the country In
which the respondent was educated In his final year of education
It can be seen that the highest percentage of the elite were edushy
cated in local East African schools (58 percent) The United Kingdom
came next (28 percent) followed by the United States (7 percent)
IndiaPakistan and other African countries There are very sigshy
nificant differences between the East African countries however
which are worth noting Zanzibar and Uganda have many more elite
who were edycated overseas and in the United Kingdom particularly
than the other countries Kenya had fewer by 10 percent than
the next lowest which was Tanganyika
It would be a waste of effort to detail all of the East
African schools attended by the East African elite There were
nearly one ~undred What is significant however is to show that
out of this total only a few schools account for handful accounts
for more than 5 percent of the elite In each country and moreover
this handful accounts for a very significant percentage of the elite
59
Table 9
East African Elite Where Educated
Country Educated Kenya Uganda Tanzania Zanzibar Total
East Africa only 67 54 57 42 58
Afrlca--outslde East Afrt ca 3 4 4 1 4
The U S 8 5 8 2 7
The U K 18 38 27 38 28
IndiaPakistan 4 3 3 14 4
Austral la New Zealand a - - - a
Canada - a - - a
Western Continent Europe Ie Germany Norway 1 1 3 2 2
USSRChina or Eastern European Countries - - a - a
Elsewhere outside Afr lea
Not stated 1 - a 2
Total 103 106 100 100 100
Base (All AfrIcan Interviews) 457 409 444 113 1423
a -shy Less than 5 percent
60
The Factor of Rellslon
This survey did not Include Zanzibar and therefore the
paper Is unable to provide comparative figures for Zanzibar of East
Africa as a whole One would logically expect to find relatively
61
the same number of elite as the general percentage for the popushy
lation as a whole In each religious grouping
Table 10 on page 62 is complicated by the category among
the elite of Inormal Chrlstlan1I which did not appear In the first
survey This category has been added because many of the sophisshy
ticated Africans were educated In Christian schools so they do not
regard themselves as pagan and yet they do not belong to any formal
church The category IInormal Christian or simply Christian is
used to describe them We can generalize that fewer Moslems are
among the elite than one would reasonably expect from the above
figures particularly In Tanganyika Fewer Roman Catholics in
Kenya and Uganda are among the elite than one would reasonably
expect from the above figures about the proportions to be expected
Moslem education In East Africa Is less than education
among the other religions Protestant missions have been strongest
in education since earliest times In East Africa and this Is
reflected in Table 10 Even In government schools in the old colonial
tradition the Church of England as the state church dominated
the educational field In the British System and in England today
1Ireligion is taught along with the three Rl s This will explain
the larger number of Protestants In the population as a whole and
among the elite of Uganda and Kenya Zanzibar of course Is a
Moslem country Most of the 7 percent 1I0 ther ll in Zanzibar were
Bahal The white fathers of Tanganyika dominated the field of edushy
cation in early German times and remained a powerful force throughshy
out the Trusteeship period
62
Table 10
East African Elite Religion Factor Compared to Population Percentage
Kenya Uganda Tanganyika Zanzibar Total
Elite Othersa Elite Othersa Elite Othersa Elite Elite
Roman Catholic 21 29 25 34 26 28 4 22
Protestant 54 45 65 50 22 26 43
Moslem 4 16 3 10 16 39 88 14
Pagan 8 6 7
Normal Christian 15 2 24 13
Other 7
Not stated 6 2 5 1I 7
Total 100 100 100 100 100 100 100 100
Base 457 2400 409 2600 440 2000 113 1423
a -- The percentages for others is based on the probability sample (7000) of survey conducted by Fred G Burke Some grass-roots attitudes affecting political and social Intergratlon In East Africa paper delivered to the African Studies Association San Franclsco October 26 1963
63
The Factor of Voluntary Associations
The degree to which Individuals In African societies join
groups of voluntary association is a measure of social change The
comparison between the four countries which is given in Table 11
on page 64 shows significant differences between them Tribal
associations are much stronger in Kenya than elsewhere 21 percent
as against 2 percent to 8 percent In Zanzibar Tanganyika and Uganda
This underlines the felt need of the Africans of Kenya for security
among their own people in the face of Insecurities of the old
colonial system and Its concomitant privileged European and Asian
classes Nowhere else in East Africa was the position of the
settler or trader so strong Moreover political parties were
banned In Kenya on a national basis until comparatively recently
although district associations were encouraged by the administration
Kenya elite rate highest In political party membership (35
percent) as against 17 percent to 22 percent and trade union membershy
ship (20 percent) as against 5 percent to 12 percent
Uganda elite join more groups of voluntary associations
than the elIte of other countries The average Uganda elite has
membership In two groups Kenya 1-7 Zanzibar 1~6 and Tanganyika
1-5 Moreover the kind of groups that the Uganda elite support
are more sophisticated The Uganda elite rate much higher In
religious (16 percent) versus 6 percent to 9 percent professional
(15 percent) versus 4 percent and cultural (16 percent) versus
6 percent to 11 percent The Uganda elite Is only second to the
Zanzibar elite (42 percent) as members of social clubs (36 percent)
but significantly higher than the Kenya elite (23 percent) and the
64
Table 11
East African Elite Voluntary Associations Factor By Percent
Kenya Uganda Tanzania Zanzibar Total
Member of a tribal association 21 8 3 2 10
Religious societyunion 6 16 6 9 9
Business society 5 8 6 11 6
Professional society 9 15 4 15 9
Academic society 12 20 7 17 13
Political party 34 21 22 9 25
Charitable organization 5 13 12 42 10
Social club 23 36 25 9 29
Sporting club 6 16 11 15 11
Other organizations 11 4 5 10 8
Cultural organizations 6 16 11 10 11
Trade union 20 5 12 5 12
Belong to none 18 17 33 17 22
Total a 176 195 157 165 175
Base (All African interviews) 457 409 444 113 1423
a -- Many individuals belong to more than one group
65
Tanganyika elite (25 percent) One In three of the Tanganyika
elite (33 percent) does not belong to many voluntary associations
compared to only 17 percent or 18 percent for the elite who do not
belong to at least one society In the other East African countries
Business is presented equally in each of the four countries
Table 11 Is one of the most significant of the survey The
Uganda elite of whom one in three was Baganda have had University
at Kampala for many years It was once the only center for higher
education In East Africa Therefore culture In the western sense
was for many years a factor of influence on elite of Uganda which
was not available in either Kenya or Tanganyika
The Tribal Factor
The percentage of the elite In each country by tribe
compared to the percentage of the population represented by that
tribe should give an Interesting Index of the degree to which
the tribe has progressed and Indirectly of the Influence of Its
members
The first significant fact which emerges Is that 9 percent
called themselves Tanganyikansll and would not use the label tribe 11
We can only assume that the actual percentage by tribe of this group
Is about the same as described In Table 12 on page 66 with the
obvious Inclusion of some who are of mixed percentage The most
significant fact Is that there were 30 percent who belonged to Kenya
tribes 2 percent Ugandans and 5 percent Zanzlbarees No other
East African country had as high percentages In these categories
That amounts to 37 percent who were of tribes other than those of
66
Table 12
Tanganyika ElIte by TrIbal Group
Tri be Percent of PopulatIon Percent of ElIte
Sukuma 19 3
Nuyamwerl 7 2
Hakonde 6
Haya 6 7
Chagga 6 12
Gaga 6
Ha 5
Hehe 4 1
Nyakusa 4 3
Wguru 4
Sambaa 3
Zaramo 3
Yao 3
Hwevu 2
Others (Less than 2) 13 22
Stated Tanganylkan 9
Kenyan Tr t bes 30
Uganda TrIbes 2
Zanzlbaree 5
Toeal 100 100
Base 10204000 (1973) 444
67
Tanganylkans The major tribe the Sukuma represents one in five
of the Tanganyika population yet has only one In thirty-three
among the elite There are twice as many Chagga among the elite
as their tribal percentage would warrant Surprisingly the Haya
have more than their share although all the rest have fewer except
the ve ry sma 11 Ilothe r ll t r i bes who have nea r 1y tw Ice as many
In Uganda we would expect to find the Baganda over represhy
sented in the elite (see Table 13 on page 68) They have like
the Chagga twice as many (33 percent) as the tribe percentage would
warrant (162 percent) An even higher percentage 28 percent
claimed to be IIUgandans a classification not recorded in the official
census figure Only 1 percent are from Tanganyika and 1 percent
from Kenya Unlike Tanganyika the smaller tribes which each
represent less than 1 percent each of the population have only
half as many elite (6 percent) as their combined percentage (94)
would expect Tanganyika had twice as many The Watoro was the
only other tribe In which the percentage of the elite exceeded
that of the tribe 4 to 32
Kenya Is unique In that there are several tribal groups
that exceed their quota of elite and by almost the same ratio (see
Table 14 on page 69) The Luhya have a slight margin by ratio
over Luo and Kikuyu The Kamba Mero and Embu related tribal
groups are all seriously under their expected percentages Like
Tanganyika but unlike Uganda the small tribal groups--each of
less than 3 percent of the total population but represent 161
percent of It--have 22 percent of the elite A high percentage
of this group of the elite are from the numerous coastal tribes
68
Table 13
Uganda Elite by Tribal Group
Tribe Percent of Population
-Baganda 162
Banyonkole 8 I
Teso 8 I
Basoga 78
Baklga 7 I
Lango 56
Baglsu 5 I
Acho I I 44
Lugbara 37
Wator i 32
Banyaro 29
Karamujong 19
Alur 14
Banyole
Kuma 94
Others (Less than 1) -Not stated
Stated Ugandan -Kenyan tribe
Tanganyika tribe
Total 1000
Base 7367558 (1973)
Percent of Elite
33
3
3
4
2
3
3
4
3
6
28
100
409
69
Table 14
Kenya Elite by Tribal Group
Tri be Percent of Population Percent of Elite
-Kikuyu
Luo
Luhya
Kamba
Meru
Kis i i
Embu
Klpsigis
Nandi
Others (Less than 3)
Stated Tanganyika
195
144
125
117
69
49
39
3
22
16 1
23
19
19
6
2
3
2
22
2
Total 1000 100
Base 9204000 (1973) 457
70
Table 15
Question
What in your opinion is the most important problem facing our country at the present time
Na i rob i Dar-es-Salaam Kampala Total
Education
Poverty-famine
Unemployment
Economic development
High cost of living
Border disputes Inter-African disputes
Pol itical instabi 1ity
Tr i ba 1ism
Land apportionment
Publ ic laziness
Other problems
Don1t knownot stated Refused to answer
22
13
41
6
10
3
2
3
2
2
29
24
6
24
3
6
4
2
28
18
18
12
9
5
3
2
5
3
27
19
18
14
8
3
3
4
2
Total 109 105 105 105
Base 389 451 395 1235
71
Table 16
Question 2
All things considered how satisfied are you with your present standard of 1ivlng--very satisfied fairly satisfied
somewhat dissatisfied or very dissatisfied
Nairobi Dar-es-Sa1aam Kampala Total
Very satisfied
Fairly satisfied
Somewhat dissatisfied
Very dissatisfied
Don I t know
Refused to answer
6 13 4 8
32 50 25 36
32 26 37 31
29 11 32 24
Total 100 100 100 100
Base (a 11 intervi ews) 389 451 395 1235
72
Table 17
Question 3
Do you think political matters should be left to the government or should people like yourself take
some active part in political affairs
Nairobi Dar-es-Salaam Kampala Total
Left to government 26 24 13 21
People to take an active part 72 72 73 72
Other answers 4 2
Dont know 2 8 3
Refused to answer 2 2
Total 100 100 100 100
Base 389 451 395 1235
73
Table 18
Question 4
Which one of the following do you think our country needs most at the present time more schools more hospitals
more housing more factories or more roads
Nairobi Dar-es-Salaam Kampala Total
More schools 40 44 51 45
More factories 40 37 28 35
More hospitals 17 10 15 14
More housing 1 6 5 4
More roads 2 3 1 2
Don I t know
Total 100 100 100 100
Base 389 451 395 1235
74
Table 19
Question 5
Now which one do you think our country needs most an honest government without corruption a government that gets things done fair distribution of wealth
national unity or individual freedom
Nairobi Dar-es-Salaam Kampala Total
An honest government wIthout corruption 44 38 51 44
A government that gets things done 23 18 17 20
National unity 22 20 17 19
Individual freedom 6 14 6 9
Fair distribution of wealth 5 9 8 8
Don I t know
Refused to answer
Total 100 100 100 100
Base 389 451 395 1 235
75
Table 20
Question 6
Which do you prefer--government ownership or private ownership of major industries
Nairobi Dar-es-Salaam Kampala Total
Government ownership 51 43 38 44
Private ownership 38 38 31 36
Mixed (voluntary answer) 10 18 29 19
Don I t know
Refused to answer - - 1shy
Total 100 100 100 100
Base 389 451 395 1235
76
Table 21
Quest Ion 7
As you know there are many different ways In which African states can establish closer ties among themselves Which of the
following ways would you favor an organization for settling disputes between African governments
closer economic relations political federation African military
organization cultural exchanges
Nairobi Dar-es-Salaam Kampala Total
Favor 94 96 85 92
Oppose 3 3 9 5
Don I t know 2 1 4 2
Refused to answer 1 - 2
Total 100 100 100 100
Base 389 451 395 1235
-Closer economic relations 22 49 53 41
Political federation 26 39 27 31
An organization for settling disputes between African governments 34 32 15 28
An African military organization 15 18 11 15
Cultural exchanges 3 10 3 6
Don I t know
Total 100 149 110 121
Base 366 432 337 1135
77
(8 percent) only 2 percent are Tanganylkans and the Ugandans did
not rate statistically
ELITE OPINIONS AND ATTITUDES
Not only does Scale 1 Table 22 Illustrate a sound basic
knowledge of modern methods to prevent crops from being damaged
It also Illustrates a similarity of knowledge between the three
sample areas which are widely separated geographically Scale 1
will be Invaluable when comparing the results of our first rural
study the field work of which has been completed and Is at the
stage of processing
Table 22
Scale
It does not help much to try to prevent crops being damaged by Insects and diseases such losses can
never really be prevented
Kampala Dar-es-Salaam Nairobi East Africa
Agree 8 12 12 11
Disagree 88 85 87 86
Uncertain 4 3 3
Base 153 156 150 459
Scale 2 Table 23 on page 78 also Illustrates but not
so conclusively similarities between the three areas Nairobi
had 17 percent agree whereas Dar-es-Salaam had only 10 percent
with Kampala somewhere Inbetween One could say therefore that
78
there Is a higher degree of tribalism among the elite of Nairobi
than among the elite of Dar-es-Salaam
Table 23
Scale 2
A man should never marry a woman who does not belong to hIs tribe
Kampala Dar-es-Salaam Nairobi East Af rl ca
Agree 12 10 17 13
Disagree 81 83 80 82
Uncertain 7 7 3 5
Base 153 156 150 459
While Scale 3 Table 24 shows a similarity between the
three areas It shows that the respondents of Nairobi are much
Table 24
Scale 3
People have It within their power to bring harm and misfortune to others through magic
Kampala Dar-es-Salaam Nairobi East Africa
Agree 26 28 30 28
Disagree 45 46 61 51
Uncertain 29 26 9 21
Base 153 156 150 459
79
more sophisticated In regard to magic than in the other sample
points and that fewer are uncertain A significant number In each
area however believe that magic can be used to bring harm and
misfortune to others
Scale 4 Table 25 shows a consensus between the three
areas but shows an over all unfavorable knowledge about science
and knowledge The majority 83 percent believe that many imporshy
tant matters can never be positively understood by the human mind
The question can provide a very useful comparison In changing patterns
of knowledge regarding science In the future
Table 25
Scale 4
Science and knowledge are useful of course but many important matters can never be positively
understood by the human mind
Kampala Dar-es-Salaam Nairobi East Africa
Agree 80 79 86 83
Disagree 9 12 13
Uncertain 11 9 6
Base 153 156 150 459
Scale 5 Table 26 on page 80 shows an unfavorable public
opinion about the role of traditional chiefs and the dichotomy caused
by loss of status in recent years by traditional chiefs whose roles
have been largely taken over by the political appointee of the
ruling party The question will also provide useful comparative
80
data between ruralurban areas and will be useful In the future to
measure changes in attitudes and opinions about traditional chiefs
Table 26
Scale 5
A man ought always to obey his traditional chief
Kampala Dar-es-Salaam Nairobi East Africa
Agree 42 38 45 42
Disagree 42 46 49 46
Uncertain 15 16 6 12
Base 153 156 150 459
Scale 6~ Table 27 not only shows an area of new problems
for East African elite but also the wide divergence of response
Table 27
Scale 6
Government and politics are so complicated that the average man cannot really understand what Is going on
Kampala Dar-es-Salaam Nairobi East Africa
Agree 81 65 72 72
Disagree 16 24 22 21
Uncertain 3 11 6 7
Base 153 156 150 459
81
between the three sample points In Kampala 81 percent agree
with the statement and only 3 percent are uncertain whereas In
Dar-es-Salaam 67 percent agree while II percent are uncertain
The statement will provide a useful measure In future of the attl shy
tude of the elite toward government In each of the three sample
points
Scale 7 Table 28 Is a new problem of Investment and
saving which as you can see has brought out differences between
the three sample points and will provide In the future a useful
measure of changing attitudes toward savings and the postponement
of rewards
Table 28
Scale 7
If I had the choice I would prefer to be given a small sum Immediately rather than be promised a very
large sum one year from now
Kampala Dar-es-Salaam Nairobi East Africa
Agree 62 54 62 60
Disagree 24 37 30 30
Uncertain 14 9 B 10
Base 153 156 150 459
There are other examples above of similarities and dlsshy
similarities which are even better than Scale 8 Table 29 on page 82
It does show however a close correspondence between Kampala and
Nairobi while Dar-es-Salaam shows a more tolerant attitude In
82
their response to this statement Once again the comparison between
urban and rural areas should show an Interesting and significant
difference
Table 29
Scale 8
A womans place Is in the home
Kampala Dar-es-Salaam Nairobi East Africa
Agree 45 36 45 42
Disagree 46 61 51 52
Uncertain 9 3 4 5
Base 153 156 150 459
Scale 9 Table 30 shows significant statistical differences
between the response from Kampala and those of the other two sample
Table 30
Scale 9
The traditional ways of the past are the best
Kampala Oar-es-Salaam Nairobi East Africa
Agree 15 33 33 27
01 sag ree 68 58 56 61
Uncertain 17 9 11 12
Base 153 156 150 459
83
points This fact Is even more Interesting when we know that in
Uganda the present form of government has been designed to maintain
the traditional ways of the past whereas In the other two areas
the present government has been designed to change politically
at least traditional ways The reactions of the Kampala respondents
therefore are a significant Indication of their dissatisfaction
with efforts to maintain traditional ways
Scale 10 Table 31 also Illustrates that Kampala has a
different reaction than the other two sample points although there
are less significant differences between Dar-es-Salaam and Nairobi
Table 31
Scale 10
The present Is all too often full of unhappiness It Is only the future that counts
Kampala Dar-es-Salaam Nairobi East Africa
Agree 29 50 60 46
Disagree 44 27 32 34
Uncertain 21 23 8 20
Base 153 156 150 459
Scale 11 Table 32 on page 84 Is a really significant
Indication of the basic dissatisfaction of the Kampala respondents
with the status quo The dissimilarity was also reflected in
Scale 10
84
Table 32
Scale 11
The government Is doing all It can to develop our country
Kampala Dar-es-Salaam Nairobi East Africa
Agree 51 86 84 74
Disagree 21 5 10 12
Uncertain 28 9 6 14
Base 153 156 150 459
Chapter 5
SUMMARY AND CONCLUSIONS
The purposes of this study were to
1 Analyze the factors which have slowed the economic
development of East African communities
2 Identify the major problems encountered In economic
systems In East Africa
3 Determine the problems in developing the economic growth
of the community
4 Identify economic reconstruction needs
All the published materials listed below were extensively
reviewed The review Included library research over both periodicals
and some relevant studies The writing of this report Is thus based
on the Information provided by the following documents
1 Periodicals books pamphlets mlcroflshe from the
William Allen White Library of the Emporia Kansas State College
2 Xeroxed materials and books that were secured through
the Inter-library loans
3 Report collected by the Marco Survey Ltd Nairobi
4 Periodicals Issued by the Information section of the
Embassy of the Republic of Kenya Washington D C
In order to determine the social and economic problems of
East Africa a questionnaire-Interview method was used In total
85
86
1423 elites were I~ervlewed Approximately 6 percent of the
elites listed for interview refused to be interviewed
The Interviews were conducted by permanent senior research
assistants
The data collected were compiled (using standard codes to
clarify the data and computer cards were punched for BO-column
I C T data processing equipment In Nairobi) summarized and
interpreted
Finally conclusions were reached
SUMMARY
British East Africa was the name applied to the territories
in East Africa before It achieved Its Independence The territories
cover a total area of 682469 square miles which was divided into
three parts Kenya Uganda and Tanganyika They all became indeshy
pendent by 1963
The communities continued economic ties among each other
and on June 6 1967 at Kampala the three member nations signed
a treaty which was to re-establish the community
East Africa enjoys a great deal of economic advantages
l It borders the Indian Ocean which provides a cheap means of
exporting and ImportlDg goods 2 It Is a meeting point for trade
(east and central African trades)
East Africa Is divided Into five geographic regions (which
provide a variety of climates)
1 coast region
2 Nylka region or Savanah region
87
3 East and West Highlands
4 Lake Victoria region
Due to the Influehce of the cultural traditions the subshy
slstance element in East African economics is still dominant This
is evident in most of the rural areas The public sector of East
African community plays a very great part In developing the economy
The public sector Is expected to be major employers In the community
and Is expected to provide free public services--free school free
medical services free or subsidized public utilities and housing
On an average scale the population of East Africa is yet
low A clear study shows this Is not true In some locations which
are densely populated varying from two hundred to five hundred
people per s~ure mile The population In urban cities of East
Africa Is still low and the people do not consider cities to be
their home Details show that the major East African cities have
over 50 percent of all the urban population while the minor cities
are far less than 50 percent of the total urban population
Standardization of East African people Is too difficult
due to the fact that the population Is composed of a variety of
sub-races whose traditions differ from each other among the tribes
The sub-races classified are
1 Nilotes
2 Nilo-Hamltes
3 Inter-cush Ite
4 Bantus
Based upon the sub-races of East African people the traditional
heritage carried frnom one generation to the other makes the economy
88
of the community hard to work In Perhaps even more important on
the economic outlook is the Inheritance of continuing extended
family contrasts In age and sex
The study shows that trading Is an extremely important
economic activity even though it Is not Itself productive The
trade Itudy has shown that trade has been playing a smaller part
in East Africa and for those operating Its economic efficiency is
very low The greatest part of trading activities is located in
the major East African cities This conclusion has led to the fact
that the majority of the people are living In rural areas where
means of traveling to cities are difficult for them and the lack
of money has probably created the situation where people have to
live subsistently
CONCLUSIONS
The conclusions of the survey of literature and the analysis
of findings follow
Survey of Literature
If It Is correct as suggested by Kamark that the economic
lives of rural Africans are not Influenced by environmental conshy
dltlons more than by cultural disposition then this would mean
that the Introduction for new technology should bring about economic
changes relatively unhIndered by cultural conservatlsm1 That
Is to say the potentIalIties of natural resources can be more
IKamark M Andrews The Economics of African Development (New York Praeger Incorporated 1967) p 79
89
effectively tapped by the Introduction of new methods and undershy
standing and new forms of organization of production It may be
objected that this In fact has not occurred In East Africa and
precisely some would say because of limitations of cultural
conservatlsm 11 But closer studies quite strongly suggest that
where people can see the advantages to themselves of economic changes
2that are both feasible and safe then the changes do occur Thus
African people have accepted changes first and most radically (indeed
they have often deliberately sought them) In the more favorable
areas where the possibilities of new technology and new Ideas are
more readily applicable and where people are exposed to external
influences and have access to modern communicatIons and living styles
The type of national economic progress which is to emerge
the longer-term political goals the roots of nationhood In the
multiplicity of subcultures and naturally uneconomical tribal ties
out of which national culture is forged remain the crucial unanswered
questIons whIch affect the economic progress of East Africa
Analysis of Findings
The results of the analysis has shown that the elite of
East Africa have advanced to a more desIrable socloeconomlc way
of thinkIng ThIs conclusion has led the author to suggest that
perhaps the integrating forms of tribes can be worked out beginning
with the East African elite for however much too depends ultimately
on local and tribal support they have more chance to see above
2 Ibid p 98
90
the disadvantages of these functions The middle class is still
small flexible mobile and unstable not yet clearly or acceptably
dlfferentl~ted from strata above or below The mass of unskilled
workers are the most temporary and the least Involved If no efforts
or attempts are applied the society will inevitably continue to
live In their life of ethnically based networks and subcultural
pockets
16
AHdflJ )O 118 18
BIBLIOGRAPHY
Abraham R G East African Townshipl in A W Southhall (eds) Social Change In Modern Africa New York Oxford University Press 1970
Baver P T and B S Ymey The Economics of Under-developed Countries C U P Cambridge University Press 1957
Blacker E A Demography New York Oxford University Press 1948
Ethographic Survey of Africa East Central Africa London International African Institute 1970
Boesch H A Geography of World Economy Van Nostrand Princeton University Press 1964
Brown L H in E W Russell (ed) The Resources of East Africa Nairobi Literative Bureau 1968
Burke G Fred Africanls Quest for Order Englewood Cliffs New Jersey~ Prentice Hall 1964
The Economics of Underdeveloped Countries New York OxfOrd University Press 1972
Cley and P Robson IFederation of East Afrlca11 Structure and Administration of E A C S O New York Oxford University Press 1964
Doob W Leonard Periodic Surveys in Subsaharan Africa Nairobi Nairobi Publishing House 1970
East African Community Annual Report Nairobi Kenya Government Press 1966
Economic and Statistical Review Nairobi The East African Statlsshytlcal Department 1964 _
Encyclopedia Americana East Africa Vol 4 1974
Encyclopedia Brltanlca East African Community University of Chicago Macropedla Vol I II 1974
Goldthrope J E and F B Wilson Tribal Maps of East Africa and Zanzibar Kampala East African institute of Social Research 1966
92
93
Good M Cha~les Jr Dimensions of East African Cultures New York Oxford University Press 1970
Gulliver P H Labor Migration in a Rural Economy Kampala E A I S R 1955
Harlow V and E M Chi lver History of East Africa Vol II Oxford Clerendon 1962
Hawks D A IIEast Afrlca1I Trade and Industry Official Journal of Association of East African Industries Nairobi Nairobi Publishing House 1963
Hopkins Elizabeth IIConflict of Tribal and Racial Conflict in Stanley and Burke (eds) Transformation of East Africa New York Basic Books Printers 1966
Industrialization in East Africa 5th Edition Nairobi United Africa Press 1966
Jamal A H The Critical Phase of Emerged African States Afalrasl East African Publishing House 1965
Johnson B F The Staple Food Economics of Tropical Africa Stanford California Stanford University Press 1970
Johnson D H Rainfall in East Africa Q F R Vol 5 Nairobi East African Publishing House 1968
Jones Carey Geographical Journal Vol 131 Part 2 New York Oxford University Press 1965
Kamark M Andrew liThe East African Community The Economics of East African Development New York Praegam Incorporated 1971
Kenya Chamber of Commerce Trade Nairobi Kenya Government Press 1973 --~
Lewis William Allen The Theory of East African Literature Nairobi Bureau Annual Report 1965-6
Morgan W T W IIEast Africa Its People and Resources II People New York Oxford University Press 1969
Morgan W T W and N M Shaffer Distribution and Density New York Oxford University Press 1970
Myrdel Uninnar An International Economy Problem and Prospects New York Harper 1969
OConner A N An Economic Geography of East Africa New York Preager 1966
94
Oxford Economic Atlas East African Community New York Oxford University Press 1972
Reed Moyer and Hullanderc Stanley Markets In Developing Economies Illinois R D Irwin 1968
Republ ic of Kenya Newsletter Washington D C 1975 Vol 3 No5
Richard A I Economic Development and Tribal Change Nairobi East African Publishing House 1969
Rosberg A and A Segal East African Federation Internatlonal Conciliation 1963
Samson H W The Climate of East Africa Nairobi Memoirs Vol II I No2
Schneider in W R Bascom and M J Herskovits Continuity and Change in East African Cultures Chioago University of Chicago Press 1959
Seggerson E P Physiography of East Africa Nairobi Press 1962
Southhall A W Growth of Urban SocletyI Dar-esmiddotSalaam New York Oxford University Press 1969
The East African East African Common Services Report Nairobi Kenya Government Press 1966
Thompson B W The Climate of Africa Nairobi Oxford University Press 1965
UNESCO Populatlon Movements in East Afrlca in K M Barbour and R M Prethere (eds) Essay on African Population Routledge and Kegan New York Oxford University Press 1961
Walder D Problems of Economic Development of East Africa In E A G Robinson (ed) Economic Development of South Sahara London McMillan 1964
Warren J Keezan International Marketing Less Developed Countries Englewood Cliffs New Jersey Prentice Hall Incorporated 1974
Wilson A M Social Change In Modern Africa New York University of Oxford Press 1961
Wilson M Gordon liThe Transformation of East Africa Basic Scale for Periodic Research New York Basic Books Printer 1971
S6
XION3ddf
bull
96
URSAN CENTERS
- bullbullbullo1
IL RUdDIf---J -
( L KENYA I
I I I
hlo10bull I I J
- Tllo
Tflgflylfl
-Dodo TAN3ANYllltA
It
bull Imp ~1 bull
JII
~ ~t - bullKlIer
~ ~ JIOlJLAIO
~ ~~ ~ (0 C~CV ~oo Lindl ~ a CO (1(( 00(tOO
c ~tCC a oocmiddot ~~ L Ny ~tWllra1 c ~~(V( 0 ~J(JC~ ~ l(l~5 7~ ~~~~ i~j~) ~J r =X 0 1 ~O _-A- J 0 100 bull - -
mil bull~~ ~__-- _ llo
l6
bull
o
MII bullbullbullbullbullbull bullbullbullbullbullbulll1li bull bull ~ =
middot1
bullbullbull bullbull~ pound
-w
)
umiddot~middot middotmiddotMI
c
gt amp c o
ImiddotUmiddotmiddot middotmiddot0 L
1 bull l
)
L
~
middotmiddotmiddotmiddot1 L
~
~
1 ~
~ ~ I ~ L ~
i 1 middotmiddotmiddotrmiddotmiddotI bull bull ~
I r j L
-r Y
I~ bull CL -J II w 1
VINVZNVl
eII_
fbullbull bull~1
~ r
z
c
o
11Ie
) 11111_0 -shy
N a n s
~______
middot~middot(1 -bullbull
__rr~)
I
I
I I I
~ I ~
I I I ~ I
vaNv~n
66
o
1 IIit
c
Cl
S iII III J
Ibullbullbull middot1t-11 1 114bullc ~~1
bull
001
INZN1L
10 l
r
01 bull 1middot ) l pltllI1 -tpn I I c
o
z
o
bull
J I
lt
- Njoroge 1975
- Njoroge 1975 pt2
-

Chapter
2
v
Page
Settlers 6
Shillings 6
Swah i 1i bull 7
t1ETHODS OF PROCEDURE 7
PLAN OF STUDY bull bull bull bull bull bull 7
THE REVIEW OF RELATED LITERATURE 9
EAST AFRICAN GEOGRAPHY 11
Regional Survey bull 11
The Nyika Plateau 12
Lake Victoria Basin 15
THE ECONOMY middot 15
Subsistence Economy middot 15
The Public Sector bull 16
Excessive Expectations for Publ ic Service 17
POPULATION DISTRIBUTION 19
Urban Population 21
PEOPLE 22
The Tribal Classification 24
HistorIcal Clusters bull 25
AFRICAN HERITAGE 26
The Extended Family bullbullbullbullbullbullbullbull 27
THE ECONOMIC ACTIVITIES OF EAST AFRICA 30
THE DISTRIBUTION OF TRADING ACTIVITY 32
Na i rob i bull middot 32
Mombasa 35
Dar-es-Salaam 36
Chapter
3
4
5
vi
Page
Kampa 1a bull bull 37
Others 37
~OMMUNICATION ACTIVITY 38
Rail Transportation 41
Sea Transportation 42
Air Transportation 42
CQmmunlcation Media 43
SUMMARY bull bull 43
DE~IGN OF THE STUDY 45
lAST AFRICAN ELITE 45
URBAN ELITE OPINION bullbullbullbullbullbullbullbullbullbull 48
OPINIONS AND ATTITUDES bullbullbullbullbullbullbullbullbullbull 50
ANALYSIS OF DATA bullbullbullbullbullbullbullbullbullbullbullbullbullbull 52
The Education Factor 55
Country Where Education Was Obtained 58
The Factor of Religion bullbullbullbullbullbull 60
The Factor of Voluntary Association bullbull 63
The Tribal Factor bullbullbull 65
ELITE OPINIONS AND ATTITUDES 77
SU~MARY AND CONCLUSIONS bullbull 85
SUMMARY bull bull bull 86
CONCLUSIONS 88
Survey of Literature 88
Analysis of Findings 89
BIBLIOGRAPHY bullbullbullbullbullbullbullbull 91
APPENDIX bullbullbullbullbullbullbullbullbullbull 95
LI ST OF TABLES
Table Page
1 Mean Population Estimates Per Space Land (1968) bull bull 19
2 The Distribution of the African and the IINon-Afrlcan In Proportion by Cities 1968 bull bull bull bull 23
3 Transportation In East Africa (1963-73) 40
4 Co~municatlon Media (Thousands) 1963 43
5 Ea~t African Elite Age Factor By Percent 53
6 Ea~t African Elite Occupation Factor Sample by Percentage Distribution bullbullbullbullbullbullbullbullbullbullbull 54
7 East African Elite Specific Occupation Factor by Percent bull bull bull bull 56
8 East African Elite Education Factor By Percent (1972) bullbull 57
9 East African Elite Where Educated bullbullbullbull 59
10 Ea~t African Elite Religion Factor Compared to Population Percentage bullbullbullbullbullbullbull 62
11 East African Elite Voluntary Associations Factor By Percent 64
12 Tanganyika Elite by Tribal Group 66
13 Ugand3 Elite by Tribal Group 68
14 Kenya Elite by Tribal Group bullbull 69
15 Question 1 What in your opinion is the most Important problem facing our country at the present time1 70
16 Question 2 All things considered how satisfied are you with your present standard of llvlng--very sati~fied fairly satisfied somewhat dissatisfied
71or ~ery dissatisfied bull bull bull bull bull bull bull bull bull bull bull bull bull bull bull bull
vii
viii
Table Page
17 Qupstion 3 Do you think political matters should be left to the government or should people like yourself take some active part in political affairs 72
18 Question 4 Which one of the following do you think our country needs most at the present time more schools more hospitals more housing more factories or mere roads bull bull bull bull bull bull 73
19 Qu~stion 5 Now which one do you think our country fleeds most an honest government without corrpution ~ government that gets things done fair distribution of wealth national unity or individual freedom 74
20 Question 6 Which do you prefer--government ownership or private ownership of major Industries bull bull bull 75
21 Question 7 As you know there are many different ways in which African states can establish closer ties amoog themselves Which of the following ways would you favor an organization for settl ing disputes b~tween African governments closer economic relations political federation African military organization cultural exchanges 76
22 Sacle 1 It does not help much to try to prevent crops being damaged by insects and diseases such los ses can neve r rea 11 y be preven ted bullbull bull 77
23 Scale 2 A man should never marry a woman who does not belong to his tribe 78
24 Scale 3 People have it within their power to bring harm and misfortune to others through magic 78
25 Scale 4 Science and knowledge are useful of course but many important matters can never be positively understood by the human mind bull bull 79
26 Scale 5 A man ought always to obey his traditional chief 80
27 Scale 6 Government and politics are so complicated that the average man cannot really understand what is going on bullbullbullbullbull 80
28 S~~le 7 If I had the choice I would prefer to be given a small sum immediately rather than be promised a very large sum one year from now bull bull bull bull bull 81
ix
Table Page
29 Scale 8 A woman IS place is in the home bullbull 82
30 Sccle 9 The traditional ways of the past are the 82best
31 Scale 10 The present is all too often full of unhappiness it is only the future that counts 83
32 Scale 11 The government is doing all it can to develop our country bullbullbullbullbull 84
Chapter 1
INTRODUCTI ON
East Africa (Kenya Uganda Tanzania) is a land of great
variety (covering 683000 square miles) in physical features clishy
mate human type economic development and political evolution
al ike There are few places on earths surface ~here in the space
of a few hu~dred miles one can experience such a range of conshy
trasts O~e can pass from high mountain snow to the deepest lake-
filled troughs alive with tropical vegetation from the invigorating
climate of the highland areas to the dusty heat of rift valley (one
hundred to two hundred miles wide) or from bustling modern cities
to countrysid~ There are great differences in trade activities
from one area to another Finally there are in East Africa
conflicts of triLal and racial interests present in all parts of
the continent and great contrasts in the types of states which
have emerged from the race of independence 1
Politically with the exceptions of Ruanda and Burundi
Somalia Ethi~pia and Zambia the territories have been under Britshy
ish rule for many years and Engl Ish is the official language Most
of Kenya was a crown colony except the coastal strip which was a
lEI izabeth Hopkins Conflict of Tribal and Raciai Conshyflict in Stanley and Burke (eds) Transformation of East Africa (New York B~sic Books Printers 1966) p 375
2
protectorate while Tanganyika was administered by the British
under Uni~ed Nations trusteeship2 The British territories have
enjoyed common markets and certain services such as publ ic comshy
munications administered by East African Common Services today
known as the East African Community
East Africa is the meeting point for all the contlnents
major 1ingJistic groups Even Cl ick Language is represented
in Central Tanzania The three greatest sub-races (of African
origin) ar~ the Nilotics Nilo-himites and the Bantus 3
THE PROBLEM AND DEFINITIONS OF TERMS USED
Statement of the Problem
This study was designed to
1 Analyze the factors which have slowed the economic
development of the East African community
2 Identify the major problems encountered In economic
systems in East Africa
3 Determine the problems in developing the economic growth
of the comm~nity
4 Identify economic reconstruction needs
2Cloey and P Robson Federation of East Africamiddot Structure and Administration of E A C S O (New York Oxford University Press 1964) p 37
3W T W Morgan lEast Africa Its People and Resources People (New York Oxford University Press 1969) p 33
3
Importance 0f the Study
The economy of the East Africa community Is growing at a
high rate as projected yet the majority of the citizens of the
community remain on the poverty level In order to explain this
paradox we will look at the problems tending to withhold economic
success from many members of the community
Limitatlo~s of the Study
The study has the following limitations the data in
this study are limited to that available at the William Allen
White Library at Emporia Kansas State College and through their
facilities through interlibrary loans As Indicated in much of
the relevant data surveyed much of the available material is not
current 4
Assumptions
Certain assumptions underlie this study These assumptions
can be summarized as follows
1 The environment in which the desired economy operates
is such t~at the beneficiary does not readily appreciate the value
of change and thus lacks interest in It
2 The East African citizen is suspicious of accepting
the change to more progressive socioeconomic standards
4
DEFINITIONS OF TERMS USED
Arusha
The capital city of East African Community (1967 Declarashy
tlon)5
Dar-es-Salaam
Capital and largest city in Tanzania It is also one of
6the chief port cities of East Africa
Duka
Small shops normally operated by a single family7
E A C or Eo A
Abbreviation for East African Community Is an economic
organizaticn consisting of three member countries of Kenya Uganda
and Tanzania (associate members include Zambia Ethiopia Somal ia
and Burundi) The existing community is based on a treaty signed
in Kampala on June 6 1967 to preserve and re-establish a large
part of the corporative relationship that was disappearing 8
5A W Southhall Growth of Urban Society Dar-es-Salaam (New York Oxford University Press 1969) p 483
6 Ibid p 481
7J bull Keezan Warren International Marketing Channels Less Develo ed Countries (Englewood Cliffs New Jersey Prentice Hall Incorporated 197 p 309
8Andr~w M Kamark liThe East African Community The Ecoshynomics of African Development (New York Praegam Incorporated 1971) p 5C
5
Gazetted Township
Go~ernment official papers classifying towns population
by residenc~9
Great Rift Valley
Geologically this structure is called a Ilgra ben 1I This
valley exte~ds as a series of depressions from Syria through the
Dead Sea (the surface is nearly 1300 feet below sea-level) to
Africa In East Africa It divides into two branches western
and eastern Igneous activities and volcanoes are associated with
the rift valley forming such peaks as Kllimanjaro these are now 10
dead
Kampala
Th~ capital and the largest city in Uganda It was made
the capital In 1962 when Uganda previously a British protectorate
bull d d IIbecame an In epen ent nation
Municipalities Grade A amp B Townships
Gr~de A -- Municipal towns these towns have populations
above sixty thousand
Grade B -- Townships under local government authorities
12Normally these towns have populations below sixty thousand
9Rbull ~ Abraham IIEast African Townshipl In A W Southhall (ed ) Social Chane in Modern Africa (New York Oxford University Press 197D) p 33
lOE P Seggerson Physiography of East Africa (Nairobi Na I rob I Pless 1962) p 10
Ilsouthhall op cit p 477 12Abraham loc cit
bull 6
Nairobi
The capital and the largest city In Kenya with a population
13nearing one million people according to the 1971 population census
Non-African
A resident who is an Immigrant from other continents besides
Africa The majority of Non-Africans are Europeans and Asians
(Indians)14
Pound
East African sterling currency (Pound~) 1 ~ bull shs 20
Equivalent to $28 u S currency 1975 15
Settlers
European immigrants farmers to the East Afrlca 16
Shillings
East ~frican sterling currency (shs) shs 20 z l~ 17
13Southhall op cit p 469
14Abraham loc cit Non-Africans comprise people (male or female) of European or American origin Arabs Indians and Far East Asians
15K~nya Newsletter issued by Section of Embassy Republic of Kenya Jashington D C Vol 3 No5 (1975) p 28
16Ellzabeth Hopkins IRacial Minorities in British East Africa in Stanley and Burke (eds) Transformation of East Africa (New York Basic Books Printers 1966) p 87
17Kenya Newsletter loco cit
7
Swahili
A language of the coastal population of East Africa roughly
from Southern Somalia to Mozanlbique and including Zanzibar and
the Comoro Islands It Is spoken by about 15 million people as
a first langu~ge this includes the people In East Africa and
Congo (Klns~asa)18
METHODS OF PROCEDURE
All the published materials listed below were extensively
reviewed Thl~ included library review of both periodicals and
relevant st~dies The writing of this report is thus based on
the Information provided by the following
1 Periodicals books pamphlets and microfilm from the
William Allen White Library of the Emporia Kansas State College
2 Xeroxed materials and books that were secured through
the inter-library loan and from friends
3 uata collected specifically for use In this study by
the Marco Survey Ltd Nairobi Kenya
4 Periodicals Issued by the information section of the
Embassy of the Republic of Kenya Washington D C
PLAN OF STUDY
In the preceding section the purpose of this study Its
importance the limitations assumptions definitions of terms
18Encyclopedia Americana Swahili Vol 26 (1974) p 85
8
and methods of procedure have been outlined Related literature
largely stu~ies of structure with regard to economic development
in East Africa is presented in Chapter 2 Chapter 3 presents a
background of pertinent economic facts concerning East Africa
Chapter 4 deals with an analysis of factors In Chapter 5 the
data is summarized and conclusions are drawn
Chapter 2
THE REVIEW OF RELATED LITERATURE
British East Africa was the name applied to the territories
In East Africa before they achieved Independence The territories
Included the ~olonles and the protectorate of Kenya the United
NatIons trust territory of Tanganyika and Uganda These territories
had a total area of 682469 square mlles l British East Africa was
economicalya system of joint services The East Africa High
Commission which consisted of the Governors of Kenya Tanganyika
and Uganda was responsible for the administration of public services
and functions common to territories including currency roads
customs apd communications Each territory1s government retained
responsibility for local services such as health education and
police 2
After World War I I nationalist feeling was strong throughout
British East Africa As the deadline for Independence approached
Britain attempted to form a federation of East Africa but separate
nationalist aspirations made this Imposslble 3 Tanganyika was the
IEncyclopedla Americana East Africa Vol 4 (1974) p 578
2East Africa Geographical Journal Vol 129 Part 2 1963 pp 140-155
3Abull Ro~berg and A Segal East African Federation IIlntershynational Concll iatlon11 1963 p 30
9
10
4first of the four territories to achieve Independence In 1961
Uganda became independent In- 1962 The following year Kenya and
Zanzibar entered the ranks of Independent states Tanganyika and
Zanzibar merged In 1964 and adopted the name United Republic of
Tanzania 5
After Tanganyika became Independent the East African
High Commission was suceeded by the East African Common Services
Organizatior which performed the same functions as its predecessors 6
Finally the East African Common Services became the East AfrIcan
Community The East African Community was formed to establish a
customs union to facilitate the industrial development of the
area and to carryon research activities and common services preshy
vlously controlled by the East African Common Services organization
The community was re-establlshed by a treaty signed by three member
nations In Kampala Uganda on June 6 1967 7
The community provides for free intercommunity trade and
a system of c~nmon external tariffs there Is also a system of
transfer tnxes that may be Imposed on certain commodities Imported
from other members by a country with a trade deficit wIthIn the
other two members Transportation and communications services
are handled by community corporations for raIlways harbors post
4 Ibid p 8 5 IbId p 12 bull
6Encyclopedia Britanlca East African Community University o~ Chicago Macropedia Vol I I I (1974) p 754
7The East African East African Common Services Report (Nairobi Kenya Government Press 1966) p 3
I I
and telecommunications and alrways8 The East African Development
Bank established in 1967 provides and emphasizes projects that
tend to make the three economies complementary9 Although all
three countries contribute on an equal basis to the bank Kenya
the most advanced receives a smaller share of Investments and
guarantees In accordance with the policy of even development among
the states
East Africa is also the meeting point for all the continents
major linguistic groups Even Click Language l is represented in
Central Tanzania
EAST AFRICAN GEOGRAPHY
Regional Survey
East Africa borders the Indian Ocean for about eight hundred
miles and the coastlands form a very distinctive zone although
the plain Is only one hundred miles wide around the Kenya and
Tanzania border IO Winds from the ocean bring a high ralnfal I
to most of the land close to the coast This fertile land Is quite
densely populated The rainfall drops quite rapidly Inland and
land quickly becomes arid and sparcely populated As one travels
from the Iterior towards the coast the change from scared bush
to forest is evident
8 Ibid p 9
9East African Community Annual Report (Nairobi Kenya Government Press 1969) p 38
IOCharles H Gpod Jr Dimensions of East African Cultures (New York Oxford University Press 1970) p 8B
12
Some of the special characteristics of the coastland stem
from the fact that many people have approached them from the sea
and have ~ot penetrated far inland Although most of the population
is African there is a substantial Arab settlement in sharp contrast
to the rest of East Africa Mombasa Is an old town (see map of
East African cities on page 96) Dar-es-Salaam and Tanga are not
These three cities are distinctive In that through them passes
most of the foreign trade of East Afrlca ll This tends to quicken
the pace of economic activities there although In the whole zone
the high temperature (high humidity) resulting from the low altitude
tends to slow It down
The coastal zone Includes the islands of Zanzibar and
Pamba and Mafia together They constituted a separate state for
middotover one hundred years until they joined with Tanganyika to form
anew state of Tanzania in 1964 12
The Nyika Plateau
Away from the coast the land rises fairly gently to flat
plateaus covering between 3500 to 5000 feet above sea level
known In some areas as Nyika (Swahili for wilderness) This is
an area of short rainfall poor scrub vegetation and very sparce
13population separating richer lands In the Interior from the sea
llA M Wilson Social Change In Hodern Africa (New York Oxford University Press 1961) p 35
12Carey Jones Geographical Journal Vol 131 Part 2 (New York Oxford University Press 1965) p 186
lnE P Seggerson Physiography of East Africa (Nairobi East Africa Publishing House 1962) p 10
13
It is broken by mountain ranges notably Usambara and Pare mountains
Taita h1115 where relief brings about a higher rainfall and where
more people have settled Further south it is broken by a zone
of lowland in the basins of the Ruaha and Rufingi rivers where
settlement Is discouraged by periodic floods and disease rather
than by low r3infall Water scarce in East Africa is abundant
there and cen be controlled This area offers promise for future
agricultural development In the south of Tanzania the plateau
reappears but the rainfall exceeds thirty inches in most years
and much of the land is under cultlvatlon 14 The rainfall Is
unreliable soil is poor and the area is remote from central
economic life in Tanzania 15
Th~ highland south of the Nylka has recent volcanic rocks
It stands up as highlands reaching to 19500 feet including
KilimanJaro Mt Kenya and Elgon (see map on page 14) From the
land over seven thousand feet above sea level it extends three
hundred miles westward almost to the shore of Lake Victoria Although
It Is brokpfl by the lINorth Rift Valleyll (not shown in the map)
the floor of which in places lies six thousand feet below the land
to either side 16 In this highland heavy rainfall and fertile
volcanic soils provide excellent conditions for agriculture Much
14gt H Johnson Rainfall in East Africa Q F R Vol 5 88 (Nairobi East Africa Publishing House 1962) pp 1-9
IS ibid p 10
16Seggerson Ope cit p 10
ofx-----_ - -~~ -----------~
QOO 000 ~I)
-==----=-----shy
~ )00 -OOOt
Wi~Z1 ~ OOOt -0001
u
o
z
o
15
of the land Is under cultivation but the fruit of this agricultural
production is offset by the dense population 17
Lake Victoria Basin
The land falls slightly northward from the central plateau
of Tanzania towards the Lake Victoria Basin and the densIty of
the population is increased greatly The Basin is one of the
richest zores of East Africa supporting over a quarter of the
population of the regIon The country receives more rain and
has more fertile soil than that to the south and advantage has
been taken of its agricultural opportunities The land around
the lake in some ways forms a single unIt although it is divided
among the thr~estates This region Is densely settled by farmers
who produce much cotton as well as animal food crops also bananas
(Uganda) a~d coffee providing a green landscape all year around 18
THE ECONOMY
Subsistence Economy
In terms of the actIvity of an average East African man
or woman the subsistence element in East African economies is
probably still domlnent 19 That is to say the amount of time
the average East African spends on activities that merely keep
17w T W Morgan and N M Shaffer Distribution and Density (New York Oxford University Press 1966) p 36
18 Ibld p 38
19~ F Johnson The Sta Ie Food Economics of Tro ical Africa (Stanford Californ a Stan ord UnIversity Press 1970 p 142
16
him alive ana functioning is greater than the amount of time he
spends ear~ing discretionary income The average East African
is more in than out of the subsistence tribal economy20 He produces
most of the goods and services he consumes
The permeation of the money economy throughout Africa not
only has considerable importance in Its own right but will influence
the whole pace of economic development In the future It is almost
impossible for anyone who has not lived in a subsistence economy
to appreciate how profoundly it affects ones activities and outshy
look To live in a subsistence economy means to live a hand-toshy
mouth existence in a world of great risk and uncertainty Without
the techniques or facilities for storage of food over any appreciable
period the East African is dependent on the yearly crop or his
luck In hunting or fishing Nearly every people have a hungry
season ll when the 1ast season I s crop has been eaten and the new
crop has not yet come In The risk and uncertainty affecting a
whole community is less with the spread of the money economy
because It is possible for individuals both to create a margin of
security for themselves by setting aside a permanent store of value
In the form of money and to survive apart from the communlty21
The Public Sector
From a comparatively late point In the development of East
Africa the government role in the economy was a major one The
private investments and the stimulation of production was encouraged
20 Ibid p 151 21 Ibid p 147
17
by the gov~rnment The corollary of this Is the continuing imporshy
tance of the government as employer and of the publicly owned
sector generally in the national accounts
In East Afri ca Ilcurrent government expend i tures run over
15 percent of the gross national expenditure 1I22 If one adds the
operations of the railway electricity authorities ports etc
and the investments in the whole part public sector the total
approaches Hone-third of the gross domestic product-II Together
they are therefore the dominant economic influence in the money
economy of East Africa 23 Many East Africans expect the state
or public agency to be their employer This has the effect of
reinforcing o~e of the worst heritages of colonialism--the East
Africans arceptance of the idea that the best job to have is a
government post
Excessive Expectations for Public Service
The paternalistic attitude of colonial administration
particularly after World War II also left behind the habit of
expecting co~siderable benefit from free public services--free
schools iree medical services free or subsidized electricity
and subsidized housing 24
22Enclc loped ia Amer icana East Afr ica Vol 4 (1974) p 576
23 Ioid p 577
24Abull H Jamal The Critical Phase of Emerged African States (Afairasi East African Publishing House 1965) p 101
18
The colonial government provided most of this for East
Africa1s cities--usually at the expense of the lIagr icultural popushy
lation I But with the growth of the cities and the legitimate
pol itical de~and for the expansion and extension of these services
throughout the land it becomes financially impossible to maintain
them on the uneconomic basis of the past It is also economic
nonsense to consume resources In subsidies rather than use them
for economic development 25
Thr~ughout the world pressure for such services Is present
The way it is kept in line with what Is economically feasible Is
either to charge the economic price or to hand over responsibility
for the services to the local government concerned in which case
the citizens can make a choice between paying higher taxes or using
26the money for other purposes But with the usual East African
centralization of responsibility for these services in the national
government this economic calculus does not occur so Immediately
and directly Pressure for the services thus tends to lead the
East African governments constantly to Increase their expenditures
for them and to give lower priority to other investments that might
In fact re~ult In faster growth of the national income 27
25Ibid bullbull p 129
26 1bid p 159
~~ 71bid p 179
19
POPULATION DISTRIBUTION
Accorciing to the mid-year population estimates for 1968
the population of East Africa was 268 mllllon 28 Based on the
total land area of 642252 square miles mean populatIon density
of forty-two persons per square mile is obtained When compared
with the m~jor countries of Europe and Asia the mean population
of East Africa is very low According to the 1961 census India
had a total population of 438 million on an area of 126 mil lion
square miles with a mean population density of 319 persons per
square mile 29
Table
Mean Population Estimates Per Space Land (1968)
Estimated Total Land Area Population Mean Population
(Square Mi les) 1968 Per Square Mile
Kenya 219789 9104000 41
Tanzania 342171 10325000 30
Uganda 80292 7367000 92
Regional Population
The population of East Africa may be broadly divided into
three main categories first those around the shores of Lake
2EOxford Economic Atlas East African Community (New York Oxford University Press 1972) pp 174216 and 221
29lbid
20
Victoria ~econd those In the highlands country and In the footshy
hills of the major mountains third those in the coastal belt 30
Lake Victoria Is ringed on almost all sides by areas of
dense population In Tanganyika the lake and west regions which
surround the southern half of the lake comprised in 1967 a popushy
lation of some two and a quarter million over a quarter of the
total popuialon of Tanganyika although the land area formed only
one-eleventh of the countrys total On the north-western and
northern side of the lake the Masaka Mengo and BU50ga districts
of Uganda contained in 196B two and one-half million people
Finally on the north-eastern side Luo country in the Nyanza Province
of Kenya likewise showed In 1968 comparable densities of over two
hundred persons per square mile 31
In the group of the mountain areas we must include the
thickly populated districts of Central Province of Kenya where
the Kikuyu Embu Meru land units cluster In some districts popushy
lation densities range to two hundred to five hundred persons per
square mlleo North Nyanza and around the slopes of Mount Elgon
have densl~ies varying from three hundred to five hundred per square
mile whil~ on the western side of the mountains Uganda districts
have similar densities of between two hundred to three hundred
persons per square mile In Tanzania the category of thickly
populated mountainous regions includes the southern slopes of
30w T W Morgan and N M Shaffer op cit p 29
31Ibid p 27
21
Kilimanjaro ard Mount Meru and Livingstone Mountain in Southern
Highlands 32
The coastal belt consisting of a strip of low lying country
constitutes o~r third region of highly populated density This
area has beell subject to substantial immigration The population
was attracted not only to coastal cities but also by the large
sisal and sugar industrial plants oil refinery and shipping labor
which have drawn immigrant labor from all parts of East Africa 33
Urban Population
Precise international comparisons tend to be vitalized
by the fact that the destination of urban population varied from
country to country and from census to census It Is also true
that urbanization of the population of East Africa is extremely
low
In the Tanzania census of 1968 thirty-three Igazetted
townships were defined which comprises an aggregate population
of 664072 persons of all races or 51 percent of the total popushy
lation of the country34 Of this population over a third were
In Dar-es-Salaam (228742) and Tanga (138053)
In Uganda the census of 1968 contained as gazetted townshy
shlps those which comprised an aggregate population of 409075
32Seggerson Ope cit p 138
33lbid p 139
34Rbull G Abraham East African Townshlp In A W Southhall (ed ) Social Change in Modern Africa (New York Oxford University Press 1970) p 300
22
persons of all races or 2 percent of the population of the country35
Of these over one-third consisted of the populations of Kampala
and Jinja For the purpose of the Kenya population census urban
areas were divided into four categories municipalities grade
A townships grade B townships and trading centers 36 Not all
trading centers were defined as separate census areas and when
the results of the census were obtained it was found that several
of the grade B and even some of the grade A II had such small
populations that they could scarcely be regarded as towns in the
normally accepted meaning of the word The author therefore
defined urban areas as towns with a total of over two thousand
people There are approximately thirty-four towns of over two
hundred population
PEOPLE
It is difficult in the tradition of great social and cultural
diversity to distinguish East Africa by tribe but it Is very
difficult to give definitions of units that will accommodate the
wide range of factors Clearly tribe has reference to a distincshy
tlve group of people that possess the heritage of a common culture
lithe total of their forms of social organization historical trashy
ditions la~ and customs value and beliefs 1I37
35Ibid p 310 36 Ibid p 312
37w T W Morgan East Africa Its People and Resources People (New York Oxford University Press 1969) p 34
23
ThuD it is necessary to be somewhat arbitrary in disshy
tinguishing the various people of East Africa The term tribes
has the same sort of imprecise usefulness difficult to define
specifically as the term c lass in western industrial ized
countries 38 The late Dr Leaky (archeologist and sociologist)
classifies East African people into three distinctive parts
They are broadly classified on III inguistic and traditional basis ll
I into Nllotes Nilo-hlmites and Bantus 39 Such distinctions are
i 1 1 Table 2 1I The 0 1st r ibut ion of the Af r ican and the IINon-Af r ican ll
I in proportion by Cities4 1968 0
I 1 1
Country African INon-Afr Ican ll
Tanzania 4 1 721
Uganda 30 850
Kenya 53 850
very adequa~e to the actlvltes and interests which are of concern
to the people themselves in their ordinary lives For example
the Luo (nilotic) with their communal living society and with a
mixed economy of agriculture do not resemble the Masai (nlloshy
hlmltes) with their pastoral economy who are non-farmers they
~ 38 10 id p 36 39Ibid p 38
4UR G Abraham op cit p 318 IINon-African ll comprises people (male or female) of European or American origin Arabs Indians and Far East Asians
24
do not eat sea food The Bantus In East Africa (found mainly on
the southern hemispheres of Africa) have an exceptionally wide
range of cultures and economic systems 41
The Tribal Iassification
The term East African people identifies about 11110 different
people in the mainland Tanzania about 35 in Kenya and about 37
In Uganda42 Of these five comprise over a million people each
forty-threp exceed one hundred thousand people The smallest
tribes contdln only a few hundred people but their culture intershy
mediate zo~es are generally between one and another 43 Blackers
book of East African lIdemography provides an adequate overall
account of the traditional culture and social system of perhaps
thirty of these tribes 44
A number of larger and Important tribes remain still
undescribed by modern standard needs Published studies of social
and economic changes In recent decades are fewer even for those
people such as Kikuyu and Chagga where change has been most
radical Most books dealing with the traditional cuiture of East
African people were written many years ago and are not reliable
41Morgan Ope cit p 40 42 1bid p 36
43E A Blacker lIDemographyl1 (New York Oxford University Press 1948) p 43 The best general surveys of available Inforshymation are contained In the volume of the lIEthographic Survey of Africa (East Central Africa) 11 (London International African Institute 1970) p 70
441 bId p 79
25
guides for the study of people of East Africa in the second half
of the twentieth century
Historical Clusters
Although some tribes remain as little more than names on
the enthographlc map It Is possible to group the better known
people Into clusters which are identifiable In terms of common
historical traditions linguistic similarities and certain related
social Institutions and values As far as present knowledge goes
the following clusters are fairlyclear Only the larger tribes
are indlca~ed In the lists
Tribal names are given in their root forms
(a) Nilotes--Acholi Alur Lango Luo Padhola (b) Nilo-Hamites--(eastern Nilotes)
1 Teso Cluster--Karamojong Teso Turkana 2 Kalegln-Elgeyo Kipsiqis Nandi Tuqen 3 Masal Cluster--Arusha Masal Samburu 4 Tatoq Cluster--Barabalg
(c) Inter-custrlne Bantu--Ganda Ha Haya Klga Nkole Njoro Rundl Rwanda Soya Toro
(d) Elgon Bantu--Aisu Lugya (e) North Eastern Bantu--Chagga Embu Gusli (kissl)
Kamba Kikuyu Meru Mbere (f) Coast Bantu-Bondei Olgo Mljikenda Sambaa Zigua (g) Nyamwezi Cluster--Bena Hehe Sangu (h) Luguru Cluster--Kaguru Luguru Ngru4(I) Rouma Cluster--Makinde Makua Mawia 5
In no case are all the people of a cluster identical In
their econOOlic system In terms of their traditional economic
systems and the exploitation of the natural resources a more undershy
standable classification can be made In the following way
45 1bId p 15
26
A Primary Pastoral Economy with little or no agrlculture-shyBarabaig Boran Masal Redille Saburu Somalia Pastoral suk Turkana
B Mixed Pastoral and Agricultural Economy I Pastoral Ism predominant--Aogo Karamojong Klpsiqis
Kuna Nandi 2 Agriculturalism predomlnant--Arusha Bela Klssl
Ha Hehe Iraqw Iramba Kamba Lango Luqbata North Luhya Luo Njakjusa Padhola Rangl Hlgland Suk Sukuma Teso Tugen Turu
C Mainly Agricultural Economy with minor pastoral Interests--Acholl Alur Chagga Embu Alsu Kikuyu Nyoro Sambaa Toro
D Primary Agricultural Economy with little or no husshybandry--Digo Ganda Haya Klga K~gjO Makua Ngorl Ngindo Nyanwaz Soga Yao Zaramo Zlqua
There have been great basic changes that have occurred in
the last two decades toward a greater development of agricultural
Interest slight disappearance of tribal territories (traditions
of belief) due density Increasing demand for cash income and
greater att~nton to crop production husbandry by government and
47commercial concerns
AFRICAN HERITAGE
In general African cultural social background relevant
to economic development is very different from that of any other
developing region of the world Because of Africas geography
great size and climate It was after 1900 that the Influence of
the rest of the world began to reach most of Africa South of
Sahara 48
46 I bid p 2I bull 47Morgan Ope cit p 36
48~ K~ Schneider In W R Bascom and M J Herskovlts Continuity and Change In East African Cultures (Chicago University of Chicago Press 1959) pp 144-167
27
Perhaps there is a need to break the old African tradishy
tional heritage that Is passed to modern Africa A study of the
old African economy shows that it was one In which the methods of
production were simple and the units of production were small
The mlddle-nlen were both hated and Indlspensible Agricultural
progress was seriously impeded by the perpetuation of communal
right-over land 49 Chronic underemployment was one of Its basic
problems and despite moral exhortations among the people the
propensity to save was low It was an economy heavily dependent
on foreign sources for improved Industrial and agricultural methods
and to so~e extent for capital 50 The ambitious young men often
preferred careers In the professions and government service Men
here wrongly pinned their hopes on industrialization and economic
nationalism to absorb Its growing population Industrialization
was slow to come and the blessing of economic nationalism proved
to be mixed 51
The Extende~ Family
Perhaps even more Important than economic outlook both
positively and negatively Is the Inheritance of the continuing
strength of the tribal ties to which nearly all East Africans are
subject To begin with one must consider the L1neage Systems
49bld p 152
seA I Richard Economic Development and Tribal (Nairobi East African Publishing House 1969) p 78
Change
51lndustrlallzatlon In East Africa 5th Edition by United Africa Press Natrobl 1966 p 87
Published
28
or extended familyll--under which an individual has deep ties with
and feels obligation to a large number of people beyond the nuclear
family of the fathers mother and chlldren 52 Good fortune is
shared with m~ny others and In crisis one Individual can calion
help from many others
UnfCrtunately in terms of potential economic development
the extended family has many drawbacks It tends to discourage
Individual enterprise and Initiative as the burden of family
53obligations rise with the degree of an indlviduals success
There are other drawbacks Family crises tend to prevent
accumulation of capital or drain away the discretionary purchasing
power 54 The people with small incomes find it hard to comprehend
the greater cost of living of individuals with higher incomes
The age structure for the East African population is sigshy
nificant for as In most underdeveloped countries a large proshy
portion of the population is not of working age 55 Children of
fourteen years or under account for about 45 percent of the total
population which is comparable with the figure for Nigeria or
Brazil and in East Africa many children assist in picking cotton
or herding cattle Nevertheless productivity Is generally far
lower than that of adults and as increasing numbers of children
52UNESCO 11Popuiation Movements in East Africa in K M Barbour an~ R M Prethero (eds) Essay on African Population Routledge and Kegan (New York Oxford University Press 1961) p 96
53Ibid p 98 54( bid p 100
55L H Brown in E W Russell (ed) The Resources of East Africa (Nairobi Llterative Bureau 1968) p 102
29
attend school their contribution is decreasing although education
should enhan~p their income earning capacity in the future
Sh~rp contrasts in age and sex structure exist within East
Africa generally resulting from migration In NJombe and Songea
districts in Southern Tanzania about one-third of the adult men
are usually away Thus adult males make up a much smaller proshy
portion of the resident population than is normal The situation
is similar on~ thousand miles away in west Niles District of Uganda
The males of sixteen or over account for only 22 percent of the
population compared with the national average of 28 percent and
In the Kingezi District less than 20 percent were adult men according
to the 1969 census The absence of adult men Is even more marked
in parts of western Kenya for they comprise only 17 percent of
56the Kakamega District In the Kenya 1968 census
In Q1I these areas the high ratio of children to adults
tends to lo~er the level of economic activity This is not true
of the preponderance of women among the adults for they generally
do more work than men but the ratio of men to women may affect
57the economic activity in each area
Con~ersely an unusually high proportion of men of working
age means ~)re development 58 This is most evident in the cities
but also applies to larger areas such as Buganda or Tanga regions
Other factors must be favorable to attract people but the relatively
56Fred A Burke The Economics of Underdeveloped Countries (New York Oxford University Press 1972) pp 11-15
57 58Ibid p 29 Ibid p 30
30
high level of activity In areas such as Buganda is certainly related
to the age and sex and especially to the numerous Immigrant men
who either work as laborers or grow cash crops on their own account
there rather than In their home area
THE ECONOMIC ACTIVITIES OF EAST AFRICA
Trading Is an extremely Important economic activity even
though It Is not Itself productlve 59 By redistributing goods It
increases their value and It provides much employment in the process
Yet trading is sometimes omitted In studies In marketing geography
partly because of little data available on internal trade in East
Afrlca 60 However the main tradIng pattern of the regIon may be
outlined
Trade plays a smaller part In East African life than in
that of more highly developed regIons where peoples wants are
greater and where they satisfy few of their own requirements It
Is less Important even than in West Africa where It forms the
main Inter~st of an enormous number of people 61 Most East African
people produce theIr own food and cannot afford to buy many other
goods Nevertheless some goods are now sold In many parts of the
region and the proceeds are used to buy goods produced elsewhere
Commerce Is thought to contribute about 10 percent of all paid
59M Andrew Kamark The Economics of African Development (New York Praeger 1971) p 68
60 1bld p 98
61 Abull I Richard Economic Development and Tribal Change (Nairobi East African publishing House 1969) p 83
31
employment This commerce was mainly introduced since 1900 but
It has been superimposed on the traditional pattern of small-scale
trade which has not been entirely superceded
The Importance of trade In East African life has greatly
increased thrQugh the development of new forms of exchange which
Involve selling of goods for cash and buying goods produced far
away Ori31nally such trade consisted almost entirely of sales
for export overseas and the purchase of imported goods but today
an increased volume of sales Is to other parts of East Africa and
many of the commodities purchased have been produced within the
reglon 62
ThIs type of trade has provided the main basis for urban
development Both the large cities and the small towns of the
regions owe much of their present Importance to their trading
function even though many originated as administrative stations
within most rural areas the settlement pattern Is highly dispersed
and the clusters of bui ldlngs which are sometimes termed villages
usually consst mainly of IIdukas 163 Host of these small trading
centers grew up to handle the Import and export trade although
many now serve as markets for local trade
In review of a survey conducted by Keegan East Africa dukas
are very small carry one hundred items and occupy no more than
62Dbull A Hawks Official Journals East African Trade (Nairobi East Afric~ Publishing House 1963) p 10
63Warren J Keegan Multinational Marketing (New Jersey Prentice Hall Incorporated 1974) pp 308-9
32
fifty to seventy-five square feet 64 This indicates that the dukas
were operating on an average gross margin of approximately 12 percent
which is considered to be lower cost form of distributlon 65 The
East African duka Is highly Inefficient as a form of distribution
because the sales per person in the duka are much lower to keep
the duka developing significantly with the community economy
THE DISTRIBUTION OF TRADING ACTIVITY
Nairobi
The most important center of trade In East Africa Is Nairobi
A photograph of Nairobi Is provided on page 33 to give an example
of the modern cities of Africa Administration manufcaturlng and
commerce are three main functions of the city and are all comparable
In importace each employing more than fifty thousand people 66
The 1960 survey of distribution recorded one thousand wholesalers
In and out of a total for Kenya of three thousand It recorded two
thousand retail establishments compared with similar numbers In the
next nine towns of the country together 67 The value of all sales
by these ~airobi traders in 1960 was shs 400 billlon 68
T~e great Importance of Nairobi as a trading center Is
related to the fact that it performs trading functions at several
levels In some fields It serves the whole of East Africa and
64 Ib id p 308 65 Ibid p 309
66Mcrgan op cit p 70 67 Ibld p 72
6RKenya Chamber of Commerce Trade (Nairobi Kenya Governshyment Press 1973) p 5
34
in more ways it serves Kenya and Uganda and a small part of
Tanzania
In retail trade Nairobi serves a large area part of which
is relatively prosperous Its pre-eminence has probably hindered
the growth uf neighboring towns such as Limuru and Ruiru as shopping
centers Even Thlka thirty miles north of Nairobi Is more Important
in manufacturing than In trade 69 Much of the retail trade of
Nairobi however Is dependent on the large population and purchasing
power of the city itself Many people obtain their living by supplying
the needs of the administrations Industrial workers and even the
establishment of groups of up to thirty shops at various points
throughout-the higher class suburbs 70
The iMportance of Nairobi Is trade and Is related to Its
functions as the capital of Kenya and In some respects as administrashy
tive center for East Africa There Is a close relationship In which
its Importance In such fields as banking and Insurance are also
involved T~o other factors which favor Nairobi more than possible
rivals SLch as Mombasa are Its centrality in both Kenya and East
Africa and Its location on the eastern edge of the most prosperous
part of the region No town Is better placed to serve the whole
of Kenya or to serve all countries especially since means of comshy
munication have been on Nairobi The country south and west is
sparcely populated but In that to the north and east much purchasing
power Is concentrated There are substantial ve~y affluent European
69 Ibld p 6
70Ibld p 9
35
and African settlements which are of increasing significance as
71cash Income rl5es
Mombasa
Mombasa is not only the leading port In East Africa but
also a major center of trade The first function has led to the
second and the two together have enabled it to become the second
city of Kelya with a population of 380000 (1969 Census)72
Although many importing and exporting firms have headquarters in
Nairobi and their goods are consigned directly to or from the
port many others have offices in Mombasa and compete successfully
for the trade of a large part of East Africa Most traders in
Moshi for example and many in Kisumu or Kampala obtain supplies
through Mombasa importers The export marketing trade provides
much employment outside the port area far apart from private firms
concerned mainly with exports The Uganda Coffee and Lint Marketing
Board has large warehouses In Mombasa 73
Mombasa functions In retail and local wholesalers markets
but this activity Is small in relation to its size Its sphere
of Influence is inevitably reduced by its coastal location while
much of its immediate inner land is arid and sparcely populated
The ships calling at the port provide extra trade for they generally
71A M Wilson Social Change In Modern African Trade (New York Oxford University Press 1961) p 193
720xford Economic Atlas (New York Oxford University Press 1974) p lQ7
73Encyclopedia Americana East Africa Vol 4 (1974) p 579
36
take on some supplies and their crews and passengers often spend
some time clshore However this is of small Importance In comshy
parison with the export trade
Dar-es-Salaam
In some ways Dar-es-Salaam combines the functions of Nairobi
and Mombasa since it Is both the capital and the leading port of
74Tanzania Each of these roles encourages trade and the city
is much the most Important center of trade In the country On
the other hand It does not dominate the whole country as much
as Nairobi and Mombasa together dominate Kenya for both North
and South have only limited marketing connections with It Arusha
and Moshi have closer tradIng links with Kenya cities and with
the port of Tanga Bukoba has closer ties with Uganda and Kenya
and Mowara Region Is often linked physically with the capital only
by sea and It is therefore commercially Independent to some extent
Dar-es-Salaam also plays a smaller role than Nairobi and Mombasa
combined It Is comparable In size with the latter and Its inhabishy
tants are very much dependent on Its trading functions It is the
main center of import export and wholesale trade for the area
of 280000 square miles and a population of 19 million people 75
It Is also the center of small-scale wholesale and retail trade
for the coastal region while the purchasing power of the city populashy
tion is sufficient to support a wide range of specialized shops
74B F Joh~son The Sta Ie Food Economics of Tro leal Africa Tanzania (Stanford Stan or UnIversity Press 9 p 131
7Ibid p 26
37
Kampala
Kampala is smaller than the three cities mentioned above
but it is very clearly the commercial capital of Uganda Several
of the major importtng and exporting firms of East Africa have
branches there and merchants import goods directly from the port
of Mombasa Many of the businessmen are middlemen who buy from
Nairobi or Mombasa wholesalers and who often sell to other wholeshy
salers in sm~ller townsJ6 Kampala controls most of the trade of
Buganda and Western Uganda but less of that of the east and north
Thus whereas little is obtained their cement is consigned directly
from Toro to the northern towns Little is dispatched to towns in
77the west for these obtain their supplies through Kampala dealers
Although location and the communication pattern limit Kampalas role
as a distribution center for Uganda Kampala middlemen merchants
have extended their sales area in the west beyond the border of
Uganda to Bukoba and to Rwanda
Others
It is not practical to examine the trade of every town in
East Africa but some further features of the distribution of trade
might be noted
Most of the towns classified as others are majority adminisshy
trative centers and their marketing functions have developed from
this Although they differ considerably they are very similar in
76W T W Morgan East Africa Economic Characteristics (Nairobi ~ast Africa Publishing House 1960) p 279
77ibid p 280
38
appearance In addition to administrative functions these towns
provide services such as hospitals and they have generally become
centers of local communication The features tend to enhance their
roles In trade The size and importance of these trading centers
is generally related to the size population and propensity of the
areas they serve Most of these towns are newly created Their
populations range from between three thousand to six thousand and
they have rather less than one hundred shops most along a single
main street 78 All are retailers but many also sell goods to traders
from the countryside and buy some local agricultural products
Mo~t of the towns created are very young and they came into
existence due ~o the scarcity of land These towns are scattered
throughout East Africa and vary In both size and frequency with
the density of population and the local level of income
COMMUNICATION ACTIVITY
Transportation has become an Important economic activity
Official estimates place Its contribution to the Gross Domestic
Product of East Africa at ~45 million which accounts for 61 percent
of the total 79
Road Transportation
Road and rail transportation are probably roughly comshy
parable as sources of Income In East Africa although they differ
78~NESCO Opt cit p 96
790xford Economic Atlas (Oxford Oxford University Press 1966) pp 174216221
39
greatly in structure Road transportation is operated mainly on a
very small scale but there are so many small operators that the
number of people earning a living in road transportation Is very
large SO Motor vehicles came Into general use in the 1920s but
the greatest expansion of road transportation came thirty years
later Today there are many more vehicles per head of population
than in Nigeria or even Egypt approximately six persons per cad IISl
In Table 3 on page 40 road transportation shows that the majority
are private cars but the figure for vans lorries and busses undershy
states the volume of commercial road transportation Cars on many
East Africa roads are used legally or otherwise as taxis proshy
viding many people with good incomes This Is especially well shy
developed in Uganda and helps to explain the small number of busses
there Within each country road transportation activity Is heavily
concentrated In the most prosperous areas especially around the
capital Traffic counts show a far greater intensity on roads around
Nairobi M0mbasa Kampala Jlnja Dar-es-Salaam and Tanga than
elsewhere
The overall Importance and the pattern of road transportation
are both affected by the nature of the road network Road building
has been assisted by the character of the earth in many areas
simple earth murram road serving very well for light traffic
Although few roads are tarred the road network is ~uch better
than In countries such as Sudan and in much of East Africa is
SOlbid pp 147 174 193
81Ibid pp 147 174 183 193
40
Tab Ie 3
Transportation in East Africa (1963-73)82
Kenya Tanzania Uganda Totals
Thousand miles of roads of which bitumen surfaced
(thousands units 000)
Private Vehicles Commercial
Lorries Vans Busses
1963 Flgur~s Private Commercial
Ra 11-Track (In kilometers)
Rail-Vehicles (units 000)
Air-Craft (units 000)
Sea Transportation
nd -- No data available
522
22
1002 295 104 82 26
440 90
962 km
163
05
nd
409
22
726 304 11 I 74 22
220 80
3782 km
42
nd bull nd
39 I
07
619 208 64 70 17
180 60
1 160 km
72
04
nd
1322
5 I
2345 80 1
840 230
59 km
17
82 Ibid pp 174216221
41
adequate for the demand made upon it 83 Some areas without roads
notably in central and western Tanzania are found In other areas
many roads 3re Impassable In the wet season but themiddotdlstrlbutlon
of road transportation activity Is related mainly to factors other
than the roads themselves
Rail Transportation
In spite of competition from the roads railways of East
Africa still undertake most long-distance movement of bulk loads
All are operated by East African Railways Corporation on behalf
of the three governments The rail works employ more than eighty
thousand people
The entire railway system covers 5895 kilometers all
being meter gauge and virtually all single track 84 The East
African Railway Corporation Road Services Is operated mainly In
Uganda and Tanzania although a nucleus of road services between
Mombasa and Nairobi was established to provide express services
for certain commodities
The railway has been Increasing at a moderate rate over
the past few years Between 1965-1971 passenger number rose by
an average of 66 percent per year While the corresponding growth
85rate of freight was approximately 10 percent
83 lbld pp 147 174 193
84 IbId p 39
85Ibld pp 147 174 193
42
Sea Transportation
Sea transportation as an economic activity concerns East
Africa mainly through employment at the ports Sea transportation
administration is operated by the East African Harbors Corporation
on behalf of the East Africa community86 There are several sea
ports which serve Kenya Uganda Tanzania Rwanda and Eastern
Region of Zaire
Periodically these harbors suffer from severe congestion
with serio~s repercussions upon the economy of the entire East
African region The organizational changes within the East African
Cargo Handling Services responsible for handling of cargo as opposed
to the administration of the port makes handling operations slower
and more inefficient
Air Transportation
Air transportation is less than the other forms of transshy
portatlon for it can be used only by the most affluent passengers
and for the most valuable goods In each case the re-fuellng of
planes in transit provides a useful source of income Regular
internal services call at thirty-four places In East Africa of
which twenty-one are In Tanzania 87 The large size and peripheral
populatiofl pattern of that country make air transportation more
appropriate than in Kenya or Uganda Air transportation is unl ikely
to become a major economic activity In East Africa until Its cost
Is greatly reduced
86 Ibld bullbull pp 147 193 87 lbld bull
43
Communication Media
Communication media includes television radio receivers
telephones and dally newspapers These sources are growing at a
88rate of 10 percent per year The growth In urban areas Is higher
than In rurai areas No current data are avaIlable
Tab Ie 4
Communication Medla89 (Thousands) 1963
Kenya Uganda TanzanIa
Television 22 1 100 00
Rad 10 Reef Ivers 70 I 400 300
Telephones 6 1 6 1 32
Da II y Newspapers 190 123 83
SUMMARY
This review of literature was divided Into eight areas which
are pertinent to this study It was designed to provide background
Information related to
A East African Political Environment
1 Regional Survey
2 Nyika Plateau
3 Lake Victoria Basin
88Morgan East Africa Economic Characteristics p 36
890xford Economic Atlas Ope cit Table 1
44
B The Economy
1 Subsistence Economy
2 The Public Sector
3 Excessive Expectations for Public Service
C Population Distribution
1 Regional Population
2 Urban Population
D People
1 Tribal Classification
2 Historical Clusters
E African Heritage
1 The Extended Family
F Understanding the Economic Activities of East Africa
G The Distribution of Trading Activity
1 Na I rob I
2 Mombasa
3 Dar-es-Salaam
4 Kampala
H Communication Activity
1 Road Transportation
2 Rail Transportation
3 Sea Transportation
4 Air Transportation
5 Communication Media
Chapter 3
DESIGN OF THE STUDY
EAST AFRICAN ELITE
This survey was conducted and certain Information provided
to the argument of the study However difficulties of conducting
research 11 the formerly British-controlled territories of East Africa
are no different from those encountered elsewhere only more intense
because of lack of basic bench-mark data and basic socloeconomic
data Stratified probabil ity sampling in more advanced societies
can be designed in many ways Voters rolls rate-payers registers
and the like are usually up-to-date and easily available to the
researchers Such data do not exist in East Africa I Survey
research must be designed therefore on what data are available
There is little constructive value In the criticisms of the purist
that sampling techniques used in Africa do not fit acceptable
Western standards 2 It Is true that they do not but Leonard Doob
states that lithe scholarly or scientific gains to be derived from
ILeonard W Doob Periodic Surve s In Sub-Saharan Africa (Nairobi Nairobi Publishing House Hay 11 1970 p 3 bull
21~id p IS
45
46
valid results are so staggeringly inviting that the frustrations
of the moment Cre rendered almost Impotent- 1I3
Marco Surveys Ltd Nairobi Is the original data source
on its determination to publish Whomiddots Who in East Africa In 1974
Its part information Is the basis for this study
The survey by Marco Survey Ltd Nairobi had faced some
difficulties in deciding who was to be interviewed however It
took several months of careful planning Staff lists were prepared
by the four governments directories of commerce and industry and
membership 1ists of all available professional cultural and warshy
fare organizations and societies were examined Finally the
wage structures of the largest companies were checked and compared
to the wage paid by the four governments Every Interview was
planned and every respondent was presented There were direct
mall intervIews and each respondent signed the completed form
as correct after the interview
The criteria for selection to be interviewed were two The
first criterion was income The optimum cot-off point was an income
of ~I 000 per annum which is higher than the average European
or Asian income and Is also higher than the starting scales for
4university graduates The second criterion was the position held
by the respondent Women who have been Included are el ites In
their own right and not persons who are simply wives of elites
There are only sixty women in the total of 1423 Interviews about
3Eest Africa 1974 (Nairobi Marco Survey Ltd 1974)
4Doob Ope cit p 256
47
4 percent so sex was not used as a basts of tabulating the socloshy
economic data
This data Is presented on a comparative basis to Illustrate
by the basic =lassiflcation data the differences and similarities
of the African elite of the three countrles--Kenya Uganda and
Tanganyika Zanzibar has been Included and treated separately In
most of the tables
This study Is divided Into three parts The first Is an
analysis of the elite In East Africa based on the basic classificatory
data that w~s collected In the original research for Whos Who in
East Africu5 and additional studies which In addition to describing
the elite give Insight Into their opinions attitudes and beliefs
The second is a survey of urban elite opinions on basic social
and economl~ problems and technical assistance It Is based on a
stratified probability sample of those who most closely resemble
the elite in three African capital cities The third describes a
survey which Is beginning to provide research Into changing attitudes
and knowledge that will temporal orientation determlnlsm 11 The
sample will be described at the beginning of the second part for
each of these surveys and a few sample tables will be given to
Illustrate some of the results of this research
Approximately 6 percent of the Africans listed for Intershy
view refu~ed to be Interviewed There were numerous reasons given
for refusing but the chief factors were education and personal
reasons claiming that they were not Important enough to be included
5Marco Survey op cit p 19
Na I rob I
URBAN ELITE OPINION
Order (Englewood Cliffs chapter 4
A recent study poses the hypothesis that the role of the
Standard codes were used to clarify the data and cards
be said that the attitudes and opinions expressed In answer to
East Africa to test the attitudes and opinions of the city African
The interviews were conducted by permanent senior research
48
6Fred G Burke Africans Quest New Jersey Prentice Hall Incorporated
questions are those of the elite but they do represent the opinions
and education The respondent had to have had some secondary edushy
affairs and social problems The sample was stratified by age
the interviews were conducted or had many years of residence there
Inevitably some of those listed were not available for Interview
on certain questions Involving his personal life International
cation and had to be at least eighteen years of age It cannot
a stratified robability sample in each of the capital cities of
Five attempts were made In every case of this type before giving
city in Africa is that of generator communicator Innovator and
Intergrator 6 The research accepted this hypothesis and designed
were punched for 80-column ICT data-processing equipment in
up An estimated 10 percent of those listed were no t avai lable ll
assistants All of these have at least a Bachelor of Arts degree
for interview for one reason or another
or its equivalent and are either nationals of the country in which
49
and attitudes of a probability sample of urban African eighteen
and over who has had some secondary education and who lives in
one of the capital cities of East Africa Therefore the opinions
of this group will be closer to those of the elite than a sample
based on the population as a whole
The people interviewed were chosen in the following manner
Each city including peri-urban and dormitory areas was divided
into geographical units using a grid method on a base map Each
square of the grid was numbered except for those that were in
the business area--marshalling yards ocean and the like--and 10
percent of the squares were chosen by using a table of random numbers
The number of units of housing In each was then determined and
the quota was divided proportionately between each The interval
between units was determined and a starting point selected
The interviewers continued Interviewing to the set interval
until the quota was completed Three callbacks were made where
necessary for each respondent before declaring that interview
void The household was defined as that group which regularly
takes its meals together The head of the household was Intershy
viewed to determine how many In the household of either sex were
over eighteen and had had some secondary school education Those
were then listed and the person to be interviewed was selected
by a system of random numbers Only one person was Interviewed
In each household If the unit did not have at least one person
as defined by education the interviewer then proceeded to the
next household by the fixed interval Ten percent of the intershy
views were checked by field supervisors The Interviews were
50
conducted i~ English for the most part but some Swahili was used
in Dar-es-Salaam
The questionnaires were pretested in each of the capital
cities and the questions were modified where necessary The
translation of Swahili was made in the usual way of two separate
translators who worked from Engl ish to Swahil i and vlce versa
The interviews were conducted from September 15 to October
5 1974 The tables have been shortened for prInting convenience
by grouping items that have less than 5 percent response Into the
category 1I0thers 11 Percentages were rounded to the nearest whole
number or if the percentage was too small in a subsample whole
numbers were given in parentheses
OPINIONS AND ATTITUDES
The following is a description of a few of the questions
which were used in pretesting a series of eighteen questions in
three capital cities of East Afrlca to establish eight scales to
assess opinions and attitudes about temporal orientation governshy
ment confidence and optimism science and determinism conception
of people politics and tribalism or traditionalism It is Intended
that the scales when adequately tested revised and evaluated
can be used for per lodlc surveys at least fixed intervals over
1I7the next five years Such surveys will provide scales that can
be used to measure social change and that can be used to compare
7Gordon H Wilson liThe Transformation of East Africa Basic Scale for Periodic Research (New York Basic Books Printer 1971) p 456
51
data from the three capital cities and also to compare the basic
data between the elite of the urban areas and probability samples
from selected rural areas
The pretests were carried out in Nairobi Kampala and
Dar-es-Salaam Each was based on a probability sample of 150
people stratified by age eighteen and over and education The
respondent must have had some secondary education In fact the
sample for the pretests were chosen on the same basis as the survey
described In the third part A probabilIty sample of this type
Is unavoid~bly composed mostly of males young adults who are
relatively wealthy engaged In the more skilled occupations and
professIons representing the politically and socially Important
members of the community It closely resembles the elIte described
In the second part of this chapter The research selected only
a few questions to Illustrate the possible value of the results
It Is patently evident however that though these one-shotll
results are
bull merely interesting or suggestive they will become significant and really helpful when comparative data are obtained over a period of time so that trends knowledge and public ftplnlon can be detected and measured by established scales
8 b t d p 456
Chapter 4
ANALYSlS OF DATA
The age of the elite of East AfrIca shows some sIgnIfIcant
differences among the four countries Table 5 on page 53 is the
percentage distribution by age If we disregard the not stated
categories the average ages are as follows Kenya 31-45 years
Uganda 36-40 years Tanganyika 31-35 years Zanzibar 41-45 years
East Africa 36-40 years
Table 5 shows the average age of elIte to be higher In
Uganda and Zanzibar than In Kenya and Tanganyika Uganda has 17
percent of elite over fifty years and ZanzIbar 28 percent whIle
4 percent cf elIte are In this age group In Kenya and Tanganyika
Later the analysis will reveal that one-third of the Uganda elite
are Baganda thus the explanation of the older average age may
be that Baganda has had a strong traditional centralized governshy
ment for many years and therefore posItions of power of authority
have been open to the Baganda for a much longer period than for
other East Africans The same explanation can apply to the elite
of Zanz rbar
The process of Africanlzatlon can be seen In Table 6 on
page 54 There Is a smaller percentage of Africans in the civil
service In Kenya than In the other two countries but a higher pershy
centage of elected and appointed representatives due to the regional
52
53
Table 5
East African Elite Age Factor By Percent
Kenya Uganda Tanganyika Zanzibar Total
Up to 25 years 5 1 1 2 3
26-30 years 18 15 18 8 16
31-35 years 26 15 21 5 17
36-40 years 21 20 20 9 20
41-45 years 12 16 11 17 14
46-50 years 4 8 8 5 6
51-55 years 2 9 2 10 4
56-60 years 1 4 2 8 3
61-65 years 1 3 - 7 2
66 and over a 1 - 3
Not stated 10 8 17 26 14
Total 100 100 100 100 100
Base 457 409 444 113 1423
a -shy Less than 5 percent
54
Table 6
East African Elite Occupation Factor Sample by Percentage Distribution
Kenya Uganda Tanganyika Zanz Ibar Total
Civi 1 servant 27 42 51 46 40
Electedappointed 41 34 23 10 31
Commerceindustry 12 10 9 19 11
Trade union politician 13 5 4 6 8
Education 6 6 7 a 7
Professional 3 I I 7 2
Cooporatlvestrade I I 3
Religiouswarfare 2 4 6 - 4
Agriculture I 2 1 3
Miscellaneous 2 3 3 2 3
Total 108 108 108 108 108
Base 457 409 444 113 1423
a -- In a few cases the same person qualified in more than one classification
55
form of government Kenya also has a higher percentage of elite
who qualify as trade unionists
There are several ways of describing occupations Civil
servants for example can be in medical education or other
services Table 7 on page 56 gives occupations of the elite
in East Africa by a different set of criteria
The Education Factor
Tabl~ 8 on page 57 shows that in the categories University
and above East Africa rates 25 percent--with Kenya 25 percent
Uganda 24 percent Tanganyika i9 percent and Zanzibar 32 percent
The high number in the last country is accounted for in Table 7
IIEast African Elite Where Educated A higher percentage were
educated in the United Kingdom and IndiaPakistan (52 percent)
because of lack of local secondary schools Another factor is that
a well established social class structure was part of pre-independence
culture The upper class in Zanzibar and to some extent those
among the Baganda could afford overseas education whereas those
from other countries were dependent on financial help from governshy
ment sources
There was a higher percentage of elected or appointed represhy
sentatives In Kenya and this category was not so highly educated
as the Icivtl servant of a ll others categories It can be seen
that there are more electedappointed representatives than civil
servants or others in the lowest categories of education In the
highest educational brackets we have more civil servants in the
elite of all three countries than in the other two classifications
55
form of government Kenya also has a higher percentage of elite
who qualify as trade unionists
There are several ways of describing occupations Civil
servants for example can be in medical education or other
services Table 7 on page 56 gives occupations of the elite
In East Africa by a different set of criteria
The Education Factor
Tabl~ 8 on page 57 shows that In the categories University
and above East Africa rates 25 percent--wlth Kenya 25 percent
Uganda 24 percent Tanganyika 19 percent and Zanzibar 32 percent
The high number in the last country is accounted for in Table 7
IIEast African Elite Where Educated 1I A higher percentage were
educated in the United Kingdom and IndiaPakistan (52 percent)
because of lack of local secondary schools Another factor is that
a well established social class structure was part of pre-Independence
culture The upper class In Zanzibar and to some extent those
among the Baganda could afford overseas education whereas those
from other countries were dependent on financial help from governshy
ment sources
There was a higher percentage of elected or appointed represhy
sentatives n Kenya and this category was not so highly educated
as the llcivll servant of lIa ll others ll categories It can be seen
that there are more electedappointed representatives than civil
servants or others in the lowest categories of education In the
highest educational brackets we have more civil servants in the
elite of all three countries than in the other two classifications
56
Table 7
East African Elite Specific Occupation Factor By Percent
Kenya Uganda Tanganyika Zanzibar Total
Education (administration) 5 4 6 7 5
Education (teacher) I 3 1 2 2
Medical practicing 4 5 3 5 4
Sciences 1 I I 2
Lawjudicial 1 6 2 8 2
Accountancy 2 1 2
Farmer 1 2 I 3
Entrepreneur 2 2 I 9 2
Senior executive 34 36 61 44 45
Junior administrator 7 14 14 3 1I
Legislator (only) 38 20 7 8 21
Partyunion officials 13 5 4 6 8
Editorsartauthors 1 1 I 5
Clergy senior 1 3 4 - 2
Others (unclassified) 2 5 3 2 3
-Base (all Africans
Interviewed) 457 409 444 113 1423
57
Table 8
East African Elite Education Factor By Percent (1972)
Educational Level Reached Kenya Uganda Tanganyika Zanzibar Total
No formal education
Attended junior secondary 22 13 8 21 15
Attended sen lor secondary 21 18 23 13 20
Obtained certificate of secondary 12 8 3 10 8
Obtained higher certificate high school a a a - a
Nonunlverslty technical studies 5 7 19 6 10
Nonunlverslty teaching studies 4 6 7 - 5
University studies non-graduate - 22 20 17 17
University studies 1st degree 17 15 16 26 17
Post-graduate university ma s te r I s deg ree 5 7 2 4 7
Post-graduate university studies higher degree 2 2 1 2 1
Not stated I - I I a
-Base (all Africans
Interviewed) 457 409 444 113 1423
a -- Less than 5 percent
58
Civil servants In Uganda are more highly qualified than In the
other three countries 59 percent have university education In
Kenya 56 percent In Tanganyika 42 percent and in Zanzibar 56
percent have university education Elected and appointed represhy
sentatives generally have less education In Kenya 22 percent
Uganda 37 percent and in Tanganyika 26 percent (Zanzibar could
not be tabulated) have university education Uganda Is still the
highest among the three countries
Country Where Ed~catlon Was Obtained
Table 9 on page 59 gives details about the country In
which the respondent was educated In his final year of education
It can be seen that the highest percentage of the elite were edushy
cated in local East African schools (58 percent) The United Kingdom
came next (28 percent) followed by the United States (7 percent)
IndiaPakistan and other African countries There are very sigshy
nificant differences between the East African countries however
which are worth noting Zanzibar and Uganda have many more elite
who were edycated overseas and in the United Kingdom particularly
than the other countries Kenya had fewer by 10 percent than
the next lowest which was Tanganyika
It would be a waste of effort to detail all of the East
African schools attended by the East African elite There were
nearly one ~undred What is significant however is to show that
out of this total only a few schools account for handful accounts
for more than 5 percent of the elite In each country and moreover
this handful accounts for a very significant percentage of the elite
59
Table 9
East African Elite Where Educated
Country Educated Kenya Uganda Tanzania Zanzibar Total
East Africa only 67 54 57 42 58
Afrlca--outslde East Afrt ca 3 4 4 1 4
The U S 8 5 8 2 7
The U K 18 38 27 38 28
IndiaPakistan 4 3 3 14 4
Austral la New Zealand a - - - a
Canada - a - - a
Western Continent Europe Ie Germany Norway 1 1 3 2 2
USSRChina or Eastern European Countries - - a - a
Elsewhere outside Afr lea
Not stated 1 - a 2
Total 103 106 100 100 100
Base (All AfrIcan Interviews) 457 409 444 113 1423
a -shy Less than 5 percent
60
The Factor of Rellslon
This survey did not Include Zanzibar and therefore the
paper Is unable to provide comparative figures for Zanzibar of East
Africa as a whole One would logically expect to find relatively
61
the same number of elite as the general percentage for the popushy
lation as a whole In each religious grouping
Table 10 on page 62 is complicated by the category among
the elite of Inormal Chrlstlan1I which did not appear In the first
survey This category has been added because many of the sophisshy
ticated Africans were educated In Christian schools so they do not
regard themselves as pagan and yet they do not belong to any formal
church The category IInormal Christian or simply Christian is
used to describe them We can generalize that fewer Moslems are
among the elite than one would reasonably expect from the above
figures particularly In Tanganyika Fewer Roman Catholics in
Kenya and Uganda are among the elite than one would reasonably
expect from the above figures about the proportions to be expected
Moslem education In East Africa Is less than education
among the other religions Protestant missions have been strongest
in education since earliest times In East Africa and this Is
reflected in Table 10 Even In government schools in the old colonial
tradition the Church of England as the state church dominated
the educational field In the British System and in England today
1Ireligion is taught along with the three Rl s This will explain
the larger number of Protestants In the population as a whole and
among the elite of Uganda and Kenya Zanzibar of course Is a
Moslem country Most of the 7 percent 1I0 ther ll in Zanzibar were
Bahal The white fathers of Tanganyika dominated the field of edushy
cation in early German times and remained a powerful force throughshy
out the Trusteeship period
62
Table 10
East African Elite Religion Factor Compared to Population Percentage
Kenya Uganda Tanganyika Zanzibar Total
Elite Othersa Elite Othersa Elite Othersa Elite Elite
Roman Catholic 21 29 25 34 26 28 4 22
Protestant 54 45 65 50 22 26 43
Moslem 4 16 3 10 16 39 88 14
Pagan 8 6 7
Normal Christian 15 2 24 13
Other 7
Not stated 6 2 5 1I 7
Total 100 100 100 100 100 100 100 100
Base 457 2400 409 2600 440 2000 113 1423
a -- The percentages for others is based on the probability sample (7000) of survey conducted by Fred G Burke Some grass-roots attitudes affecting political and social Intergratlon In East Africa paper delivered to the African Studies Association San Franclsco October 26 1963
63
The Factor of Voluntary Associations
The degree to which Individuals In African societies join
groups of voluntary association is a measure of social change The
comparison between the four countries which is given in Table 11
on page 64 shows significant differences between them Tribal
associations are much stronger in Kenya than elsewhere 21 percent
as against 2 percent to 8 percent In Zanzibar Tanganyika and Uganda
This underlines the felt need of the Africans of Kenya for security
among their own people in the face of Insecurities of the old
colonial system and Its concomitant privileged European and Asian
classes Nowhere else in East Africa was the position of the
settler or trader so strong Moreover political parties were
banned In Kenya on a national basis until comparatively recently
although district associations were encouraged by the administration
Kenya elite rate highest In political party membership (35
percent) as against 17 percent to 22 percent and trade union membershy
ship (20 percent) as against 5 percent to 12 percent
Uganda elite join more groups of voluntary associations
than the elIte of other countries The average Uganda elite has
membership In two groups Kenya 1-7 Zanzibar 1~6 and Tanganyika
1-5 Moreover the kind of groups that the Uganda elite support
are more sophisticated The Uganda elite rate much higher In
religious (16 percent) versus 6 percent to 9 percent professional
(15 percent) versus 4 percent and cultural (16 percent) versus
6 percent to 11 percent The Uganda elite Is only second to the
Zanzibar elite (42 percent) as members of social clubs (36 percent)
but significantly higher than the Kenya elite (23 percent) and the
64
Table 11
East African Elite Voluntary Associations Factor By Percent
Kenya Uganda Tanzania Zanzibar Total
Member of a tribal association 21 8 3 2 10
Religious societyunion 6 16 6 9 9
Business society 5 8 6 11 6
Professional society 9 15 4 15 9
Academic society 12 20 7 17 13
Political party 34 21 22 9 25
Charitable organization 5 13 12 42 10
Social club 23 36 25 9 29
Sporting club 6 16 11 15 11
Other organizations 11 4 5 10 8
Cultural organizations 6 16 11 10 11
Trade union 20 5 12 5 12
Belong to none 18 17 33 17 22
Total a 176 195 157 165 175
Base (All African interviews) 457 409 444 113 1423
a -- Many individuals belong to more than one group
65
Tanganyika elite (25 percent) One In three of the Tanganyika
elite (33 percent) does not belong to many voluntary associations
compared to only 17 percent or 18 percent for the elite who do not
belong to at least one society In the other East African countries
Business is presented equally in each of the four countries
Table 11 Is one of the most significant of the survey The
Uganda elite of whom one in three was Baganda have had University
at Kampala for many years It was once the only center for higher
education In East Africa Therefore culture In the western sense
was for many years a factor of influence on elite of Uganda which
was not available in either Kenya or Tanganyika
The Tribal Factor
The percentage of the elite In each country by tribe
compared to the percentage of the population represented by that
tribe should give an Interesting Index of the degree to which
the tribe has progressed and Indirectly of the Influence of Its
members
The first significant fact which emerges Is that 9 percent
called themselves Tanganyikansll and would not use the label tribe 11
We can only assume that the actual percentage by tribe of this group
Is about the same as described In Table 12 on page 66 with the
obvious Inclusion of some who are of mixed percentage The most
significant fact Is that there were 30 percent who belonged to Kenya
tribes 2 percent Ugandans and 5 percent Zanzlbarees No other
East African country had as high percentages In these categories
That amounts to 37 percent who were of tribes other than those of
66
Table 12
Tanganyika ElIte by TrIbal Group
Tri be Percent of PopulatIon Percent of ElIte
Sukuma 19 3
Nuyamwerl 7 2
Hakonde 6
Haya 6 7
Chagga 6 12
Gaga 6
Ha 5
Hehe 4 1
Nyakusa 4 3
Wguru 4
Sambaa 3
Zaramo 3
Yao 3
Hwevu 2
Others (Less than 2) 13 22
Stated Tanganylkan 9
Kenyan Tr t bes 30
Uganda TrIbes 2
Zanzlbaree 5
Toeal 100 100
Base 10204000 (1973) 444
67
Tanganylkans The major tribe the Sukuma represents one in five
of the Tanganyika population yet has only one In thirty-three
among the elite There are twice as many Chagga among the elite
as their tribal percentage would warrant Surprisingly the Haya
have more than their share although all the rest have fewer except
the ve ry sma 11 Ilothe r ll t r i bes who have nea r 1y tw Ice as many
In Uganda we would expect to find the Baganda over represhy
sented in the elite (see Table 13 on page 68) They have like
the Chagga twice as many (33 percent) as the tribe percentage would
warrant (162 percent) An even higher percentage 28 percent
claimed to be IIUgandans a classification not recorded in the official
census figure Only 1 percent are from Tanganyika and 1 percent
from Kenya Unlike Tanganyika the smaller tribes which each
represent less than 1 percent each of the population have only
half as many elite (6 percent) as their combined percentage (94)
would expect Tanganyika had twice as many The Watoro was the
only other tribe In which the percentage of the elite exceeded
that of the tribe 4 to 32
Kenya Is unique In that there are several tribal groups
that exceed their quota of elite and by almost the same ratio (see
Table 14 on page 69) The Luhya have a slight margin by ratio
over Luo and Kikuyu The Kamba Mero and Embu related tribal
groups are all seriously under their expected percentages Like
Tanganyika but unlike Uganda the small tribal groups--each of
less than 3 percent of the total population but represent 161
percent of It--have 22 percent of the elite A high percentage
of this group of the elite are from the numerous coastal tribes
68
Table 13
Uganda Elite by Tribal Group
Tribe Percent of Population
-Baganda 162
Banyonkole 8 I
Teso 8 I
Basoga 78
Baklga 7 I
Lango 56
Baglsu 5 I
Acho I I 44
Lugbara 37
Wator i 32
Banyaro 29
Karamujong 19
Alur 14
Banyole
Kuma 94
Others (Less than 1) -Not stated
Stated Ugandan -Kenyan tribe
Tanganyika tribe
Total 1000
Base 7367558 (1973)
Percent of Elite
33
3
3
4
2
3
3
4
3
6
28
100
409
69
Table 14
Kenya Elite by Tribal Group
Tri be Percent of Population Percent of Elite
-Kikuyu
Luo
Luhya
Kamba
Meru
Kis i i
Embu
Klpsigis
Nandi
Others (Less than 3)
Stated Tanganyika
195
144
125
117
69
49
39
3
22
16 1
23
19
19
6
2
3
2
22
2
Total 1000 100
Base 9204000 (1973) 457
70
Table 15
Question
What in your opinion is the most important problem facing our country at the present time
Na i rob i Dar-es-Salaam Kampala Total
Education
Poverty-famine
Unemployment
Economic development
High cost of living
Border disputes Inter-African disputes
Pol itical instabi 1ity
Tr i ba 1ism
Land apportionment
Publ ic laziness
Other problems
Don1t knownot stated Refused to answer
22
13
41
6
10
3
2
3
2
2
29
24
6
24
3
6
4
2
28
18
18
12
9
5
3
2
5
3
27
19
18
14
8
3
3
4
2
Total 109 105 105 105
Base 389 451 395 1235
71
Table 16
Question 2
All things considered how satisfied are you with your present standard of 1ivlng--very satisfied fairly satisfied
somewhat dissatisfied or very dissatisfied
Nairobi Dar-es-Sa1aam Kampala Total
Very satisfied
Fairly satisfied
Somewhat dissatisfied
Very dissatisfied
Don I t know
Refused to answer
6 13 4 8
32 50 25 36
32 26 37 31
29 11 32 24
Total 100 100 100 100
Base (a 11 intervi ews) 389 451 395 1235
72
Table 17
Question 3
Do you think political matters should be left to the government or should people like yourself take
some active part in political affairs
Nairobi Dar-es-Salaam Kampala Total
Left to government 26 24 13 21
People to take an active part 72 72 73 72
Other answers 4 2
Dont know 2 8 3
Refused to answer 2 2
Total 100 100 100 100
Base 389 451 395 1235
73
Table 18
Question 4
Which one of the following do you think our country needs most at the present time more schools more hospitals
more housing more factories or more roads
Nairobi Dar-es-Salaam Kampala Total
More schools 40 44 51 45
More factories 40 37 28 35
More hospitals 17 10 15 14
More housing 1 6 5 4
More roads 2 3 1 2
Don I t know
Total 100 100 100 100
Base 389 451 395 1235
74
Table 19
Question 5
Now which one do you think our country needs most an honest government without corruption a government that gets things done fair distribution of wealth
national unity or individual freedom
Nairobi Dar-es-Salaam Kampala Total
An honest government wIthout corruption 44 38 51 44
A government that gets things done 23 18 17 20
National unity 22 20 17 19
Individual freedom 6 14 6 9
Fair distribution of wealth 5 9 8 8
Don I t know
Refused to answer
Total 100 100 100 100
Base 389 451 395 1 235
75
Table 20
Question 6
Which do you prefer--government ownership or private ownership of major industries
Nairobi Dar-es-Salaam Kampala Total
Government ownership 51 43 38 44
Private ownership 38 38 31 36
Mixed (voluntary answer) 10 18 29 19
Don I t know
Refused to answer - - 1shy
Total 100 100 100 100
Base 389 451 395 1235
76
Table 21
Quest Ion 7
As you know there are many different ways In which African states can establish closer ties among themselves Which of the
following ways would you favor an organization for settling disputes between African governments
closer economic relations political federation African military
organization cultural exchanges
Nairobi Dar-es-Salaam Kampala Total
Favor 94 96 85 92
Oppose 3 3 9 5
Don I t know 2 1 4 2
Refused to answer 1 - 2
Total 100 100 100 100
Base 389 451 395 1235
-Closer economic relations 22 49 53 41
Political federation 26 39 27 31
An organization for settling disputes between African governments 34 32 15 28
An African military organization 15 18 11 15
Cultural exchanges 3 10 3 6
Don I t know
Total 100 149 110 121
Base 366 432 337 1135
77
(8 percent) only 2 percent are Tanganylkans and the Ugandans did
not rate statistically
ELITE OPINIONS AND ATTITUDES
Not only does Scale 1 Table 22 Illustrate a sound basic
knowledge of modern methods to prevent crops from being damaged
It also Illustrates a similarity of knowledge between the three
sample areas which are widely separated geographically Scale 1
will be Invaluable when comparing the results of our first rural
study the field work of which has been completed and Is at the
stage of processing
Table 22
Scale
It does not help much to try to prevent crops being damaged by Insects and diseases such losses can
never really be prevented
Kampala Dar-es-Salaam Nairobi East Africa
Agree 8 12 12 11
Disagree 88 85 87 86
Uncertain 4 3 3
Base 153 156 150 459
Scale 2 Table 23 on page 78 also Illustrates but not
so conclusively similarities between the three areas Nairobi
had 17 percent agree whereas Dar-es-Salaam had only 10 percent
with Kampala somewhere Inbetween One could say therefore that
78
there Is a higher degree of tribalism among the elite of Nairobi
than among the elite of Dar-es-Salaam
Table 23
Scale 2
A man should never marry a woman who does not belong to hIs tribe
Kampala Dar-es-Salaam Nairobi East Af rl ca
Agree 12 10 17 13
Disagree 81 83 80 82
Uncertain 7 7 3 5
Base 153 156 150 459
While Scale 3 Table 24 shows a similarity between the
three areas It shows that the respondents of Nairobi are much
Table 24
Scale 3
People have It within their power to bring harm and misfortune to others through magic
Kampala Dar-es-Salaam Nairobi East Africa
Agree 26 28 30 28
Disagree 45 46 61 51
Uncertain 29 26 9 21
Base 153 156 150 459
79
more sophisticated In regard to magic than in the other sample
points and that fewer are uncertain A significant number In each
area however believe that magic can be used to bring harm and
misfortune to others
Scale 4 Table 25 shows a consensus between the three
areas but shows an over all unfavorable knowledge about science
and knowledge The majority 83 percent believe that many imporshy
tant matters can never be positively understood by the human mind
The question can provide a very useful comparison In changing patterns
of knowledge regarding science In the future
Table 25
Scale 4
Science and knowledge are useful of course but many important matters can never be positively
understood by the human mind
Kampala Dar-es-Salaam Nairobi East Africa
Agree 80 79 86 83
Disagree 9 12 13
Uncertain 11 9 6
Base 153 156 150 459
Scale 5 Table 26 on page 80 shows an unfavorable public
opinion about the role of traditional chiefs and the dichotomy caused
by loss of status in recent years by traditional chiefs whose roles
have been largely taken over by the political appointee of the
ruling party The question will also provide useful comparative
80
data between ruralurban areas and will be useful In the future to
measure changes in attitudes and opinions about traditional chiefs
Table 26
Scale 5
A man ought always to obey his traditional chief
Kampala Dar-es-Salaam Nairobi East Africa
Agree 42 38 45 42
Disagree 42 46 49 46
Uncertain 15 16 6 12
Base 153 156 150 459
Scale 6~ Table 27 not only shows an area of new problems
for East African elite but also the wide divergence of response
Table 27
Scale 6
Government and politics are so complicated that the average man cannot really understand what Is going on
Kampala Dar-es-Salaam Nairobi East Africa
Agree 81 65 72 72
Disagree 16 24 22 21
Uncertain 3 11 6 7
Base 153 156 150 459
81
between the three sample points In Kampala 81 percent agree
with the statement and only 3 percent are uncertain whereas In
Dar-es-Salaam 67 percent agree while II percent are uncertain
The statement will provide a useful measure In future of the attl shy
tude of the elite toward government In each of the three sample
points
Scale 7 Table 28 Is a new problem of Investment and
saving which as you can see has brought out differences between
the three sample points and will provide In the future a useful
measure of changing attitudes toward savings and the postponement
of rewards
Table 28
Scale 7
If I had the choice I would prefer to be given a small sum Immediately rather than be promised a very
large sum one year from now
Kampala Dar-es-Salaam Nairobi East Africa
Agree 62 54 62 60
Disagree 24 37 30 30
Uncertain 14 9 B 10
Base 153 156 150 459
There are other examples above of similarities and dlsshy
similarities which are even better than Scale 8 Table 29 on page 82
It does show however a close correspondence between Kampala and
Nairobi while Dar-es-Salaam shows a more tolerant attitude In
82
their response to this statement Once again the comparison between
urban and rural areas should show an Interesting and significant
difference
Table 29
Scale 8
A womans place Is in the home
Kampala Dar-es-Salaam Nairobi East Africa
Agree 45 36 45 42
Disagree 46 61 51 52
Uncertain 9 3 4 5
Base 153 156 150 459
Scale 9 Table 30 shows significant statistical differences
between the response from Kampala and those of the other two sample
Table 30
Scale 9
The traditional ways of the past are the best
Kampala Oar-es-Salaam Nairobi East Africa
Agree 15 33 33 27
01 sag ree 68 58 56 61
Uncertain 17 9 11 12
Base 153 156 150 459
83
points This fact Is even more Interesting when we know that in
Uganda the present form of government has been designed to maintain
the traditional ways of the past whereas In the other two areas
the present government has been designed to change politically
at least traditional ways The reactions of the Kampala respondents
therefore are a significant Indication of their dissatisfaction
with efforts to maintain traditional ways
Scale 10 Table 31 also Illustrates that Kampala has a
different reaction than the other two sample points although there
are less significant differences between Dar-es-Salaam and Nairobi
Table 31
Scale 10
The present Is all too often full of unhappiness It Is only the future that counts
Kampala Dar-es-Salaam Nairobi East Africa
Agree 29 50 60 46
Disagree 44 27 32 34
Uncertain 21 23 8 20
Base 153 156 150 459
Scale 11 Table 32 on page 84 Is a really significant
Indication of the basic dissatisfaction of the Kampala respondents
with the status quo The dissimilarity was also reflected in
Scale 10
84
Table 32
Scale 11
The government Is doing all It can to develop our country
Kampala Dar-es-Salaam Nairobi East Africa
Agree 51 86 84 74
Disagree 21 5 10 12
Uncertain 28 9 6 14
Base 153 156 150 459
Chapter 5
SUMMARY AND CONCLUSIONS
The purposes of this study were to
1 Analyze the factors which have slowed the economic
development of East African communities
2 Identify the major problems encountered In economic
systems In East Africa
3 Determine the problems in developing the economic growth
of the community
4 Identify economic reconstruction needs
All the published materials listed below were extensively
reviewed The review Included library research over both periodicals
and some relevant studies The writing of this report Is thus based
on the Information provided by the following documents
1 Periodicals books pamphlets mlcroflshe from the
William Allen White Library of the Emporia Kansas State College
2 Xeroxed materials and books that were secured through
the Inter-library loans
3 Report collected by the Marco Survey Ltd Nairobi
4 Periodicals Issued by the Information section of the
Embassy of the Republic of Kenya Washington D C
In order to determine the social and economic problems of
East Africa a questionnaire-Interview method was used In total
85
86
1423 elites were I~ervlewed Approximately 6 percent of the
elites listed for interview refused to be interviewed
The Interviews were conducted by permanent senior research
assistants
The data collected were compiled (using standard codes to
clarify the data and computer cards were punched for BO-column
I C T data processing equipment In Nairobi) summarized and
interpreted
Finally conclusions were reached
SUMMARY
British East Africa was the name applied to the territories
in East Africa before It achieved Its Independence The territories
cover a total area of 682469 square miles which was divided into
three parts Kenya Uganda and Tanganyika They all became indeshy
pendent by 1963
The communities continued economic ties among each other
and on June 6 1967 at Kampala the three member nations signed
a treaty which was to re-establish the community
East Africa enjoys a great deal of economic advantages
l It borders the Indian Ocean which provides a cheap means of
exporting and ImportlDg goods 2 It Is a meeting point for trade
(east and central African trades)
East Africa Is divided Into five geographic regions (which
provide a variety of climates)
1 coast region
2 Nylka region or Savanah region
87
3 East and West Highlands
4 Lake Victoria region
Due to the Influehce of the cultural traditions the subshy
slstance element in East African economics is still dominant This
is evident in most of the rural areas The public sector of East
African community plays a very great part In developing the economy
The public sector Is expected to be major employers In the community
and Is expected to provide free public services--free school free
medical services free or subsidized public utilities and housing
On an average scale the population of East Africa is yet
low A clear study shows this Is not true In some locations which
are densely populated varying from two hundred to five hundred
people per s~ure mile The population In urban cities of East
Africa Is still low and the people do not consider cities to be
their home Details show that the major East African cities have
over 50 percent of all the urban population while the minor cities
are far less than 50 percent of the total urban population
Standardization of East African people Is too difficult
due to the fact that the population Is composed of a variety of
sub-races whose traditions differ from each other among the tribes
The sub-races classified are
1 Nilotes
2 Nilo-Hamltes
3 Inter-cush Ite
4 Bantus
Based upon the sub-races of East African people the traditional
heritage carried frnom one generation to the other makes the economy
88
of the community hard to work In Perhaps even more important on
the economic outlook is the Inheritance of continuing extended
family contrasts In age and sex
The study shows that trading Is an extremely important
economic activity even though it Is not Itself productive The
trade Itudy has shown that trade has been playing a smaller part
in East Africa and for those operating Its economic efficiency is
very low The greatest part of trading activities is located in
the major East African cities This conclusion has led to the fact
that the majority of the people are living In rural areas where
means of traveling to cities are difficult for them and the lack
of money has probably created the situation where people have to
live subsistently
CONCLUSIONS
The conclusions of the survey of literature and the analysis
of findings follow
Survey of Literature
If It Is correct as suggested by Kamark that the economic
lives of rural Africans are not Influenced by environmental conshy
dltlons more than by cultural disposition then this would mean
that the Introduction for new technology should bring about economic
changes relatively unhIndered by cultural conservatlsm1 That
Is to say the potentIalIties of natural resources can be more
IKamark M Andrews The Economics of African Development (New York Praeger Incorporated 1967) p 79
89
effectively tapped by the Introduction of new methods and undershy
standing and new forms of organization of production It may be
objected that this In fact has not occurred In East Africa and
precisely some would say because of limitations of cultural
conservatlsm 11 But closer studies quite strongly suggest that
where people can see the advantages to themselves of economic changes
2that are both feasible and safe then the changes do occur Thus
African people have accepted changes first and most radically (indeed
they have often deliberately sought them) In the more favorable
areas where the possibilities of new technology and new Ideas are
more readily applicable and where people are exposed to external
influences and have access to modern communicatIons and living styles
The type of national economic progress which is to emerge
the longer-term political goals the roots of nationhood In the
multiplicity of subcultures and naturally uneconomical tribal ties
out of which national culture is forged remain the crucial unanswered
questIons whIch affect the economic progress of East Africa
Analysis of Findings
The results of the analysis has shown that the elite of
East Africa have advanced to a more desIrable socloeconomlc way
of thinkIng ThIs conclusion has led the author to suggest that
perhaps the integrating forms of tribes can be worked out beginning
with the East African elite for however much too depends ultimately
on local and tribal support they have more chance to see above
2 Ibid p 98
90
the disadvantages of these functions The middle class is still
small flexible mobile and unstable not yet clearly or acceptably
dlfferentl~ted from strata above or below The mass of unskilled
workers are the most temporary and the least Involved If no efforts
or attempts are applied the society will inevitably continue to
live In their life of ethnically based networks and subcultural
pockets
16
AHdflJ )O 118 18
BIBLIOGRAPHY
Abraham R G East African Townshipl in A W Southhall (eds) Social Change In Modern Africa New York Oxford University Press 1970
Baver P T and B S Ymey The Economics of Under-developed Countries C U P Cambridge University Press 1957
Blacker E A Demography New York Oxford University Press 1948
Ethographic Survey of Africa East Central Africa London International African Institute 1970
Boesch H A Geography of World Economy Van Nostrand Princeton University Press 1964
Brown L H in E W Russell (ed) The Resources of East Africa Nairobi Literative Bureau 1968
Burke G Fred Africanls Quest for Order Englewood Cliffs New Jersey~ Prentice Hall 1964
The Economics of Underdeveloped Countries New York OxfOrd University Press 1972
Cley and P Robson IFederation of East Afrlca11 Structure and Administration of E A C S O New York Oxford University Press 1964
Doob W Leonard Periodic Surveys in Subsaharan Africa Nairobi Nairobi Publishing House 1970
East African Community Annual Report Nairobi Kenya Government Press 1966
Economic and Statistical Review Nairobi The East African Statlsshytlcal Department 1964 _
Encyclopedia Americana East Africa Vol 4 1974
Encyclopedia Brltanlca East African Community University of Chicago Macropedla Vol I II 1974
Goldthrope J E and F B Wilson Tribal Maps of East Africa and Zanzibar Kampala East African institute of Social Research 1966
92
93
Good M Cha~les Jr Dimensions of East African Cultures New York Oxford University Press 1970
Gulliver P H Labor Migration in a Rural Economy Kampala E A I S R 1955
Harlow V and E M Chi lver History of East Africa Vol II Oxford Clerendon 1962
Hawks D A IIEast Afrlca1I Trade and Industry Official Journal of Association of East African Industries Nairobi Nairobi Publishing House 1963
Hopkins Elizabeth IIConflict of Tribal and Racial Conflict in Stanley and Burke (eds) Transformation of East Africa New York Basic Books Printers 1966
Industrialization in East Africa 5th Edition Nairobi United Africa Press 1966
Jamal A H The Critical Phase of Emerged African States Afalrasl East African Publishing House 1965
Johnson B F The Staple Food Economics of Tropical Africa Stanford California Stanford University Press 1970
Johnson D H Rainfall in East Africa Q F R Vol 5 Nairobi East African Publishing House 1968
Jones Carey Geographical Journal Vol 131 Part 2 New York Oxford University Press 1965
Kamark M Andrew liThe East African Community The Economics of East African Development New York Praegam Incorporated 1971
Kenya Chamber of Commerce Trade Nairobi Kenya Government Press 1973 --~
Lewis William Allen The Theory of East African Literature Nairobi Bureau Annual Report 1965-6
Morgan W T W IIEast Africa Its People and Resources II People New York Oxford University Press 1969
Morgan W T W and N M Shaffer Distribution and Density New York Oxford University Press 1970
Myrdel Uninnar An International Economy Problem and Prospects New York Harper 1969
OConner A N An Economic Geography of East Africa New York Preager 1966
94
Oxford Economic Atlas East African Community New York Oxford University Press 1972
Reed Moyer and Hullanderc Stanley Markets In Developing Economies Illinois R D Irwin 1968
Republ ic of Kenya Newsletter Washington D C 1975 Vol 3 No5
Richard A I Economic Development and Tribal Change Nairobi East African Publishing House 1969
Rosberg A and A Segal East African Federation Internatlonal Conciliation 1963
Samson H W The Climate of East Africa Nairobi Memoirs Vol II I No2
Schneider in W R Bascom and M J Herskovits Continuity and Change in East African Cultures Chioago University of Chicago Press 1959
Seggerson E P Physiography of East Africa Nairobi Press 1962
Southhall A W Growth of Urban SocletyI Dar-esmiddotSalaam New York Oxford University Press 1969
The East African East African Common Services Report Nairobi Kenya Government Press 1966
Thompson B W The Climate of Africa Nairobi Oxford University Press 1965
UNESCO Populatlon Movements in East Afrlca in K M Barbour and R M Prethere (eds) Essay on African Population Routledge and Kegan New York Oxford University Press 1961
Walder D Problems of Economic Development of East Africa In E A G Robinson (ed) Economic Development of South Sahara London McMillan 1964
Warren J Keezan International Marketing Less Developed Countries Englewood Cliffs New Jersey Prentice Hall Incorporated 1974
Wilson A M Social Change In Modern Africa New York University of Oxford Press 1961
Wilson M Gordon liThe Transformation of East Africa Basic Scale for Periodic Research New York Basic Books Printer 1971
S6
XION3ddf
bull
96
URSAN CENTERS
- bullbullbullo1
IL RUdDIf---J -
( L KENYA I
I I I
hlo10bull I I J
- Tllo
Tflgflylfl
-Dodo TAN3ANYllltA
It
bull Imp ~1 bull
JII
~ ~t - bullKlIer
~ ~ JIOlJLAIO
~ ~~ ~ (0 C~CV ~oo Lindl ~ a CO (1(( 00(tOO
c ~tCC a oocmiddot ~~ L Ny ~tWllra1 c ~~(V( 0 ~J(JC~ ~ l(l~5 7~ ~~~~ i~j~) ~J r =X 0 1 ~O _-A- J 0 100 bull - -
mil bull~~ ~__-- _ llo
l6
bull
o
MII bullbullbullbullbullbull bullbullbullbullbullbulll1li bull bull ~ =
middot1
bullbullbull bullbull~ pound
-w
)
umiddot~middot middotmiddotMI
c
gt amp c o
ImiddotUmiddotmiddot middotmiddot0 L
1 bull l
)
L
~
middotmiddotmiddotmiddot1 L
~
~
1 ~
~ ~ I ~ L ~
i 1 middotmiddotmiddotrmiddotmiddotI bull bull ~
I r j L
-r Y
I~ bull CL -J II w 1
VINVZNVl
eII_
fbullbull bull~1
~ r
z
c
o
11Ie
) 11111_0 -shy
N a n s
~______
middot~middot(1 -bullbull
__rr~)
I
I
I I I
~ I ~
I I I ~ I
vaNv~n
66
o
1 IIit
c
Cl
S iII III J
Ibullbullbull middot1t-11 1 114bullc ~~1
bull
001
INZN1L
10 l
r
01 bull 1middot ) l pltllI1 -tpn I I c
o
z
o
bull
J I
lt
- Njoroge 1975
- Njoroge 1975 pt2
-
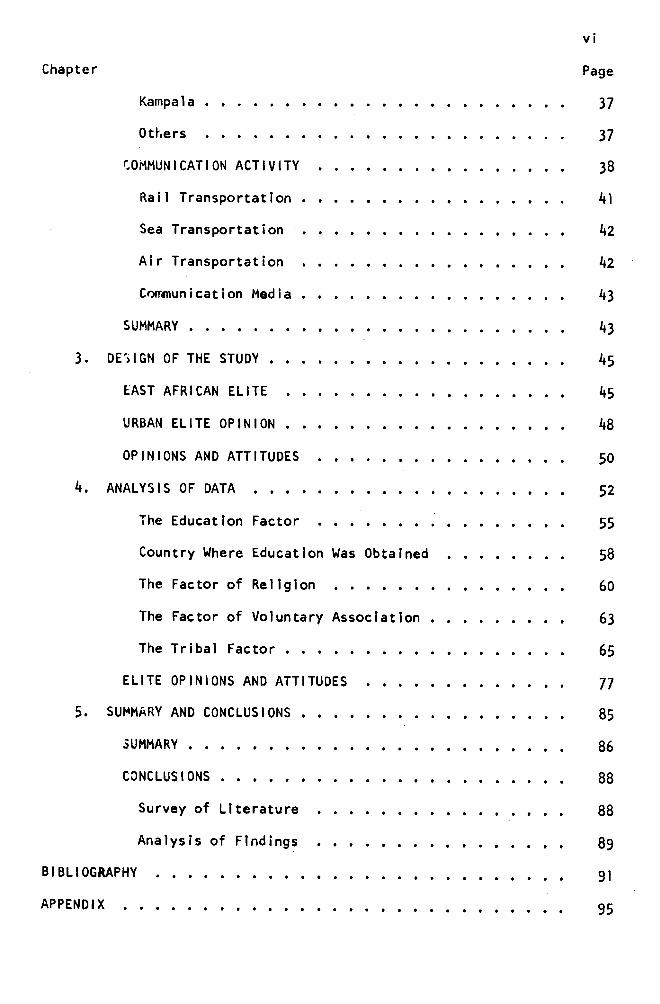
Chapter
3
4
5
vi
Page
Kampa 1a bull bull 37
Others 37
~OMMUNICATION ACTIVITY 38
Rail Transportation 41
Sea Transportation 42
Air Transportation 42
CQmmunlcation Media 43
SUMMARY bull bull 43
DE~IGN OF THE STUDY 45
lAST AFRICAN ELITE 45
URBAN ELITE OPINION bullbullbullbullbullbullbullbullbullbull 48
OPINIONS AND ATTITUDES bullbullbullbullbullbullbullbullbullbull 50
ANALYSIS OF DATA bullbullbullbullbullbullbullbullbullbullbullbullbullbull 52
The Education Factor 55
Country Where Education Was Obtained 58
The Factor of Religion bullbullbullbullbullbull 60
The Factor of Voluntary Association bullbull 63
The Tribal Factor bullbullbull 65
ELITE OPINIONS AND ATTITUDES 77
SU~MARY AND CONCLUSIONS bullbull 85
SUMMARY bull bull bull 86
CONCLUSIONS 88
Survey of Literature 88
Analysis of Findings 89
BIBLIOGRAPHY bullbullbullbullbullbullbullbull 91
APPENDIX bullbullbullbullbullbullbullbullbullbull 95
LI ST OF TABLES
Table Page
1 Mean Population Estimates Per Space Land (1968) bull bull 19
2 The Distribution of the African and the IINon-Afrlcan In Proportion by Cities 1968 bull bull bull bull 23
3 Transportation In East Africa (1963-73) 40
4 Co~municatlon Media (Thousands) 1963 43
5 Ea~t African Elite Age Factor By Percent 53
6 Ea~t African Elite Occupation Factor Sample by Percentage Distribution bullbullbullbullbullbullbullbullbullbullbull 54
7 East African Elite Specific Occupation Factor by Percent bull bull bull bull 56
8 East African Elite Education Factor By Percent (1972) bullbull 57
9 East African Elite Where Educated bullbullbullbull 59
10 Ea~t African Elite Religion Factor Compared to Population Percentage bullbullbullbullbullbullbull 62
11 East African Elite Voluntary Associations Factor By Percent 64
12 Tanganyika Elite by Tribal Group 66
13 Ugand3 Elite by Tribal Group 68
14 Kenya Elite by Tribal Group bullbull 69
15 Question 1 What in your opinion is the most Important problem facing our country at the present time1 70
16 Question 2 All things considered how satisfied are you with your present standard of llvlng--very sati~fied fairly satisfied somewhat dissatisfied
71or ~ery dissatisfied bull bull bull bull bull bull bull bull bull bull bull bull bull bull bull bull
vii
viii
Table Page
17 Qupstion 3 Do you think political matters should be left to the government or should people like yourself take some active part in political affairs 72
18 Question 4 Which one of the following do you think our country needs most at the present time more schools more hospitals more housing more factories or mere roads bull bull bull bull bull bull 73
19 Qu~stion 5 Now which one do you think our country fleeds most an honest government without corrpution ~ government that gets things done fair distribution of wealth national unity or individual freedom 74
20 Question 6 Which do you prefer--government ownership or private ownership of major Industries bull bull bull 75
21 Question 7 As you know there are many different ways in which African states can establish closer ties amoog themselves Which of the following ways would you favor an organization for settl ing disputes b~tween African governments closer economic relations political federation African military organization cultural exchanges 76
22 Sacle 1 It does not help much to try to prevent crops being damaged by insects and diseases such los ses can neve r rea 11 y be preven ted bullbull bull 77
23 Scale 2 A man should never marry a woman who does not belong to his tribe 78
24 Scale 3 People have it within their power to bring harm and misfortune to others through magic 78
25 Scale 4 Science and knowledge are useful of course but many important matters can never be positively understood by the human mind bull bull 79
26 Scale 5 A man ought always to obey his traditional chief 80
27 Scale 6 Government and politics are so complicated that the average man cannot really understand what is going on bullbullbullbullbull 80
28 S~~le 7 If I had the choice I would prefer to be given a small sum immediately rather than be promised a very large sum one year from now bull bull bull bull bull 81
ix
Table Page
29 Scale 8 A woman IS place is in the home bullbull 82
30 Sccle 9 The traditional ways of the past are the 82best
31 Scale 10 The present is all too often full of unhappiness it is only the future that counts 83
32 Scale 11 The government is doing all it can to develop our country bullbullbullbullbull 84
Chapter 1
INTRODUCTI ON
East Africa (Kenya Uganda Tanzania) is a land of great
variety (covering 683000 square miles) in physical features clishy
mate human type economic development and political evolution
al ike There are few places on earths surface ~here in the space
of a few hu~dred miles one can experience such a range of conshy
trasts O~e can pass from high mountain snow to the deepest lake-
filled troughs alive with tropical vegetation from the invigorating
climate of the highland areas to the dusty heat of rift valley (one
hundred to two hundred miles wide) or from bustling modern cities
to countrysid~ There are great differences in trade activities
from one area to another Finally there are in East Africa
conflicts of triLal and racial interests present in all parts of
the continent and great contrasts in the types of states which
have emerged from the race of independence 1
Politically with the exceptions of Ruanda and Burundi
Somalia Ethi~pia and Zambia the territories have been under Britshy
ish rule for many years and Engl Ish is the official language Most
of Kenya was a crown colony except the coastal strip which was a
lEI izabeth Hopkins Conflict of Tribal and Raciai Conshyflict in Stanley and Burke (eds) Transformation of East Africa (New York B~sic Books Printers 1966) p 375
2
protectorate while Tanganyika was administered by the British
under Uni~ed Nations trusteeship2 The British territories have
enjoyed common markets and certain services such as publ ic comshy
munications administered by East African Common Services today
known as the East African Community
East Africa is the meeting point for all the contlnents
major 1ingJistic groups Even Cl ick Language is represented
in Central Tanzania The three greatest sub-races (of African
origin) ar~ the Nilotics Nilo-himites and the Bantus 3
THE PROBLEM AND DEFINITIONS OF TERMS USED
Statement of the Problem
This study was designed to
1 Analyze the factors which have slowed the economic
development of the East African community
2 Identify the major problems encountered In economic
systems in East Africa
3 Determine the problems in developing the economic growth
of the comm~nity
4 Identify economic reconstruction needs
2Cloey and P Robson Federation of East Africamiddot Structure and Administration of E A C S O (New York Oxford University Press 1964) p 37
3W T W Morgan lEast Africa Its People and Resources People (New York Oxford University Press 1969) p 33
3
Importance 0f the Study
The economy of the East Africa community Is growing at a
high rate as projected yet the majority of the citizens of the
community remain on the poverty level In order to explain this
paradox we will look at the problems tending to withhold economic
success from many members of the community
Limitatlo~s of the Study
The study has the following limitations the data in
this study are limited to that available at the William Allen
White Library at Emporia Kansas State College and through their
facilities through interlibrary loans As Indicated in much of
the relevant data surveyed much of the available material is not
current 4
Assumptions
Certain assumptions underlie this study These assumptions
can be summarized as follows
1 The environment in which the desired economy operates
is such t~at the beneficiary does not readily appreciate the value
of change and thus lacks interest in It
2 The East African citizen is suspicious of accepting
the change to more progressive socioeconomic standards
4
DEFINITIONS OF TERMS USED
Arusha
The capital city of East African Community (1967 Declarashy
tlon)5
Dar-es-Salaam
Capital and largest city in Tanzania It is also one of
6the chief port cities of East Africa
Duka
Small shops normally operated by a single family7
E A C or Eo A
Abbreviation for East African Community Is an economic
organizaticn consisting of three member countries of Kenya Uganda
and Tanzania (associate members include Zambia Ethiopia Somal ia
and Burundi) The existing community is based on a treaty signed
in Kampala on June 6 1967 to preserve and re-establish a large
part of the corporative relationship that was disappearing 8
5A W Southhall Growth of Urban Society Dar-es-Salaam (New York Oxford University Press 1969) p 483
6 Ibid p 481
7J bull Keezan Warren International Marketing Channels Less Develo ed Countries (Englewood Cliffs New Jersey Prentice Hall Incorporated 197 p 309
8Andr~w M Kamark liThe East African Community The Ecoshynomics of African Development (New York Praegam Incorporated 1971) p 5C
5
Gazetted Township
Go~ernment official papers classifying towns population
by residenc~9
Great Rift Valley
Geologically this structure is called a Ilgra ben 1I This
valley exte~ds as a series of depressions from Syria through the
Dead Sea (the surface is nearly 1300 feet below sea-level) to
Africa In East Africa It divides into two branches western
and eastern Igneous activities and volcanoes are associated with
the rift valley forming such peaks as Kllimanjaro these are now 10
dead
Kampala
Th~ capital and the largest city in Uganda It was made
the capital In 1962 when Uganda previously a British protectorate
bull d d IIbecame an In epen ent nation
Municipalities Grade A amp B Townships
Gr~de A -- Municipal towns these towns have populations
above sixty thousand
Grade B -- Townships under local government authorities
12Normally these towns have populations below sixty thousand
9Rbull ~ Abraham IIEast African Townshipl In A W Southhall (ed ) Social Chane in Modern Africa (New York Oxford University Press 197D) p 33
lOE P Seggerson Physiography of East Africa (Nairobi Na I rob I Pless 1962) p 10
Ilsouthhall op cit p 477 12Abraham loc cit
bull 6
Nairobi
The capital and the largest city In Kenya with a population
13nearing one million people according to the 1971 population census
Non-African
A resident who is an Immigrant from other continents besides
Africa The majority of Non-Africans are Europeans and Asians
(Indians)14
Pound
East African sterling currency (Pound~) 1 ~ bull shs 20
Equivalent to $28 u S currency 1975 15
Settlers
European immigrants farmers to the East Afrlca 16
Shillings
East ~frican sterling currency (shs) shs 20 z l~ 17
13Southhall op cit p 469
14Abraham loc cit Non-Africans comprise people (male or female) of European or American origin Arabs Indians and Far East Asians
15K~nya Newsletter issued by Section of Embassy Republic of Kenya Jashington D C Vol 3 No5 (1975) p 28
16Ellzabeth Hopkins IRacial Minorities in British East Africa in Stanley and Burke (eds) Transformation of East Africa (New York Basic Books Printers 1966) p 87
17Kenya Newsletter loco cit
7
Swahili
A language of the coastal population of East Africa roughly
from Southern Somalia to Mozanlbique and including Zanzibar and
the Comoro Islands It Is spoken by about 15 million people as
a first langu~ge this includes the people In East Africa and
Congo (Klns~asa)18
METHODS OF PROCEDURE
All the published materials listed below were extensively
reviewed Thl~ included library review of both periodicals and
relevant st~dies The writing of this report is thus based on
the Information provided by the following
1 Periodicals books pamphlets and microfilm from the
William Allen White Library of the Emporia Kansas State College
2 Xeroxed materials and books that were secured through
the inter-library loan and from friends
3 uata collected specifically for use In this study by
the Marco Survey Ltd Nairobi Kenya
4 Periodicals Issued by the information section of the
Embassy of the Republic of Kenya Washington D C
PLAN OF STUDY
In the preceding section the purpose of this study Its
importance the limitations assumptions definitions of terms
18Encyclopedia Americana Swahili Vol 26 (1974) p 85
8
and methods of procedure have been outlined Related literature
largely stu~ies of structure with regard to economic development
in East Africa is presented in Chapter 2 Chapter 3 presents a
background of pertinent economic facts concerning East Africa
Chapter 4 deals with an analysis of factors In Chapter 5 the
data is summarized and conclusions are drawn
Chapter 2
THE REVIEW OF RELATED LITERATURE
British East Africa was the name applied to the territories
In East Africa before they achieved Independence The territories
Included the ~olonles and the protectorate of Kenya the United
NatIons trust territory of Tanganyika and Uganda These territories
had a total area of 682469 square mlles l British East Africa was
economicalya system of joint services The East Africa High
Commission which consisted of the Governors of Kenya Tanganyika
and Uganda was responsible for the administration of public services
and functions common to territories including currency roads
customs apd communications Each territory1s government retained
responsibility for local services such as health education and
police 2
After World War I I nationalist feeling was strong throughout
British East Africa As the deadline for Independence approached
Britain attempted to form a federation of East Africa but separate
nationalist aspirations made this Imposslble 3 Tanganyika was the
IEncyclopedla Americana East Africa Vol 4 (1974) p 578
2East Africa Geographical Journal Vol 129 Part 2 1963 pp 140-155
3Abull Ro~berg and A Segal East African Federation IIlntershynational Concll iatlon11 1963 p 30
9
10
4first of the four territories to achieve Independence In 1961
Uganda became independent In- 1962 The following year Kenya and
Zanzibar entered the ranks of Independent states Tanganyika and
Zanzibar merged In 1964 and adopted the name United Republic of
Tanzania 5
After Tanganyika became Independent the East African
High Commission was suceeded by the East African Common Services
Organizatior which performed the same functions as its predecessors 6
Finally the East African Common Services became the East AfrIcan
Community The East African Community was formed to establish a
customs union to facilitate the industrial development of the
area and to carryon research activities and common services preshy
vlously controlled by the East African Common Services organization
The community was re-establlshed by a treaty signed by three member
nations In Kampala Uganda on June 6 1967 7
The community provides for free intercommunity trade and
a system of c~nmon external tariffs there Is also a system of
transfer tnxes that may be Imposed on certain commodities Imported
from other members by a country with a trade deficit wIthIn the
other two members Transportation and communications services
are handled by community corporations for raIlways harbors post
4 Ibid p 8 5 IbId p 12 bull
6Encyclopedia Britanlca East African Community University o~ Chicago Macropedia Vol I I I (1974) p 754
7The East African East African Common Services Report (Nairobi Kenya Government Press 1966) p 3
I I
and telecommunications and alrways8 The East African Development
Bank established in 1967 provides and emphasizes projects that
tend to make the three economies complementary9 Although all
three countries contribute on an equal basis to the bank Kenya
the most advanced receives a smaller share of Investments and
guarantees In accordance with the policy of even development among
the states
East Africa is also the meeting point for all the continents
major linguistic groups Even Click Language l is represented in
Central Tanzania
EAST AFRICAN GEOGRAPHY
Regional Survey
East Africa borders the Indian Ocean for about eight hundred
miles and the coastlands form a very distinctive zone although
the plain Is only one hundred miles wide around the Kenya and
Tanzania border IO Winds from the ocean bring a high ralnfal I
to most of the land close to the coast This fertile land Is quite
densely populated The rainfall drops quite rapidly Inland and
land quickly becomes arid and sparcely populated As one travels
from the Iterior towards the coast the change from scared bush
to forest is evident
8 Ibid p 9
9East African Community Annual Report (Nairobi Kenya Government Press 1969) p 38
IOCharles H Gpod Jr Dimensions of East African Cultures (New York Oxford University Press 1970) p 8B
12
Some of the special characteristics of the coastland stem
from the fact that many people have approached them from the sea
and have ~ot penetrated far inland Although most of the population
is African there is a substantial Arab settlement in sharp contrast
to the rest of East Africa Mombasa Is an old town (see map of
East African cities on page 96) Dar-es-Salaam and Tanga are not
These three cities are distinctive In that through them passes
most of the foreign trade of East Afrlca ll This tends to quicken
the pace of economic activities there although In the whole zone
the high temperature (high humidity) resulting from the low altitude
tends to slow It down
The coastal zone Includes the islands of Zanzibar and
Pamba and Mafia together They constituted a separate state for
middotover one hundred years until they joined with Tanganyika to form
anew state of Tanzania in 1964 12
The Nyika Plateau
Away from the coast the land rises fairly gently to flat
plateaus covering between 3500 to 5000 feet above sea level
known In some areas as Nyika (Swahili for wilderness) This is
an area of short rainfall poor scrub vegetation and very sparce
13population separating richer lands In the Interior from the sea
llA M Wilson Social Change In Hodern Africa (New York Oxford University Press 1961) p 35
12Carey Jones Geographical Journal Vol 131 Part 2 (New York Oxford University Press 1965) p 186
lnE P Seggerson Physiography of East Africa (Nairobi East Africa Publishing House 1962) p 10
13
It is broken by mountain ranges notably Usambara and Pare mountains
Taita h1115 where relief brings about a higher rainfall and where
more people have settled Further south it is broken by a zone
of lowland in the basins of the Ruaha and Rufingi rivers where
settlement Is discouraged by periodic floods and disease rather
than by low r3infall Water scarce in East Africa is abundant
there and cen be controlled This area offers promise for future
agricultural development In the south of Tanzania the plateau
reappears but the rainfall exceeds thirty inches in most years
and much of the land is under cultlvatlon 14 The rainfall Is
unreliable soil is poor and the area is remote from central
economic life in Tanzania 15
Th~ highland south of the Nylka has recent volcanic rocks
It stands up as highlands reaching to 19500 feet including
KilimanJaro Mt Kenya and Elgon (see map on page 14) From the
land over seven thousand feet above sea level it extends three
hundred miles westward almost to the shore of Lake Victoria Although
It Is brokpfl by the lINorth Rift Valleyll (not shown in the map)
the floor of which in places lies six thousand feet below the land
to either side 16 In this highland heavy rainfall and fertile
volcanic soils provide excellent conditions for agriculture Much
14gt H Johnson Rainfall in East Africa Q F R Vol 5 88 (Nairobi East Africa Publishing House 1962) pp 1-9
IS ibid p 10
16Seggerson Ope cit p 10
ofx-----_ - -~~ -----------~
QOO 000 ~I)
-==----=-----shy
~ )00 -OOOt
Wi~Z1 ~ OOOt -0001
u
o
z
o
15
of the land Is under cultivation but the fruit of this agricultural
production is offset by the dense population 17
Lake Victoria Basin
The land falls slightly northward from the central plateau
of Tanzania towards the Lake Victoria Basin and the densIty of
the population is increased greatly The Basin is one of the
richest zores of East Africa supporting over a quarter of the
population of the regIon The country receives more rain and
has more fertile soil than that to the south and advantage has
been taken of its agricultural opportunities The land around
the lake in some ways forms a single unIt although it is divided
among the thr~estates This region Is densely settled by farmers
who produce much cotton as well as animal food crops also bananas
(Uganda) a~d coffee providing a green landscape all year around 18
THE ECONOMY
Subsistence Economy
In terms of the actIvity of an average East African man
or woman the subsistence element in East African economies is
probably still domlnent 19 That is to say the amount of time
the average East African spends on activities that merely keep
17w T W Morgan and N M Shaffer Distribution and Density (New York Oxford University Press 1966) p 36
18 Ibld p 38
19~ F Johnson The Sta Ie Food Economics of Tro ical Africa (Stanford Californ a Stan ord UnIversity Press 1970 p 142
16
him alive ana functioning is greater than the amount of time he
spends ear~ing discretionary income The average East African
is more in than out of the subsistence tribal economy20 He produces
most of the goods and services he consumes
The permeation of the money economy throughout Africa not
only has considerable importance in Its own right but will influence
the whole pace of economic development In the future It is almost
impossible for anyone who has not lived in a subsistence economy
to appreciate how profoundly it affects ones activities and outshy
look To live in a subsistence economy means to live a hand-toshy
mouth existence in a world of great risk and uncertainty Without
the techniques or facilities for storage of food over any appreciable
period the East African is dependent on the yearly crop or his
luck In hunting or fishing Nearly every people have a hungry
season ll when the 1ast season I s crop has been eaten and the new
crop has not yet come In The risk and uncertainty affecting a
whole community is less with the spread of the money economy
because It is possible for individuals both to create a margin of
security for themselves by setting aside a permanent store of value
In the form of money and to survive apart from the communlty21
The Public Sector
From a comparatively late point In the development of East
Africa the government role in the economy was a major one The
private investments and the stimulation of production was encouraged
20 Ibid p 151 21 Ibid p 147
17
by the gov~rnment The corollary of this Is the continuing imporshy
tance of the government as employer and of the publicly owned
sector generally in the national accounts
In East Afri ca Ilcurrent government expend i tures run over
15 percent of the gross national expenditure 1I22 If one adds the
operations of the railway electricity authorities ports etc
and the investments in the whole part public sector the total
approaches Hone-third of the gross domestic product-II Together
they are therefore the dominant economic influence in the money
economy of East Africa 23 Many East Africans expect the state
or public agency to be their employer This has the effect of
reinforcing o~e of the worst heritages of colonialism--the East
Africans arceptance of the idea that the best job to have is a
government post
Excessive Expectations for Public Service
The paternalistic attitude of colonial administration
particularly after World War II also left behind the habit of
expecting co~siderable benefit from free public services--free
schools iree medical services free or subsidized electricity
and subsidized housing 24
22Enclc loped ia Amer icana East Afr ica Vol 4 (1974) p 576
23 Ioid p 577
24Abull H Jamal The Critical Phase of Emerged African States (Afairasi East African Publishing House 1965) p 101
18
The colonial government provided most of this for East
Africa1s cities--usually at the expense of the lIagr icultural popushy
lation I But with the growth of the cities and the legitimate
pol itical de~and for the expansion and extension of these services
throughout the land it becomes financially impossible to maintain
them on the uneconomic basis of the past It is also economic
nonsense to consume resources In subsidies rather than use them
for economic development 25
Thr~ughout the world pressure for such services Is present
The way it is kept in line with what Is economically feasible Is
either to charge the economic price or to hand over responsibility
for the services to the local government concerned in which case
the citizens can make a choice between paying higher taxes or using
26the money for other purposes But with the usual East African
centralization of responsibility for these services in the national
government this economic calculus does not occur so Immediately
and directly Pressure for the services thus tends to lead the
East African governments constantly to Increase their expenditures
for them and to give lower priority to other investments that might
In fact re~ult In faster growth of the national income 27
25Ibid bullbull p 129
26 1bid p 159
~~ 71bid p 179
19
POPULATION DISTRIBUTION
Accorciing to the mid-year population estimates for 1968
the population of East Africa was 268 mllllon 28 Based on the
total land area of 642252 square miles mean populatIon density
of forty-two persons per square mile is obtained When compared
with the m~jor countries of Europe and Asia the mean population
of East Africa is very low According to the 1961 census India
had a total population of 438 million on an area of 126 mil lion
square miles with a mean population density of 319 persons per
square mile 29
Table
Mean Population Estimates Per Space Land (1968)
Estimated Total Land Area Population Mean Population
(Square Mi les) 1968 Per Square Mile
Kenya 219789 9104000 41
Tanzania 342171 10325000 30
Uganda 80292 7367000 92
Regional Population
The population of East Africa may be broadly divided into
three main categories first those around the shores of Lake
2EOxford Economic Atlas East African Community (New York Oxford University Press 1972) pp 174216 and 221
29lbid
20
Victoria ~econd those In the highlands country and In the footshy
hills of the major mountains third those in the coastal belt 30
Lake Victoria Is ringed on almost all sides by areas of
dense population In Tanganyika the lake and west regions which
surround the southern half of the lake comprised in 1967 a popushy
lation of some two and a quarter million over a quarter of the
total popuialon of Tanganyika although the land area formed only
one-eleventh of the countrys total On the north-western and
northern side of the lake the Masaka Mengo and BU50ga districts
of Uganda contained in 196B two and one-half million people
Finally on the north-eastern side Luo country in the Nyanza Province
of Kenya likewise showed In 1968 comparable densities of over two
hundred persons per square mile 31
In the group of the mountain areas we must include the
thickly populated districts of Central Province of Kenya where
the Kikuyu Embu Meru land units cluster In some districts popushy
lation densities range to two hundred to five hundred persons per
square mlleo North Nyanza and around the slopes of Mount Elgon
have densl~ies varying from three hundred to five hundred per square
mile whil~ on the western side of the mountains Uganda districts
have similar densities of between two hundred to three hundred
persons per square mile In Tanzania the category of thickly
populated mountainous regions includes the southern slopes of
30w T W Morgan and N M Shaffer op cit p 29
31Ibid p 27
21
Kilimanjaro ard Mount Meru and Livingstone Mountain in Southern
Highlands 32
The coastal belt consisting of a strip of low lying country
constitutes o~r third region of highly populated density This
area has beell subject to substantial immigration The population
was attracted not only to coastal cities but also by the large
sisal and sugar industrial plants oil refinery and shipping labor
which have drawn immigrant labor from all parts of East Africa 33
Urban Population
Precise international comparisons tend to be vitalized
by the fact that the destination of urban population varied from
country to country and from census to census It Is also true
that urbanization of the population of East Africa is extremely
low
In the Tanzania census of 1968 thirty-three Igazetted
townships were defined which comprises an aggregate population
of 664072 persons of all races or 51 percent of the total popushy
lation of the country34 Of this population over a third were
In Dar-es-Salaam (228742) and Tanga (138053)
In Uganda the census of 1968 contained as gazetted townshy
shlps those which comprised an aggregate population of 409075
32Seggerson Ope cit p 138
33lbid p 139
34Rbull G Abraham East African Townshlp In A W Southhall (ed ) Social Change in Modern Africa (New York Oxford University Press 1970) p 300
22
persons of all races or 2 percent of the population of the country35
Of these over one-third consisted of the populations of Kampala
and Jinja For the purpose of the Kenya population census urban
areas were divided into four categories municipalities grade
A townships grade B townships and trading centers 36 Not all
trading centers were defined as separate census areas and when
the results of the census were obtained it was found that several
of the grade B and even some of the grade A II had such small
populations that they could scarcely be regarded as towns in the
normally accepted meaning of the word The author therefore
defined urban areas as towns with a total of over two thousand
people There are approximately thirty-four towns of over two
hundred population
PEOPLE
It is difficult in the tradition of great social and cultural
diversity to distinguish East Africa by tribe but it Is very
difficult to give definitions of units that will accommodate the
wide range of factors Clearly tribe has reference to a distincshy
tlve group of people that possess the heritage of a common culture
lithe total of their forms of social organization historical trashy
ditions la~ and customs value and beliefs 1I37
35Ibid p 310 36 Ibid p 312
37w T W Morgan East Africa Its People and Resources People (New York Oxford University Press 1969) p 34
23
ThuD it is necessary to be somewhat arbitrary in disshy
tinguishing the various people of East Africa The term tribes
has the same sort of imprecise usefulness difficult to define
specifically as the term c lass in western industrial ized
countries 38 The late Dr Leaky (archeologist and sociologist)
classifies East African people into three distinctive parts
They are broadly classified on III inguistic and traditional basis ll
I into Nllotes Nilo-hlmites and Bantus 39 Such distinctions are
i 1 1 Table 2 1I The 0 1st r ibut ion of the Af r ican and the IINon-Af r ican ll
I in proportion by Cities4 1968 0
I 1 1
Country African INon-Afr Ican ll
Tanzania 4 1 721
Uganda 30 850
Kenya 53 850
very adequa~e to the actlvltes and interests which are of concern
to the people themselves in their ordinary lives For example
the Luo (nilotic) with their communal living society and with a
mixed economy of agriculture do not resemble the Masai (nlloshy
hlmltes) with their pastoral economy who are non-farmers they
~ 38 10 id p 36 39Ibid p 38
4UR G Abraham op cit p 318 IINon-African ll comprises people (male or female) of European or American origin Arabs Indians and Far East Asians
24
do not eat sea food The Bantus In East Africa (found mainly on
the southern hemispheres of Africa) have an exceptionally wide
range of cultures and economic systems 41
The Tribal Iassification
The term East African people identifies about 11110 different
people in the mainland Tanzania about 35 in Kenya and about 37
In Uganda42 Of these five comprise over a million people each
forty-threp exceed one hundred thousand people The smallest
tribes contdln only a few hundred people but their culture intershy
mediate zo~es are generally between one and another 43 Blackers
book of East African lIdemography provides an adequate overall
account of the traditional culture and social system of perhaps
thirty of these tribes 44
A number of larger and Important tribes remain still
undescribed by modern standard needs Published studies of social
and economic changes In recent decades are fewer even for those
people such as Kikuyu and Chagga where change has been most
radical Most books dealing with the traditional cuiture of East
African people were written many years ago and are not reliable
41Morgan Ope cit p 40 42 1bid p 36
43E A Blacker lIDemographyl1 (New York Oxford University Press 1948) p 43 The best general surveys of available Inforshymation are contained In the volume of the lIEthographic Survey of Africa (East Central Africa) 11 (London International African Institute 1970) p 70
441 bId p 79
25
guides for the study of people of East Africa in the second half
of the twentieth century
Historical Clusters
Although some tribes remain as little more than names on
the enthographlc map It Is possible to group the better known
people Into clusters which are identifiable In terms of common
historical traditions linguistic similarities and certain related
social Institutions and values As far as present knowledge goes
the following clusters are fairlyclear Only the larger tribes
are indlca~ed In the lists
Tribal names are given in their root forms
(a) Nilotes--Acholi Alur Lango Luo Padhola (b) Nilo-Hamites--(eastern Nilotes)
1 Teso Cluster--Karamojong Teso Turkana 2 Kalegln-Elgeyo Kipsiqis Nandi Tuqen 3 Masal Cluster--Arusha Masal Samburu 4 Tatoq Cluster--Barabalg
(c) Inter-custrlne Bantu--Ganda Ha Haya Klga Nkole Njoro Rundl Rwanda Soya Toro
(d) Elgon Bantu--Aisu Lugya (e) North Eastern Bantu--Chagga Embu Gusli (kissl)
Kamba Kikuyu Meru Mbere (f) Coast Bantu-Bondei Olgo Mljikenda Sambaa Zigua (g) Nyamwezi Cluster--Bena Hehe Sangu (h) Luguru Cluster--Kaguru Luguru Ngru4(I) Rouma Cluster--Makinde Makua Mawia 5
In no case are all the people of a cluster identical In
their econOOlic system In terms of their traditional economic
systems and the exploitation of the natural resources a more undershy
standable classification can be made In the following way
45 1bId p 15
26
A Primary Pastoral Economy with little or no agrlculture-shyBarabaig Boran Masal Redille Saburu Somalia Pastoral suk Turkana
B Mixed Pastoral and Agricultural Economy I Pastoral Ism predominant--Aogo Karamojong Klpsiqis
Kuna Nandi 2 Agriculturalism predomlnant--Arusha Bela Klssl
Ha Hehe Iraqw Iramba Kamba Lango Luqbata North Luhya Luo Njakjusa Padhola Rangl Hlgland Suk Sukuma Teso Tugen Turu
C Mainly Agricultural Economy with minor pastoral Interests--Acholl Alur Chagga Embu Alsu Kikuyu Nyoro Sambaa Toro
D Primary Agricultural Economy with little or no husshybandry--Digo Ganda Haya Klga K~gjO Makua Ngorl Ngindo Nyanwaz Soga Yao Zaramo Zlqua
There have been great basic changes that have occurred in
the last two decades toward a greater development of agricultural
Interest slight disappearance of tribal territories (traditions
of belief) due density Increasing demand for cash income and
greater att~nton to crop production husbandry by government and
47commercial concerns
AFRICAN HERITAGE
In general African cultural social background relevant
to economic development is very different from that of any other
developing region of the world Because of Africas geography
great size and climate It was after 1900 that the Influence of
the rest of the world began to reach most of Africa South of
Sahara 48
46 I bid p 2I bull 47Morgan Ope cit p 36
48~ K~ Schneider In W R Bascom and M J Herskovlts Continuity and Change In East African Cultures (Chicago University of Chicago Press 1959) pp 144-167
27
Perhaps there is a need to break the old African tradishy
tional heritage that Is passed to modern Africa A study of the
old African economy shows that it was one In which the methods of
production were simple and the units of production were small
The mlddle-nlen were both hated and Indlspensible Agricultural
progress was seriously impeded by the perpetuation of communal
right-over land 49 Chronic underemployment was one of Its basic
problems and despite moral exhortations among the people the
propensity to save was low It was an economy heavily dependent
on foreign sources for improved Industrial and agricultural methods
and to so~e extent for capital 50 The ambitious young men often
preferred careers In the professions and government service Men
here wrongly pinned their hopes on industrialization and economic
nationalism to absorb Its growing population Industrialization
was slow to come and the blessing of economic nationalism proved
to be mixed 51
The Extende~ Family
Perhaps even more Important than economic outlook both
positively and negatively Is the Inheritance of the continuing
strength of the tribal ties to which nearly all East Africans are
subject To begin with one must consider the L1neage Systems
49bld p 152
seA I Richard Economic Development and Tribal (Nairobi East African Publishing House 1969) p 78
Change
51lndustrlallzatlon In East Africa 5th Edition by United Africa Press Natrobl 1966 p 87
Published
28
or extended familyll--under which an individual has deep ties with
and feels obligation to a large number of people beyond the nuclear
family of the fathers mother and chlldren 52 Good fortune is
shared with m~ny others and In crisis one Individual can calion
help from many others
UnfCrtunately in terms of potential economic development
the extended family has many drawbacks It tends to discourage
Individual enterprise and Initiative as the burden of family
53obligations rise with the degree of an indlviduals success
There are other drawbacks Family crises tend to prevent
accumulation of capital or drain away the discretionary purchasing
power 54 The people with small incomes find it hard to comprehend
the greater cost of living of individuals with higher incomes
The age structure for the East African population is sigshy
nificant for as In most underdeveloped countries a large proshy
portion of the population is not of working age 55 Children of
fourteen years or under account for about 45 percent of the total
population which is comparable with the figure for Nigeria or
Brazil and in East Africa many children assist in picking cotton
or herding cattle Nevertheless productivity Is generally far
lower than that of adults and as increasing numbers of children
52UNESCO 11Popuiation Movements in East Africa in K M Barbour an~ R M Prethero (eds) Essay on African Population Routledge and Kegan (New York Oxford University Press 1961) p 96
53Ibid p 98 54( bid p 100
55L H Brown in E W Russell (ed) The Resources of East Africa (Nairobi Llterative Bureau 1968) p 102
29
attend school their contribution is decreasing although education
should enhan~p their income earning capacity in the future
Sh~rp contrasts in age and sex structure exist within East
Africa generally resulting from migration In NJombe and Songea
districts in Southern Tanzania about one-third of the adult men
are usually away Thus adult males make up a much smaller proshy
portion of the resident population than is normal The situation
is similar on~ thousand miles away in west Niles District of Uganda
The males of sixteen or over account for only 22 percent of the
population compared with the national average of 28 percent and
In the Kingezi District less than 20 percent were adult men according
to the 1969 census The absence of adult men Is even more marked
in parts of western Kenya for they comprise only 17 percent of
56the Kakamega District In the Kenya 1968 census
In Q1I these areas the high ratio of children to adults
tends to lo~er the level of economic activity This is not true
of the preponderance of women among the adults for they generally
do more work than men but the ratio of men to women may affect
57the economic activity in each area
Con~ersely an unusually high proportion of men of working
age means ~)re development 58 This is most evident in the cities
but also applies to larger areas such as Buganda or Tanga regions
Other factors must be favorable to attract people but the relatively
56Fred A Burke The Economics of Underdeveloped Countries (New York Oxford University Press 1972) pp 11-15
57 58Ibid p 29 Ibid p 30
30
high level of activity In areas such as Buganda is certainly related
to the age and sex and especially to the numerous Immigrant men
who either work as laborers or grow cash crops on their own account
there rather than In their home area
THE ECONOMIC ACTIVITIES OF EAST AFRICA
Trading Is an extremely Important economic activity even
though It Is not Itself productlve 59 By redistributing goods It
increases their value and It provides much employment in the process
Yet trading is sometimes omitted In studies In marketing geography
partly because of little data available on internal trade in East
Afrlca 60 However the main tradIng pattern of the regIon may be
outlined
Trade plays a smaller part In East African life than in
that of more highly developed regIons where peoples wants are
greater and where they satisfy few of their own requirements It
Is less Important even than in West Africa where It forms the
main Inter~st of an enormous number of people 61 Most East African
people produce theIr own food and cannot afford to buy many other
goods Nevertheless some goods are now sold In many parts of the
region and the proceeds are used to buy goods produced elsewhere
Commerce Is thought to contribute about 10 percent of all paid
59M Andrew Kamark The Economics of African Development (New York Praeger 1971) p 68
60 1bld p 98
61 Abull I Richard Economic Development and Tribal Change (Nairobi East African publishing House 1969) p 83
31
employment This commerce was mainly introduced since 1900 but
It has been superimposed on the traditional pattern of small-scale
trade which has not been entirely superceded
The Importance of trade In East African life has greatly
increased thrQugh the development of new forms of exchange which
Involve selling of goods for cash and buying goods produced far
away Ori31nally such trade consisted almost entirely of sales
for export overseas and the purchase of imported goods but today
an increased volume of sales Is to other parts of East Africa and
many of the commodities purchased have been produced within the
reglon 62
ThIs type of trade has provided the main basis for urban
development Both the large cities and the small towns of the
regions owe much of their present Importance to their trading
function even though many originated as administrative stations
within most rural areas the settlement pattern Is highly dispersed
and the clusters of bui ldlngs which are sometimes termed villages
usually consst mainly of IIdukas 163 Host of these small trading
centers grew up to handle the Import and export trade although
many now serve as markets for local trade
In review of a survey conducted by Keegan East Africa dukas
are very small carry one hundred items and occupy no more than
62Dbull A Hawks Official Journals East African Trade (Nairobi East Afric~ Publishing House 1963) p 10
63Warren J Keegan Multinational Marketing (New Jersey Prentice Hall Incorporated 1974) pp 308-9
32
fifty to seventy-five square feet 64 This indicates that the dukas
were operating on an average gross margin of approximately 12 percent
which is considered to be lower cost form of distributlon 65 The
East African duka Is highly Inefficient as a form of distribution
because the sales per person in the duka are much lower to keep
the duka developing significantly with the community economy
THE DISTRIBUTION OF TRADING ACTIVITY
Nairobi
The most important center of trade In East Africa Is Nairobi
A photograph of Nairobi Is provided on page 33 to give an example
of the modern cities of Africa Administration manufcaturlng and
commerce are three main functions of the city and are all comparable
In importace each employing more than fifty thousand people 66
The 1960 survey of distribution recorded one thousand wholesalers
In and out of a total for Kenya of three thousand It recorded two
thousand retail establishments compared with similar numbers In the
next nine towns of the country together 67 The value of all sales
by these ~airobi traders in 1960 was shs 400 billlon 68
T~e great Importance of Nairobi as a trading center Is
related to the fact that it performs trading functions at several
levels In some fields It serves the whole of East Africa and
64 Ib id p 308 65 Ibid p 309
66Mcrgan op cit p 70 67 Ibld p 72
6RKenya Chamber of Commerce Trade (Nairobi Kenya Governshyment Press 1973) p 5
34
in more ways it serves Kenya and Uganda and a small part of
Tanzania
In retail trade Nairobi serves a large area part of which
is relatively prosperous Its pre-eminence has probably hindered
the growth uf neighboring towns such as Limuru and Ruiru as shopping
centers Even Thlka thirty miles north of Nairobi Is more Important
in manufacturing than In trade 69 Much of the retail trade of
Nairobi however Is dependent on the large population and purchasing
power of the city itself Many people obtain their living by supplying
the needs of the administrations Industrial workers and even the
establishment of groups of up to thirty shops at various points
throughout-the higher class suburbs 70
The iMportance of Nairobi Is trade and Is related to Its
functions as the capital of Kenya and In some respects as administrashy
tive center for East Africa There Is a close relationship In which
its Importance In such fields as banking and Insurance are also
involved T~o other factors which favor Nairobi more than possible
rivals SLch as Mombasa are Its centrality in both Kenya and East
Africa and Its location on the eastern edge of the most prosperous
part of the region No town Is better placed to serve the whole
of Kenya or to serve all countries especially since means of comshy
munication have been on Nairobi The country south and west is
sparcely populated but In that to the north and east much purchasing
power Is concentrated There are substantial ve~y affluent European
69 Ibld p 6
70Ibld p 9
35
and African settlements which are of increasing significance as
71cash Income rl5es
Mombasa
Mombasa is not only the leading port In East Africa but
also a major center of trade The first function has led to the
second and the two together have enabled it to become the second
city of Kelya with a population of 380000 (1969 Census)72
Although many importing and exporting firms have headquarters in
Nairobi and their goods are consigned directly to or from the
port many others have offices in Mombasa and compete successfully
for the trade of a large part of East Africa Most traders in
Moshi for example and many in Kisumu or Kampala obtain supplies
through Mombasa importers The export marketing trade provides
much employment outside the port area far apart from private firms
concerned mainly with exports The Uganda Coffee and Lint Marketing
Board has large warehouses In Mombasa 73
Mombasa functions In retail and local wholesalers markets
but this activity Is small in relation to its size Its sphere
of Influence is inevitably reduced by its coastal location while
much of its immediate inner land is arid and sparcely populated
The ships calling at the port provide extra trade for they generally
71A M Wilson Social Change In Modern African Trade (New York Oxford University Press 1961) p 193
720xford Economic Atlas (New York Oxford University Press 1974) p lQ7
73Encyclopedia Americana East Africa Vol 4 (1974) p 579
36
take on some supplies and their crews and passengers often spend
some time clshore However this is of small Importance In comshy
parison with the export trade
Dar-es-Salaam
In some ways Dar-es-Salaam combines the functions of Nairobi
and Mombasa since it Is both the capital and the leading port of
74Tanzania Each of these roles encourages trade and the city
is much the most Important center of trade In the country On
the other hand It does not dominate the whole country as much
as Nairobi and Mombasa together dominate Kenya for both North
and South have only limited marketing connections with It Arusha
and Moshi have closer tradIng links with Kenya cities and with
the port of Tanga Bukoba has closer ties with Uganda and Kenya
and Mowara Region Is often linked physically with the capital only
by sea and It is therefore commercially Independent to some extent
Dar-es-Salaam also plays a smaller role than Nairobi and Mombasa
combined It Is comparable In size with the latter and Its inhabishy
tants are very much dependent on Its trading functions It is the
main center of import export and wholesale trade for the area
of 280000 square miles and a population of 19 million people 75
It Is also the center of small-scale wholesale and retail trade
for the coastal region while the purchasing power of the city populashy
tion is sufficient to support a wide range of specialized shops
74B F Joh~son The Sta Ie Food Economics of Tro leal Africa Tanzania (Stanford Stan or UnIversity Press 9 p 131
7Ibid p 26
37
Kampala
Kampala is smaller than the three cities mentioned above
but it is very clearly the commercial capital of Uganda Several
of the major importtng and exporting firms of East Africa have
branches there and merchants import goods directly from the port
of Mombasa Many of the businessmen are middlemen who buy from
Nairobi or Mombasa wholesalers and who often sell to other wholeshy
salers in sm~ller townsJ6 Kampala controls most of the trade of
Buganda and Western Uganda but less of that of the east and north
Thus whereas little is obtained their cement is consigned directly
from Toro to the northern towns Little is dispatched to towns in
77the west for these obtain their supplies through Kampala dealers
Although location and the communication pattern limit Kampalas role
as a distribution center for Uganda Kampala middlemen merchants
have extended their sales area in the west beyond the border of
Uganda to Bukoba and to Rwanda
Others
It is not practical to examine the trade of every town in
East Africa but some further features of the distribution of trade
might be noted
Most of the towns classified as others are majority adminisshy
trative centers and their marketing functions have developed from
this Although they differ considerably they are very similar in
76W T W Morgan East Africa Economic Characteristics (Nairobi ~ast Africa Publishing House 1960) p 279
77ibid p 280
38
appearance In addition to administrative functions these towns
provide services such as hospitals and they have generally become
centers of local communication The features tend to enhance their
roles In trade The size and importance of these trading centers
is generally related to the size population and propensity of the
areas they serve Most of these towns are newly created Their
populations range from between three thousand to six thousand and
they have rather less than one hundred shops most along a single
main street 78 All are retailers but many also sell goods to traders
from the countryside and buy some local agricultural products
Mo~t of the towns created are very young and they came into
existence due ~o the scarcity of land These towns are scattered
throughout East Africa and vary In both size and frequency with
the density of population and the local level of income
COMMUNICATION ACTIVITY
Transportation has become an Important economic activity
Official estimates place Its contribution to the Gross Domestic
Product of East Africa at ~45 million which accounts for 61 percent
of the total 79
Road Transportation
Road and rail transportation are probably roughly comshy
parable as sources of Income In East Africa although they differ
78~NESCO Opt cit p 96
790xford Economic Atlas (Oxford Oxford University Press 1966) pp 174216221
39
greatly in structure Road transportation is operated mainly on a
very small scale but there are so many small operators that the
number of people earning a living in road transportation Is very
large SO Motor vehicles came Into general use in the 1920s but
the greatest expansion of road transportation came thirty years
later Today there are many more vehicles per head of population
than in Nigeria or even Egypt approximately six persons per cad IISl
In Table 3 on page 40 road transportation shows that the majority
are private cars but the figure for vans lorries and busses undershy
states the volume of commercial road transportation Cars on many
East Africa roads are used legally or otherwise as taxis proshy
viding many people with good incomes This Is especially well shy
developed in Uganda and helps to explain the small number of busses
there Within each country road transportation activity Is heavily
concentrated In the most prosperous areas especially around the
capital Traffic counts show a far greater intensity on roads around
Nairobi M0mbasa Kampala Jlnja Dar-es-Salaam and Tanga than
elsewhere
The overall Importance and the pattern of road transportation
are both affected by the nature of the road network Road building
has been assisted by the character of the earth in many areas
simple earth murram road serving very well for light traffic
Although few roads are tarred the road network is ~uch better
than In countries such as Sudan and in much of East Africa is
SOlbid pp 147 174 193
81Ibid pp 147 174 183 193
40
Tab Ie 3
Transportation in East Africa (1963-73)82
Kenya Tanzania Uganda Totals
Thousand miles of roads of which bitumen surfaced
(thousands units 000)
Private Vehicles Commercial
Lorries Vans Busses
1963 Flgur~s Private Commercial
Ra 11-Track (In kilometers)
Rail-Vehicles (units 000)
Air-Craft (units 000)
Sea Transportation
nd -- No data available
522
22
1002 295 104 82 26
440 90
962 km
163
05
nd
409
22
726 304 11 I 74 22
220 80
3782 km
42
nd bull nd
39 I
07
619 208 64 70 17
180 60
1 160 km
72
04
nd
1322
5 I
2345 80 1
840 230
59 km
17
82 Ibid pp 174216221
41
adequate for the demand made upon it 83 Some areas without roads
notably in central and western Tanzania are found In other areas
many roads 3re Impassable In the wet season but themiddotdlstrlbutlon
of road transportation activity Is related mainly to factors other
than the roads themselves
Rail Transportation
In spite of competition from the roads railways of East
Africa still undertake most long-distance movement of bulk loads
All are operated by East African Railways Corporation on behalf
of the three governments The rail works employ more than eighty
thousand people
The entire railway system covers 5895 kilometers all
being meter gauge and virtually all single track 84 The East
African Railway Corporation Road Services Is operated mainly In
Uganda and Tanzania although a nucleus of road services between
Mombasa and Nairobi was established to provide express services
for certain commodities
The railway has been Increasing at a moderate rate over
the past few years Between 1965-1971 passenger number rose by
an average of 66 percent per year While the corresponding growth
85rate of freight was approximately 10 percent
83 lbld pp 147 174 193
84 IbId p 39
85Ibld pp 147 174 193
42
Sea Transportation
Sea transportation as an economic activity concerns East
Africa mainly through employment at the ports Sea transportation
administration is operated by the East African Harbors Corporation
on behalf of the East Africa community86 There are several sea
ports which serve Kenya Uganda Tanzania Rwanda and Eastern
Region of Zaire
Periodically these harbors suffer from severe congestion
with serio~s repercussions upon the economy of the entire East
African region The organizational changes within the East African
Cargo Handling Services responsible for handling of cargo as opposed
to the administration of the port makes handling operations slower
and more inefficient
Air Transportation
Air transportation is less than the other forms of transshy
portatlon for it can be used only by the most affluent passengers
and for the most valuable goods In each case the re-fuellng of
planes in transit provides a useful source of income Regular
internal services call at thirty-four places In East Africa of
which twenty-one are In Tanzania 87 The large size and peripheral
populatiofl pattern of that country make air transportation more
appropriate than in Kenya or Uganda Air transportation is unl ikely
to become a major economic activity In East Africa until Its cost
Is greatly reduced
86 Ibld bullbull pp 147 193 87 lbld bull
43
Communication Media
Communication media includes television radio receivers
telephones and dally newspapers These sources are growing at a
88rate of 10 percent per year The growth In urban areas Is higher
than In rurai areas No current data are avaIlable
Tab Ie 4
Communication Medla89 (Thousands) 1963
Kenya Uganda TanzanIa
Television 22 1 100 00
Rad 10 Reef Ivers 70 I 400 300
Telephones 6 1 6 1 32
Da II y Newspapers 190 123 83
SUMMARY
This review of literature was divided Into eight areas which
are pertinent to this study It was designed to provide background
Information related to
A East African Political Environment
1 Regional Survey
2 Nyika Plateau
3 Lake Victoria Basin
88Morgan East Africa Economic Characteristics p 36
890xford Economic Atlas Ope cit Table 1
44
B The Economy
1 Subsistence Economy
2 The Public Sector
3 Excessive Expectations for Public Service
C Population Distribution
1 Regional Population
2 Urban Population
D People
1 Tribal Classification
2 Historical Clusters
E African Heritage
1 The Extended Family
F Understanding the Economic Activities of East Africa
G The Distribution of Trading Activity
1 Na I rob I
2 Mombasa
3 Dar-es-Salaam
4 Kampala
H Communication Activity
1 Road Transportation
2 Rail Transportation
3 Sea Transportation
4 Air Transportation
5 Communication Media
Chapter 3
DESIGN OF THE STUDY
EAST AFRICAN ELITE
This survey was conducted and certain Information provided
to the argument of the study However difficulties of conducting
research 11 the formerly British-controlled territories of East Africa
are no different from those encountered elsewhere only more intense
because of lack of basic bench-mark data and basic socloeconomic
data Stratified probabil ity sampling in more advanced societies
can be designed in many ways Voters rolls rate-payers registers
and the like are usually up-to-date and easily available to the
researchers Such data do not exist in East Africa I Survey
research must be designed therefore on what data are available
There is little constructive value In the criticisms of the purist
that sampling techniques used in Africa do not fit acceptable
Western standards 2 It Is true that they do not but Leonard Doob
states that lithe scholarly or scientific gains to be derived from
ILeonard W Doob Periodic Surve s In Sub-Saharan Africa (Nairobi Nairobi Publishing House Hay 11 1970 p 3 bull
21~id p IS
45
46
valid results are so staggeringly inviting that the frustrations
of the moment Cre rendered almost Impotent- 1I3
Marco Surveys Ltd Nairobi Is the original data source
on its determination to publish Whomiddots Who in East Africa In 1974
Its part information Is the basis for this study
The survey by Marco Survey Ltd Nairobi had faced some
difficulties in deciding who was to be interviewed however It
took several months of careful planning Staff lists were prepared
by the four governments directories of commerce and industry and
membership 1ists of all available professional cultural and warshy
fare organizations and societies were examined Finally the
wage structures of the largest companies were checked and compared
to the wage paid by the four governments Every Interview was
planned and every respondent was presented There were direct
mall intervIews and each respondent signed the completed form
as correct after the interview
The criteria for selection to be interviewed were two The
first criterion was income The optimum cot-off point was an income
of ~I 000 per annum which is higher than the average European
or Asian income and Is also higher than the starting scales for
4university graduates The second criterion was the position held
by the respondent Women who have been Included are el ites In
their own right and not persons who are simply wives of elites
There are only sixty women in the total of 1423 Interviews about
3Eest Africa 1974 (Nairobi Marco Survey Ltd 1974)
4Doob Ope cit p 256
47
4 percent so sex was not used as a basts of tabulating the socloshy
economic data
This data Is presented on a comparative basis to Illustrate
by the basic =lassiflcation data the differences and similarities
of the African elite of the three countrles--Kenya Uganda and
Tanganyika Zanzibar has been Included and treated separately In
most of the tables
This study Is divided Into three parts The first Is an
analysis of the elite In East Africa based on the basic classificatory
data that w~s collected In the original research for Whos Who in
East Africu5 and additional studies which In addition to describing
the elite give Insight Into their opinions attitudes and beliefs
The second is a survey of urban elite opinions on basic social
and economl~ problems and technical assistance It Is based on a
stratified probability sample of those who most closely resemble
the elite in three African capital cities The third describes a
survey which Is beginning to provide research Into changing attitudes
and knowledge that will temporal orientation determlnlsm 11 The
sample will be described at the beginning of the second part for
each of these surveys and a few sample tables will be given to
Illustrate some of the results of this research
Approximately 6 percent of the Africans listed for Intershy
view refu~ed to be Interviewed There were numerous reasons given
for refusing but the chief factors were education and personal
reasons claiming that they were not Important enough to be included
5Marco Survey op cit p 19
Na I rob I
URBAN ELITE OPINION
Order (Englewood Cliffs chapter 4
A recent study poses the hypothesis that the role of the
Standard codes were used to clarify the data and cards
be said that the attitudes and opinions expressed In answer to
East Africa to test the attitudes and opinions of the city African
The interviews were conducted by permanent senior research
48
6Fred G Burke Africans Quest New Jersey Prentice Hall Incorporated
questions are those of the elite but they do represent the opinions
and education The respondent had to have had some secondary edushy
affairs and social problems The sample was stratified by age
the interviews were conducted or had many years of residence there
Inevitably some of those listed were not available for Interview
on certain questions Involving his personal life International
cation and had to be at least eighteen years of age It cannot
a stratified robability sample in each of the capital cities of
Five attempts were made In every case of this type before giving
city in Africa is that of generator communicator Innovator and
Intergrator 6 The research accepted this hypothesis and designed
were punched for 80-column ICT data-processing equipment in
up An estimated 10 percent of those listed were no t avai lable ll
assistants All of these have at least a Bachelor of Arts degree
for interview for one reason or another
or its equivalent and are either nationals of the country in which
49
and attitudes of a probability sample of urban African eighteen
and over who has had some secondary education and who lives in
one of the capital cities of East Africa Therefore the opinions
of this group will be closer to those of the elite than a sample
based on the population as a whole
The people interviewed were chosen in the following manner
Each city including peri-urban and dormitory areas was divided
into geographical units using a grid method on a base map Each
square of the grid was numbered except for those that were in
the business area--marshalling yards ocean and the like--and 10
percent of the squares were chosen by using a table of random numbers
The number of units of housing In each was then determined and
the quota was divided proportionately between each The interval
between units was determined and a starting point selected
The interviewers continued Interviewing to the set interval
until the quota was completed Three callbacks were made where
necessary for each respondent before declaring that interview
void The household was defined as that group which regularly
takes its meals together The head of the household was Intershy
viewed to determine how many In the household of either sex were
over eighteen and had had some secondary school education Those
were then listed and the person to be interviewed was selected
by a system of random numbers Only one person was Interviewed
In each household If the unit did not have at least one person
as defined by education the interviewer then proceeded to the
next household by the fixed interval Ten percent of the intershy
views were checked by field supervisors The Interviews were
50
conducted i~ English for the most part but some Swahili was used
in Dar-es-Salaam
The questionnaires were pretested in each of the capital
cities and the questions were modified where necessary The
translation of Swahili was made in the usual way of two separate
translators who worked from Engl ish to Swahil i and vlce versa
The interviews were conducted from September 15 to October
5 1974 The tables have been shortened for prInting convenience
by grouping items that have less than 5 percent response Into the
category 1I0thers 11 Percentages were rounded to the nearest whole
number or if the percentage was too small in a subsample whole
numbers were given in parentheses
OPINIONS AND ATTITUDES
The following is a description of a few of the questions
which were used in pretesting a series of eighteen questions in
three capital cities of East Afrlca to establish eight scales to
assess opinions and attitudes about temporal orientation governshy
ment confidence and optimism science and determinism conception
of people politics and tribalism or traditionalism It is Intended
that the scales when adequately tested revised and evaluated
can be used for per lodlc surveys at least fixed intervals over
1I7the next five years Such surveys will provide scales that can
be used to measure social change and that can be used to compare
7Gordon H Wilson liThe Transformation of East Africa Basic Scale for Periodic Research (New York Basic Books Printer 1971) p 456
51
data from the three capital cities and also to compare the basic
data between the elite of the urban areas and probability samples
from selected rural areas
The pretests were carried out in Nairobi Kampala and
Dar-es-Salaam Each was based on a probability sample of 150
people stratified by age eighteen and over and education The
respondent must have had some secondary education In fact the
sample for the pretests were chosen on the same basis as the survey
described In the third part A probabilIty sample of this type
Is unavoid~bly composed mostly of males young adults who are
relatively wealthy engaged In the more skilled occupations and
professIons representing the politically and socially Important
members of the community It closely resembles the elIte described
In the second part of this chapter The research selected only
a few questions to Illustrate the possible value of the results
It Is patently evident however that though these one-shotll
results are
bull merely interesting or suggestive they will become significant and really helpful when comparative data are obtained over a period of time so that trends knowledge and public ftplnlon can be detected and measured by established scales
8 b t d p 456
Chapter 4
ANALYSlS OF DATA
The age of the elite of East AfrIca shows some sIgnIfIcant
differences among the four countries Table 5 on page 53 is the
percentage distribution by age If we disregard the not stated
categories the average ages are as follows Kenya 31-45 years
Uganda 36-40 years Tanganyika 31-35 years Zanzibar 41-45 years
East Africa 36-40 years
Table 5 shows the average age of elIte to be higher In
Uganda and Zanzibar than In Kenya and Tanganyika Uganda has 17
percent of elite over fifty years and ZanzIbar 28 percent whIle
4 percent cf elIte are In this age group In Kenya and Tanganyika
Later the analysis will reveal that one-third of the Uganda elite
are Baganda thus the explanation of the older average age may
be that Baganda has had a strong traditional centralized governshy
ment for many years and therefore posItions of power of authority
have been open to the Baganda for a much longer period than for
other East Africans The same explanation can apply to the elite
of Zanz rbar
The process of Africanlzatlon can be seen In Table 6 on
page 54 There Is a smaller percentage of Africans in the civil
service In Kenya than In the other two countries but a higher pershy
centage of elected and appointed representatives due to the regional
52
53
Table 5
East African Elite Age Factor By Percent
Kenya Uganda Tanganyika Zanzibar Total
Up to 25 years 5 1 1 2 3
26-30 years 18 15 18 8 16
31-35 years 26 15 21 5 17
36-40 years 21 20 20 9 20
41-45 years 12 16 11 17 14
46-50 years 4 8 8 5 6
51-55 years 2 9 2 10 4
56-60 years 1 4 2 8 3
61-65 years 1 3 - 7 2
66 and over a 1 - 3
Not stated 10 8 17 26 14
Total 100 100 100 100 100
Base 457 409 444 113 1423
a -shy Less than 5 percent
54
Table 6
East African Elite Occupation Factor Sample by Percentage Distribution
Kenya Uganda Tanganyika Zanz Ibar Total
Civi 1 servant 27 42 51 46 40
Electedappointed 41 34 23 10 31
Commerceindustry 12 10 9 19 11
Trade union politician 13 5 4 6 8
Education 6 6 7 a 7
Professional 3 I I 7 2
Cooporatlvestrade I I 3
Religiouswarfare 2 4 6 - 4
Agriculture I 2 1 3
Miscellaneous 2 3 3 2 3
Total 108 108 108 108 108
Base 457 409 444 113 1423
a -- In a few cases the same person qualified in more than one classification
55
form of government Kenya also has a higher percentage of elite
who qualify as trade unionists
There are several ways of describing occupations Civil
servants for example can be in medical education or other
services Table 7 on page 56 gives occupations of the elite
in East Africa by a different set of criteria
The Education Factor
Tabl~ 8 on page 57 shows that in the categories University
and above East Africa rates 25 percent--with Kenya 25 percent
Uganda 24 percent Tanganyika i9 percent and Zanzibar 32 percent
The high number in the last country is accounted for in Table 7
IIEast African Elite Where Educated A higher percentage were
educated in the United Kingdom and IndiaPakistan (52 percent)
because of lack of local secondary schools Another factor is that
a well established social class structure was part of pre-independence
culture The upper class in Zanzibar and to some extent those
among the Baganda could afford overseas education whereas those
from other countries were dependent on financial help from governshy
ment sources
There was a higher percentage of elected or appointed represhy
sentatives In Kenya and this category was not so highly educated
as the Icivtl servant of a ll others categories It can be seen
that there are more electedappointed representatives than civil
servants or others in the lowest categories of education In the
highest educational brackets we have more civil servants in the
elite of all three countries than in the other two classifications
55
form of government Kenya also has a higher percentage of elite
who qualify as trade unionists
There are several ways of describing occupations Civil
servants for example can be in medical education or other
services Table 7 on page 56 gives occupations of the elite
In East Africa by a different set of criteria
The Education Factor
Tabl~ 8 on page 57 shows that In the categories University
and above East Africa rates 25 percent--wlth Kenya 25 percent
Uganda 24 percent Tanganyika 19 percent and Zanzibar 32 percent
The high number in the last country is accounted for in Table 7
IIEast African Elite Where Educated 1I A higher percentage were
educated in the United Kingdom and IndiaPakistan (52 percent)
because of lack of local secondary schools Another factor is that
a well established social class structure was part of pre-Independence
culture The upper class In Zanzibar and to some extent those
among the Baganda could afford overseas education whereas those
from other countries were dependent on financial help from governshy
ment sources
There was a higher percentage of elected or appointed represhy
sentatives n Kenya and this category was not so highly educated
as the llcivll servant of lIa ll others ll categories It can be seen
that there are more electedappointed representatives than civil
servants or others in the lowest categories of education In the
highest educational brackets we have more civil servants in the
elite of all three countries than in the other two classifications
56
Table 7
East African Elite Specific Occupation Factor By Percent
Kenya Uganda Tanganyika Zanzibar Total
Education (administration) 5 4 6 7 5
Education (teacher) I 3 1 2 2
Medical practicing 4 5 3 5 4
Sciences 1 I I 2
Lawjudicial 1 6 2 8 2
Accountancy 2 1 2
Farmer 1 2 I 3
Entrepreneur 2 2 I 9 2
Senior executive 34 36 61 44 45
Junior administrator 7 14 14 3 1I
Legislator (only) 38 20 7 8 21
Partyunion officials 13 5 4 6 8
Editorsartauthors 1 1 I 5
Clergy senior 1 3 4 - 2
Others (unclassified) 2 5 3 2 3
-Base (all Africans
Interviewed) 457 409 444 113 1423
57
Table 8
East African Elite Education Factor By Percent (1972)
Educational Level Reached Kenya Uganda Tanganyika Zanzibar Total
No formal education
Attended junior secondary 22 13 8 21 15
Attended sen lor secondary 21 18 23 13 20
Obtained certificate of secondary 12 8 3 10 8
Obtained higher certificate high school a a a - a
Nonunlverslty technical studies 5 7 19 6 10
Nonunlverslty teaching studies 4 6 7 - 5
University studies non-graduate - 22 20 17 17
University studies 1st degree 17 15 16 26 17
Post-graduate university ma s te r I s deg ree 5 7 2 4 7
Post-graduate university studies higher degree 2 2 1 2 1
Not stated I - I I a
-Base (all Africans
Interviewed) 457 409 444 113 1423
a -- Less than 5 percent
58
Civil servants In Uganda are more highly qualified than In the
other three countries 59 percent have university education In
Kenya 56 percent In Tanganyika 42 percent and in Zanzibar 56
percent have university education Elected and appointed represhy
sentatives generally have less education In Kenya 22 percent
Uganda 37 percent and in Tanganyika 26 percent (Zanzibar could
not be tabulated) have university education Uganda Is still the
highest among the three countries
Country Where Ed~catlon Was Obtained
Table 9 on page 59 gives details about the country In
which the respondent was educated In his final year of education
It can be seen that the highest percentage of the elite were edushy
cated in local East African schools (58 percent) The United Kingdom
came next (28 percent) followed by the United States (7 percent)
IndiaPakistan and other African countries There are very sigshy
nificant differences between the East African countries however
which are worth noting Zanzibar and Uganda have many more elite
who were edycated overseas and in the United Kingdom particularly
than the other countries Kenya had fewer by 10 percent than
the next lowest which was Tanganyika
It would be a waste of effort to detail all of the East
African schools attended by the East African elite There were
nearly one ~undred What is significant however is to show that
out of this total only a few schools account for handful accounts
for more than 5 percent of the elite In each country and moreover
this handful accounts for a very significant percentage of the elite
59
Table 9
East African Elite Where Educated
Country Educated Kenya Uganda Tanzania Zanzibar Total
East Africa only 67 54 57 42 58
Afrlca--outslde East Afrt ca 3 4 4 1 4
The U S 8 5 8 2 7
The U K 18 38 27 38 28
IndiaPakistan 4 3 3 14 4
Austral la New Zealand a - - - a
Canada - a - - a
Western Continent Europe Ie Germany Norway 1 1 3 2 2
USSRChina or Eastern European Countries - - a - a
Elsewhere outside Afr lea
Not stated 1 - a 2
Total 103 106 100 100 100
Base (All AfrIcan Interviews) 457 409 444 113 1423
a -shy Less than 5 percent
60
The Factor of Rellslon
This survey did not Include Zanzibar and therefore the
paper Is unable to provide comparative figures for Zanzibar of East
Africa as a whole One would logically expect to find relatively
61
the same number of elite as the general percentage for the popushy
lation as a whole In each religious grouping
Table 10 on page 62 is complicated by the category among
the elite of Inormal Chrlstlan1I which did not appear In the first
survey This category has been added because many of the sophisshy
ticated Africans were educated In Christian schools so they do not
regard themselves as pagan and yet they do not belong to any formal
church The category IInormal Christian or simply Christian is
used to describe them We can generalize that fewer Moslems are
among the elite than one would reasonably expect from the above
figures particularly In Tanganyika Fewer Roman Catholics in
Kenya and Uganda are among the elite than one would reasonably
expect from the above figures about the proportions to be expected
Moslem education In East Africa Is less than education
among the other religions Protestant missions have been strongest
in education since earliest times In East Africa and this Is
reflected in Table 10 Even In government schools in the old colonial
tradition the Church of England as the state church dominated
the educational field In the British System and in England today
1Ireligion is taught along with the three Rl s This will explain
the larger number of Protestants In the population as a whole and
among the elite of Uganda and Kenya Zanzibar of course Is a
Moslem country Most of the 7 percent 1I0 ther ll in Zanzibar were
Bahal The white fathers of Tanganyika dominated the field of edushy
cation in early German times and remained a powerful force throughshy
out the Trusteeship period
62
Table 10
East African Elite Religion Factor Compared to Population Percentage
Kenya Uganda Tanganyika Zanzibar Total
Elite Othersa Elite Othersa Elite Othersa Elite Elite
Roman Catholic 21 29 25 34 26 28 4 22
Protestant 54 45 65 50 22 26 43
Moslem 4 16 3 10 16 39 88 14
Pagan 8 6 7
Normal Christian 15 2 24 13
Other 7
Not stated 6 2 5 1I 7
Total 100 100 100 100 100 100 100 100
Base 457 2400 409 2600 440 2000 113 1423
a -- The percentages for others is based on the probability sample (7000) of survey conducted by Fred G Burke Some grass-roots attitudes affecting political and social Intergratlon In East Africa paper delivered to the African Studies Association San Franclsco October 26 1963
63
The Factor of Voluntary Associations
The degree to which Individuals In African societies join
groups of voluntary association is a measure of social change The
comparison between the four countries which is given in Table 11
on page 64 shows significant differences between them Tribal
associations are much stronger in Kenya than elsewhere 21 percent
as against 2 percent to 8 percent In Zanzibar Tanganyika and Uganda
This underlines the felt need of the Africans of Kenya for security
among their own people in the face of Insecurities of the old
colonial system and Its concomitant privileged European and Asian
classes Nowhere else in East Africa was the position of the
settler or trader so strong Moreover political parties were
banned In Kenya on a national basis until comparatively recently
although district associations were encouraged by the administration
Kenya elite rate highest In political party membership (35
percent) as against 17 percent to 22 percent and trade union membershy
ship (20 percent) as against 5 percent to 12 percent
Uganda elite join more groups of voluntary associations
than the elIte of other countries The average Uganda elite has
membership In two groups Kenya 1-7 Zanzibar 1~6 and Tanganyika
1-5 Moreover the kind of groups that the Uganda elite support
are more sophisticated The Uganda elite rate much higher In
religious (16 percent) versus 6 percent to 9 percent professional
(15 percent) versus 4 percent and cultural (16 percent) versus
6 percent to 11 percent The Uganda elite Is only second to the
Zanzibar elite (42 percent) as members of social clubs (36 percent)
but significantly higher than the Kenya elite (23 percent) and the
64
Table 11
East African Elite Voluntary Associations Factor By Percent
Kenya Uganda Tanzania Zanzibar Total
Member of a tribal association 21 8 3 2 10
Religious societyunion 6 16 6 9 9
Business society 5 8 6 11 6
Professional society 9 15 4 15 9
Academic society 12 20 7 17 13
Political party 34 21 22 9 25
Charitable organization 5 13 12 42 10
Social club 23 36 25 9 29
Sporting club 6 16 11 15 11
Other organizations 11 4 5 10 8
Cultural organizations 6 16 11 10 11
Trade union 20 5 12 5 12
Belong to none 18 17 33 17 22
Total a 176 195 157 165 175
Base (All African interviews) 457 409 444 113 1423
a -- Many individuals belong to more than one group
65
Tanganyika elite (25 percent) One In three of the Tanganyika
elite (33 percent) does not belong to many voluntary associations
compared to only 17 percent or 18 percent for the elite who do not
belong to at least one society In the other East African countries
Business is presented equally in each of the four countries
Table 11 Is one of the most significant of the survey The
Uganda elite of whom one in three was Baganda have had University
at Kampala for many years It was once the only center for higher
education In East Africa Therefore culture In the western sense
was for many years a factor of influence on elite of Uganda which
was not available in either Kenya or Tanganyika
The Tribal Factor
The percentage of the elite In each country by tribe
compared to the percentage of the population represented by that
tribe should give an Interesting Index of the degree to which
the tribe has progressed and Indirectly of the Influence of Its
members
The first significant fact which emerges Is that 9 percent
called themselves Tanganyikansll and would not use the label tribe 11
We can only assume that the actual percentage by tribe of this group
Is about the same as described In Table 12 on page 66 with the
obvious Inclusion of some who are of mixed percentage The most
significant fact Is that there were 30 percent who belonged to Kenya
tribes 2 percent Ugandans and 5 percent Zanzlbarees No other
East African country had as high percentages In these categories
That amounts to 37 percent who were of tribes other than those of
66
Table 12
Tanganyika ElIte by TrIbal Group
Tri be Percent of PopulatIon Percent of ElIte
Sukuma 19 3
Nuyamwerl 7 2
Hakonde 6
Haya 6 7
Chagga 6 12
Gaga 6
Ha 5
Hehe 4 1
Nyakusa 4 3
Wguru 4
Sambaa 3
Zaramo 3
Yao 3
Hwevu 2
Others (Less than 2) 13 22
Stated Tanganylkan 9
Kenyan Tr t bes 30
Uganda TrIbes 2
Zanzlbaree 5
Toeal 100 100
Base 10204000 (1973) 444
67
Tanganylkans The major tribe the Sukuma represents one in five
of the Tanganyika population yet has only one In thirty-three
among the elite There are twice as many Chagga among the elite
as their tribal percentage would warrant Surprisingly the Haya
have more than their share although all the rest have fewer except
the ve ry sma 11 Ilothe r ll t r i bes who have nea r 1y tw Ice as many
In Uganda we would expect to find the Baganda over represhy
sented in the elite (see Table 13 on page 68) They have like
the Chagga twice as many (33 percent) as the tribe percentage would
warrant (162 percent) An even higher percentage 28 percent
claimed to be IIUgandans a classification not recorded in the official
census figure Only 1 percent are from Tanganyika and 1 percent
from Kenya Unlike Tanganyika the smaller tribes which each
represent less than 1 percent each of the population have only
half as many elite (6 percent) as their combined percentage (94)
would expect Tanganyika had twice as many The Watoro was the
only other tribe In which the percentage of the elite exceeded
that of the tribe 4 to 32
Kenya Is unique In that there are several tribal groups
that exceed their quota of elite and by almost the same ratio (see
Table 14 on page 69) The Luhya have a slight margin by ratio
over Luo and Kikuyu The Kamba Mero and Embu related tribal
groups are all seriously under their expected percentages Like
Tanganyika but unlike Uganda the small tribal groups--each of
less than 3 percent of the total population but represent 161
percent of It--have 22 percent of the elite A high percentage
of this group of the elite are from the numerous coastal tribes
68
Table 13
Uganda Elite by Tribal Group
Tribe Percent of Population
-Baganda 162
Banyonkole 8 I
Teso 8 I
Basoga 78
Baklga 7 I
Lango 56
Baglsu 5 I
Acho I I 44
Lugbara 37
Wator i 32
Banyaro 29
Karamujong 19
Alur 14
Banyole
Kuma 94
Others (Less than 1) -Not stated
Stated Ugandan -Kenyan tribe
Tanganyika tribe
Total 1000
Base 7367558 (1973)
Percent of Elite
33
3
3
4
2
3
3
4
3
6
28
100
409
69
Table 14
Kenya Elite by Tribal Group
Tri be Percent of Population Percent of Elite
-Kikuyu
Luo
Luhya
Kamba
Meru
Kis i i
Embu
Klpsigis
Nandi
Others (Less than 3)
Stated Tanganyika
195
144
125
117
69
49
39
3
22
16 1
23
19
19
6
2
3
2
22
2
Total 1000 100
Base 9204000 (1973) 457
70
Table 15
Question
What in your opinion is the most important problem facing our country at the present time
Na i rob i Dar-es-Salaam Kampala Total
Education
Poverty-famine
Unemployment
Economic development
High cost of living
Border disputes Inter-African disputes
Pol itical instabi 1ity
Tr i ba 1ism
Land apportionment
Publ ic laziness
Other problems
Don1t knownot stated Refused to answer
22
13
41
6
10
3
2
3
2
2
29
24
6
24
3
6
4
2
28
18
18
12
9
5
3
2
5
3
27
19
18
14
8
3
3
4
2
Total 109 105 105 105
Base 389 451 395 1235
71
Table 16
Question 2
All things considered how satisfied are you with your present standard of 1ivlng--very satisfied fairly satisfied
somewhat dissatisfied or very dissatisfied
Nairobi Dar-es-Sa1aam Kampala Total
Very satisfied
Fairly satisfied
Somewhat dissatisfied
Very dissatisfied
Don I t know
Refused to answer
6 13 4 8
32 50 25 36
32 26 37 31
29 11 32 24
Total 100 100 100 100
Base (a 11 intervi ews) 389 451 395 1235
72
Table 17
Question 3
Do you think political matters should be left to the government or should people like yourself take
some active part in political affairs
Nairobi Dar-es-Salaam Kampala Total
Left to government 26 24 13 21
People to take an active part 72 72 73 72
Other answers 4 2
Dont know 2 8 3
Refused to answer 2 2
Total 100 100 100 100
Base 389 451 395 1235
73
Table 18
Question 4
Which one of the following do you think our country needs most at the present time more schools more hospitals
more housing more factories or more roads
Nairobi Dar-es-Salaam Kampala Total
More schools 40 44 51 45
More factories 40 37 28 35
More hospitals 17 10 15 14
More housing 1 6 5 4
More roads 2 3 1 2
Don I t know
Total 100 100 100 100
Base 389 451 395 1235
74
Table 19
Question 5
Now which one do you think our country needs most an honest government without corruption a government that gets things done fair distribution of wealth
national unity or individual freedom
Nairobi Dar-es-Salaam Kampala Total
An honest government wIthout corruption 44 38 51 44
A government that gets things done 23 18 17 20
National unity 22 20 17 19
Individual freedom 6 14 6 9
Fair distribution of wealth 5 9 8 8
Don I t know
Refused to answer
Total 100 100 100 100
Base 389 451 395 1 235
75
Table 20
Question 6
Which do you prefer--government ownership or private ownership of major industries
Nairobi Dar-es-Salaam Kampala Total
Government ownership 51 43 38 44
Private ownership 38 38 31 36
Mixed (voluntary answer) 10 18 29 19
Don I t know
Refused to answer - - 1shy
Total 100 100 100 100
Base 389 451 395 1235
76
Table 21
Quest Ion 7
As you know there are many different ways In which African states can establish closer ties among themselves Which of the
following ways would you favor an organization for settling disputes between African governments
closer economic relations political federation African military
organization cultural exchanges
Nairobi Dar-es-Salaam Kampala Total
Favor 94 96 85 92
Oppose 3 3 9 5
Don I t know 2 1 4 2
Refused to answer 1 - 2
Total 100 100 100 100
Base 389 451 395 1235
-Closer economic relations 22 49 53 41
Political federation 26 39 27 31
An organization for settling disputes between African governments 34 32 15 28
An African military organization 15 18 11 15
Cultural exchanges 3 10 3 6
Don I t know
Total 100 149 110 121
Base 366 432 337 1135
77
(8 percent) only 2 percent are Tanganylkans and the Ugandans did
not rate statistically
ELITE OPINIONS AND ATTITUDES
Not only does Scale 1 Table 22 Illustrate a sound basic
knowledge of modern methods to prevent crops from being damaged
It also Illustrates a similarity of knowledge between the three
sample areas which are widely separated geographically Scale 1
will be Invaluable when comparing the results of our first rural
study the field work of which has been completed and Is at the
stage of processing
Table 22
Scale
It does not help much to try to prevent crops being damaged by Insects and diseases such losses can
never really be prevented
Kampala Dar-es-Salaam Nairobi East Africa
Agree 8 12 12 11
Disagree 88 85 87 86
Uncertain 4 3 3
Base 153 156 150 459
Scale 2 Table 23 on page 78 also Illustrates but not
so conclusively similarities between the three areas Nairobi
had 17 percent agree whereas Dar-es-Salaam had only 10 percent
with Kampala somewhere Inbetween One could say therefore that
78
there Is a higher degree of tribalism among the elite of Nairobi
than among the elite of Dar-es-Salaam
Table 23
Scale 2
A man should never marry a woman who does not belong to hIs tribe
Kampala Dar-es-Salaam Nairobi East Af rl ca
Agree 12 10 17 13
Disagree 81 83 80 82
Uncertain 7 7 3 5
Base 153 156 150 459
While Scale 3 Table 24 shows a similarity between the
three areas It shows that the respondents of Nairobi are much
Table 24
Scale 3
People have It within their power to bring harm and misfortune to others through magic
Kampala Dar-es-Salaam Nairobi East Africa
Agree 26 28 30 28
Disagree 45 46 61 51
Uncertain 29 26 9 21
Base 153 156 150 459
79
more sophisticated In regard to magic than in the other sample
points and that fewer are uncertain A significant number In each
area however believe that magic can be used to bring harm and
misfortune to others
Scale 4 Table 25 shows a consensus between the three
areas but shows an over all unfavorable knowledge about science
and knowledge The majority 83 percent believe that many imporshy
tant matters can never be positively understood by the human mind
The question can provide a very useful comparison In changing patterns
of knowledge regarding science In the future
Table 25
Scale 4
Science and knowledge are useful of course but many important matters can never be positively
understood by the human mind
Kampala Dar-es-Salaam Nairobi East Africa
Agree 80 79 86 83
Disagree 9 12 13
Uncertain 11 9 6
Base 153 156 150 459
Scale 5 Table 26 on page 80 shows an unfavorable public
opinion about the role of traditional chiefs and the dichotomy caused
by loss of status in recent years by traditional chiefs whose roles
have been largely taken over by the political appointee of the
ruling party The question will also provide useful comparative
80
data between ruralurban areas and will be useful In the future to
measure changes in attitudes and opinions about traditional chiefs
Table 26
Scale 5
A man ought always to obey his traditional chief
Kampala Dar-es-Salaam Nairobi East Africa
Agree 42 38 45 42
Disagree 42 46 49 46
Uncertain 15 16 6 12
Base 153 156 150 459
Scale 6~ Table 27 not only shows an area of new problems
for East African elite but also the wide divergence of response
Table 27
Scale 6
Government and politics are so complicated that the average man cannot really understand what Is going on
Kampala Dar-es-Salaam Nairobi East Africa
Agree 81 65 72 72
Disagree 16 24 22 21
Uncertain 3 11 6 7
Base 153 156 150 459
81
between the three sample points In Kampala 81 percent agree
with the statement and only 3 percent are uncertain whereas In
Dar-es-Salaam 67 percent agree while II percent are uncertain
The statement will provide a useful measure In future of the attl shy
tude of the elite toward government In each of the three sample
points
Scale 7 Table 28 Is a new problem of Investment and
saving which as you can see has brought out differences between
the three sample points and will provide In the future a useful
measure of changing attitudes toward savings and the postponement
of rewards
Table 28
Scale 7
If I had the choice I would prefer to be given a small sum Immediately rather than be promised a very
large sum one year from now
Kampala Dar-es-Salaam Nairobi East Africa
Agree 62 54 62 60
Disagree 24 37 30 30
Uncertain 14 9 B 10
Base 153 156 150 459
There are other examples above of similarities and dlsshy
similarities which are even better than Scale 8 Table 29 on page 82
It does show however a close correspondence between Kampala and
Nairobi while Dar-es-Salaam shows a more tolerant attitude In
82
their response to this statement Once again the comparison between
urban and rural areas should show an Interesting and significant
difference
Table 29
Scale 8
A womans place Is in the home
Kampala Dar-es-Salaam Nairobi East Africa
Agree 45 36 45 42
Disagree 46 61 51 52
Uncertain 9 3 4 5
Base 153 156 150 459
Scale 9 Table 30 shows significant statistical differences
between the response from Kampala and those of the other two sample
Table 30
Scale 9
The traditional ways of the past are the best
Kampala Oar-es-Salaam Nairobi East Africa
Agree 15 33 33 27
01 sag ree 68 58 56 61
Uncertain 17 9 11 12
Base 153 156 150 459
83
points This fact Is even more Interesting when we know that in
Uganda the present form of government has been designed to maintain
the traditional ways of the past whereas In the other two areas
the present government has been designed to change politically
at least traditional ways The reactions of the Kampala respondents
therefore are a significant Indication of their dissatisfaction
with efforts to maintain traditional ways
Scale 10 Table 31 also Illustrates that Kampala has a
different reaction than the other two sample points although there
are less significant differences between Dar-es-Salaam and Nairobi
Table 31
Scale 10
The present Is all too often full of unhappiness It Is only the future that counts
Kampala Dar-es-Salaam Nairobi East Africa
Agree 29 50 60 46
Disagree 44 27 32 34
Uncertain 21 23 8 20
Base 153 156 150 459
Scale 11 Table 32 on page 84 Is a really significant
Indication of the basic dissatisfaction of the Kampala respondents
with the status quo The dissimilarity was also reflected in
Scale 10
84
Table 32
Scale 11
The government Is doing all It can to develop our country
Kampala Dar-es-Salaam Nairobi East Africa
Agree 51 86 84 74
Disagree 21 5 10 12
Uncertain 28 9 6 14
Base 153 156 150 459
Chapter 5
SUMMARY AND CONCLUSIONS
The purposes of this study were to
1 Analyze the factors which have slowed the economic
development of East African communities
2 Identify the major problems encountered In economic
systems In East Africa
3 Determine the problems in developing the economic growth
of the community
4 Identify economic reconstruction needs
All the published materials listed below were extensively
reviewed The review Included library research over both periodicals
and some relevant studies The writing of this report Is thus based
on the Information provided by the following documents
1 Periodicals books pamphlets mlcroflshe from the
William Allen White Library of the Emporia Kansas State College
2 Xeroxed materials and books that were secured through
the Inter-library loans
3 Report collected by the Marco Survey Ltd Nairobi
4 Periodicals Issued by the Information section of the
Embassy of the Republic of Kenya Washington D C
In order to determine the social and economic problems of
East Africa a questionnaire-Interview method was used In total
85
86
1423 elites were I~ervlewed Approximately 6 percent of the
elites listed for interview refused to be interviewed
The Interviews were conducted by permanent senior research
assistants
The data collected were compiled (using standard codes to
clarify the data and computer cards were punched for BO-column
I C T data processing equipment In Nairobi) summarized and
interpreted
Finally conclusions were reached
SUMMARY
British East Africa was the name applied to the territories
in East Africa before It achieved Its Independence The territories
cover a total area of 682469 square miles which was divided into
three parts Kenya Uganda and Tanganyika They all became indeshy
pendent by 1963
The communities continued economic ties among each other
and on June 6 1967 at Kampala the three member nations signed
a treaty which was to re-establish the community
East Africa enjoys a great deal of economic advantages
l It borders the Indian Ocean which provides a cheap means of
exporting and ImportlDg goods 2 It Is a meeting point for trade
(east and central African trades)
East Africa Is divided Into five geographic regions (which
provide a variety of climates)
1 coast region
2 Nylka region or Savanah region
87
3 East and West Highlands
4 Lake Victoria region
Due to the Influehce of the cultural traditions the subshy
slstance element in East African economics is still dominant This
is evident in most of the rural areas The public sector of East
African community plays a very great part In developing the economy
The public sector Is expected to be major employers In the community
and Is expected to provide free public services--free school free
medical services free or subsidized public utilities and housing
On an average scale the population of East Africa is yet
low A clear study shows this Is not true In some locations which
are densely populated varying from two hundred to five hundred
people per s~ure mile The population In urban cities of East
Africa Is still low and the people do not consider cities to be
their home Details show that the major East African cities have
over 50 percent of all the urban population while the minor cities
are far less than 50 percent of the total urban population
Standardization of East African people Is too difficult
due to the fact that the population Is composed of a variety of
sub-races whose traditions differ from each other among the tribes
The sub-races classified are
1 Nilotes
2 Nilo-Hamltes
3 Inter-cush Ite
4 Bantus
Based upon the sub-races of East African people the traditional
heritage carried frnom one generation to the other makes the economy
88
of the community hard to work In Perhaps even more important on
the economic outlook is the Inheritance of continuing extended
family contrasts In age and sex
The study shows that trading Is an extremely important
economic activity even though it Is not Itself productive The
trade Itudy has shown that trade has been playing a smaller part
in East Africa and for those operating Its economic efficiency is
very low The greatest part of trading activities is located in
the major East African cities This conclusion has led to the fact
that the majority of the people are living In rural areas where
means of traveling to cities are difficult for them and the lack
of money has probably created the situation where people have to
live subsistently
CONCLUSIONS
The conclusions of the survey of literature and the analysis
of findings follow
Survey of Literature
If It Is correct as suggested by Kamark that the economic
lives of rural Africans are not Influenced by environmental conshy
dltlons more than by cultural disposition then this would mean
that the Introduction for new technology should bring about economic
changes relatively unhIndered by cultural conservatlsm1 That
Is to say the potentIalIties of natural resources can be more
IKamark M Andrews The Economics of African Development (New York Praeger Incorporated 1967) p 79
89
effectively tapped by the Introduction of new methods and undershy
standing and new forms of organization of production It may be
objected that this In fact has not occurred In East Africa and
precisely some would say because of limitations of cultural
conservatlsm 11 But closer studies quite strongly suggest that
where people can see the advantages to themselves of economic changes
2that are both feasible and safe then the changes do occur Thus
African people have accepted changes first and most radically (indeed
they have often deliberately sought them) In the more favorable
areas where the possibilities of new technology and new Ideas are
more readily applicable and where people are exposed to external
influences and have access to modern communicatIons and living styles
The type of national economic progress which is to emerge
the longer-term political goals the roots of nationhood In the
multiplicity of subcultures and naturally uneconomical tribal ties
out of which national culture is forged remain the crucial unanswered
questIons whIch affect the economic progress of East Africa
Analysis of Findings
The results of the analysis has shown that the elite of
East Africa have advanced to a more desIrable socloeconomlc way
of thinkIng ThIs conclusion has led the author to suggest that
perhaps the integrating forms of tribes can be worked out beginning
with the East African elite for however much too depends ultimately
on local and tribal support they have more chance to see above
2 Ibid p 98
90
the disadvantages of these functions The middle class is still
small flexible mobile and unstable not yet clearly or acceptably
dlfferentl~ted from strata above or below The mass of unskilled
workers are the most temporary and the least Involved If no efforts
or attempts are applied the society will inevitably continue to
live In their life of ethnically based networks and subcultural
pockets
16
AHdflJ )O 118 18
BIBLIOGRAPHY
Abraham R G East African Townshipl in A W Southhall (eds) Social Change In Modern Africa New York Oxford University Press 1970
Baver P T and B S Ymey The Economics of Under-developed Countries C U P Cambridge University Press 1957
Blacker E A Demography New York Oxford University Press 1948
Ethographic Survey of Africa East Central Africa London International African Institute 1970
Boesch H A Geography of World Economy Van Nostrand Princeton University Press 1964
Brown L H in E W Russell (ed) The Resources of East Africa Nairobi Literative Bureau 1968
Burke G Fred Africanls Quest for Order Englewood Cliffs New Jersey~ Prentice Hall 1964
The Economics of Underdeveloped Countries New York OxfOrd University Press 1972
Cley and P Robson IFederation of East Afrlca11 Structure and Administration of E A C S O New York Oxford University Press 1964
Doob W Leonard Periodic Surveys in Subsaharan Africa Nairobi Nairobi Publishing House 1970
East African Community Annual Report Nairobi Kenya Government Press 1966
Economic and Statistical Review Nairobi The East African Statlsshytlcal Department 1964 _
Encyclopedia Americana East Africa Vol 4 1974
Encyclopedia Brltanlca East African Community University of Chicago Macropedla Vol I II 1974
Goldthrope J E and F B Wilson Tribal Maps of East Africa and Zanzibar Kampala East African institute of Social Research 1966
92
93
Good M Cha~les Jr Dimensions of East African Cultures New York Oxford University Press 1970
Gulliver P H Labor Migration in a Rural Economy Kampala E A I S R 1955
Harlow V and E M Chi lver History of East Africa Vol II Oxford Clerendon 1962
Hawks D A IIEast Afrlca1I Trade and Industry Official Journal of Association of East African Industries Nairobi Nairobi Publishing House 1963
Hopkins Elizabeth IIConflict of Tribal and Racial Conflict in Stanley and Burke (eds) Transformation of East Africa New York Basic Books Printers 1966
Industrialization in East Africa 5th Edition Nairobi United Africa Press 1966
Jamal A H The Critical Phase of Emerged African States Afalrasl East African Publishing House 1965
Johnson B F The Staple Food Economics of Tropical Africa Stanford California Stanford University Press 1970
Johnson D H Rainfall in East Africa Q F R Vol 5 Nairobi East African Publishing House 1968
Jones Carey Geographical Journal Vol 131 Part 2 New York Oxford University Press 1965
Kamark M Andrew liThe East African Community The Economics of East African Development New York Praegam Incorporated 1971
Kenya Chamber of Commerce Trade Nairobi Kenya Government Press 1973 --~
Lewis William Allen The Theory of East African Literature Nairobi Bureau Annual Report 1965-6
Morgan W T W IIEast Africa Its People and Resources II People New York Oxford University Press 1969
Morgan W T W and N M Shaffer Distribution and Density New York Oxford University Press 1970
Myrdel Uninnar An International Economy Problem and Prospects New York Harper 1969
OConner A N An Economic Geography of East Africa New York Preager 1966
94
Oxford Economic Atlas East African Community New York Oxford University Press 1972
Reed Moyer and Hullanderc Stanley Markets In Developing Economies Illinois R D Irwin 1968
Republ ic of Kenya Newsletter Washington D C 1975 Vol 3 No5
Richard A I Economic Development and Tribal Change Nairobi East African Publishing House 1969
Rosberg A and A Segal East African Federation Internatlonal Conciliation 1963
Samson H W The Climate of East Africa Nairobi Memoirs Vol II I No2
Schneider in W R Bascom and M J Herskovits Continuity and Change in East African Cultures Chioago University of Chicago Press 1959
Seggerson E P Physiography of East Africa Nairobi Press 1962
Southhall A W Growth of Urban SocletyI Dar-esmiddotSalaam New York Oxford University Press 1969
The East African East African Common Services Report Nairobi Kenya Government Press 1966
Thompson B W The Climate of Africa Nairobi Oxford University Press 1965
UNESCO Populatlon Movements in East Afrlca in K M Barbour and R M Prethere (eds) Essay on African Population Routledge and Kegan New York Oxford University Press 1961
Walder D Problems of Economic Development of East Africa In E A G Robinson (ed) Economic Development of South Sahara London McMillan 1964
Warren J Keezan International Marketing Less Developed Countries Englewood Cliffs New Jersey Prentice Hall Incorporated 1974
Wilson A M Social Change In Modern Africa New York University of Oxford Press 1961
Wilson M Gordon liThe Transformation of East Africa Basic Scale for Periodic Research New York Basic Books Printer 1971
S6
XION3ddf
bull
96
URSAN CENTERS
- bullbullbullo1
IL RUdDIf---J -
( L KENYA I
I I I
hlo10bull I I J
- Tllo
Tflgflylfl
-Dodo TAN3ANYllltA
It
bull Imp ~1 bull
JII
~ ~t - bullKlIer
~ ~ JIOlJLAIO
~ ~~ ~ (0 C~CV ~oo Lindl ~ a CO (1(( 00(tOO
c ~tCC a oocmiddot ~~ L Ny ~tWllra1 c ~~(V( 0 ~J(JC~ ~ l(l~5 7~ ~~~~ i~j~) ~J r =X 0 1 ~O _-A- J 0 100 bull - -
mil bull~~ ~__-- _ llo
l6
bull
o
MII bullbullbullbullbullbull bullbullbullbullbullbulll1li bull bull ~ =
middot1
bullbullbull bullbull~ pound
-w
)
umiddot~middot middotmiddotMI
c
gt amp c o
ImiddotUmiddotmiddot middotmiddot0 L
1 bull l
)
L
~
middotmiddotmiddotmiddot1 L
~
~
1 ~
~ ~ I ~ L ~
i 1 middotmiddotmiddotrmiddotmiddotI bull bull ~
I r j L
-r Y
I~ bull CL -J II w 1
VINVZNVl
eII_
fbullbull bull~1
~ r
z
c
o
11Ie
) 11111_0 -shy
N a n s
~______
middot~middot(1 -bullbull
__rr~)
I
I
I I I
~ I ~
I I I ~ I
vaNv~n
66
o
1 IIit
c
Cl
S iII III J
Ibullbullbull middot1t-11 1 114bullc ~~1
bull
001
INZN1L
10 l
r
01 bull 1middot ) l pltllI1 -tpn I I c
o
z
o
bull
J I
lt
- Njoroge 1975
- Njoroge 1975 pt2
-

2
protectorate while Tanganyika was administered by the British
under Uni~ed Nations trusteeship2 The British territories have
enjoyed common markets and certain services such as publ ic comshy
munications administered by East African Common Services today
known as the East African Community
East Africa is the meeting point for all the contlnents
major 1ingJistic groups Even Cl ick Language is represented
in Central Tanzania The three greatest sub-races (of African
origin) ar~ the Nilotics Nilo-himites and the Bantus 3
THE PROBLEM AND DEFINITIONS OF TERMS USED
Statement of the Problem
This study was designed to
1 Analyze the factors which have slowed the economic
development of the East African community
2 Identify the major problems encountered In economic
systems in East Africa
3 Determine the problems in developing the economic growth
of the comm~nity
4 Identify economic reconstruction needs
2Cloey and P Robson Federation of East Africamiddot Structure and Administration of E A C S O (New York Oxford University Press 1964) p 37
3W T W Morgan lEast Africa Its People and Resources People (New York Oxford University Press 1969) p 33
3
Importance 0f the Study
The economy of the East Africa community Is growing at a
high rate as projected yet the majority of the citizens of the
community remain on the poverty level In order to explain this
paradox we will look at the problems tending to withhold economic
success from many members of the community
Limitatlo~s of the Study
The study has the following limitations the data in
this study are limited to that available at the William Allen
White Library at Emporia Kansas State College and through their
facilities through interlibrary loans As Indicated in much of
the relevant data surveyed much of the available material is not
current 4
Assumptions
Certain assumptions underlie this study These assumptions
can be summarized as follows
1 The environment in which the desired economy operates
is such t~at the beneficiary does not readily appreciate the value
of change and thus lacks interest in It
2 The East African citizen is suspicious of accepting
the change to more progressive socioeconomic standards
4
DEFINITIONS OF TERMS USED
Arusha
The capital city of East African Community (1967 Declarashy
tlon)5
Dar-es-Salaam
Capital and largest city in Tanzania It is also one of
6the chief port cities of East Africa
Duka
Small shops normally operated by a single family7
E A C or Eo A
Abbreviation for East African Community Is an economic
organizaticn consisting of three member countries of Kenya Uganda
and Tanzania (associate members include Zambia Ethiopia Somal ia
and Burundi) The existing community is based on a treaty signed
in Kampala on June 6 1967 to preserve and re-establish a large
part of the corporative relationship that was disappearing 8
5A W Southhall Growth of Urban Society Dar-es-Salaam (New York Oxford University Press 1969) p 483
6 Ibid p 481
7J bull Keezan Warren International Marketing Channels Less Develo ed Countries (Englewood Cliffs New Jersey Prentice Hall Incorporated 197 p 309
8Andr~w M Kamark liThe East African Community The Ecoshynomics of African Development (New York Praegam Incorporated 1971) p 5C
5
Gazetted Township
Go~ernment official papers classifying towns population
by residenc~9
Great Rift Valley
Geologically this structure is called a Ilgra ben 1I This
valley exte~ds as a series of depressions from Syria through the
Dead Sea (the surface is nearly 1300 feet below sea-level) to
Africa In East Africa It divides into two branches western
and eastern Igneous activities and volcanoes are associated with
the rift valley forming such peaks as Kllimanjaro these are now 10
dead
Kampala
Th~ capital and the largest city in Uganda It was made
the capital In 1962 when Uganda previously a British protectorate
bull d d IIbecame an In epen ent nation
Municipalities Grade A amp B Townships
Gr~de A -- Municipal towns these towns have populations
above sixty thousand
Grade B -- Townships under local government authorities
12Normally these towns have populations below sixty thousand
9Rbull ~ Abraham IIEast African Townshipl In A W Southhall (ed ) Social Chane in Modern Africa (New York Oxford University Press 197D) p 33
lOE P Seggerson Physiography of East Africa (Nairobi Na I rob I Pless 1962) p 10
Ilsouthhall op cit p 477 12Abraham loc cit
bull 6
Nairobi
The capital and the largest city In Kenya with a population
13nearing one million people according to the 1971 population census
Non-African
A resident who is an Immigrant from other continents besides
Africa The majority of Non-Africans are Europeans and Asians
(Indians)14
Pound
East African sterling currency (Pound~) 1 ~ bull shs 20
Equivalent to $28 u S currency 1975 15
Settlers
European immigrants farmers to the East Afrlca 16
Shillings
East ~frican sterling currency (shs) shs 20 z l~ 17
13Southhall op cit p 469
14Abraham loc cit Non-Africans comprise people (male or female) of European or American origin Arabs Indians and Far East Asians
15K~nya Newsletter issued by Section of Embassy Republic of Kenya Jashington D C Vol 3 No5 (1975) p 28
16Ellzabeth Hopkins IRacial Minorities in British East Africa in Stanley and Burke (eds) Transformation of East Africa (New York Basic Books Printers 1966) p 87
17Kenya Newsletter loco cit
7
Swahili
A language of the coastal population of East Africa roughly
from Southern Somalia to Mozanlbique and including Zanzibar and
the Comoro Islands It Is spoken by about 15 million people as
a first langu~ge this includes the people In East Africa and
Congo (Klns~asa)18
METHODS OF PROCEDURE
All the published materials listed below were extensively
reviewed Thl~ included library review of both periodicals and
relevant st~dies The writing of this report is thus based on
the Information provided by the following
1 Periodicals books pamphlets and microfilm from the
William Allen White Library of the Emporia Kansas State College
2 Xeroxed materials and books that were secured through
the inter-library loan and from friends
3 uata collected specifically for use In this study by
the Marco Survey Ltd Nairobi Kenya
4 Periodicals Issued by the information section of the
Embassy of the Republic of Kenya Washington D C
PLAN OF STUDY
In the preceding section the purpose of this study Its
importance the limitations assumptions definitions of terms
18Encyclopedia Americana Swahili Vol 26 (1974) p 85
8
and methods of procedure have been outlined Related literature
largely stu~ies of structure with regard to economic development
in East Africa is presented in Chapter 2 Chapter 3 presents a
background of pertinent economic facts concerning East Africa
Chapter 4 deals with an analysis of factors In Chapter 5 the
data is summarized and conclusions are drawn
Chapter 2
THE REVIEW OF RELATED LITERATURE
British East Africa was the name applied to the territories
In East Africa before they achieved Independence The territories
Included the ~olonles and the protectorate of Kenya the United
NatIons trust territory of Tanganyika and Uganda These territories
had a total area of 682469 square mlles l British East Africa was
economicalya system of joint services The East Africa High
Commission which consisted of the Governors of Kenya Tanganyika
and Uganda was responsible for the administration of public services
and functions common to territories including currency roads
customs apd communications Each territory1s government retained
responsibility for local services such as health education and
police 2
After World War I I nationalist feeling was strong throughout
British East Africa As the deadline for Independence approached
Britain attempted to form a federation of East Africa but separate
nationalist aspirations made this Imposslble 3 Tanganyika was the
IEncyclopedla Americana East Africa Vol 4 (1974) p 578
2East Africa Geographical Journal Vol 129 Part 2 1963 pp 140-155
3Abull Ro~berg and A Segal East African Federation IIlntershynational Concll iatlon11 1963 p 30
9
10
4first of the four territories to achieve Independence In 1961
Uganda became independent In- 1962 The following year Kenya and
Zanzibar entered the ranks of Independent states Tanganyika and
Zanzibar merged In 1964 and adopted the name United Republic of
Tanzania 5
After Tanganyika became Independent the East African
High Commission was suceeded by the East African Common Services
Organizatior which performed the same functions as its predecessors 6
Finally the East African Common Services became the East AfrIcan
Community The East African Community was formed to establish a
customs union to facilitate the industrial development of the
area and to carryon research activities and common services preshy
vlously controlled by the East African Common Services organization
The community was re-establlshed by a treaty signed by three member
nations In Kampala Uganda on June 6 1967 7
The community provides for free intercommunity trade and
a system of c~nmon external tariffs there Is also a system of
transfer tnxes that may be Imposed on certain commodities Imported
from other members by a country with a trade deficit wIthIn the
other two members Transportation and communications services
are handled by community corporations for raIlways harbors post
4 Ibid p 8 5 IbId p 12 bull
6Encyclopedia Britanlca East African Community University o~ Chicago Macropedia Vol I I I (1974) p 754
7The East African East African Common Services Report (Nairobi Kenya Government Press 1966) p 3
I I
and telecommunications and alrways8 The East African Development
Bank established in 1967 provides and emphasizes projects that
tend to make the three economies complementary9 Although all
three countries contribute on an equal basis to the bank Kenya
the most advanced receives a smaller share of Investments and
guarantees In accordance with the policy of even development among
the states
East Africa is also the meeting point for all the continents
major linguistic groups Even Click Language l is represented in
Central Tanzania
EAST AFRICAN GEOGRAPHY
Regional Survey
East Africa borders the Indian Ocean for about eight hundred
miles and the coastlands form a very distinctive zone although
the plain Is only one hundred miles wide around the Kenya and
Tanzania border IO Winds from the ocean bring a high ralnfal I
to most of the land close to the coast This fertile land Is quite
densely populated The rainfall drops quite rapidly Inland and
land quickly becomes arid and sparcely populated As one travels
from the Iterior towards the coast the change from scared bush
to forest is evident
8 Ibid p 9
9East African Community Annual Report (Nairobi Kenya Government Press 1969) p 38
IOCharles H Gpod Jr Dimensions of East African Cultures (New York Oxford University Press 1970) p 8B
12
Some of the special characteristics of the coastland stem
from the fact that many people have approached them from the sea
and have ~ot penetrated far inland Although most of the population
is African there is a substantial Arab settlement in sharp contrast
to the rest of East Africa Mombasa Is an old town (see map of
East African cities on page 96) Dar-es-Salaam and Tanga are not
These three cities are distinctive In that through them passes
most of the foreign trade of East Afrlca ll This tends to quicken
the pace of economic activities there although In the whole zone
the high temperature (high humidity) resulting from the low altitude
tends to slow It down
The coastal zone Includes the islands of Zanzibar and
Pamba and Mafia together They constituted a separate state for
middotover one hundred years until they joined with Tanganyika to form
anew state of Tanzania in 1964 12
The Nyika Plateau
Away from the coast the land rises fairly gently to flat
plateaus covering between 3500 to 5000 feet above sea level
known In some areas as Nyika (Swahili for wilderness) This is
an area of short rainfall poor scrub vegetation and very sparce
13population separating richer lands In the Interior from the sea
llA M Wilson Social Change In Hodern Africa (New York Oxford University Press 1961) p 35
12Carey Jones Geographical Journal Vol 131 Part 2 (New York Oxford University Press 1965) p 186
lnE P Seggerson Physiography of East Africa (Nairobi East Africa Publishing House 1962) p 10
13
It is broken by mountain ranges notably Usambara and Pare mountains
Taita h1115 where relief brings about a higher rainfall and where
more people have settled Further south it is broken by a zone
of lowland in the basins of the Ruaha and Rufingi rivers where
settlement Is discouraged by periodic floods and disease rather
than by low r3infall Water scarce in East Africa is abundant
there and cen be controlled This area offers promise for future
agricultural development In the south of Tanzania the plateau
reappears but the rainfall exceeds thirty inches in most years
and much of the land is under cultlvatlon 14 The rainfall Is
unreliable soil is poor and the area is remote from central
economic life in Tanzania 15
Th~ highland south of the Nylka has recent volcanic rocks
It stands up as highlands reaching to 19500 feet including
KilimanJaro Mt Kenya and Elgon (see map on page 14) From the
land over seven thousand feet above sea level it extends three
hundred miles westward almost to the shore of Lake Victoria Although
It Is brokpfl by the lINorth Rift Valleyll (not shown in the map)
the floor of which in places lies six thousand feet below the land
to either side 16 In this highland heavy rainfall and fertile
volcanic soils provide excellent conditions for agriculture Much
14gt H Johnson Rainfall in East Africa Q F R Vol 5 88 (Nairobi East Africa Publishing House 1962) pp 1-9
IS ibid p 10
16Seggerson Ope cit p 10
ofx-----_ - -~~ -----------~
QOO 000 ~I)
-==----=-----shy
~ )00 -OOOt
Wi~Z1 ~ OOOt -0001
u
o
z
o
15
of the land Is under cultivation but the fruit of this agricultural
production is offset by the dense population 17
Lake Victoria Basin
The land falls slightly northward from the central plateau
of Tanzania towards the Lake Victoria Basin and the densIty of
the population is increased greatly The Basin is one of the
richest zores of East Africa supporting over a quarter of the
population of the regIon The country receives more rain and
has more fertile soil than that to the south and advantage has
been taken of its agricultural opportunities The land around
the lake in some ways forms a single unIt although it is divided
among the thr~estates This region Is densely settled by farmers
who produce much cotton as well as animal food crops also bananas
(Uganda) a~d coffee providing a green landscape all year around 18
THE ECONOMY
Subsistence Economy
In terms of the actIvity of an average East African man
or woman the subsistence element in East African economies is
probably still domlnent 19 That is to say the amount of time
the average East African spends on activities that merely keep
17w T W Morgan and N M Shaffer Distribution and Density (New York Oxford University Press 1966) p 36
18 Ibld p 38
19~ F Johnson The Sta Ie Food Economics of Tro ical Africa (Stanford Californ a Stan ord UnIversity Press 1970 p 142
16
him alive ana functioning is greater than the amount of time he
spends ear~ing discretionary income The average East African
is more in than out of the subsistence tribal economy20 He produces
most of the goods and services he consumes
The permeation of the money economy throughout Africa not
only has considerable importance in Its own right but will influence
the whole pace of economic development In the future It is almost
impossible for anyone who has not lived in a subsistence economy
to appreciate how profoundly it affects ones activities and outshy
look To live in a subsistence economy means to live a hand-toshy
mouth existence in a world of great risk and uncertainty Without
the techniques or facilities for storage of food over any appreciable
period the East African is dependent on the yearly crop or his
luck In hunting or fishing Nearly every people have a hungry
season ll when the 1ast season I s crop has been eaten and the new
crop has not yet come In The risk and uncertainty affecting a
whole community is less with the spread of the money economy
because It is possible for individuals both to create a margin of
security for themselves by setting aside a permanent store of value
In the form of money and to survive apart from the communlty21
The Public Sector
From a comparatively late point In the development of East
Africa the government role in the economy was a major one The
private investments and the stimulation of production was encouraged
20 Ibid p 151 21 Ibid p 147
17
by the gov~rnment The corollary of this Is the continuing imporshy
tance of the government as employer and of the publicly owned
sector generally in the national accounts
In East Afri ca Ilcurrent government expend i tures run over
15 percent of the gross national expenditure 1I22 If one adds the
operations of the railway electricity authorities ports etc
and the investments in the whole part public sector the total
approaches Hone-third of the gross domestic product-II Together
they are therefore the dominant economic influence in the money
economy of East Africa 23 Many East Africans expect the state
or public agency to be their employer This has the effect of
reinforcing o~e of the worst heritages of colonialism--the East
Africans arceptance of the idea that the best job to have is a
government post
Excessive Expectations for Public Service
The paternalistic attitude of colonial administration
particularly after World War II also left behind the habit of
expecting co~siderable benefit from free public services--free
schools iree medical services free or subsidized electricity
and subsidized housing 24
22Enclc loped ia Amer icana East Afr ica Vol 4 (1974) p 576
23 Ioid p 577
24Abull H Jamal The Critical Phase of Emerged African States (Afairasi East African Publishing House 1965) p 101
18
The colonial government provided most of this for East
Africa1s cities--usually at the expense of the lIagr icultural popushy
lation I But with the growth of the cities and the legitimate
pol itical de~and for the expansion and extension of these services
throughout the land it becomes financially impossible to maintain
them on the uneconomic basis of the past It is also economic
nonsense to consume resources In subsidies rather than use them
for economic development 25
Thr~ughout the world pressure for such services Is present
The way it is kept in line with what Is economically feasible Is
either to charge the economic price or to hand over responsibility
for the services to the local government concerned in which case
the citizens can make a choice between paying higher taxes or using
26the money for other purposes But with the usual East African
centralization of responsibility for these services in the national
government this economic calculus does not occur so Immediately
and directly Pressure for the services thus tends to lead the
East African governments constantly to Increase their expenditures
for them and to give lower priority to other investments that might
In fact re~ult In faster growth of the national income 27
25Ibid bullbull p 129
26 1bid p 159
~~ 71bid p 179
19
POPULATION DISTRIBUTION
Accorciing to the mid-year population estimates for 1968
the population of East Africa was 268 mllllon 28 Based on the
total land area of 642252 square miles mean populatIon density
of forty-two persons per square mile is obtained When compared
with the m~jor countries of Europe and Asia the mean population
of East Africa is very low According to the 1961 census India
had a total population of 438 million on an area of 126 mil lion
square miles with a mean population density of 319 persons per
square mile 29
Table
Mean Population Estimates Per Space Land (1968)
Estimated Total Land Area Population Mean Population
(Square Mi les) 1968 Per Square Mile
Kenya 219789 9104000 41
Tanzania 342171 10325000 30
Uganda 80292 7367000 92
Regional Population
The population of East Africa may be broadly divided into
three main categories first those around the shores of Lake
2EOxford Economic Atlas East African Community (New York Oxford University Press 1972) pp 174216 and 221
29lbid
20
Victoria ~econd those In the highlands country and In the footshy
hills of the major mountains third those in the coastal belt 30
Lake Victoria Is ringed on almost all sides by areas of
dense population In Tanganyika the lake and west regions which
surround the southern half of the lake comprised in 1967 a popushy
lation of some two and a quarter million over a quarter of the
total popuialon of Tanganyika although the land area formed only
one-eleventh of the countrys total On the north-western and
northern side of the lake the Masaka Mengo and BU50ga districts
of Uganda contained in 196B two and one-half million people
Finally on the north-eastern side Luo country in the Nyanza Province
of Kenya likewise showed In 1968 comparable densities of over two
hundred persons per square mile 31
In the group of the mountain areas we must include the
thickly populated districts of Central Province of Kenya where
the Kikuyu Embu Meru land units cluster In some districts popushy
lation densities range to two hundred to five hundred persons per
square mlleo North Nyanza and around the slopes of Mount Elgon
have densl~ies varying from three hundred to five hundred per square
mile whil~ on the western side of the mountains Uganda districts
have similar densities of between two hundred to three hundred
persons per square mile In Tanzania the category of thickly
populated mountainous regions includes the southern slopes of
30w T W Morgan and N M Shaffer op cit p 29
31Ibid p 27
21
Kilimanjaro ard Mount Meru and Livingstone Mountain in Southern
Highlands 32
The coastal belt consisting of a strip of low lying country
constitutes o~r third region of highly populated density This
area has beell subject to substantial immigration The population
was attracted not only to coastal cities but also by the large
sisal and sugar industrial plants oil refinery and shipping labor
which have drawn immigrant labor from all parts of East Africa 33
Urban Population
Precise international comparisons tend to be vitalized
by the fact that the destination of urban population varied from
country to country and from census to census It Is also true
that urbanization of the population of East Africa is extremely
low
In the Tanzania census of 1968 thirty-three Igazetted
townships were defined which comprises an aggregate population
of 664072 persons of all races or 51 percent of the total popushy
lation of the country34 Of this population over a third were
In Dar-es-Salaam (228742) and Tanga (138053)
In Uganda the census of 1968 contained as gazetted townshy
shlps those which comprised an aggregate population of 409075
32Seggerson Ope cit p 138
33lbid p 139
34Rbull G Abraham East African Townshlp In A W Southhall (ed ) Social Change in Modern Africa (New York Oxford University Press 1970) p 300
22
persons of all races or 2 percent of the population of the country35
Of these over one-third consisted of the populations of Kampala
and Jinja For the purpose of the Kenya population census urban
areas were divided into four categories municipalities grade
A townships grade B townships and trading centers 36 Not all
trading centers were defined as separate census areas and when
the results of the census were obtained it was found that several
of the grade B and even some of the grade A II had such small
populations that they could scarcely be regarded as towns in the
normally accepted meaning of the word The author therefore
defined urban areas as towns with a total of over two thousand
people There are approximately thirty-four towns of over two
hundred population
PEOPLE
It is difficult in the tradition of great social and cultural
diversity to distinguish East Africa by tribe but it Is very
difficult to give definitions of units that will accommodate the
wide range of factors Clearly tribe has reference to a distincshy
tlve group of people that possess the heritage of a common culture
lithe total of their forms of social organization historical trashy
ditions la~ and customs value and beliefs 1I37
35Ibid p 310 36 Ibid p 312
37w T W Morgan East Africa Its People and Resources People (New York Oxford University Press 1969) p 34
23
ThuD it is necessary to be somewhat arbitrary in disshy
tinguishing the various people of East Africa The term tribes
has the same sort of imprecise usefulness difficult to define
specifically as the term c lass in western industrial ized
countries 38 The late Dr Leaky (archeologist and sociologist)
classifies East African people into three distinctive parts
They are broadly classified on III inguistic and traditional basis ll
I into Nllotes Nilo-hlmites and Bantus 39 Such distinctions are
i 1 1 Table 2 1I The 0 1st r ibut ion of the Af r ican and the IINon-Af r ican ll
I in proportion by Cities4 1968 0
I 1 1
Country African INon-Afr Ican ll
Tanzania 4 1 721
Uganda 30 850
Kenya 53 850
very adequa~e to the actlvltes and interests which are of concern
to the people themselves in their ordinary lives For example
the Luo (nilotic) with their communal living society and with a
mixed economy of agriculture do not resemble the Masai (nlloshy
hlmltes) with their pastoral economy who are non-farmers they
~ 38 10 id p 36 39Ibid p 38
4UR G Abraham op cit p 318 IINon-African ll comprises people (male or female) of European or American origin Arabs Indians and Far East Asians
24
do not eat sea food The Bantus In East Africa (found mainly on
the southern hemispheres of Africa) have an exceptionally wide
range of cultures and economic systems 41
The Tribal Iassification
The term East African people identifies about 11110 different
people in the mainland Tanzania about 35 in Kenya and about 37
In Uganda42 Of these five comprise over a million people each
forty-threp exceed one hundred thousand people The smallest
tribes contdln only a few hundred people but their culture intershy
mediate zo~es are generally between one and another 43 Blackers
book of East African lIdemography provides an adequate overall
account of the traditional culture and social system of perhaps
thirty of these tribes 44
A number of larger and Important tribes remain still
undescribed by modern standard needs Published studies of social
and economic changes In recent decades are fewer even for those
people such as Kikuyu and Chagga where change has been most
radical Most books dealing with the traditional cuiture of East
African people were written many years ago and are not reliable
41Morgan Ope cit p 40 42 1bid p 36
43E A Blacker lIDemographyl1 (New York Oxford University Press 1948) p 43 The best general surveys of available Inforshymation are contained In the volume of the lIEthographic Survey of Africa (East Central Africa) 11 (London International African Institute 1970) p 70
441 bId p 79
25
guides for the study of people of East Africa in the second half
of the twentieth century
Historical Clusters
Although some tribes remain as little more than names on
the enthographlc map It Is possible to group the better known
people Into clusters which are identifiable In terms of common
historical traditions linguistic similarities and certain related
social Institutions and values As far as present knowledge goes
the following clusters are fairlyclear Only the larger tribes
are indlca~ed In the lists
Tribal names are given in their root forms
(a) Nilotes--Acholi Alur Lango Luo Padhola (b) Nilo-Hamites--(eastern Nilotes)
1 Teso Cluster--Karamojong Teso Turkana 2 Kalegln-Elgeyo Kipsiqis Nandi Tuqen 3 Masal Cluster--Arusha Masal Samburu 4 Tatoq Cluster--Barabalg
(c) Inter-custrlne Bantu--Ganda Ha Haya Klga Nkole Njoro Rundl Rwanda Soya Toro
(d) Elgon Bantu--Aisu Lugya (e) North Eastern Bantu--Chagga Embu Gusli (kissl)
Kamba Kikuyu Meru Mbere (f) Coast Bantu-Bondei Olgo Mljikenda Sambaa Zigua (g) Nyamwezi Cluster--Bena Hehe Sangu (h) Luguru Cluster--Kaguru Luguru Ngru4(I) Rouma Cluster--Makinde Makua Mawia 5
In no case are all the people of a cluster identical In
their econOOlic system In terms of their traditional economic
systems and the exploitation of the natural resources a more undershy
standable classification can be made In the following way
45 1bId p 15
26
A Primary Pastoral Economy with little or no agrlculture-shyBarabaig Boran Masal Redille Saburu Somalia Pastoral suk Turkana
B Mixed Pastoral and Agricultural Economy I Pastoral Ism predominant--Aogo Karamojong Klpsiqis
Kuna Nandi 2 Agriculturalism predomlnant--Arusha Bela Klssl
Ha Hehe Iraqw Iramba Kamba Lango Luqbata North Luhya Luo Njakjusa Padhola Rangl Hlgland Suk Sukuma Teso Tugen Turu
C Mainly Agricultural Economy with minor pastoral Interests--Acholl Alur Chagga Embu Alsu Kikuyu Nyoro Sambaa Toro
D Primary Agricultural Economy with little or no husshybandry--Digo Ganda Haya Klga K~gjO Makua Ngorl Ngindo Nyanwaz Soga Yao Zaramo Zlqua
There have been great basic changes that have occurred in
the last two decades toward a greater development of agricultural
Interest slight disappearance of tribal territories (traditions
of belief) due density Increasing demand for cash income and
greater att~nton to crop production husbandry by government and
47commercial concerns
AFRICAN HERITAGE
In general African cultural social background relevant
to economic development is very different from that of any other
developing region of the world Because of Africas geography
great size and climate It was after 1900 that the Influence of
the rest of the world began to reach most of Africa South of
Sahara 48
46 I bid p 2I bull 47Morgan Ope cit p 36
48~ K~ Schneider In W R Bascom and M J Herskovlts Continuity and Change In East African Cultures (Chicago University of Chicago Press 1959) pp 144-167
27
Perhaps there is a need to break the old African tradishy
tional heritage that Is passed to modern Africa A study of the
old African economy shows that it was one In which the methods of
production were simple and the units of production were small
The mlddle-nlen were both hated and Indlspensible Agricultural
progress was seriously impeded by the perpetuation of communal
right-over land 49 Chronic underemployment was one of Its basic
problems and despite moral exhortations among the people the
propensity to save was low It was an economy heavily dependent
on foreign sources for improved Industrial and agricultural methods
and to so~e extent for capital 50 The ambitious young men often
preferred careers In the professions and government service Men
here wrongly pinned their hopes on industrialization and economic
nationalism to absorb Its growing population Industrialization
was slow to come and the blessing of economic nationalism proved
to be mixed 51
The Extende~ Family
Perhaps even more Important than economic outlook both
positively and negatively Is the Inheritance of the continuing
strength of the tribal ties to which nearly all East Africans are
subject To begin with one must consider the L1neage Systems
49bld p 152
seA I Richard Economic Development and Tribal (Nairobi East African Publishing House 1969) p 78
Change
51lndustrlallzatlon In East Africa 5th Edition by United Africa Press Natrobl 1966 p 87
Published
28
or extended familyll--under which an individual has deep ties with
and feels obligation to a large number of people beyond the nuclear
family of the fathers mother and chlldren 52 Good fortune is
shared with m~ny others and In crisis one Individual can calion
help from many others
UnfCrtunately in terms of potential economic development
the extended family has many drawbacks It tends to discourage
Individual enterprise and Initiative as the burden of family
53obligations rise with the degree of an indlviduals success
There are other drawbacks Family crises tend to prevent
accumulation of capital or drain away the discretionary purchasing
power 54 The people with small incomes find it hard to comprehend
the greater cost of living of individuals with higher incomes
The age structure for the East African population is sigshy
nificant for as In most underdeveloped countries a large proshy
portion of the population is not of working age 55 Children of
fourteen years or under account for about 45 percent of the total
population which is comparable with the figure for Nigeria or
Brazil and in East Africa many children assist in picking cotton
or herding cattle Nevertheless productivity Is generally far
lower than that of adults and as increasing numbers of children
52UNESCO 11Popuiation Movements in East Africa in K M Barbour an~ R M Prethero (eds) Essay on African Population Routledge and Kegan (New York Oxford University Press 1961) p 96
53Ibid p 98 54( bid p 100
55L H Brown in E W Russell (ed) The Resources of East Africa (Nairobi Llterative Bureau 1968) p 102
29
attend school their contribution is decreasing although education
should enhan~p their income earning capacity in the future
Sh~rp contrasts in age and sex structure exist within East
Africa generally resulting from migration In NJombe and Songea
districts in Southern Tanzania about one-third of the adult men
are usually away Thus adult males make up a much smaller proshy
portion of the resident population than is normal The situation
is similar on~ thousand miles away in west Niles District of Uganda
The males of sixteen or over account for only 22 percent of the
population compared with the national average of 28 percent and
In the Kingezi District less than 20 percent were adult men according
to the 1969 census The absence of adult men Is even more marked
in parts of western Kenya for they comprise only 17 percent of
56the Kakamega District In the Kenya 1968 census
In Q1I these areas the high ratio of children to adults
tends to lo~er the level of economic activity This is not true
of the preponderance of women among the adults for they generally
do more work than men but the ratio of men to women may affect
57the economic activity in each area
Con~ersely an unusually high proportion of men of working
age means ~)re development 58 This is most evident in the cities
but also applies to larger areas such as Buganda or Tanga regions
Other factors must be favorable to attract people but the relatively
56Fred A Burke The Economics of Underdeveloped Countries (New York Oxford University Press 1972) pp 11-15
57 58Ibid p 29 Ibid p 30
30
high level of activity In areas such as Buganda is certainly related
to the age and sex and especially to the numerous Immigrant men
who either work as laborers or grow cash crops on their own account
there rather than In their home area
THE ECONOMIC ACTIVITIES OF EAST AFRICA
Trading Is an extremely Important economic activity even
though It Is not Itself productlve 59 By redistributing goods It
increases their value and It provides much employment in the process
Yet trading is sometimes omitted In studies In marketing geography
partly because of little data available on internal trade in East
Afrlca 60 However the main tradIng pattern of the regIon may be
outlined
Trade plays a smaller part In East African life than in
that of more highly developed regIons where peoples wants are
greater and where they satisfy few of their own requirements It
Is less Important even than in West Africa where It forms the
main Inter~st of an enormous number of people 61 Most East African
people produce theIr own food and cannot afford to buy many other
goods Nevertheless some goods are now sold In many parts of the
region and the proceeds are used to buy goods produced elsewhere
Commerce Is thought to contribute about 10 percent of all paid
59M Andrew Kamark The Economics of African Development (New York Praeger 1971) p 68
60 1bld p 98
61 Abull I Richard Economic Development and Tribal Change (Nairobi East African publishing House 1969) p 83
31
employment This commerce was mainly introduced since 1900 but
It has been superimposed on the traditional pattern of small-scale
trade which has not been entirely superceded
The Importance of trade In East African life has greatly
increased thrQugh the development of new forms of exchange which
Involve selling of goods for cash and buying goods produced far
away Ori31nally such trade consisted almost entirely of sales
for export overseas and the purchase of imported goods but today
an increased volume of sales Is to other parts of East Africa and
many of the commodities purchased have been produced within the
reglon 62
ThIs type of trade has provided the main basis for urban
development Both the large cities and the small towns of the
regions owe much of their present Importance to their trading
function even though many originated as administrative stations
within most rural areas the settlement pattern Is highly dispersed
and the clusters of bui ldlngs which are sometimes termed villages
usually consst mainly of IIdukas 163 Host of these small trading
centers grew up to handle the Import and export trade although
many now serve as markets for local trade
In review of a survey conducted by Keegan East Africa dukas
are very small carry one hundred items and occupy no more than
62Dbull A Hawks Official Journals East African Trade (Nairobi East Afric~ Publishing House 1963) p 10
63Warren J Keegan Multinational Marketing (New Jersey Prentice Hall Incorporated 1974) pp 308-9
32
fifty to seventy-five square feet 64 This indicates that the dukas
were operating on an average gross margin of approximately 12 percent
which is considered to be lower cost form of distributlon 65 The
East African duka Is highly Inefficient as a form of distribution
because the sales per person in the duka are much lower to keep
the duka developing significantly with the community economy
THE DISTRIBUTION OF TRADING ACTIVITY
Nairobi
The most important center of trade In East Africa Is Nairobi
A photograph of Nairobi Is provided on page 33 to give an example
of the modern cities of Africa Administration manufcaturlng and
commerce are three main functions of the city and are all comparable
In importace each employing more than fifty thousand people 66
The 1960 survey of distribution recorded one thousand wholesalers
In and out of a total for Kenya of three thousand It recorded two
thousand retail establishments compared with similar numbers In the
next nine towns of the country together 67 The value of all sales
by these ~airobi traders in 1960 was shs 400 billlon 68
T~e great Importance of Nairobi as a trading center Is
related to the fact that it performs trading functions at several
levels In some fields It serves the whole of East Africa and
64 Ib id p 308 65 Ibid p 309
66Mcrgan op cit p 70 67 Ibld p 72
6RKenya Chamber of Commerce Trade (Nairobi Kenya Governshyment Press 1973) p 5
34
in more ways it serves Kenya and Uganda and a small part of
Tanzania
In retail trade Nairobi serves a large area part of which
is relatively prosperous Its pre-eminence has probably hindered
the growth uf neighboring towns such as Limuru and Ruiru as shopping
centers Even Thlka thirty miles north of Nairobi Is more Important
in manufacturing than In trade 69 Much of the retail trade of
Nairobi however Is dependent on the large population and purchasing
power of the city itself Many people obtain their living by supplying
the needs of the administrations Industrial workers and even the
establishment of groups of up to thirty shops at various points
throughout-the higher class suburbs 70
The iMportance of Nairobi Is trade and Is related to Its
functions as the capital of Kenya and In some respects as administrashy
tive center for East Africa There Is a close relationship In which
its Importance In such fields as banking and Insurance are also
involved T~o other factors which favor Nairobi more than possible
rivals SLch as Mombasa are Its centrality in both Kenya and East
Africa and Its location on the eastern edge of the most prosperous
part of the region No town Is better placed to serve the whole
of Kenya or to serve all countries especially since means of comshy
munication have been on Nairobi The country south and west is
sparcely populated but In that to the north and east much purchasing
power Is concentrated There are substantial ve~y affluent European
69 Ibld p 6
70Ibld p 9
35
and African settlements which are of increasing significance as
71cash Income rl5es
Mombasa
Mombasa is not only the leading port In East Africa but
also a major center of trade The first function has led to the
second and the two together have enabled it to become the second
city of Kelya with a population of 380000 (1969 Census)72
Although many importing and exporting firms have headquarters in
Nairobi and their goods are consigned directly to or from the
port many others have offices in Mombasa and compete successfully
for the trade of a large part of East Africa Most traders in
Moshi for example and many in Kisumu or Kampala obtain supplies
through Mombasa importers The export marketing trade provides
much employment outside the port area far apart from private firms
concerned mainly with exports The Uganda Coffee and Lint Marketing
Board has large warehouses In Mombasa 73
Mombasa functions In retail and local wholesalers markets
but this activity Is small in relation to its size Its sphere
of Influence is inevitably reduced by its coastal location while
much of its immediate inner land is arid and sparcely populated
The ships calling at the port provide extra trade for they generally
71A M Wilson Social Change In Modern African Trade (New York Oxford University Press 1961) p 193
720xford Economic Atlas (New York Oxford University Press 1974) p lQ7
73Encyclopedia Americana East Africa Vol 4 (1974) p 579
36
take on some supplies and their crews and passengers often spend
some time clshore However this is of small Importance In comshy
parison with the export trade
Dar-es-Salaam
In some ways Dar-es-Salaam combines the functions of Nairobi
and Mombasa since it Is both the capital and the leading port of
74Tanzania Each of these roles encourages trade and the city
is much the most Important center of trade In the country On
the other hand It does not dominate the whole country as much
as Nairobi and Mombasa together dominate Kenya for both North
and South have only limited marketing connections with It Arusha
and Moshi have closer tradIng links with Kenya cities and with
the port of Tanga Bukoba has closer ties with Uganda and Kenya
and Mowara Region Is often linked physically with the capital only
by sea and It is therefore commercially Independent to some extent
Dar-es-Salaam also plays a smaller role than Nairobi and Mombasa
combined It Is comparable In size with the latter and Its inhabishy
tants are very much dependent on Its trading functions It is the
main center of import export and wholesale trade for the area
of 280000 square miles and a population of 19 million people 75
It Is also the center of small-scale wholesale and retail trade
for the coastal region while the purchasing power of the city populashy
tion is sufficient to support a wide range of specialized shops
74B F Joh~son The Sta Ie Food Economics of Tro leal Africa Tanzania (Stanford Stan or UnIversity Press 9 p 131
7Ibid p 26
37
Kampala
Kampala is smaller than the three cities mentioned above
but it is very clearly the commercial capital of Uganda Several
of the major importtng and exporting firms of East Africa have
branches there and merchants import goods directly from the port
of Mombasa Many of the businessmen are middlemen who buy from
Nairobi or Mombasa wholesalers and who often sell to other wholeshy
salers in sm~ller townsJ6 Kampala controls most of the trade of
Buganda and Western Uganda but less of that of the east and north
Thus whereas little is obtained their cement is consigned directly
from Toro to the northern towns Little is dispatched to towns in
77the west for these obtain their supplies through Kampala dealers
Although location and the communication pattern limit Kampalas role
as a distribution center for Uganda Kampala middlemen merchants
have extended their sales area in the west beyond the border of
Uganda to Bukoba and to Rwanda
Others
It is not practical to examine the trade of every town in
East Africa but some further features of the distribution of trade
might be noted
Most of the towns classified as others are majority adminisshy
trative centers and their marketing functions have developed from
this Although they differ considerably they are very similar in
76W T W Morgan East Africa Economic Characteristics (Nairobi ~ast Africa Publishing House 1960) p 279
77ibid p 280
38
appearance In addition to administrative functions these towns
provide services such as hospitals and they have generally become
centers of local communication The features tend to enhance their
roles In trade The size and importance of these trading centers
is generally related to the size population and propensity of the
areas they serve Most of these towns are newly created Their
populations range from between three thousand to six thousand and
they have rather less than one hundred shops most along a single
main street 78 All are retailers but many also sell goods to traders
from the countryside and buy some local agricultural products
Mo~t of the towns created are very young and they came into
existence due ~o the scarcity of land These towns are scattered
throughout East Africa and vary In both size and frequency with
the density of population and the local level of income
COMMUNICATION ACTIVITY
Transportation has become an Important economic activity
Official estimates place Its contribution to the Gross Domestic
Product of East Africa at ~45 million which accounts for 61 percent
of the total 79
Road Transportation
Road and rail transportation are probably roughly comshy
parable as sources of Income In East Africa although they differ
78~NESCO Opt cit p 96
790xford Economic Atlas (Oxford Oxford University Press 1966) pp 174216221
39
greatly in structure Road transportation is operated mainly on a
very small scale but there are so many small operators that the
number of people earning a living in road transportation Is very
large SO Motor vehicles came Into general use in the 1920s but
the greatest expansion of road transportation came thirty years
later Today there are many more vehicles per head of population
than in Nigeria or even Egypt approximately six persons per cad IISl
In Table 3 on page 40 road transportation shows that the majority
are private cars but the figure for vans lorries and busses undershy
states the volume of commercial road transportation Cars on many
East Africa roads are used legally or otherwise as taxis proshy
viding many people with good incomes This Is especially well shy
developed in Uganda and helps to explain the small number of busses
there Within each country road transportation activity Is heavily
concentrated In the most prosperous areas especially around the
capital Traffic counts show a far greater intensity on roads around
Nairobi M0mbasa Kampala Jlnja Dar-es-Salaam and Tanga than
elsewhere
The overall Importance and the pattern of road transportation
are both affected by the nature of the road network Road building
has been assisted by the character of the earth in many areas
simple earth murram road serving very well for light traffic
Although few roads are tarred the road network is ~uch better
than In countries such as Sudan and in much of East Africa is
SOlbid pp 147 174 193
81Ibid pp 147 174 183 193
40
Tab Ie 3
Transportation in East Africa (1963-73)82
Kenya Tanzania Uganda Totals
Thousand miles of roads of which bitumen surfaced
(thousands units 000)
Private Vehicles Commercial
Lorries Vans Busses
1963 Flgur~s Private Commercial
Ra 11-Track (In kilometers)
Rail-Vehicles (units 000)
Air-Craft (units 000)
Sea Transportation
nd -- No data available
522
22
1002 295 104 82 26
440 90
962 km
163
05
nd
409
22
726 304 11 I 74 22
220 80
3782 km
42
nd bull nd
39 I
07
619 208 64 70 17
180 60
1 160 km
72
04
nd
1322
5 I
2345 80 1
840 230
59 km
17
82 Ibid pp 174216221
41
adequate for the demand made upon it 83 Some areas without roads
notably in central and western Tanzania are found In other areas
many roads 3re Impassable In the wet season but themiddotdlstrlbutlon
of road transportation activity Is related mainly to factors other
than the roads themselves
Rail Transportation
In spite of competition from the roads railways of East
Africa still undertake most long-distance movement of bulk loads
All are operated by East African Railways Corporation on behalf
of the three governments The rail works employ more than eighty
thousand people
The entire railway system covers 5895 kilometers all
being meter gauge and virtually all single track 84 The East
African Railway Corporation Road Services Is operated mainly In
Uganda and Tanzania although a nucleus of road services between
Mombasa and Nairobi was established to provide express services
for certain commodities
The railway has been Increasing at a moderate rate over
the past few years Between 1965-1971 passenger number rose by
an average of 66 percent per year While the corresponding growth
85rate of freight was approximately 10 percent
83 lbld pp 147 174 193
84 IbId p 39
85Ibld pp 147 174 193
42
Sea Transportation
Sea transportation as an economic activity concerns East
Africa mainly through employment at the ports Sea transportation
administration is operated by the East African Harbors Corporation
on behalf of the East Africa community86 There are several sea
ports which serve Kenya Uganda Tanzania Rwanda and Eastern
Region of Zaire
Periodically these harbors suffer from severe congestion
with serio~s repercussions upon the economy of the entire East
African region The organizational changes within the East African
Cargo Handling Services responsible for handling of cargo as opposed
to the administration of the port makes handling operations slower
and more inefficient
Air Transportation
Air transportation is less than the other forms of transshy
portatlon for it can be used only by the most affluent passengers
and for the most valuable goods In each case the re-fuellng of
planes in transit provides a useful source of income Regular
internal services call at thirty-four places In East Africa of
which twenty-one are In Tanzania 87 The large size and peripheral
populatiofl pattern of that country make air transportation more
appropriate than in Kenya or Uganda Air transportation is unl ikely
to become a major economic activity In East Africa until Its cost
Is greatly reduced
86 Ibld bullbull pp 147 193 87 lbld bull
43
Communication Media
Communication media includes television radio receivers
telephones and dally newspapers These sources are growing at a
88rate of 10 percent per year The growth In urban areas Is higher
than In rurai areas No current data are avaIlable
Tab Ie 4
Communication Medla89 (Thousands) 1963
Kenya Uganda TanzanIa
Television 22 1 100 00
Rad 10 Reef Ivers 70 I 400 300
Telephones 6 1 6 1 32
Da II y Newspapers 190 123 83
SUMMARY
This review of literature was divided Into eight areas which
are pertinent to this study It was designed to provide background
Information related to
A East African Political Environment
1 Regional Survey
2 Nyika Plateau
3 Lake Victoria Basin
88Morgan East Africa Economic Characteristics p 36
890xford Economic Atlas Ope cit Table 1
44
B The Economy
1 Subsistence Economy
2 The Public Sector
3 Excessive Expectations for Public Service
C Population Distribution
1 Regional Population
2 Urban Population
D People
1 Tribal Classification
2 Historical Clusters
E African Heritage
1 The Extended Family
F Understanding the Economic Activities of East Africa
G The Distribution of Trading Activity
1 Na I rob I
2 Mombasa
3 Dar-es-Salaam
4 Kampala
H Communication Activity
1 Road Transportation
2 Rail Transportation
3 Sea Transportation
4 Air Transportation
5 Communication Media
Chapter 3
DESIGN OF THE STUDY
EAST AFRICAN ELITE
This survey was conducted and certain Information provided
to the argument of the study However difficulties of conducting
research 11 the formerly British-controlled territories of East Africa
are no different from those encountered elsewhere only more intense
because of lack of basic bench-mark data and basic socloeconomic
data Stratified probabil ity sampling in more advanced societies
can be designed in many ways Voters rolls rate-payers registers
and the like are usually up-to-date and easily available to the
researchers Such data do not exist in East Africa I Survey
research must be designed therefore on what data are available
There is little constructive value In the criticisms of the purist
that sampling techniques used in Africa do not fit acceptable
Western standards 2 It Is true that they do not but Leonard Doob
states that lithe scholarly or scientific gains to be derived from
ILeonard W Doob Periodic Surve s In Sub-Saharan Africa (Nairobi Nairobi Publishing House Hay 11 1970 p 3 bull
21~id p IS
45
46
valid results are so staggeringly inviting that the frustrations
of the moment Cre rendered almost Impotent- 1I3
Marco Surveys Ltd Nairobi Is the original data source
on its determination to publish Whomiddots Who in East Africa In 1974
Its part information Is the basis for this study
The survey by Marco Survey Ltd Nairobi had faced some
difficulties in deciding who was to be interviewed however It
took several months of careful planning Staff lists were prepared
by the four governments directories of commerce and industry and
membership 1ists of all available professional cultural and warshy
fare organizations and societies were examined Finally the
wage structures of the largest companies were checked and compared
to the wage paid by the four governments Every Interview was
planned and every respondent was presented There were direct
mall intervIews and each respondent signed the completed form
as correct after the interview
The criteria for selection to be interviewed were two The
first criterion was income The optimum cot-off point was an income
of ~I 000 per annum which is higher than the average European
or Asian income and Is also higher than the starting scales for
4university graduates The second criterion was the position held
by the respondent Women who have been Included are el ites In
their own right and not persons who are simply wives of elites
There are only sixty women in the total of 1423 Interviews about
3Eest Africa 1974 (Nairobi Marco Survey Ltd 1974)
4Doob Ope cit p 256
47
4 percent so sex was not used as a basts of tabulating the socloshy
economic data
This data Is presented on a comparative basis to Illustrate
by the basic =lassiflcation data the differences and similarities
of the African elite of the three countrles--Kenya Uganda and
Tanganyika Zanzibar has been Included and treated separately In
most of the tables
This study Is divided Into three parts The first Is an
analysis of the elite In East Africa based on the basic classificatory
data that w~s collected In the original research for Whos Who in
East Africu5 and additional studies which In addition to describing
the elite give Insight Into their opinions attitudes and beliefs
The second is a survey of urban elite opinions on basic social
and economl~ problems and technical assistance It Is based on a
stratified probability sample of those who most closely resemble
the elite in three African capital cities The third describes a
survey which Is beginning to provide research Into changing attitudes
and knowledge that will temporal orientation determlnlsm 11 The
sample will be described at the beginning of the second part for
each of these surveys and a few sample tables will be given to
Illustrate some of the results of this research
Approximately 6 percent of the Africans listed for Intershy
view refu~ed to be Interviewed There were numerous reasons given
for refusing but the chief factors were education and personal
reasons claiming that they were not Important enough to be included
5Marco Survey op cit p 19
Na I rob I
URBAN ELITE OPINION
Order (Englewood Cliffs chapter 4
A recent study poses the hypothesis that the role of the
Standard codes were used to clarify the data and cards
be said that the attitudes and opinions expressed In answer to
East Africa to test the attitudes and opinions of the city African
The interviews were conducted by permanent senior research
48
6Fred G Burke Africans Quest New Jersey Prentice Hall Incorporated
questions are those of the elite but they do represent the opinions
and education The respondent had to have had some secondary edushy
affairs and social problems The sample was stratified by age
the interviews were conducted or had many years of residence there
Inevitably some of those listed were not available for Interview
on certain questions Involving his personal life International
cation and had to be at least eighteen years of age It cannot
a stratified robability sample in each of the capital cities of
Five attempts were made In every case of this type before giving
city in Africa is that of generator communicator Innovator and
Intergrator 6 The research accepted this hypothesis and designed
were punched for 80-column ICT data-processing equipment in
up An estimated 10 percent of those listed were no t avai lable ll
assistants All of these have at least a Bachelor of Arts degree
for interview for one reason or another
or its equivalent and are either nationals of the country in which
49
and attitudes of a probability sample of urban African eighteen
and over who has had some secondary education and who lives in
one of the capital cities of East Africa Therefore the opinions
of this group will be closer to those of the elite than a sample
based on the population as a whole
The people interviewed were chosen in the following manner
Each city including peri-urban and dormitory areas was divided
into geographical units using a grid method on a base map Each
square of the grid was numbered except for those that were in
the business area--marshalling yards ocean and the like--and 10
percent of the squares were chosen by using a table of random numbers
The number of units of housing In each was then determined and
the quota was divided proportionately between each The interval
between units was determined and a starting point selected
The interviewers continued Interviewing to the set interval
until the quota was completed Three callbacks were made where
necessary for each respondent before declaring that interview
void The household was defined as that group which regularly
takes its meals together The head of the household was Intershy
viewed to determine how many In the household of either sex were
over eighteen and had had some secondary school education Those
were then listed and the person to be interviewed was selected
by a system of random numbers Only one person was Interviewed
In each household If the unit did not have at least one person
as defined by education the interviewer then proceeded to the
next household by the fixed interval Ten percent of the intershy
views were checked by field supervisors The Interviews were
50
conducted i~ English for the most part but some Swahili was used
in Dar-es-Salaam
The questionnaires were pretested in each of the capital
cities and the questions were modified where necessary The
translation of Swahili was made in the usual way of two separate
translators who worked from Engl ish to Swahil i and vlce versa
The interviews were conducted from September 15 to October
5 1974 The tables have been shortened for prInting convenience
by grouping items that have less than 5 percent response Into the
category 1I0thers 11 Percentages were rounded to the nearest whole
number or if the percentage was too small in a subsample whole
numbers were given in parentheses
OPINIONS AND ATTITUDES
The following is a description of a few of the questions
which were used in pretesting a series of eighteen questions in
three capital cities of East Afrlca to establish eight scales to
assess opinions and attitudes about temporal orientation governshy
ment confidence and optimism science and determinism conception
of people politics and tribalism or traditionalism It is Intended
that the scales when adequately tested revised and evaluated
can be used for per lodlc surveys at least fixed intervals over
1I7the next five years Such surveys will provide scales that can
be used to measure social change and that can be used to compare
7Gordon H Wilson liThe Transformation of East Africa Basic Scale for Periodic Research (New York Basic Books Printer 1971) p 456
51
data from the three capital cities and also to compare the basic
data between the elite of the urban areas and probability samples
from selected rural areas
The pretests were carried out in Nairobi Kampala and
Dar-es-Salaam Each was based on a probability sample of 150
people stratified by age eighteen and over and education The
respondent must have had some secondary education In fact the
sample for the pretests were chosen on the same basis as the survey
described In the third part A probabilIty sample of this type
Is unavoid~bly composed mostly of males young adults who are
relatively wealthy engaged In the more skilled occupations and
professIons representing the politically and socially Important
members of the community It closely resembles the elIte described
In the second part of this chapter The research selected only
a few questions to Illustrate the possible value of the results
It Is patently evident however that though these one-shotll
results are
bull merely interesting or suggestive they will become significant and really helpful when comparative data are obtained over a period of time so that trends knowledge and public ftplnlon can be detected and measured by established scales
8 b t d p 456
Chapter 4
ANALYSlS OF DATA
The age of the elite of East AfrIca shows some sIgnIfIcant
differences among the four countries Table 5 on page 53 is the
percentage distribution by age If we disregard the not stated
categories the average ages are as follows Kenya 31-45 years
Uganda 36-40 years Tanganyika 31-35 years Zanzibar 41-45 years
East Africa 36-40 years
Table 5 shows the average age of elIte to be higher In
Uganda and Zanzibar than In Kenya and Tanganyika Uganda has 17
percent of elite over fifty years and ZanzIbar 28 percent whIle
4 percent cf elIte are In this age group In Kenya and Tanganyika
Later the analysis will reveal that one-third of the Uganda elite
are Baganda thus the explanation of the older average age may
be that Baganda has had a strong traditional centralized governshy
ment for many years and therefore posItions of power of authority
have been open to the Baganda for a much longer period than for
other East Africans The same explanation can apply to the elite
of Zanz rbar
The process of Africanlzatlon can be seen In Table 6 on
page 54 There Is a smaller percentage of Africans in the civil
service In Kenya than In the other two countries but a higher pershy
centage of elected and appointed representatives due to the regional
52
53
Table 5
East African Elite Age Factor By Percent
Kenya Uganda Tanganyika Zanzibar Total
Up to 25 years 5 1 1 2 3
26-30 years 18 15 18 8 16
31-35 years 26 15 21 5 17
36-40 years 21 20 20 9 20
41-45 years 12 16 11 17 14
46-50 years 4 8 8 5 6
51-55 years 2 9 2 10 4
56-60 years 1 4 2 8 3
61-65 years 1 3 - 7 2
66 and over a 1 - 3
Not stated 10 8 17 26 14
Total 100 100 100 100 100
Base 457 409 444 113 1423
a -shy Less than 5 percent
54
Table 6
East African Elite Occupation Factor Sample by Percentage Distribution
Kenya Uganda Tanganyika Zanz Ibar Total
Civi 1 servant 27 42 51 46 40
Electedappointed 41 34 23 10 31
Commerceindustry 12 10 9 19 11
Trade union politician 13 5 4 6 8
Education 6 6 7 a 7
Professional 3 I I 7 2
Cooporatlvestrade I I 3
Religiouswarfare 2 4 6 - 4
Agriculture I 2 1 3
Miscellaneous 2 3 3 2 3
Total 108 108 108 108 108
Base 457 409 444 113 1423
a -- In a few cases the same person qualified in more than one classification
55
form of government Kenya also has a higher percentage of elite
who qualify as trade unionists
There are several ways of describing occupations Civil
servants for example can be in medical education or other
services Table 7 on page 56 gives occupations of the elite
in East Africa by a different set of criteria
The Education Factor
Tabl~ 8 on page 57 shows that in the categories University
and above East Africa rates 25 percent--with Kenya 25 percent
Uganda 24 percent Tanganyika i9 percent and Zanzibar 32 percent
The high number in the last country is accounted for in Table 7
IIEast African Elite Where Educated A higher percentage were
educated in the United Kingdom and IndiaPakistan (52 percent)
because of lack of local secondary schools Another factor is that
a well established social class structure was part of pre-independence
culture The upper class in Zanzibar and to some extent those
among the Baganda could afford overseas education whereas those
from other countries were dependent on financial help from governshy
ment sources
There was a higher percentage of elected or appointed represhy
sentatives In Kenya and this category was not so highly educated
as the Icivtl servant of a ll others categories It can be seen
that there are more electedappointed representatives than civil
servants or others in the lowest categories of education In the
highest educational brackets we have more civil servants in the
elite of all three countries than in the other two classifications
55
form of government Kenya also has a higher percentage of elite
who qualify as trade unionists
There are several ways of describing occupations Civil
servants for example can be in medical education or other
services Table 7 on page 56 gives occupations of the elite
In East Africa by a different set of criteria
The Education Factor
Tabl~ 8 on page 57 shows that In the categories University
and above East Africa rates 25 percent--wlth Kenya 25 percent
Uganda 24 percent Tanganyika 19 percent and Zanzibar 32 percent
The high number in the last country is accounted for in Table 7
IIEast African Elite Where Educated 1I A higher percentage were
educated in the United Kingdom and IndiaPakistan (52 percent)
because of lack of local secondary schools Another factor is that
a well established social class structure was part of pre-Independence
culture The upper class In Zanzibar and to some extent those
among the Baganda could afford overseas education whereas those
from other countries were dependent on financial help from governshy
ment sources
There was a higher percentage of elected or appointed represhy
sentatives n Kenya and this category was not so highly educated
as the llcivll servant of lIa ll others ll categories It can be seen
that there are more electedappointed representatives than civil
servants or others in the lowest categories of education In the
highest educational brackets we have more civil servants in the
elite of all three countries than in the other two classifications
56
Table 7
East African Elite Specific Occupation Factor By Percent
Kenya Uganda Tanganyika Zanzibar Total
Education (administration) 5 4 6 7 5
Education (teacher) I 3 1 2 2
Medical practicing 4 5 3 5 4
Sciences 1 I I 2
Lawjudicial 1 6 2 8 2
Accountancy 2 1 2
Farmer 1 2 I 3
Entrepreneur 2 2 I 9 2
Senior executive 34 36 61 44 45
Junior administrator 7 14 14 3 1I
Legislator (only) 38 20 7 8 21
Partyunion officials 13 5 4 6 8
Editorsartauthors 1 1 I 5
Clergy senior 1 3 4 - 2
Others (unclassified) 2 5 3 2 3
-Base (all Africans
Interviewed) 457 409 444 113 1423
57
Table 8
East African Elite Education Factor By Percent (1972)
Educational Level Reached Kenya Uganda Tanganyika Zanzibar Total
No formal education
Attended junior secondary 22 13 8 21 15
Attended sen lor secondary 21 18 23 13 20
Obtained certificate of secondary 12 8 3 10 8
Obtained higher certificate high school a a a - a
Nonunlverslty technical studies 5 7 19 6 10
Nonunlverslty teaching studies 4 6 7 - 5
University studies non-graduate - 22 20 17 17
University studies 1st degree 17 15 16 26 17
Post-graduate university ma s te r I s deg ree 5 7 2 4 7
Post-graduate university studies higher degree 2 2 1 2 1
Not stated I - I I a
-Base (all Africans
Interviewed) 457 409 444 113 1423
a -- Less than 5 percent
58
Civil servants In Uganda are more highly qualified than In the
other three countries 59 percent have university education In
Kenya 56 percent In Tanganyika 42 percent and in Zanzibar 56
percent have university education Elected and appointed represhy
sentatives generally have less education In Kenya 22 percent
Uganda 37 percent and in Tanganyika 26 percent (Zanzibar could
not be tabulated) have university education Uganda Is still the
highest among the three countries
Country Where Ed~catlon Was Obtained
Table 9 on page 59 gives details about the country In
which the respondent was educated In his final year of education
It can be seen that the highest percentage of the elite were edushy
cated in local East African schools (58 percent) The United Kingdom
came next (28 percent) followed by the United States (7 percent)
IndiaPakistan and other African countries There are very sigshy
nificant differences between the East African countries however
which are worth noting Zanzibar and Uganda have many more elite
who were edycated overseas and in the United Kingdom particularly
than the other countries Kenya had fewer by 10 percent than
the next lowest which was Tanganyika
It would be a waste of effort to detail all of the East
African schools attended by the East African elite There were
nearly one ~undred What is significant however is to show that
out of this total only a few schools account for handful accounts
for more than 5 percent of the elite In each country and moreover
this handful accounts for a very significant percentage of the elite
59
Table 9
East African Elite Where Educated
Country Educated Kenya Uganda Tanzania Zanzibar Total
East Africa only 67 54 57 42 58
Afrlca--outslde East Afrt ca 3 4 4 1 4
The U S 8 5 8 2 7
The U K 18 38 27 38 28
IndiaPakistan 4 3 3 14 4
Austral la New Zealand a - - - a
Canada - a - - a
Western Continent Europe Ie Germany Norway 1 1 3 2 2
USSRChina or Eastern European Countries - - a - a
Elsewhere outside Afr lea
Not stated 1 - a 2
Total 103 106 100 100 100
Base (All AfrIcan Interviews) 457 409 444 113 1423
a -shy Less than 5 percent
60
The Factor of Rellslon
This survey did not Include Zanzibar and therefore the
paper Is unable to provide comparative figures for Zanzibar of East
Africa as a whole One would logically expect to find relatively
61
the same number of elite as the general percentage for the popushy
lation as a whole In each religious grouping
Table 10 on page 62 is complicated by the category among
the elite of Inormal Chrlstlan1I which did not appear In the first
survey This category has been added because many of the sophisshy
ticated Africans were educated In Christian schools so they do not
regard themselves as pagan and yet they do not belong to any formal
church The category IInormal Christian or simply Christian is
used to describe them We can generalize that fewer Moslems are
among the elite than one would reasonably expect from the above
figures particularly In Tanganyika Fewer Roman Catholics in
Kenya and Uganda are among the elite than one would reasonably
expect from the above figures about the proportions to be expected
Moslem education In East Africa Is less than education
among the other religions Protestant missions have been strongest
in education since earliest times In East Africa and this Is
reflected in Table 10 Even In government schools in the old colonial
tradition the Church of England as the state church dominated
the educational field In the British System and in England today
1Ireligion is taught along with the three Rl s This will explain
the larger number of Protestants In the population as a whole and
among the elite of Uganda and Kenya Zanzibar of course Is a
Moslem country Most of the 7 percent 1I0 ther ll in Zanzibar were
Bahal The white fathers of Tanganyika dominated the field of edushy
cation in early German times and remained a powerful force throughshy
out the Trusteeship period
62
Table 10
East African Elite Religion Factor Compared to Population Percentage
Kenya Uganda Tanganyika Zanzibar Total
Elite Othersa Elite Othersa Elite Othersa Elite Elite
Roman Catholic 21 29 25 34 26 28 4 22
Protestant 54 45 65 50 22 26 43
Moslem 4 16 3 10 16 39 88 14
Pagan 8 6 7
Normal Christian 15 2 24 13
Other 7
Not stated 6 2 5 1I 7
Total 100 100 100 100 100 100 100 100
Base 457 2400 409 2600 440 2000 113 1423
a -- The percentages for others is based on the probability sample (7000) of survey conducted by Fred G Burke Some grass-roots attitudes affecting political and social Intergratlon In East Africa paper delivered to the African Studies Association San Franclsco October 26 1963
63
The Factor of Voluntary Associations
The degree to which Individuals In African societies join
groups of voluntary association is a measure of social change The
comparison between the four countries which is given in Table 11
on page 64 shows significant differences between them Tribal
associations are much stronger in Kenya than elsewhere 21 percent
as against 2 percent to 8 percent In Zanzibar Tanganyika and Uganda
This underlines the felt need of the Africans of Kenya for security
among their own people in the face of Insecurities of the old
colonial system and Its concomitant privileged European and Asian
classes Nowhere else in East Africa was the position of the
settler or trader so strong Moreover political parties were
banned In Kenya on a national basis until comparatively recently
although district associations were encouraged by the administration
Kenya elite rate highest In political party membership (35
percent) as against 17 percent to 22 percent and trade union membershy
ship (20 percent) as against 5 percent to 12 percent
Uganda elite join more groups of voluntary associations
than the elIte of other countries The average Uganda elite has
membership In two groups Kenya 1-7 Zanzibar 1~6 and Tanganyika
1-5 Moreover the kind of groups that the Uganda elite support
are more sophisticated The Uganda elite rate much higher In
religious (16 percent) versus 6 percent to 9 percent professional
(15 percent) versus 4 percent and cultural (16 percent) versus
6 percent to 11 percent The Uganda elite Is only second to the
Zanzibar elite (42 percent) as members of social clubs (36 percent)
but significantly higher than the Kenya elite (23 percent) and the
64
Table 11
East African Elite Voluntary Associations Factor By Percent
Kenya Uganda Tanzania Zanzibar Total
Member of a tribal association 21 8 3 2 10
Religious societyunion 6 16 6 9 9
Business society 5 8 6 11 6
Professional society 9 15 4 15 9
Academic society 12 20 7 17 13
Political party 34 21 22 9 25
Charitable organization 5 13 12 42 10
Social club 23 36 25 9 29
Sporting club 6 16 11 15 11
Other organizations 11 4 5 10 8
Cultural organizations 6 16 11 10 11
Trade union 20 5 12 5 12
Belong to none 18 17 33 17 22
Total a 176 195 157 165 175
Base (All African interviews) 457 409 444 113 1423
a -- Many individuals belong to more than one group
65
Tanganyika elite (25 percent) One In three of the Tanganyika
elite (33 percent) does not belong to many voluntary associations
compared to only 17 percent or 18 percent for the elite who do not
belong to at least one society In the other East African countries
Business is presented equally in each of the four countries
Table 11 Is one of the most significant of the survey The
Uganda elite of whom one in three was Baganda have had University
at Kampala for many years It was once the only center for higher
education In East Africa Therefore culture In the western sense
was for many years a factor of influence on elite of Uganda which
was not available in either Kenya or Tanganyika
The Tribal Factor
The percentage of the elite In each country by tribe
compared to the percentage of the population represented by that
tribe should give an Interesting Index of the degree to which
the tribe has progressed and Indirectly of the Influence of Its
members
The first significant fact which emerges Is that 9 percent
called themselves Tanganyikansll and would not use the label tribe 11
We can only assume that the actual percentage by tribe of this group
Is about the same as described In Table 12 on page 66 with the
obvious Inclusion of some who are of mixed percentage The most
significant fact Is that there were 30 percent who belonged to Kenya
tribes 2 percent Ugandans and 5 percent Zanzlbarees No other
East African country had as high percentages In these categories
That amounts to 37 percent who were of tribes other than those of
66
Table 12
Tanganyika ElIte by TrIbal Group
Tri be Percent of PopulatIon Percent of ElIte
Sukuma 19 3
Nuyamwerl 7 2
Hakonde 6
Haya 6 7
Chagga 6 12
Gaga 6
Ha 5
Hehe 4 1
Nyakusa 4 3
Wguru 4
Sambaa 3
Zaramo 3
Yao 3
Hwevu 2
Others (Less than 2) 13 22
Stated Tanganylkan 9
Kenyan Tr t bes 30
Uganda TrIbes 2
Zanzlbaree 5
Toeal 100 100
Base 10204000 (1973) 444
67
Tanganylkans The major tribe the Sukuma represents one in five
of the Tanganyika population yet has only one In thirty-three
among the elite There are twice as many Chagga among the elite
as their tribal percentage would warrant Surprisingly the Haya
have more than their share although all the rest have fewer except
the ve ry sma 11 Ilothe r ll t r i bes who have nea r 1y tw Ice as many
In Uganda we would expect to find the Baganda over represhy
sented in the elite (see Table 13 on page 68) They have like
the Chagga twice as many (33 percent) as the tribe percentage would
warrant (162 percent) An even higher percentage 28 percent
claimed to be IIUgandans a classification not recorded in the official
census figure Only 1 percent are from Tanganyika and 1 percent
from Kenya Unlike Tanganyika the smaller tribes which each
represent less than 1 percent each of the population have only
half as many elite (6 percent) as their combined percentage (94)
would expect Tanganyika had twice as many The Watoro was the
only other tribe In which the percentage of the elite exceeded
that of the tribe 4 to 32
Kenya Is unique In that there are several tribal groups
that exceed their quota of elite and by almost the same ratio (see
Table 14 on page 69) The Luhya have a slight margin by ratio
over Luo and Kikuyu The Kamba Mero and Embu related tribal
groups are all seriously under their expected percentages Like
Tanganyika but unlike Uganda the small tribal groups--each of
less than 3 percent of the total population but represent 161
percent of It--have 22 percent of the elite A high percentage
of this group of the elite are from the numerous coastal tribes
68
Table 13
Uganda Elite by Tribal Group
Tribe Percent of Population
-Baganda 162
Banyonkole 8 I
Teso 8 I
Basoga 78
Baklga 7 I
Lango 56
Baglsu 5 I
Acho I I 44
Lugbara 37
Wator i 32
Banyaro 29
Karamujong 19
Alur 14
Banyole
Kuma 94
Others (Less than 1) -Not stated
Stated Ugandan -Kenyan tribe
Tanganyika tribe
Total 1000
Base 7367558 (1973)
Percent of Elite
33
3
3
4
2
3
3
4
3
6
28
100
409
69
Table 14
Kenya Elite by Tribal Group
Tri be Percent of Population Percent of Elite
-Kikuyu
Luo
Luhya
Kamba
Meru
Kis i i
Embu
Klpsigis
Nandi
Others (Less than 3)
Stated Tanganyika
195
144
125
117
69
49
39
3
22
16 1
23
19
19
6
2
3
2
22
2
Total 1000 100
Base 9204000 (1973) 457
70
Table 15
Question
What in your opinion is the most important problem facing our country at the present time
Na i rob i Dar-es-Salaam Kampala Total
Education
Poverty-famine
Unemployment
Economic development
High cost of living
Border disputes Inter-African disputes
Pol itical instabi 1ity
Tr i ba 1ism
Land apportionment
Publ ic laziness
Other problems
Don1t knownot stated Refused to answer
22
13
41
6
10
3
2
3
2
2
29
24
6
24
3
6
4
2
28
18
18
12
9
5
3
2
5
3
27
19
18
14
8
3
3
4
2
Total 109 105 105 105
Base 389 451 395 1235
71
Table 16
Question 2
All things considered how satisfied are you with your present standard of 1ivlng--very satisfied fairly satisfied
somewhat dissatisfied or very dissatisfied
Nairobi Dar-es-Sa1aam Kampala Total
Very satisfied
Fairly satisfied
Somewhat dissatisfied
Very dissatisfied
Don I t know
Refused to answer
6 13 4 8
32 50 25 36
32 26 37 31
29 11 32 24
Total 100 100 100 100
Base (a 11 intervi ews) 389 451 395 1235
72
Table 17
Question 3
Do you think political matters should be left to the government or should people like yourself take
some active part in political affairs
Nairobi Dar-es-Salaam Kampala Total
Left to government 26 24 13 21
People to take an active part 72 72 73 72
Other answers 4 2
Dont know 2 8 3
Refused to answer 2 2
Total 100 100 100 100
Base 389 451 395 1235
73
Table 18
Question 4
Which one of the following do you think our country needs most at the present time more schools more hospitals
more housing more factories or more roads
Nairobi Dar-es-Salaam Kampala Total
More schools 40 44 51 45
More factories 40 37 28 35
More hospitals 17 10 15 14
More housing 1 6 5 4
More roads 2 3 1 2
Don I t know
Total 100 100 100 100
Base 389 451 395 1235
74
Table 19
Question 5
Now which one do you think our country needs most an honest government without corruption a government that gets things done fair distribution of wealth
national unity or individual freedom
Nairobi Dar-es-Salaam Kampala Total
An honest government wIthout corruption 44 38 51 44
A government that gets things done 23 18 17 20
National unity 22 20 17 19
Individual freedom 6 14 6 9
Fair distribution of wealth 5 9 8 8
Don I t know
Refused to answer
Total 100 100 100 100
Base 389 451 395 1 235
75
Table 20
Question 6
Which do you prefer--government ownership or private ownership of major industries
Nairobi Dar-es-Salaam Kampala Total
Government ownership 51 43 38 44
Private ownership 38 38 31 36
Mixed (voluntary answer) 10 18 29 19
Don I t know
Refused to answer - - 1shy
Total 100 100 100 100
Base 389 451 395 1235
76
Table 21
Quest Ion 7
As you know there are many different ways In which African states can establish closer ties among themselves Which of the
following ways would you favor an organization for settling disputes between African governments
closer economic relations political federation African military
organization cultural exchanges
Nairobi Dar-es-Salaam Kampala Total
Favor 94 96 85 92
Oppose 3 3 9 5
Don I t know 2 1 4 2
Refused to answer 1 - 2
Total 100 100 100 100
Base 389 451 395 1235
-Closer economic relations 22 49 53 41
Political federation 26 39 27 31
An organization for settling disputes between African governments 34 32 15 28
An African military organization 15 18 11 15
Cultural exchanges 3 10 3 6
Don I t know
Total 100 149 110 121
Base 366 432 337 1135
77
(8 percent) only 2 percent are Tanganylkans and the Ugandans did
not rate statistically
ELITE OPINIONS AND ATTITUDES
Not only does Scale 1 Table 22 Illustrate a sound basic
knowledge of modern methods to prevent crops from being damaged
It also Illustrates a similarity of knowledge between the three
sample areas which are widely separated geographically Scale 1
will be Invaluable when comparing the results of our first rural
study the field work of which has been completed and Is at the
stage of processing
Table 22
Scale
It does not help much to try to prevent crops being damaged by Insects and diseases such losses can
never really be prevented
Kampala Dar-es-Salaam Nairobi East Africa
Agree 8 12 12 11
Disagree 88 85 87 86
Uncertain 4 3 3
Base 153 156 150 459
Scale 2 Table 23 on page 78 also Illustrates but not
so conclusively similarities between the three areas Nairobi
had 17 percent agree whereas Dar-es-Salaam had only 10 percent
with Kampala somewhere Inbetween One could say therefore that
78
there Is a higher degree of tribalism among the elite of Nairobi
than among the elite of Dar-es-Salaam
Table 23
Scale 2
A man should never marry a woman who does not belong to hIs tribe
Kampala Dar-es-Salaam Nairobi East Af rl ca
Agree 12 10 17 13
Disagree 81 83 80 82
Uncertain 7 7 3 5
Base 153 156 150 459
While Scale 3 Table 24 shows a similarity between the
three areas It shows that the respondents of Nairobi are much
Table 24
Scale 3
People have It within their power to bring harm and misfortune to others through magic
Kampala Dar-es-Salaam Nairobi East Africa
Agree 26 28 30 28
Disagree 45 46 61 51
Uncertain 29 26 9 21
Base 153 156 150 459
79
more sophisticated In regard to magic than in the other sample
points and that fewer are uncertain A significant number In each
area however believe that magic can be used to bring harm and
misfortune to others
Scale 4 Table 25 shows a consensus between the three
areas but shows an over all unfavorable knowledge about science
and knowledge The majority 83 percent believe that many imporshy
tant matters can never be positively understood by the human mind
The question can provide a very useful comparison In changing patterns
of knowledge regarding science In the future
Table 25
Scale 4
Science and knowledge are useful of course but many important matters can never be positively
understood by the human mind
Kampala Dar-es-Salaam Nairobi East Africa
Agree 80 79 86 83
Disagree 9 12 13
Uncertain 11 9 6
Base 153 156 150 459
Scale 5 Table 26 on page 80 shows an unfavorable public
opinion about the role of traditional chiefs and the dichotomy caused
by loss of status in recent years by traditional chiefs whose roles
have been largely taken over by the political appointee of the
ruling party The question will also provide useful comparative
80
data between ruralurban areas and will be useful In the future to
measure changes in attitudes and opinions about traditional chiefs
Table 26
Scale 5
A man ought always to obey his traditional chief
Kampala Dar-es-Salaam Nairobi East Africa
Agree 42 38 45 42
Disagree 42 46 49 46
Uncertain 15 16 6 12
Base 153 156 150 459
Scale 6~ Table 27 not only shows an area of new problems
for East African elite but also the wide divergence of response
Table 27
Scale 6
Government and politics are so complicated that the average man cannot really understand what Is going on
Kampala Dar-es-Salaam Nairobi East Africa
Agree 81 65 72 72
Disagree 16 24 22 21
Uncertain 3 11 6 7
Base 153 156 150 459
81
between the three sample points In Kampala 81 percent agree
with the statement and only 3 percent are uncertain whereas In
Dar-es-Salaam 67 percent agree while II percent are uncertain
The statement will provide a useful measure In future of the attl shy
tude of the elite toward government In each of the three sample
points
Scale 7 Table 28 Is a new problem of Investment and
saving which as you can see has brought out differences between
the three sample points and will provide In the future a useful
measure of changing attitudes toward savings and the postponement
of rewards
Table 28
Scale 7
If I had the choice I would prefer to be given a small sum Immediately rather than be promised a very
large sum one year from now
Kampala Dar-es-Salaam Nairobi East Africa
Agree 62 54 62 60
Disagree 24 37 30 30
Uncertain 14 9 B 10
Base 153 156 150 459
There are other examples above of similarities and dlsshy
similarities which are even better than Scale 8 Table 29 on page 82
It does show however a close correspondence between Kampala and
Nairobi while Dar-es-Salaam shows a more tolerant attitude In
82
their response to this statement Once again the comparison between
urban and rural areas should show an Interesting and significant
difference
Table 29
Scale 8
A womans place Is in the home
Kampala Dar-es-Salaam Nairobi East Africa
Agree 45 36 45 42
Disagree 46 61 51 52
Uncertain 9 3 4 5
Base 153 156 150 459
Scale 9 Table 30 shows significant statistical differences
between the response from Kampala and those of the other two sample
Table 30
Scale 9
The traditional ways of the past are the best
Kampala Oar-es-Salaam Nairobi East Africa
Agree 15 33 33 27
01 sag ree 68 58 56 61
Uncertain 17 9 11 12
Base 153 156 150 459
83
points This fact Is even more Interesting when we know that in
Uganda the present form of government has been designed to maintain
the traditional ways of the past whereas In the other two areas
the present government has been designed to change politically
at least traditional ways The reactions of the Kampala respondents
therefore are a significant Indication of their dissatisfaction
with efforts to maintain traditional ways
Scale 10 Table 31 also Illustrates that Kampala has a
different reaction than the other two sample points although there
are less significant differences between Dar-es-Salaam and Nairobi
Table 31
Scale 10
The present Is all too often full of unhappiness It Is only the future that counts
Kampala Dar-es-Salaam Nairobi East Africa
Agree 29 50 60 46
Disagree 44 27 32 34
Uncertain 21 23 8 20
Base 153 156 150 459
Scale 11 Table 32 on page 84 Is a really significant
Indication of the basic dissatisfaction of the Kampala respondents
with the status quo The dissimilarity was also reflected in
Scale 10
84
Table 32
Scale 11
The government Is doing all It can to develop our country
Kampala Dar-es-Salaam Nairobi East Africa
Agree 51 86 84 74
Disagree 21 5 10 12
Uncertain 28 9 6 14
Base 153 156 150 459
Chapter 5
SUMMARY AND CONCLUSIONS
The purposes of this study were to
1 Analyze the factors which have slowed the economic
development of East African communities
2 Identify the major problems encountered In economic
systems In East Africa
3 Determine the problems in developing the economic growth
of the community
4 Identify economic reconstruction needs
All the published materials listed below were extensively
reviewed The review Included library research over both periodicals
and some relevant studies The writing of this report Is thus based
on the Information provided by the following documents
1 Periodicals books pamphlets mlcroflshe from the
William Allen White Library of the Emporia Kansas State College
2 Xeroxed materials and books that were secured through
the Inter-library loans
3 Report collected by the Marco Survey Ltd Nairobi
4 Periodicals Issued by the Information section of the
Embassy of the Republic of Kenya Washington D C
In order to determine the social and economic problems of
East Africa a questionnaire-Interview method was used In total
85
86
1423 elites were I~ervlewed Approximately 6 percent of the
elites listed for interview refused to be interviewed
The Interviews were conducted by permanent senior research
assistants
The data collected were compiled (using standard codes to
clarify the data and computer cards were punched for BO-column
I C T data processing equipment In Nairobi) summarized and
interpreted
Finally conclusions were reached
SUMMARY
British East Africa was the name applied to the territories
in East Africa before It achieved Its Independence The territories
cover a total area of 682469 square miles which was divided into
three parts Kenya Uganda and Tanganyika They all became indeshy
pendent by 1963
The communities continued economic ties among each other
and on June 6 1967 at Kampala the three member nations signed
a treaty which was to re-establish the community
East Africa enjoys a great deal of economic advantages
l It borders the Indian Ocean which provides a cheap means of
exporting and ImportlDg goods 2 It Is a meeting point for trade
(east and central African trades)
East Africa Is divided Into five geographic regions (which
provide a variety of climates)
1 coast region
2 Nylka region or Savanah region
87
3 East and West Highlands
4 Lake Victoria region
Due to the Influehce of the cultural traditions the subshy
slstance element in East African economics is still dominant This
is evident in most of the rural areas The public sector of East
African community plays a very great part In developing the economy
The public sector Is expected to be major employers In the community
and Is expected to provide free public services--free school free
medical services free or subsidized public utilities and housing
On an average scale the population of East Africa is yet
low A clear study shows this Is not true In some locations which
are densely populated varying from two hundred to five hundred
people per s~ure mile The population In urban cities of East
Africa Is still low and the people do not consider cities to be
their home Details show that the major East African cities have
over 50 percent of all the urban population while the minor cities
are far less than 50 percent of the total urban population
Standardization of East African people Is too difficult
due to the fact that the population Is composed of a variety of
sub-races whose traditions differ from each other among the tribes
The sub-races classified are
1 Nilotes
2 Nilo-Hamltes
3 Inter-cush Ite
4 Bantus
Based upon the sub-races of East African people the traditional
heritage carried frnom one generation to the other makes the economy
88
of the community hard to work In Perhaps even more important on
the economic outlook is the Inheritance of continuing extended
family contrasts In age and sex
The study shows that trading Is an extremely important
economic activity even though it Is not Itself productive The
trade Itudy has shown that trade has been playing a smaller part
in East Africa and for those operating Its economic efficiency is
very low The greatest part of trading activities is located in
the major East African cities This conclusion has led to the fact
that the majority of the people are living In rural areas where
means of traveling to cities are difficult for them and the lack
of money has probably created the situation where people have to
live subsistently
CONCLUSIONS
The conclusions of the survey of literature and the analysis
of findings follow
Survey of Literature
If It Is correct as suggested by Kamark that the economic
lives of rural Africans are not Influenced by environmental conshy
dltlons more than by cultural disposition then this would mean
that the Introduction for new technology should bring about economic
changes relatively unhIndered by cultural conservatlsm1 That
Is to say the potentIalIties of natural resources can be more
IKamark M Andrews The Economics of African Development (New York Praeger Incorporated 1967) p 79
89
effectively tapped by the Introduction of new methods and undershy
standing and new forms of organization of production It may be
objected that this In fact has not occurred In East Africa and
precisely some would say because of limitations of cultural
conservatlsm 11 But closer studies quite strongly suggest that
where people can see the advantages to themselves of economic changes
2that are both feasible and safe then the changes do occur Thus
African people have accepted changes first and most radically (indeed
they have often deliberately sought them) In the more favorable
areas where the possibilities of new technology and new Ideas are
more readily applicable and where people are exposed to external
influences and have access to modern communicatIons and living styles
The type of national economic progress which is to emerge
the longer-term political goals the roots of nationhood In the
multiplicity of subcultures and naturally uneconomical tribal ties
out of which national culture is forged remain the crucial unanswered
questIons whIch affect the economic progress of East Africa
Analysis of Findings
The results of the analysis has shown that the elite of
East Africa have advanced to a more desIrable socloeconomlc way
of thinkIng ThIs conclusion has led the author to suggest that
perhaps the integrating forms of tribes can be worked out beginning
with the East African elite for however much too depends ultimately
on local and tribal support they have more chance to see above
2 Ibid p 98
90
the disadvantages of these functions The middle class is still
small flexible mobile and unstable not yet clearly or acceptably
dlfferentl~ted from strata above or below The mass of unskilled
workers are the most temporary and the least Involved If no efforts
or attempts are applied the society will inevitably continue to
live In their life of ethnically based networks and subcultural
pockets
16
AHdflJ )O 118 18
BIBLIOGRAPHY
Abraham R G East African Townshipl in A W Southhall (eds) Social Change In Modern Africa New York Oxford University Press 1970
Baver P T and B S Ymey The Economics of Under-developed Countries C U P Cambridge University Press 1957
Blacker E A Demography New York Oxford University Press 1948
Ethographic Survey of Africa East Central Africa London International African Institute 1970
Boesch H A Geography of World Economy Van Nostrand Princeton University Press 1964
Brown L H in E W Russell (ed) The Resources of East Africa Nairobi Literative Bureau 1968
Burke G Fred Africanls Quest for Order Englewood Cliffs New Jersey~ Prentice Hall 1964
The Economics of Underdeveloped Countries New York OxfOrd University Press 1972
Cley and P Robson IFederation of East Afrlca11 Structure and Administration of E A C S O New York Oxford University Press 1964
Doob W Leonard Periodic Surveys in Subsaharan Africa Nairobi Nairobi Publishing House 1970
East African Community Annual Report Nairobi Kenya Government Press 1966
Economic and Statistical Review Nairobi The East African Statlsshytlcal Department 1964 _
Encyclopedia Americana East Africa Vol 4 1974
Encyclopedia Brltanlca East African Community University of Chicago Macropedla Vol I II 1974
Goldthrope J E and F B Wilson Tribal Maps of East Africa and Zanzibar Kampala East African institute of Social Research 1966
92
93
Good M Cha~les Jr Dimensions of East African Cultures New York Oxford University Press 1970
Gulliver P H Labor Migration in a Rural Economy Kampala E A I S R 1955
Harlow V and E M Chi lver History of East Africa Vol II Oxford Clerendon 1962
Hawks D A IIEast Afrlca1I Trade and Industry Official Journal of Association of East African Industries Nairobi Nairobi Publishing House 1963
Hopkins Elizabeth IIConflict of Tribal and Racial Conflict in Stanley and Burke (eds) Transformation of East Africa New York Basic Books Printers 1966
Industrialization in East Africa 5th Edition Nairobi United Africa Press 1966
Jamal A H The Critical Phase of Emerged African States Afalrasl East African Publishing House 1965
Johnson B F The Staple Food Economics of Tropical Africa Stanford California Stanford University Press 1970
Johnson D H Rainfall in East Africa Q F R Vol 5 Nairobi East African Publishing House 1968
Jones Carey Geographical Journal Vol 131 Part 2 New York Oxford University Press 1965
Kamark M Andrew liThe East African Community The Economics of East African Development New York Praegam Incorporated 1971
Kenya Chamber of Commerce Trade Nairobi Kenya Government Press 1973 --~
Lewis William Allen The Theory of East African Literature Nairobi Bureau Annual Report 1965-6
Morgan W T W IIEast Africa Its People and Resources II People New York Oxford University Press 1969
Morgan W T W and N M Shaffer Distribution and Density New York Oxford University Press 1970
Myrdel Uninnar An International Economy Problem and Prospects New York Harper 1969
OConner A N An Economic Geography of East Africa New York Preager 1966
94
Oxford Economic Atlas East African Community New York Oxford University Press 1972
Reed Moyer and Hullanderc Stanley Markets In Developing Economies Illinois R D Irwin 1968
Republ ic of Kenya Newsletter Washington D C 1975 Vol 3 No5
Richard A I Economic Development and Tribal Change Nairobi East African Publishing House 1969
Rosberg A and A Segal East African Federation Internatlonal Conciliation 1963
Samson H W The Climate of East Africa Nairobi Memoirs Vol II I No2
Schneider in W R Bascom and M J Herskovits Continuity and Change in East African Cultures Chioago University of Chicago Press 1959
Seggerson E P Physiography of East Africa Nairobi Press 1962
Southhall A W Growth of Urban SocletyI Dar-esmiddotSalaam New York Oxford University Press 1969
The East African East African Common Services Report Nairobi Kenya Government Press 1966
Thompson B W The Climate of Africa Nairobi Oxford University Press 1965
UNESCO Populatlon Movements in East Afrlca in K M Barbour and R M Prethere (eds) Essay on African Population Routledge and Kegan New York Oxford University Press 1961
Walder D Problems of Economic Development of East Africa In E A G Robinson (ed) Economic Development of South Sahara London McMillan 1964
Warren J Keezan International Marketing Less Developed Countries Englewood Cliffs New Jersey Prentice Hall Incorporated 1974
Wilson A M Social Change In Modern Africa New York University of Oxford Press 1961
Wilson M Gordon liThe Transformation of East Africa Basic Scale for Periodic Research New York Basic Books Printer 1971
S6
XION3ddf
bull
96
URSAN CENTERS
- bullbullbullo1
IL RUdDIf---J -
( L KENYA I
I I I
hlo10bull I I J
- Tllo
Tflgflylfl
-Dodo TAN3ANYllltA
It
bull Imp ~1 bull
JII
~ ~t - bullKlIer
~ ~ JIOlJLAIO
~ ~~ ~ (0 C~CV ~oo Lindl ~ a CO (1(( 00(tOO
c ~tCC a oocmiddot ~~ L Ny ~tWllra1 c ~~(V( 0 ~J(JC~ ~ l(l~5 7~ ~~~~ i~j~) ~J r =X 0 1 ~O _-A- J 0 100 bull - -
mil bull~~ ~__-- _ llo
l6
bull
o
MII bullbullbullbullbullbull bullbullbullbullbullbulll1li bull bull ~ =
middot1
bullbullbull bullbull~ pound
-w
)
umiddot~middot middotmiddotMI
c
gt amp c o
ImiddotUmiddotmiddot middotmiddot0 L
1 bull l
)
L
~
middotmiddotmiddotmiddot1 L
~
~
1 ~
~ ~ I ~ L ~
i 1 middotmiddotmiddotrmiddotmiddotI bull bull ~
I r j L
-r Y
I~ bull CL -J II w 1
VINVZNVl
eII_
fbullbull bull~1
~ r
z
c
o
11Ie
) 11111_0 -shy
N a n s
~______
middot~middot(1 -bullbull
__rr~)
I
I
I I I
~ I ~
I I I ~ I
vaNv~n
66
o
1 IIit
c
Cl
S iII III J
Ibullbullbull middot1t-11 1 114bullc ~~1
bull
001
INZN1L
10 l
r
01 bull 1middot ) l pltllI1 -tpn I I c
o
z
o
bull
J I
lt
- Njoroge 1975
- Njoroge 1975 pt2
-

3
Importance 0f the Study
The economy of the East Africa community Is growing at a
high rate as projected yet the majority of the citizens of the
community remain on the poverty level In order to explain this
paradox we will look at the problems tending to withhold economic
success from many members of the community
Limitatlo~s of the Study
The study has the following limitations the data in
this study are limited to that available at the William Allen
White Library at Emporia Kansas State College and through their
facilities through interlibrary loans As Indicated in much of
the relevant data surveyed much of the available material is not
current 4
Assumptions
Certain assumptions underlie this study These assumptions
can be summarized as follows
1 The environment in which the desired economy operates
is such t~at the beneficiary does not readily appreciate the value
of change and thus lacks interest in It
2 The East African citizen is suspicious of accepting
the change to more progressive socioeconomic standards
4
DEFINITIONS OF TERMS USED
Arusha
The capital city of East African Community (1967 Declarashy
tlon)5
Dar-es-Salaam
Capital and largest city in Tanzania It is also one of
6the chief port cities of East Africa
Duka
Small shops normally operated by a single family7
E A C or Eo A
Abbreviation for East African Community Is an economic
organizaticn consisting of three member countries of Kenya Uganda
and Tanzania (associate members include Zambia Ethiopia Somal ia
and Burundi) The existing community is based on a treaty signed
in Kampala on June 6 1967 to preserve and re-establish a large
part of the corporative relationship that was disappearing 8
5A W Southhall Growth of Urban Society Dar-es-Salaam (New York Oxford University Press 1969) p 483
6 Ibid p 481
7J bull Keezan Warren International Marketing Channels Less Develo ed Countries (Englewood Cliffs New Jersey Prentice Hall Incorporated 197 p 309
8Andr~w M Kamark liThe East African Community The Ecoshynomics of African Development (New York Praegam Incorporated 1971) p 5C
5
Gazetted Township
Go~ernment official papers classifying towns population
by residenc~9
Great Rift Valley
Geologically this structure is called a Ilgra ben 1I This
valley exte~ds as a series of depressions from Syria through the
Dead Sea (the surface is nearly 1300 feet below sea-level) to
Africa In East Africa It divides into two branches western
and eastern Igneous activities and volcanoes are associated with
the rift valley forming such peaks as Kllimanjaro these are now 10
dead
Kampala
Th~ capital and the largest city in Uganda It was made
the capital In 1962 when Uganda previously a British protectorate
bull d d IIbecame an In epen ent nation
Municipalities Grade A amp B Townships
Gr~de A -- Municipal towns these towns have populations
above sixty thousand
Grade B -- Townships under local government authorities
12Normally these towns have populations below sixty thousand
9Rbull ~ Abraham IIEast African Townshipl In A W Southhall (ed ) Social Chane in Modern Africa (New York Oxford University Press 197D) p 33
lOE P Seggerson Physiography of East Africa (Nairobi Na I rob I Pless 1962) p 10
Ilsouthhall op cit p 477 12Abraham loc cit
bull 6
Nairobi
The capital and the largest city In Kenya with a population
13nearing one million people according to the 1971 population census
Non-African
A resident who is an Immigrant from other continents besides
Africa The majority of Non-Africans are Europeans and Asians
(Indians)14
Pound
East African sterling currency (Pound~) 1 ~ bull shs 20
Equivalent to $28 u S currency 1975 15
Settlers
European immigrants farmers to the East Afrlca 16
Shillings
East ~frican sterling currency (shs) shs 20 z l~ 17
13Southhall op cit p 469
14Abraham loc cit Non-Africans comprise people (male or female) of European or American origin Arabs Indians and Far East Asians
15K~nya Newsletter issued by Section of Embassy Republic of Kenya Jashington D C Vol 3 No5 (1975) p 28
16Ellzabeth Hopkins IRacial Minorities in British East Africa in Stanley and Burke (eds) Transformation of East Africa (New York Basic Books Printers 1966) p 87
17Kenya Newsletter loco cit
7
Swahili
A language of the coastal population of East Africa roughly
from Southern Somalia to Mozanlbique and including Zanzibar and
the Comoro Islands It Is spoken by about 15 million people as
a first langu~ge this includes the people In East Africa and
Congo (Klns~asa)18
METHODS OF PROCEDURE
All the published materials listed below were extensively
reviewed Thl~ included library review of both periodicals and
relevant st~dies The writing of this report is thus based on
the Information provided by the following
1 Periodicals books pamphlets and microfilm from the
William Allen White Library of the Emporia Kansas State College
2 Xeroxed materials and books that were secured through
the inter-library loan and from friends
3 uata collected specifically for use In this study by
the Marco Survey Ltd Nairobi Kenya
4 Periodicals Issued by the information section of the
Embassy of the Republic of Kenya Washington D C
PLAN OF STUDY
In the preceding section the purpose of this study Its
importance the limitations assumptions definitions of terms
18Encyclopedia Americana Swahili Vol 26 (1974) p 85
8
and methods of procedure have been outlined Related literature
largely stu~ies of structure with regard to economic development
in East Africa is presented in Chapter 2 Chapter 3 presents a
background of pertinent economic facts concerning East Africa
Chapter 4 deals with an analysis of factors In Chapter 5 the
data is summarized and conclusions are drawn
Chapter 2
THE REVIEW OF RELATED LITERATURE
British East Africa was the name applied to the territories
In East Africa before they achieved Independence The territories
Included the ~olonles and the protectorate of Kenya the United
NatIons trust territory of Tanganyika and Uganda These territories
had a total area of 682469 square mlles l British East Africa was
economicalya system of joint services The East Africa High
Commission which consisted of the Governors of Kenya Tanganyika
and Uganda was responsible for the administration of public services
and functions common to territories including currency roads
customs apd communications Each territory1s government retained
responsibility for local services such as health education and
police 2
After World War I I nationalist feeling was strong throughout
British East Africa As the deadline for Independence approached
Britain attempted to form a federation of East Africa but separate
nationalist aspirations made this Imposslble 3 Tanganyika was the
IEncyclopedla Americana East Africa Vol 4 (1974) p 578
2East Africa Geographical Journal Vol 129 Part 2 1963 pp 140-155
3Abull Ro~berg and A Segal East African Federation IIlntershynational Concll iatlon11 1963 p 30
9
10
4first of the four territories to achieve Independence In 1961
Uganda became independent In- 1962 The following year Kenya and
Zanzibar entered the ranks of Independent states Tanganyika and
Zanzibar merged In 1964 and adopted the name United Republic of
Tanzania 5
After Tanganyika became Independent the East African
High Commission was suceeded by the East African Common Services
Organizatior which performed the same functions as its predecessors 6
Finally the East African Common Services became the East AfrIcan
Community The East African Community was formed to establish a
customs union to facilitate the industrial development of the
area and to carryon research activities and common services preshy
vlously controlled by the East African Common Services organization
The community was re-establlshed by a treaty signed by three member
nations In Kampala Uganda on June 6 1967 7
The community provides for free intercommunity trade and
a system of c~nmon external tariffs there Is also a system of
transfer tnxes that may be Imposed on certain commodities Imported
from other members by a country with a trade deficit wIthIn the
other two members Transportation and communications services
are handled by community corporations for raIlways harbors post
4 Ibid p 8 5 IbId p 12 bull
6Encyclopedia Britanlca East African Community University o~ Chicago Macropedia Vol I I I (1974) p 754
7The East African East African Common Services Report (Nairobi Kenya Government Press 1966) p 3
I I
and telecommunications and alrways8 The East African Development
Bank established in 1967 provides and emphasizes projects that
tend to make the three economies complementary9 Although all
three countries contribute on an equal basis to the bank Kenya
the most advanced receives a smaller share of Investments and
guarantees In accordance with the policy of even development among
the states
East Africa is also the meeting point for all the continents
major linguistic groups Even Click Language l is represented in
Central Tanzania
EAST AFRICAN GEOGRAPHY
Regional Survey
East Africa borders the Indian Ocean for about eight hundred
miles and the coastlands form a very distinctive zone although
the plain Is only one hundred miles wide around the Kenya and
Tanzania border IO Winds from the ocean bring a high ralnfal I
to most of the land close to the coast This fertile land Is quite
densely populated The rainfall drops quite rapidly Inland and
land quickly becomes arid and sparcely populated As one travels
from the Iterior towards the coast the change from scared bush
to forest is evident
8 Ibid p 9
9East African Community Annual Report (Nairobi Kenya Government Press 1969) p 38
IOCharles H Gpod Jr Dimensions of East African Cultures (New York Oxford University Press 1970) p 8B
12
Some of the special characteristics of the coastland stem
from the fact that many people have approached them from the sea
and have ~ot penetrated far inland Although most of the population
is African there is a substantial Arab settlement in sharp contrast
to the rest of East Africa Mombasa Is an old town (see map of
East African cities on page 96) Dar-es-Salaam and Tanga are not
These three cities are distinctive In that through them passes
most of the foreign trade of East Afrlca ll This tends to quicken
the pace of economic activities there although In the whole zone
the high temperature (high humidity) resulting from the low altitude
tends to slow It down
The coastal zone Includes the islands of Zanzibar and
Pamba and Mafia together They constituted a separate state for
middotover one hundred years until they joined with Tanganyika to form
anew state of Tanzania in 1964 12
The Nyika Plateau
Away from the coast the land rises fairly gently to flat
plateaus covering between 3500 to 5000 feet above sea level
known In some areas as Nyika (Swahili for wilderness) This is
an area of short rainfall poor scrub vegetation and very sparce
13population separating richer lands In the Interior from the sea
llA M Wilson Social Change In Hodern Africa (New York Oxford University Press 1961) p 35
12Carey Jones Geographical Journal Vol 131 Part 2 (New York Oxford University Press 1965) p 186
lnE P Seggerson Physiography of East Africa (Nairobi East Africa Publishing House 1962) p 10
13
It is broken by mountain ranges notably Usambara and Pare mountains
Taita h1115 where relief brings about a higher rainfall and where
more people have settled Further south it is broken by a zone
of lowland in the basins of the Ruaha and Rufingi rivers where
settlement Is discouraged by periodic floods and disease rather
than by low r3infall Water scarce in East Africa is abundant
there and cen be controlled This area offers promise for future
agricultural development In the south of Tanzania the plateau
reappears but the rainfall exceeds thirty inches in most years
and much of the land is under cultlvatlon 14 The rainfall Is
unreliable soil is poor and the area is remote from central
economic life in Tanzania 15
Th~ highland south of the Nylka has recent volcanic rocks
It stands up as highlands reaching to 19500 feet including
KilimanJaro Mt Kenya and Elgon (see map on page 14) From the
land over seven thousand feet above sea level it extends three
hundred miles westward almost to the shore of Lake Victoria Although
It Is brokpfl by the lINorth Rift Valleyll (not shown in the map)
the floor of which in places lies six thousand feet below the land
to either side 16 In this highland heavy rainfall and fertile
volcanic soils provide excellent conditions for agriculture Much
14gt H Johnson Rainfall in East Africa Q F R Vol 5 88 (Nairobi East Africa Publishing House 1962) pp 1-9
IS ibid p 10
16Seggerson Ope cit p 10
ofx-----_ - -~~ -----------~
QOO 000 ~I)
-==----=-----shy
~ )00 -OOOt
Wi~Z1 ~ OOOt -0001
u
o
z
o
15
of the land Is under cultivation but the fruit of this agricultural
production is offset by the dense population 17
Lake Victoria Basin
The land falls slightly northward from the central plateau
of Tanzania towards the Lake Victoria Basin and the densIty of
the population is increased greatly The Basin is one of the
richest zores of East Africa supporting over a quarter of the
population of the regIon The country receives more rain and
has more fertile soil than that to the south and advantage has
been taken of its agricultural opportunities The land around
the lake in some ways forms a single unIt although it is divided
among the thr~estates This region Is densely settled by farmers
who produce much cotton as well as animal food crops also bananas
(Uganda) a~d coffee providing a green landscape all year around 18
THE ECONOMY
Subsistence Economy
In terms of the actIvity of an average East African man
or woman the subsistence element in East African economies is
probably still domlnent 19 That is to say the amount of time
the average East African spends on activities that merely keep
17w T W Morgan and N M Shaffer Distribution and Density (New York Oxford University Press 1966) p 36
18 Ibld p 38
19~ F Johnson The Sta Ie Food Economics of Tro ical Africa (Stanford Californ a Stan ord UnIversity Press 1970 p 142
16
him alive ana functioning is greater than the amount of time he
spends ear~ing discretionary income The average East African
is more in than out of the subsistence tribal economy20 He produces
most of the goods and services he consumes
The permeation of the money economy throughout Africa not
only has considerable importance in Its own right but will influence
the whole pace of economic development In the future It is almost
impossible for anyone who has not lived in a subsistence economy
to appreciate how profoundly it affects ones activities and outshy
look To live in a subsistence economy means to live a hand-toshy
mouth existence in a world of great risk and uncertainty Without
the techniques or facilities for storage of food over any appreciable
period the East African is dependent on the yearly crop or his
luck In hunting or fishing Nearly every people have a hungry
season ll when the 1ast season I s crop has been eaten and the new
crop has not yet come In The risk and uncertainty affecting a
whole community is less with the spread of the money economy
because It is possible for individuals both to create a margin of
security for themselves by setting aside a permanent store of value
In the form of money and to survive apart from the communlty21
The Public Sector
From a comparatively late point In the development of East
Africa the government role in the economy was a major one The
private investments and the stimulation of production was encouraged
20 Ibid p 151 21 Ibid p 147
17
by the gov~rnment The corollary of this Is the continuing imporshy
tance of the government as employer and of the publicly owned
sector generally in the national accounts
In East Afri ca Ilcurrent government expend i tures run over
15 percent of the gross national expenditure 1I22 If one adds the
operations of the railway electricity authorities ports etc
and the investments in the whole part public sector the total
approaches Hone-third of the gross domestic product-II Together
they are therefore the dominant economic influence in the money
economy of East Africa 23 Many East Africans expect the state
or public agency to be their employer This has the effect of
reinforcing o~e of the worst heritages of colonialism--the East
Africans arceptance of the idea that the best job to have is a
government post
Excessive Expectations for Public Service
The paternalistic attitude of colonial administration
particularly after World War II also left behind the habit of
expecting co~siderable benefit from free public services--free
schools iree medical services free or subsidized electricity
and subsidized housing 24
22Enclc loped ia Amer icana East Afr ica Vol 4 (1974) p 576
23 Ioid p 577
24Abull H Jamal The Critical Phase of Emerged African States (Afairasi East African Publishing House 1965) p 101
18
The colonial government provided most of this for East
Africa1s cities--usually at the expense of the lIagr icultural popushy
lation I But with the growth of the cities and the legitimate
pol itical de~and for the expansion and extension of these services
throughout the land it becomes financially impossible to maintain
them on the uneconomic basis of the past It is also economic
nonsense to consume resources In subsidies rather than use them
for economic development 25
Thr~ughout the world pressure for such services Is present
The way it is kept in line with what Is economically feasible Is
either to charge the economic price or to hand over responsibility
for the services to the local government concerned in which case
the citizens can make a choice between paying higher taxes or using
26the money for other purposes But with the usual East African
centralization of responsibility for these services in the national
government this economic calculus does not occur so Immediately
and directly Pressure for the services thus tends to lead the
East African governments constantly to Increase their expenditures
for them and to give lower priority to other investments that might
In fact re~ult In faster growth of the national income 27
25Ibid bullbull p 129
26 1bid p 159
~~ 71bid p 179
19
POPULATION DISTRIBUTION
Accorciing to the mid-year population estimates for 1968
the population of East Africa was 268 mllllon 28 Based on the
total land area of 642252 square miles mean populatIon density
of forty-two persons per square mile is obtained When compared
with the m~jor countries of Europe and Asia the mean population
of East Africa is very low According to the 1961 census India
had a total population of 438 million on an area of 126 mil lion
square miles with a mean population density of 319 persons per
square mile 29
Table
Mean Population Estimates Per Space Land (1968)
Estimated Total Land Area Population Mean Population
(Square Mi les) 1968 Per Square Mile
Kenya 219789 9104000 41
Tanzania 342171 10325000 30
Uganda 80292 7367000 92
Regional Population
The population of East Africa may be broadly divided into
three main categories first those around the shores of Lake
2EOxford Economic Atlas East African Community (New York Oxford University Press 1972) pp 174216 and 221
29lbid
20
Victoria ~econd those In the highlands country and In the footshy
hills of the major mountains third those in the coastal belt 30
Lake Victoria Is ringed on almost all sides by areas of
dense population In Tanganyika the lake and west regions which
surround the southern half of the lake comprised in 1967 a popushy
lation of some two and a quarter million over a quarter of the
total popuialon of Tanganyika although the land area formed only
one-eleventh of the countrys total On the north-western and
northern side of the lake the Masaka Mengo and BU50ga districts
of Uganda contained in 196B two and one-half million people
Finally on the north-eastern side Luo country in the Nyanza Province
of Kenya likewise showed In 1968 comparable densities of over two
hundred persons per square mile 31
In the group of the mountain areas we must include the
thickly populated districts of Central Province of Kenya where
the Kikuyu Embu Meru land units cluster In some districts popushy
lation densities range to two hundred to five hundred persons per
square mlleo North Nyanza and around the slopes of Mount Elgon
have densl~ies varying from three hundred to five hundred per square
mile whil~ on the western side of the mountains Uganda districts
have similar densities of between two hundred to three hundred
persons per square mile In Tanzania the category of thickly
populated mountainous regions includes the southern slopes of
30w T W Morgan and N M Shaffer op cit p 29
31Ibid p 27
21
Kilimanjaro ard Mount Meru and Livingstone Mountain in Southern
Highlands 32
The coastal belt consisting of a strip of low lying country
constitutes o~r third region of highly populated density This
area has beell subject to substantial immigration The population
was attracted not only to coastal cities but also by the large
sisal and sugar industrial plants oil refinery and shipping labor
which have drawn immigrant labor from all parts of East Africa 33
Urban Population
Precise international comparisons tend to be vitalized
by the fact that the destination of urban population varied from
country to country and from census to census It Is also true
that urbanization of the population of East Africa is extremely
low
In the Tanzania census of 1968 thirty-three Igazetted
townships were defined which comprises an aggregate population
of 664072 persons of all races or 51 percent of the total popushy
lation of the country34 Of this population over a third were
In Dar-es-Salaam (228742) and Tanga (138053)
In Uganda the census of 1968 contained as gazetted townshy
shlps those which comprised an aggregate population of 409075
32Seggerson Ope cit p 138
33lbid p 139
34Rbull G Abraham East African Townshlp In A W Southhall (ed ) Social Change in Modern Africa (New York Oxford University Press 1970) p 300
22
persons of all races or 2 percent of the population of the country35
Of these over one-third consisted of the populations of Kampala
and Jinja For the purpose of the Kenya population census urban
areas were divided into four categories municipalities grade
A townships grade B townships and trading centers 36 Not all
trading centers were defined as separate census areas and when
the results of the census were obtained it was found that several
of the grade B and even some of the grade A II had such small
populations that they could scarcely be regarded as towns in the
normally accepted meaning of the word The author therefore
defined urban areas as towns with a total of over two thousand
people There are approximately thirty-four towns of over two
hundred population
PEOPLE
It is difficult in the tradition of great social and cultural
diversity to distinguish East Africa by tribe but it Is very
difficult to give definitions of units that will accommodate the
wide range of factors Clearly tribe has reference to a distincshy
tlve group of people that possess the heritage of a common culture
lithe total of their forms of social organization historical trashy
ditions la~ and customs value and beliefs 1I37
35Ibid p 310 36 Ibid p 312
37w T W Morgan East Africa Its People and Resources People (New York Oxford University Press 1969) p 34
23
ThuD it is necessary to be somewhat arbitrary in disshy
tinguishing the various people of East Africa The term tribes
has the same sort of imprecise usefulness difficult to define
specifically as the term c lass in western industrial ized
countries 38 The late Dr Leaky (archeologist and sociologist)
classifies East African people into three distinctive parts
They are broadly classified on III inguistic and traditional basis ll
I into Nllotes Nilo-hlmites and Bantus 39 Such distinctions are
i 1 1 Table 2 1I The 0 1st r ibut ion of the Af r ican and the IINon-Af r ican ll
I in proportion by Cities4 1968 0
I 1 1
Country African INon-Afr Ican ll
Tanzania 4 1 721
Uganda 30 850
Kenya 53 850
very adequa~e to the actlvltes and interests which are of concern
to the people themselves in their ordinary lives For example
the Luo (nilotic) with their communal living society and with a
mixed economy of agriculture do not resemble the Masai (nlloshy
hlmltes) with their pastoral economy who are non-farmers they
~ 38 10 id p 36 39Ibid p 38
4UR G Abraham op cit p 318 IINon-African ll comprises people (male or female) of European or American origin Arabs Indians and Far East Asians
24
do not eat sea food The Bantus In East Africa (found mainly on
the southern hemispheres of Africa) have an exceptionally wide
range of cultures and economic systems 41
The Tribal Iassification
The term East African people identifies about 11110 different
people in the mainland Tanzania about 35 in Kenya and about 37
In Uganda42 Of these five comprise over a million people each
forty-threp exceed one hundred thousand people The smallest
tribes contdln only a few hundred people but their culture intershy
mediate zo~es are generally between one and another 43 Blackers
book of East African lIdemography provides an adequate overall
account of the traditional culture and social system of perhaps
thirty of these tribes 44
A number of larger and Important tribes remain still
undescribed by modern standard needs Published studies of social
and economic changes In recent decades are fewer even for those
people such as Kikuyu and Chagga where change has been most
radical Most books dealing with the traditional cuiture of East
African people were written many years ago and are not reliable
41Morgan Ope cit p 40 42 1bid p 36
43E A Blacker lIDemographyl1 (New York Oxford University Press 1948) p 43 The best general surveys of available Inforshymation are contained In the volume of the lIEthographic Survey of Africa (East Central Africa) 11 (London International African Institute 1970) p 70
441 bId p 79
25
guides for the study of people of East Africa in the second half
of the twentieth century
Historical Clusters
Although some tribes remain as little more than names on
the enthographlc map It Is possible to group the better known
people Into clusters which are identifiable In terms of common
historical traditions linguistic similarities and certain related
social Institutions and values As far as present knowledge goes
the following clusters are fairlyclear Only the larger tribes
are indlca~ed In the lists
Tribal names are given in their root forms
(a) Nilotes--Acholi Alur Lango Luo Padhola (b) Nilo-Hamites--(eastern Nilotes)
1 Teso Cluster--Karamojong Teso Turkana 2 Kalegln-Elgeyo Kipsiqis Nandi Tuqen 3 Masal Cluster--Arusha Masal Samburu 4 Tatoq Cluster--Barabalg
(c) Inter-custrlne Bantu--Ganda Ha Haya Klga Nkole Njoro Rundl Rwanda Soya Toro
(d) Elgon Bantu--Aisu Lugya (e) North Eastern Bantu--Chagga Embu Gusli (kissl)
Kamba Kikuyu Meru Mbere (f) Coast Bantu-Bondei Olgo Mljikenda Sambaa Zigua (g) Nyamwezi Cluster--Bena Hehe Sangu (h) Luguru Cluster--Kaguru Luguru Ngru4(I) Rouma Cluster--Makinde Makua Mawia 5
In no case are all the people of a cluster identical In
their econOOlic system In terms of their traditional economic
systems and the exploitation of the natural resources a more undershy
standable classification can be made In the following way
45 1bId p 15
26
A Primary Pastoral Economy with little or no agrlculture-shyBarabaig Boran Masal Redille Saburu Somalia Pastoral suk Turkana
B Mixed Pastoral and Agricultural Economy I Pastoral Ism predominant--Aogo Karamojong Klpsiqis
Kuna Nandi 2 Agriculturalism predomlnant--Arusha Bela Klssl
Ha Hehe Iraqw Iramba Kamba Lango Luqbata North Luhya Luo Njakjusa Padhola Rangl Hlgland Suk Sukuma Teso Tugen Turu
C Mainly Agricultural Economy with minor pastoral Interests--Acholl Alur Chagga Embu Alsu Kikuyu Nyoro Sambaa Toro
D Primary Agricultural Economy with little or no husshybandry--Digo Ganda Haya Klga K~gjO Makua Ngorl Ngindo Nyanwaz Soga Yao Zaramo Zlqua
There have been great basic changes that have occurred in
the last two decades toward a greater development of agricultural
Interest slight disappearance of tribal territories (traditions
of belief) due density Increasing demand for cash income and
greater att~nton to crop production husbandry by government and
47commercial concerns
AFRICAN HERITAGE
In general African cultural social background relevant
to economic development is very different from that of any other
developing region of the world Because of Africas geography
great size and climate It was after 1900 that the Influence of
the rest of the world began to reach most of Africa South of
Sahara 48
46 I bid p 2I bull 47Morgan Ope cit p 36
48~ K~ Schneider In W R Bascom and M J Herskovlts Continuity and Change In East African Cultures (Chicago University of Chicago Press 1959) pp 144-167
27
Perhaps there is a need to break the old African tradishy
tional heritage that Is passed to modern Africa A study of the
old African economy shows that it was one In which the methods of
production were simple and the units of production were small
The mlddle-nlen were both hated and Indlspensible Agricultural
progress was seriously impeded by the perpetuation of communal
right-over land 49 Chronic underemployment was one of Its basic
problems and despite moral exhortations among the people the
propensity to save was low It was an economy heavily dependent
on foreign sources for improved Industrial and agricultural methods
and to so~e extent for capital 50 The ambitious young men often
preferred careers In the professions and government service Men
here wrongly pinned their hopes on industrialization and economic
nationalism to absorb Its growing population Industrialization
was slow to come and the blessing of economic nationalism proved
to be mixed 51
The Extende~ Family
Perhaps even more Important than economic outlook both
positively and negatively Is the Inheritance of the continuing
strength of the tribal ties to which nearly all East Africans are
subject To begin with one must consider the L1neage Systems
49bld p 152
seA I Richard Economic Development and Tribal (Nairobi East African Publishing House 1969) p 78
Change
51lndustrlallzatlon In East Africa 5th Edition by United Africa Press Natrobl 1966 p 87
Published
28
or extended familyll--under which an individual has deep ties with
and feels obligation to a large number of people beyond the nuclear
family of the fathers mother and chlldren 52 Good fortune is
shared with m~ny others and In crisis one Individual can calion
help from many others
UnfCrtunately in terms of potential economic development
the extended family has many drawbacks It tends to discourage
Individual enterprise and Initiative as the burden of family
53obligations rise with the degree of an indlviduals success
There are other drawbacks Family crises tend to prevent
accumulation of capital or drain away the discretionary purchasing
power 54 The people with small incomes find it hard to comprehend
the greater cost of living of individuals with higher incomes
The age structure for the East African population is sigshy
nificant for as In most underdeveloped countries a large proshy
portion of the population is not of working age 55 Children of
fourteen years or under account for about 45 percent of the total
population which is comparable with the figure for Nigeria or
Brazil and in East Africa many children assist in picking cotton
or herding cattle Nevertheless productivity Is generally far
lower than that of adults and as increasing numbers of children
52UNESCO 11Popuiation Movements in East Africa in K M Barbour an~ R M Prethero (eds) Essay on African Population Routledge and Kegan (New York Oxford University Press 1961) p 96
53Ibid p 98 54( bid p 100
55L H Brown in E W Russell (ed) The Resources of East Africa (Nairobi Llterative Bureau 1968) p 102
29
attend school their contribution is decreasing although education
should enhan~p their income earning capacity in the future
Sh~rp contrasts in age and sex structure exist within East
Africa generally resulting from migration In NJombe and Songea
districts in Southern Tanzania about one-third of the adult men
are usually away Thus adult males make up a much smaller proshy
portion of the resident population than is normal The situation
is similar on~ thousand miles away in west Niles District of Uganda
The males of sixteen or over account for only 22 percent of the
population compared with the national average of 28 percent and
In the Kingezi District less than 20 percent were adult men according
to the 1969 census The absence of adult men Is even more marked
in parts of western Kenya for they comprise only 17 percent of
56the Kakamega District In the Kenya 1968 census
In Q1I these areas the high ratio of children to adults
tends to lo~er the level of economic activity This is not true
of the preponderance of women among the adults for they generally
do more work than men but the ratio of men to women may affect
57the economic activity in each area
Con~ersely an unusually high proportion of men of working
age means ~)re development 58 This is most evident in the cities
but also applies to larger areas such as Buganda or Tanga regions
Other factors must be favorable to attract people but the relatively
56Fred A Burke The Economics of Underdeveloped Countries (New York Oxford University Press 1972) pp 11-15
57 58Ibid p 29 Ibid p 30
30
high level of activity In areas such as Buganda is certainly related
to the age and sex and especially to the numerous Immigrant men
who either work as laborers or grow cash crops on their own account
there rather than In their home area
THE ECONOMIC ACTIVITIES OF EAST AFRICA
Trading Is an extremely Important economic activity even
though It Is not Itself productlve 59 By redistributing goods It
increases their value and It provides much employment in the process
Yet trading is sometimes omitted In studies In marketing geography
partly because of little data available on internal trade in East
Afrlca 60 However the main tradIng pattern of the regIon may be
outlined
Trade plays a smaller part In East African life than in
that of more highly developed regIons where peoples wants are
greater and where they satisfy few of their own requirements It
Is less Important even than in West Africa where It forms the
main Inter~st of an enormous number of people 61 Most East African
people produce theIr own food and cannot afford to buy many other
goods Nevertheless some goods are now sold In many parts of the
region and the proceeds are used to buy goods produced elsewhere
Commerce Is thought to contribute about 10 percent of all paid
59M Andrew Kamark The Economics of African Development (New York Praeger 1971) p 68
60 1bld p 98
61 Abull I Richard Economic Development and Tribal Change (Nairobi East African publishing House 1969) p 83
31
employment This commerce was mainly introduced since 1900 but
It has been superimposed on the traditional pattern of small-scale
trade which has not been entirely superceded
The Importance of trade In East African life has greatly
increased thrQugh the development of new forms of exchange which
Involve selling of goods for cash and buying goods produced far
away Ori31nally such trade consisted almost entirely of sales
for export overseas and the purchase of imported goods but today
an increased volume of sales Is to other parts of East Africa and
many of the commodities purchased have been produced within the
reglon 62
ThIs type of trade has provided the main basis for urban
development Both the large cities and the small towns of the
regions owe much of their present Importance to their trading
function even though many originated as administrative stations
within most rural areas the settlement pattern Is highly dispersed
and the clusters of bui ldlngs which are sometimes termed villages
usually consst mainly of IIdukas 163 Host of these small trading
centers grew up to handle the Import and export trade although
many now serve as markets for local trade
In review of a survey conducted by Keegan East Africa dukas
are very small carry one hundred items and occupy no more than
62Dbull A Hawks Official Journals East African Trade (Nairobi East Afric~ Publishing House 1963) p 10
63Warren J Keegan Multinational Marketing (New Jersey Prentice Hall Incorporated 1974) pp 308-9
32
fifty to seventy-five square feet 64 This indicates that the dukas
were operating on an average gross margin of approximately 12 percent
which is considered to be lower cost form of distributlon 65 The
East African duka Is highly Inefficient as a form of distribution
because the sales per person in the duka are much lower to keep
the duka developing significantly with the community economy
THE DISTRIBUTION OF TRADING ACTIVITY
Nairobi
The most important center of trade In East Africa Is Nairobi
A photograph of Nairobi Is provided on page 33 to give an example
of the modern cities of Africa Administration manufcaturlng and
commerce are three main functions of the city and are all comparable
In importace each employing more than fifty thousand people 66
The 1960 survey of distribution recorded one thousand wholesalers
In and out of a total for Kenya of three thousand It recorded two
thousand retail establishments compared with similar numbers In the
next nine towns of the country together 67 The value of all sales
by these ~airobi traders in 1960 was shs 400 billlon 68
T~e great Importance of Nairobi as a trading center Is
related to the fact that it performs trading functions at several
levels In some fields It serves the whole of East Africa and
64 Ib id p 308 65 Ibid p 309
66Mcrgan op cit p 70 67 Ibld p 72
6RKenya Chamber of Commerce Trade (Nairobi Kenya Governshyment Press 1973) p 5
34
in more ways it serves Kenya and Uganda and a small part of
Tanzania
In retail trade Nairobi serves a large area part of which
is relatively prosperous Its pre-eminence has probably hindered
the growth uf neighboring towns such as Limuru and Ruiru as shopping
centers Even Thlka thirty miles north of Nairobi Is more Important
in manufacturing than In trade 69 Much of the retail trade of
Nairobi however Is dependent on the large population and purchasing
power of the city itself Many people obtain their living by supplying
the needs of the administrations Industrial workers and even the
establishment of groups of up to thirty shops at various points
throughout-the higher class suburbs 70
The iMportance of Nairobi Is trade and Is related to Its
functions as the capital of Kenya and In some respects as administrashy
tive center for East Africa There Is a close relationship In which
its Importance In such fields as banking and Insurance are also
involved T~o other factors which favor Nairobi more than possible
rivals SLch as Mombasa are Its centrality in both Kenya and East
Africa and Its location on the eastern edge of the most prosperous
part of the region No town Is better placed to serve the whole
of Kenya or to serve all countries especially since means of comshy
munication have been on Nairobi The country south and west is
sparcely populated but In that to the north and east much purchasing
power Is concentrated There are substantial ve~y affluent European
69 Ibld p 6
70Ibld p 9
35
and African settlements which are of increasing significance as
71cash Income rl5es
Mombasa
Mombasa is not only the leading port In East Africa but
also a major center of trade The first function has led to the
second and the two together have enabled it to become the second
city of Kelya with a population of 380000 (1969 Census)72
Although many importing and exporting firms have headquarters in
Nairobi and their goods are consigned directly to or from the
port many others have offices in Mombasa and compete successfully
for the trade of a large part of East Africa Most traders in
Moshi for example and many in Kisumu or Kampala obtain supplies
through Mombasa importers The export marketing trade provides
much employment outside the port area far apart from private firms
concerned mainly with exports The Uganda Coffee and Lint Marketing
Board has large warehouses In Mombasa 73
Mombasa functions In retail and local wholesalers markets
but this activity Is small in relation to its size Its sphere
of Influence is inevitably reduced by its coastal location while
much of its immediate inner land is arid and sparcely populated
The ships calling at the port provide extra trade for they generally
71A M Wilson Social Change In Modern African Trade (New York Oxford University Press 1961) p 193
720xford Economic Atlas (New York Oxford University Press 1974) p lQ7
73Encyclopedia Americana East Africa Vol 4 (1974) p 579
36
take on some supplies and their crews and passengers often spend
some time clshore However this is of small Importance In comshy
parison with the export trade
Dar-es-Salaam
In some ways Dar-es-Salaam combines the functions of Nairobi
and Mombasa since it Is both the capital and the leading port of
74Tanzania Each of these roles encourages trade and the city
is much the most Important center of trade In the country On
the other hand It does not dominate the whole country as much
as Nairobi and Mombasa together dominate Kenya for both North
and South have only limited marketing connections with It Arusha
and Moshi have closer tradIng links with Kenya cities and with
the port of Tanga Bukoba has closer ties with Uganda and Kenya
and Mowara Region Is often linked physically with the capital only
by sea and It is therefore commercially Independent to some extent
Dar-es-Salaam also plays a smaller role than Nairobi and Mombasa
combined It Is comparable In size with the latter and Its inhabishy
tants are very much dependent on Its trading functions It is the
main center of import export and wholesale trade for the area
of 280000 square miles and a population of 19 million people 75
It Is also the center of small-scale wholesale and retail trade
for the coastal region while the purchasing power of the city populashy
tion is sufficient to support a wide range of specialized shops
74B F Joh~son The Sta Ie Food Economics of Tro leal Africa Tanzania (Stanford Stan or UnIversity Press 9 p 131
7Ibid p 26
37
Kampala
Kampala is smaller than the three cities mentioned above
but it is very clearly the commercial capital of Uganda Several
of the major importtng and exporting firms of East Africa have
branches there and merchants import goods directly from the port
of Mombasa Many of the businessmen are middlemen who buy from
Nairobi or Mombasa wholesalers and who often sell to other wholeshy
salers in sm~ller townsJ6 Kampala controls most of the trade of
Buganda and Western Uganda but less of that of the east and north
Thus whereas little is obtained their cement is consigned directly
from Toro to the northern towns Little is dispatched to towns in
77the west for these obtain their supplies through Kampala dealers
Although location and the communication pattern limit Kampalas role
as a distribution center for Uganda Kampala middlemen merchants
have extended their sales area in the west beyond the border of
Uganda to Bukoba and to Rwanda
Others
It is not practical to examine the trade of every town in
East Africa but some further features of the distribution of trade
might be noted
Most of the towns classified as others are majority adminisshy
trative centers and their marketing functions have developed from
this Although they differ considerably they are very similar in
76W T W Morgan East Africa Economic Characteristics (Nairobi ~ast Africa Publishing House 1960) p 279
77ibid p 280
38
appearance In addition to administrative functions these towns
provide services such as hospitals and they have generally become
centers of local communication The features tend to enhance their
roles In trade The size and importance of these trading centers
is generally related to the size population and propensity of the
areas they serve Most of these towns are newly created Their
populations range from between three thousand to six thousand and
they have rather less than one hundred shops most along a single
main street 78 All are retailers but many also sell goods to traders
from the countryside and buy some local agricultural products
Mo~t of the towns created are very young and they came into
existence due ~o the scarcity of land These towns are scattered
throughout East Africa and vary In both size and frequency with
the density of population and the local level of income
COMMUNICATION ACTIVITY
Transportation has become an Important economic activity
Official estimates place Its contribution to the Gross Domestic
Product of East Africa at ~45 million which accounts for 61 percent
of the total 79
Road Transportation
Road and rail transportation are probably roughly comshy
parable as sources of Income In East Africa although they differ
78~NESCO Opt cit p 96
790xford Economic Atlas (Oxford Oxford University Press 1966) pp 174216221
39
greatly in structure Road transportation is operated mainly on a
very small scale but there are so many small operators that the
number of people earning a living in road transportation Is very
large SO Motor vehicles came Into general use in the 1920s but
the greatest expansion of road transportation came thirty years
later Today there are many more vehicles per head of population
than in Nigeria or even Egypt approximately six persons per cad IISl
In Table 3 on page 40 road transportation shows that the majority
are private cars but the figure for vans lorries and busses undershy
states the volume of commercial road transportation Cars on many
East Africa roads are used legally or otherwise as taxis proshy
viding many people with good incomes This Is especially well shy
developed in Uganda and helps to explain the small number of busses
there Within each country road transportation activity Is heavily
concentrated In the most prosperous areas especially around the
capital Traffic counts show a far greater intensity on roads around
Nairobi M0mbasa Kampala Jlnja Dar-es-Salaam and Tanga than
elsewhere
The overall Importance and the pattern of road transportation
are both affected by the nature of the road network Road building
has been assisted by the character of the earth in many areas
simple earth murram road serving very well for light traffic
Although few roads are tarred the road network is ~uch better
than In countries such as Sudan and in much of East Africa is
SOlbid pp 147 174 193
81Ibid pp 147 174 183 193
40
Tab Ie 3
Transportation in East Africa (1963-73)82
Kenya Tanzania Uganda Totals
Thousand miles of roads of which bitumen surfaced
(thousands units 000)
Private Vehicles Commercial
Lorries Vans Busses
1963 Flgur~s Private Commercial
Ra 11-Track (In kilometers)
Rail-Vehicles (units 000)
Air-Craft (units 000)
Sea Transportation
nd -- No data available
522
22
1002 295 104 82 26
440 90
962 km
163
05
nd
409
22
726 304 11 I 74 22
220 80
3782 km
42
nd bull nd
39 I
07
619 208 64 70 17
180 60
1 160 km
72
04
nd
1322
5 I
2345 80 1
840 230
59 km
17
82 Ibid pp 174216221
41
adequate for the demand made upon it 83 Some areas without roads
notably in central and western Tanzania are found In other areas
many roads 3re Impassable In the wet season but themiddotdlstrlbutlon
of road transportation activity Is related mainly to factors other
than the roads themselves
Rail Transportation
In spite of competition from the roads railways of East
Africa still undertake most long-distance movement of bulk loads
All are operated by East African Railways Corporation on behalf
of the three governments The rail works employ more than eighty
thousand people
The entire railway system covers 5895 kilometers all
being meter gauge and virtually all single track 84 The East
African Railway Corporation Road Services Is operated mainly In
Uganda and Tanzania although a nucleus of road services between
Mombasa and Nairobi was established to provide express services
for certain commodities
The railway has been Increasing at a moderate rate over
the past few years Between 1965-1971 passenger number rose by
an average of 66 percent per year While the corresponding growth
85rate of freight was approximately 10 percent
83 lbld pp 147 174 193
84 IbId p 39
85Ibld pp 147 174 193
42
Sea Transportation
Sea transportation as an economic activity concerns East
Africa mainly through employment at the ports Sea transportation
administration is operated by the East African Harbors Corporation
on behalf of the East Africa community86 There are several sea
ports which serve Kenya Uganda Tanzania Rwanda and Eastern
Region of Zaire
Periodically these harbors suffer from severe congestion
with serio~s repercussions upon the economy of the entire East
African region The organizational changes within the East African
Cargo Handling Services responsible for handling of cargo as opposed
to the administration of the port makes handling operations slower
and more inefficient
Air Transportation
Air transportation is less than the other forms of transshy
portatlon for it can be used only by the most affluent passengers
and for the most valuable goods In each case the re-fuellng of
planes in transit provides a useful source of income Regular
internal services call at thirty-four places In East Africa of
which twenty-one are In Tanzania 87 The large size and peripheral
populatiofl pattern of that country make air transportation more
appropriate than in Kenya or Uganda Air transportation is unl ikely
to become a major economic activity In East Africa until Its cost
Is greatly reduced
86 Ibld bullbull pp 147 193 87 lbld bull
43
Communication Media
Communication media includes television radio receivers
telephones and dally newspapers These sources are growing at a
88rate of 10 percent per year The growth In urban areas Is higher
than In rurai areas No current data are avaIlable
Tab Ie 4
Communication Medla89 (Thousands) 1963
Kenya Uganda TanzanIa
Television 22 1 100 00
Rad 10 Reef Ivers 70 I 400 300
Telephones 6 1 6 1 32
Da II y Newspapers 190 123 83
SUMMARY
This review of literature was divided Into eight areas which
are pertinent to this study It was designed to provide background
Information related to
A East African Political Environment
1 Regional Survey
2 Nyika Plateau
3 Lake Victoria Basin
88Morgan East Africa Economic Characteristics p 36
890xford Economic Atlas Ope cit Table 1
44
B The Economy
1 Subsistence Economy
2 The Public Sector
3 Excessive Expectations for Public Service
C Population Distribution
1 Regional Population
2 Urban Population
D People
1 Tribal Classification
2 Historical Clusters
E African Heritage
1 The Extended Family
F Understanding the Economic Activities of East Africa
G The Distribution of Trading Activity
1 Na I rob I
2 Mombasa
3 Dar-es-Salaam
4 Kampala
H Communication Activity
1 Road Transportation
2 Rail Transportation
3 Sea Transportation
4 Air Transportation
5 Communication Media
Chapter 3
DESIGN OF THE STUDY
EAST AFRICAN ELITE
This survey was conducted and certain Information provided
to the argument of the study However difficulties of conducting
research 11 the formerly British-controlled territories of East Africa
are no different from those encountered elsewhere only more intense
because of lack of basic bench-mark data and basic socloeconomic
data Stratified probabil ity sampling in more advanced societies
can be designed in many ways Voters rolls rate-payers registers
and the like are usually up-to-date and easily available to the
researchers Such data do not exist in East Africa I Survey
research must be designed therefore on what data are available
There is little constructive value In the criticisms of the purist
that sampling techniques used in Africa do not fit acceptable
Western standards 2 It Is true that they do not but Leonard Doob
states that lithe scholarly or scientific gains to be derived from
ILeonard W Doob Periodic Surve s In Sub-Saharan Africa (Nairobi Nairobi Publishing House Hay 11 1970 p 3 bull
21~id p IS
45
46
valid results are so staggeringly inviting that the frustrations
of the moment Cre rendered almost Impotent- 1I3
Marco Surveys Ltd Nairobi Is the original data source
on its determination to publish Whomiddots Who in East Africa In 1974
Its part information Is the basis for this study
The survey by Marco Survey Ltd Nairobi had faced some
difficulties in deciding who was to be interviewed however It
took several months of careful planning Staff lists were prepared
by the four governments directories of commerce and industry and
membership 1ists of all available professional cultural and warshy
fare organizations and societies were examined Finally the
wage structures of the largest companies were checked and compared
to the wage paid by the four governments Every Interview was
planned and every respondent was presented There were direct
mall intervIews and each respondent signed the completed form
as correct after the interview
The criteria for selection to be interviewed were two The
first criterion was income The optimum cot-off point was an income
of ~I 000 per annum which is higher than the average European
or Asian income and Is also higher than the starting scales for
4university graduates The second criterion was the position held
by the respondent Women who have been Included are el ites In
their own right and not persons who are simply wives of elites
There are only sixty women in the total of 1423 Interviews about
3Eest Africa 1974 (Nairobi Marco Survey Ltd 1974)
4Doob Ope cit p 256
47
4 percent so sex was not used as a basts of tabulating the socloshy
economic data
This data Is presented on a comparative basis to Illustrate
by the basic =lassiflcation data the differences and similarities
of the African elite of the three countrles--Kenya Uganda and
Tanganyika Zanzibar has been Included and treated separately In
most of the tables
This study Is divided Into three parts The first Is an
analysis of the elite In East Africa based on the basic classificatory
data that w~s collected In the original research for Whos Who in
East Africu5 and additional studies which In addition to describing
the elite give Insight Into their opinions attitudes and beliefs
The second is a survey of urban elite opinions on basic social
and economl~ problems and technical assistance It Is based on a
stratified probability sample of those who most closely resemble
the elite in three African capital cities The third describes a
survey which Is beginning to provide research Into changing attitudes
and knowledge that will temporal orientation determlnlsm 11 The
sample will be described at the beginning of the second part for
each of these surveys and a few sample tables will be given to
Illustrate some of the results of this research
Approximately 6 percent of the Africans listed for Intershy
view refu~ed to be Interviewed There were numerous reasons given
for refusing but the chief factors were education and personal
reasons claiming that they were not Important enough to be included
5Marco Survey op cit p 19
Na I rob I
URBAN ELITE OPINION
Order (Englewood Cliffs chapter 4
A recent study poses the hypothesis that the role of the
Standard codes were used to clarify the data and cards
be said that the attitudes and opinions expressed In answer to
East Africa to test the attitudes and opinions of the city African
The interviews were conducted by permanent senior research
48
6Fred G Burke Africans Quest New Jersey Prentice Hall Incorporated
questions are those of the elite but they do represent the opinions
and education The respondent had to have had some secondary edushy
affairs and social problems The sample was stratified by age
the interviews were conducted or had many years of residence there
Inevitably some of those listed were not available for Interview
on certain questions Involving his personal life International
cation and had to be at least eighteen years of age It cannot
a stratified robability sample in each of the capital cities of
Five attempts were made In every case of this type before giving
city in Africa is that of generator communicator Innovator and
Intergrator 6 The research accepted this hypothesis and designed
were punched for 80-column ICT data-processing equipment in
up An estimated 10 percent of those listed were no t avai lable ll
assistants All of these have at least a Bachelor of Arts degree
for interview for one reason or another
or its equivalent and are either nationals of the country in which
49
and attitudes of a probability sample of urban African eighteen
and over who has had some secondary education and who lives in
one of the capital cities of East Africa Therefore the opinions
of this group will be closer to those of the elite than a sample
based on the population as a whole
The people interviewed were chosen in the following manner
Each city including peri-urban and dormitory areas was divided
into geographical units using a grid method on a base map Each
square of the grid was numbered except for those that were in
the business area--marshalling yards ocean and the like--and 10
percent of the squares were chosen by using a table of random numbers
The number of units of housing In each was then determined and
the quota was divided proportionately between each The interval
between units was determined and a starting point selected
The interviewers continued Interviewing to the set interval
until the quota was completed Three callbacks were made where
necessary for each respondent before declaring that interview
void The household was defined as that group which regularly
takes its meals together The head of the household was Intershy
viewed to determine how many In the household of either sex were
over eighteen and had had some secondary school education Those
were then listed and the person to be interviewed was selected
by a system of random numbers Only one person was Interviewed
In each household If the unit did not have at least one person
as defined by education the interviewer then proceeded to the
next household by the fixed interval Ten percent of the intershy
views were checked by field supervisors The Interviews were
50
conducted i~ English for the most part but some Swahili was used
in Dar-es-Salaam
The questionnaires were pretested in each of the capital
cities and the questions were modified where necessary The
translation of Swahili was made in the usual way of two separate
translators who worked from Engl ish to Swahil i and vlce versa
The interviews were conducted from September 15 to October
5 1974 The tables have been shortened for prInting convenience
by grouping items that have less than 5 percent response Into the
category 1I0thers 11 Percentages were rounded to the nearest whole
number or if the percentage was too small in a subsample whole
numbers were given in parentheses
OPINIONS AND ATTITUDES
The following is a description of a few of the questions
which were used in pretesting a series of eighteen questions in
three capital cities of East Afrlca to establish eight scales to
assess opinions and attitudes about temporal orientation governshy
ment confidence and optimism science and determinism conception
of people politics and tribalism or traditionalism It is Intended
that the scales when adequately tested revised and evaluated
can be used for per lodlc surveys at least fixed intervals over
1I7the next five years Such surveys will provide scales that can
be used to measure social change and that can be used to compare
7Gordon H Wilson liThe Transformation of East Africa Basic Scale for Periodic Research (New York Basic Books Printer 1971) p 456
51
data from the three capital cities and also to compare the basic
data between the elite of the urban areas and probability samples
from selected rural areas
The pretests were carried out in Nairobi Kampala and
Dar-es-Salaam Each was based on a probability sample of 150
people stratified by age eighteen and over and education The
respondent must have had some secondary education In fact the
sample for the pretests were chosen on the same basis as the survey
described In the third part A probabilIty sample of this type
Is unavoid~bly composed mostly of males young adults who are
relatively wealthy engaged In the more skilled occupations and
professIons representing the politically and socially Important
members of the community It closely resembles the elIte described
In the second part of this chapter The research selected only
a few questions to Illustrate the possible value of the results
It Is patently evident however that though these one-shotll
results are
bull merely interesting or suggestive they will become significant and really helpful when comparative data are obtained over a period of time so that trends knowledge and public ftplnlon can be detected and measured by established scales
8 b t d p 456
Chapter 4
ANALYSlS OF DATA
The age of the elite of East AfrIca shows some sIgnIfIcant
differences among the four countries Table 5 on page 53 is the
percentage distribution by age If we disregard the not stated
categories the average ages are as follows Kenya 31-45 years
Uganda 36-40 years Tanganyika 31-35 years Zanzibar 41-45 years
East Africa 36-40 years
Table 5 shows the average age of elIte to be higher In
Uganda and Zanzibar than In Kenya and Tanganyika Uganda has 17
percent of elite over fifty years and ZanzIbar 28 percent whIle
4 percent cf elIte are In this age group In Kenya and Tanganyika
Later the analysis will reveal that one-third of the Uganda elite
are Baganda thus the explanation of the older average age may
be that Baganda has had a strong traditional centralized governshy
ment for many years and therefore posItions of power of authority
have been open to the Baganda for a much longer period than for
other East Africans The same explanation can apply to the elite
of Zanz rbar
The process of Africanlzatlon can be seen In Table 6 on
page 54 There Is a smaller percentage of Africans in the civil
service In Kenya than In the other two countries but a higher pershy
centage of elected and appointed representatives due to the regional
52
53
Table 5
East African Elite Age Factor By Percent
Kenya Uganda Tanganyika Zanzibar Total
Up to 25 years 5 1 1 2 3
26-30 years 18 15 18 8 16
31-35 years 26 15 21 5 17
36-40 years 21 20 20 9 20
41-45 years 12 16 11 17 14
46-50 years 4 8 8 5 6
51-55 years 2 9 2 10 4
56-60 years 1 4 2 8 3
61-65 years 1 3 - 7 2
66 and over a 1 - 3
Not stated 10 8 17 26 14
Total 100 100 100 100 100
Base 457 409 444 113 1423
a -shy Less than 5 percent
54
Table 6
East African Elite Occupation Factor Sample by Percentage Distribution
Kenya Uganda Tanganyika Zanz Ibar Total
Civi 1 servant 27 42 51 46 40
Electedappointed 41 34 23 10 31
Commerceindustry 12 10 9 19 11
Trade union politician 13 5 4 6 8
Education 6 6 7 a 7
Professional 3 I I 7 2
Cooporatlvestrade I I 3
Religiouswarfare 2 4 6 - 4
Agriculture I 2 1 3
Miscellaneous 2 3 3 2 3
Total 108 108 108 108 108
Base 457 409 444 113 1423
a -- In a few cases the same person qualified in more than one classification
55
form of government Kenya also has a higher percentage of elite
who qualify as trade unionists
There are several ways of describing occupations Civil
servants for example can be in medical education or other
services Table 7 on page 56 gives occupations of the elite
in East Africa by a different set of criteria
The Education Factor
Tabl~ 8 on page 57 shows that in the categories University
and above East Africa rates 25 percent--with Kenya 25 percent
Uganda 24 percent Tanganyika i9 percent and Zanzibar 32 percent
The high number in the last country is accounted for in Table 7
IIEast African Elite Where Educated A higher percentage were
educated in the United Kingdom and IndiaPakistan (52 percent)
because of lack of local secondary schools Another factor is that
a well established social class structure was part of pre-independence
culture The upper class in Zanzibar and to some extent those
among the Baganda could afford overseas education whereas those
from other countries were dependent on financial help from governshy
ment sources
There was a higher percentage of elected or appointed represhy
sentatives In Kenya and this category was not so highly educated
as the Icivtl servant of a ll others categories It can be seen
that there are more electedappointed representatives than civil
servants or others in the lowest categories of education In the
highest educational brackets we have more civil servants in the
elite of all three countries than in the other two classifications
55
form of government Kenya also has a higher percentage of elite
who qualify as trade unionists
There are several ways of describing occupations Civil
servants for example can be in medical education or other
services Table 7 on page 56 gives occupations of the elite
In East Africa by a different set of criteria
The Education Factor
Tabl~ 8 on page 57 shows that In the categories University
and above East Africa rates 25 percent--wlth Kenya 25 percent
Uganda 24 percent Tanganyika 19 percent and Zanzibar 32 percent
The high number in the last country is accounted for in Table 7
IIEast African Elite Where Educated 1I A higher percentage were
educated in the United Kingdom and IndiaPakistan (52 percent)
because of lack of local secondary schools Another factor is that
a well established social class structure was part of pre-Independence
culture The upper class In Zanzibar and to some extent those
among the Baganda could afford overseas education whereas those
from other countries were dependent on financial help from governshy
ment sources
There was a higher percentage of elected or appointed represhy
sentatives n Kenya and this category was not so highly educated
as the llcivll servant of lIa ll others ll categories It can be seen
that there are more electedappointed representatives than civil
servants or others in the lowest categories of education In the
highest educational brackets we have more civil servants in the
elite of all three countries than in the other two classifications
56
Table 7
East African Elite Specific Occupation Factor By Percent
Kenya Uganda Tanganyika Zanzibar Total
Education (administration) 5 4 6 7 5
Education (teacher) I 3 1 2 2
Medical practicing 4 5 3 5 4
Sciences 1 I I 2
Lawjudicial 1 6 2 8 2
Accountancy 2 1 2
Farmer 1 2 I 3
Entrepreneur 2 2 I 9 2
Senior executive 34 36 61 44 45
Junior administrator 7 14 14 3 1I
Legislator (only) 38 20 7 8 21
Partyunion officials 13 5 4 6 8
Editorsartauthors 1 1 I 5
Clergy senior 1 3 4 - 2
Others (unclassified) 2 5 3 2 3
-Base (all Africans
Interviewed) 457 409 444 113 1423
57
Table 8
East African Elite Education Factor By Percent (1972)
Educational Level Reached Kenya Uganda Tanganyika Zanzibar Total
No formal education
Attended junior secondary 22 13 8 21 15
Attended sen lor secondary 21 18 23 13 20
Obtained certificate of secondary 12 8 3 10 8
Obtained higher certificate high school a a a - a
Nonunlverslty technical studies 5 7 19 6 10
Nonunlverslty teaching studies 4 6 7 - 5
University studies non-graduate - 22 20 17 17
University studies 1st degree 17 15 16 26 17
Post-graduate university ma s te r I s deg ree 5 7 2 4 7
Post-graduate university studies higher degree 2 2 1 2 1
Not stated I - I I a
-Base (all Africans
Interviewed) 457 409 444 113 1423
a -- Less than 5 percent
58
Civil servants In Uganda are more highly qualified than In the
other three countries 59 percent have university education In
Kenya 56 percent In Tanganyika 42 percent and in Zanzibar 56
percent have university education Elected and appointed represhy
sentatives generally have less education In Kenya 22 percent
Uganda 37 percent and in Tanganyika 26 percent (Zanzibar could
not be tabulated) have university education Uganda Is still the
highest among the three countries
Country Where Ed~catlon Was Obtained
Table 9 on page 59 gives details about the country In
which the respondent was educated In his final year of education
It can be seen that the highest percentage of the elite were edushy
cated in local East African schools (58 percent) The United Kingdom
came next (28 percent) followed by the United States (7 percent)
IndiaPakistan and other African countries There are very sigshy
nificant differences between the East African countries however
which are worth noting Zanzibar and Uganda have many more elite
who were edycated overseas and in the United Kingdom particularly
than the other countries Kenya had fewer by 10 percent than
the next lowest which was Tanganyika
It would be a waste of effort to detail all of the East
African schools attended by the East African elite There were
nearly one ~undred What is significant however is to show that
out of this total only a few schools account for handful accounts
for more than 5 percent of the elite In each country and moreover
this handful accounts for a very significant percentage of the elite
59
Table 9
East African Elite Where Educated
Country Educated Kenya Uganda Tanzania Zanzibar Total
East Africa only 67 54 57 42 58
Afrlca--outslde East Afrt ca 3 4 4 1 4
The U S 8 5 8 2 7
The U K 18 38 27 38 28
IndiaPakistan 4 3 3 14 4
Austral la New Zealand a - - - a
Canada - a - - a
Western Continent Europe Ie Germany Norway 1 1 3 2 2
USSRChina or Eastern European Countries - - a - a
Elsewhere outside Afr lea
Not stated 1 - a 2
Total 103 106 100 100 100
Base (All AfrIcan Interviews) 457 409 444 113 1423
a -shy Less than 5 percent
60
The Factor of Rellslon
This survey did not Include Zanzibar and therefore the
paper Is unable to provide comparative figures for Zanzibar of East
Africa as a whole One would logically expect to find relatively
61
the same number of elite as the general percentage for the popushy
lation as a whole In each religious grouping
Table 10 on page 62 is complicated by the category among
the elite of Inormal Chrlstlan1I which did not appear In the first
survey This category has been added because many of the sophisshy
ticated Africans were educated In Christian schools so they do not
regard themselves as pagan and yet they do not belong to any formal
church The category IInormal Christian or simply Christian is
used to describe them We can generalize that fewer Moslems are
among the elite than one would reasonably expect from the above
figures particularly In Tanganyika Fewer Roman Catholics in
Kenya and Uganda are among the elite than one would reasonably
expect from the above figures about the proportions to be expected
Moslem education In East Africa Is less than education
among the other religions Protestant missions have been strongest
in education since earliest times In East Africa and this Is
reflected in Table 10 Even In government schools in the old colonial
tradition the Church of England as the state church dominated
the educational field In the British System and in England today
1Ireligion is taught along with the three Rl s This will explain
the larger number of Protestants In the population as a whole and
among the elite of Uganda and Kenya Zanzibar of course Is a
Moslem country Most of the 7 percent 1I0 ther ll in Zanzibar were
Bahal The white fathers of Tanganyika dominated the field of edushy
cation in early German times and remained a powerful force throughshy
out the Trusteeship period
62
Table 10
East African Elite Religion Factor Compared to Population Percentage
Kenya Uganda Tanganyika Zanzibar Total
Elite Othersa Elite Othersa Elite Othersa Elite Elite
Roman Catholic 21 29 25 34 26 28 4 22
Protestant 54 45 65 50 22 26 43
Moslem 4 16 3 10 16 39 88 14
Pagan 8 6 7
Normal Christian 15 2 24 13
Other 7
Not stated 6 2 5 1I 7
Total 100 100 100 100 100 100 100 100
Base 457 2400 409 2600 440 2000 113 1423
a -- The percentages for others is based on the probability sample (7000) of survey conducted by Fred G Burke Some grass-roots attitudes affecting political and social Intergratlon In East Africa paper delivered to the African Studies Association San Franclsco October 26 1963
63
The Factor of Voluntary Associations
The degree to which Individuals In African societies join
groups of voluntary association is a measure of social change The
comparison between the four countries which is given in Table 11
on page 64 shows significant differences between them Tribal
associations are much stronger in Kenya than elsewhere 21 percent
as against 2 percent to 8 percent In Zanzibar Tanganyika and Uganda
This underlines the felt need of the Africans of Kenya for security
among their own people in the face of Insecurities of the old
colonial system and Its concomitant privileged European and Asian
classes Nowhere else in East Africa was the position of the
settler or trader so strong Moreover political parties were
banned In Kenya on a national basis until comparatively recently
although district associations were encouraged by the administration
Kenya elite rate highest In political party membership (35
percent) as against 17 percent to 22 percent and trade union membershy
ship (20 percent) as against 5 percent to 12 percent
Uganda elite join more groups of voluntary associations
than the elIte of other countries The average Uganda elite has
membership In two groups Kenya 1-7 Zanzibar 1~6 and Tanganyika
1-5 Moreover the kind of groups that the Uganda elite support
are more sophisticated The Uganda elite rate much higher In
religious (16 percent) versus 6 percent to 9 percent professional
(15 percent) versus 4 percent and cultural (16 percent) versus
6 percent to 11 percent The Uganda elite Is only second to the
Zanzibar elite (42 percent) as members of social clubs (36 percent)
but significantly higher than the Kenya elite (23 percent) and the
64
Table 11
East African Elite Voluntary Associations Factor By Percent
Kenya Uganda Tanzania Zanzibar Total
Member of a tribal association 21 8 3 2 10
Religious societyunion 6 16 6 9 9
Business society 5 8 6 11 6
Professional society 9 15 4 15 9
Academic society 12 20 7 17 13
Political party 34 21 22 9 25
Charitable organization 5 13 12 42 10
Social club 23 36 25 9 29
Sporting club 6 16 11 15 11
Other organizations 11 4 5 10 8
Cultural organizations 6 16 11 10 11
Trade union 20 5 12 5 12
Belong to none 18 17 33 17 22
Total a 176 195 157 165 175
Base (All African interviews) 457 409 444 113 1423
a -- Many individuals belong to more than one group
65
Tanganyika elite (25 percent) One In three of the Tanganyika
elite (33 percent) does not belong to many voluntary associations
compared to only 17 percent or 18 percent for the elite who do not
belong to at least one society In the other East African countries
Business is presented equally in each of the four countries
Table 11 Is one of the most significant of the survey The
Uganda elite of whom one in three was Baganda have had University
at Kampala for many years It was once the only center for higher
education In East Africa Therefore culture In the western sense
was for many years a factor of influence on elite of Uganda which
was not available in either Kenya or Tanganyika
The Tribal Factor
The percentage of the elite In each country by tribe
compared to the percentage of the population represented by that
tribe should give an Interesting Index of the degree to which
the tribe has progressed and Indirectly of the Influence of Its
members
The first significant fact which emerges Is that 9 percent
called themselves Tanganyikansll and would not use the label tribe 11
We can only assume that the actual percentage by tribe of this group
Is about the same as described In Table 12 on page 66 with the
obvious Inclusion of some who are of mixed percentage The most
significant fact Is that there were 30 percent who belonged to Kenya
tribes 2 percent Ugandans and 5 percent Zanzlbarees No other
East African country had as high percentages In these categories
That amounts to 37 percent who were of tribes other than those of
66
Table 12
Tanganyika ElIte by TrIbal Group
Tri be Percent of PopulatIon Percent of ElIte
Sukuma 19 3
Nuyamwerl 7 2
Hakonde 6
Haya 6 7
Chagga 6 12
Gaga 6
Ha 5
Hehe 4 1
Nyakusa 4 3
Wguru 4
Sambaa 3
Zaramo 3
Yao 3
Hwevu 2
Others (Less than 2) 13 22
Stated Tanganylkan 9
Kenyan Tr t bes 30
Uganda TrIbes 2
Zanzlbaree 5
Toeal 100 100
Base 10204000 (1973) 444
67
Tanganylkans The major tribe the Sukuma represents one in five
of the Tanganyika population yet has only one In thirty-three
among the elite There are twice as many Chagga among the elite
as their tribal percentage would warrant Surprisingly the Haya
have more than their share although all the rest have fewer except
the ve ry sma 11 Ilothe r ll t r i bes who have nea r 1y tw Ice as many
In Uganda we would expect to find the Baganda over represhy
sented in the elite (see Table 13 on page 68) They have like
the Chagga twice as many (33 percent) as the tribe percentage would
warrant (162 percent) An even higher percentage 28 percent
claimed to be IIUgandans a classification not recorded in the official
census figure Only 1 percent are from Tanganyika and 1 percent
from Kenya Unlike Tanganyika the smaller tribes which each
represent less than 1 percent each of the population have only
half as many elite (6 percent) as their combined percentage (94)
would expect Tanganyika had twice as many The Watoro was the
only other tribe In which the percentage of the elite exceeded
that of the tribe 4 to 32
Kenya Is unique In that there are several tribal groups
that exceed their quota of elite and by almost the same ratio (see
Table 14 on page 69) The Luhya have a slight margin by ratio
over Luo and Kikuyu The Kamba Mero and Embu related tribal
groups are all seriously under their expected percentages Like
Tanganyika but unlike Uganda the small tribal groups--each of
less than 3 percent of the total population but represent 161
percent of It--have 22 percent of the elite A high percentage
of this group of the elite are from the numerous coastal tribes
68
Table 13
Uganda Elite by Tribal Group
Tribe Percent of Population
-Baganda 162
Banyonkole 8 I
Teso 8 I
Basoga 78
Baklga 7 I
Lango 56
Baglsu 5 I
Acho I I 44
Lugbara 37
Wator i 32
Banyaro 29
Karamujong 19
Alur 14
Banyole
Kuma 94
Others (Less than 1) -Not stated
Stated Ugandan -Kenyan tribe
Tanganyika tribe
Total 1000
Base 7367558 (1973)
Percent of Elite
33
3
3
4
2
3
3
4
3
6
28
100
409
69
Table 14
Kenya Elite by Tribal Group
Tri be Percent of Population Percent of Elite
-Kikuyu
Luo
Luhya
Kamba
Meru
Kis i i
Embu
Klpsigis
Nandi
Others (Less than 3)
Stated Tanganyika
195
144
125
117
69
49
39
3
22
16 1
23
19
19
6
2
3
2
22
2
Total 1000 100
Base 9204000 (1973) 457
70
Table 15
Question
What in your opinion is the most important problem facing our country at the present time
Na i rob i Dar-es-Salaam Kampala Total
Education
Poverty-famine
Unemployment
Economic development
High cost of living
Border disputes Inter-African disputes
Pol itical instabi 1ity
Tr i ba 1ism
Land apportionment
Publ ic laziness
Other problems
Don1t knownot stated Refused to answer
22
13
41
6
10
3
2
3
2
2
29
24
6
24
3
6
4
2
28
18
18
12
9
5
3
2
5
3
27
19
18
14
8
3
3
4
2
Total 109 105 105 105
Base 389 451 395 1235
71
Table 16
Question 2
All things considered how satisfied are you with your present standard of 1ivlng--very satisfied fairly satisfied
somewhat dissatisfied or very dissatisfied
Nairobi Dar-es-Sa1aam Kampala Total
Very satisfied
Fairly satisfied
Somewhat dissatisfied
Very dissatisfied
Don I t know
Refused to answer
6 13 4 8
32 50 25 36
32 26 37 31
29 11 32 24
Total 100 100 100 100
Base (a 11 intervi ews) 389 451 395 1235
72
Table 17
Question 3
Do you think political matters should be left to the government or should people like yourself take
some active part in political affairs
Nairobi Dar-es-Salaam Kampala Total
Left to government 26 24 13 21
People to take an active part 72 72 73 72
Other answers 4 2
Dont know 2 8 3
Refused to answer 2 2
Total 100 100 100 100
Base 389 451 395 1235
73
Table 18
Question 4
Which one of the following do you think our country needs most at the present time more schools more hospitals
more housing more factories or more roads
Nairobi Dar-es-Salaam Kampala Total
More schools 40 44 51 45
More factories 40 37 28 35
More hospitals 17 10 15 14
More housing 1 6 5 4
More roads 2 3 1 2
Don I t know
Total 100 100 100 100
Base 389 451 395 1235
74
Table 19
Question 5
Now which one do you think our country needs most an honest government without corruption a government that gets things done fair distribution of wealth
national unity or individual freedom
Nairobi Dar-es-Salaam Kampala Total
An honest government wIthout corruption 44 38 51 44
A government that gets things done 23 18 17 20
National unity 22 20 17 19
Individual freedom 6 14 6 9
Fair distribution of wealth 5 9 8 8
Don I t know
Refused to answer
Total 100 100 100 100
Base 389 451 395 1 235
75
Table 20
Question 6
Which do you prefer--government ownership or private ownership of major industries
Nairobi Dar-es-Salaam Kampala Total
Government ownership 51 43 38 44
Private ownership 38 38 31 36
Mixed (voluntary answer) 10 18 29 19
Don I t know
Refused to answer - - 1shy
Total 100 100 100 100
Base 389 451 395 1235
76
Table 21
Quest Ion 7
As you know there are many different ways In which African states can establish closer ties among themselves Which of the
following ways would you favor an organization for settling disputes between African governments
closer economic relations political federation African military
organization cultural exchanges
Nairobi Dar-es-Salaam Kampala Total
Favor 94 96 85 92
Oppose 3 3 9 5
Don I t know 2 1 4 2
Refused to answer 1 - 2
Total 100 100 100 100
Base 389 451 395 1235
-Closer economic relations 22 49 53 41
Political federation 26 39 27 31
An organization for settling disputes between African governments 34 32 15 28
An African military organization 15 18 11 15
Cultural exchanges 3 10 3 6
Don I t know
Total 100 149 110 121
Base 366 432 337 1135
77
(8 percent) only 2 percent are Tanganylkans and the Ugandans did
not rate statistically
ELITE OPINIONS AND ATTITUDES
Not only does Scale 1 Table 22 Illustrate a sound basic
knowledge of modern methods to prevent crops from being damaged
It also Illustrates a similarity of knowledge between the three
sample areas which are widely separated geographically Scale 1
will be Invaluable when comparing the results of our first rural
study the field work of which has been completed and Is at the
stage of processing
Table 22
Scale
It does not help much to try to prevent crops being damaged by Insects and diseases such losses can
never really be prevented
Kampala Dar-es-Salaam Nairobi East Africa
Agree 8 12 12 11
Disagree 88 85 87 86
Uncertain 4 3 3
Base 153 156 150 459
Scale 2 Table 23 on page 78 also Illustrates but not
so conclusively similarities between the three areas Nairobi
had 17 percent agree whereas Dar-es-Salaam had only 10 percent
with Kampala somewhere Inbetween One could say therefore that
78
there Is a higher degree of tribalism among the elite of Nairobi
than among the elite of Dar-es-Salaam
Table 23
Scale 2
A man should never marry a woman who does not belong to hIs tribe
Kampala Dar-es-Salaam Nairobi East Af rl ca
Agree 12 10 17 13
Disagree 81 83 80 82
Uncertain 7 7 3 5
Base 153 156 150 459
While Scale 3 Table 24 shows a similarity between the
three areas It shows that the respondents of Nairobi are much
Table 24
Scale 3
People have It within their power to bring harm and misfortune to others through magic
Kampala Dar-es-Salaam Nairobi East Africa
Agree 26 28 30 28
Disagree 45 46 61 51
Uncertain 29 26 9 21
Base 153 156 150 459
79
more sophisticated In regard to magic than in the other sample
points and that fewer are uncertain A significant number In each
area however believe that magic can be used to bring harm and
misfortune to others
Scale 4 Table 25 shows a consensus between the three
areas but shows an over all unfavorable knowledge about science
and knowledge The majority 83 percent believe that many imporshy
tant matters can never be positively understood by the human mind
The question can provide a very useful comparison In changing patterns
of knowledge regarding science In the future
Table 25
Scale 4
Science and knowledge are useful of course but many important matters can never be positively
understood by the human mind
Kampala Dar-es-Salaam Nairobi East Africa
Agree 80 79 86 83
Disagree 9 12 13
Uncertain 11 9 6
Base 153 156 150 459
Scale 5 Table 26 on page 80 shows an unfavorable public
opinion about the role of traditional chiefs and the dichotomy caused
by loss of status in recent years by traditional chiefs whose roles
have been largely taken over by the political appointee of the
ruling party The question will also provide useful comparative
80
data between ruralurban areas and will be useful In the future to
measure changes in attitudes and opinions about traditional chiefs
Table 26
Scale 5
A man ought always to obey his traditional chief
Kampala Dar-es-Salaam Nairobi East Africa
Agree 42 38 45 42
Disagree 42 46 49 46
Uncertain 15 16 6 12
Base 153 156 150 459
Scale 6~ Table 27 not only shows an area of new problems
for East African elite but also the wide divergence of response
Table 27
Scale 6
Government and politics are so complicated that the average man cannot really understand what Is going on
Kampala Dar-es-Salaam Nairobi East Africa
Agree 81 65 72 72
Disagree 16 24 22 21
Uncertain 3 11 6 7
Base 153 156 150 459
81
between the three sample points In Kampala 81 percent agree
with the statement and only 3 percent are uncertain whereas In
Dar-es-Salaam 67 percent agree while II percent are uncertain
The statement will provide a useful measure In future of the attl shy
tude of the elite toward government In each of the three sample
points
Scale 7 Table 28 Is a new problem of Investment and
saving which as you can see has brought out differences between
the three sample points and will provide In the future a useful
measure of changing attitudes toward savings and the postponement
of rewards
Table 28
Scale 7
If I had the choice I would prefer to be given a small sum Immediately rather than be promised a very
large sum one year from now
Kampala Dar-es-Salaam Nairobi East Africa
Agree 62 54 62 60
Disagree 24 37 30 30
Uncertain 14 9 B 10
Base 153 156 150 459
There are other examples above of similarities and dlsshy
similarities which are even better than Scale 8 Table 29 on page 82
It does show however a close correspondence between Kampala and
Nairobi while Dar-es-Salaam shows a more tolerant attitude In
82
their response to this statement Once again the comparison between
urban and rural areas should show an Interesting and significant
difference
Table 29
Scale 8
A womans place Is in the home
Kampala Dar-es-Salaam Nairobi East Africa
Agree 45 36 45 42
Disagree 46 61 51 52
Uncertain 9 3 4 5
Base 153 156 150 459
Scale 9 Table 30 shows significant statistical differences
between the response from Kampala and those of the other two sample
Table 30
Scale 9
The traditional ways of the past are the best
Kampala Oar-es-Salaam Nairobi East Africa
Agree 15 33 33 27
01 sag ree 68 58 56 61
Uncertain 17 9 11 12
Base 153 156 150 459
83
points This fact Is even more Interesting when we know that in
Uganda the present form of government has been designed to maintain
the traditional ways of the past whereas In the other two areas
the present government has been designed to change politically
at least traditional ways The reactions of the Kampala respondents
therefore are a significant Indication of their dissatisfaction
with efforts to maintain traditional ways
Scale 10 Table 31 also Illustrates that Kampala has a
different reaction than the other two sample points although there
are less significant differences between Dar-es-Salaam and Nairobi
Table 31
Scale 10
The present Is all too often full of unhappiness It Is only the future that counts
Kampala Dar-es-Salaam Nairobi East Africa
Agree 29 50 60 46
Disagree 44 27 32 34
Uncertain 21 23 8 20
Base 153 156 150 459
Scale 11 Table 32 on page 84 Is a really significant
Indication of the basic dissatisfaction of the Kampala respondents
with the status quo The dissimilarity was also reflected in
Scale 10
84
Table 32
Scale 11
The government Is doing all It can to develop our country
Kampala Dar-es-Salaam Nairobi East Africa
Agree 51 86 84 74
Disagree 21 5 10 12
Uncertain 28 9 6 14
Base 153 156 150 459
Chapter 5
SUMMARY AND CONCLUSIONS
The purposes of this study were to
1 Analyze the factors which have slowed the economic
development of East African communities
2 Identify the major problems encountered In economic
systems In East Africa
3 Determine the problems in developing the economic growth
of the community
4 Identify economic reconstruction needs
All the published materials listed below were extensively
reviewed The review Included library research over both periodicals
and some relevant studies The writing of this report Is thus based
on the Information provided by the following documents
1 Periodicals books pamphlets mlcroflshe from the
William Allen White Library of the Emporia Kansas State College
2 Xeroxed materials and books that were secured through
the Inter-library loans
3 Report collected by the Marco Survey Ltd Nairobi
4 Periodicals Issued by the Information section of the
Embassy of the Republic of Kenya Washington D C
In order to determine the social and economic problems of
East Africa a questionnaire-Interview method was used In total
85
86
1423 elites were I~ervlewed Approximately 6 percent of the
elites listed for interview refused to be interviewed
The Interviews were conducted by permanent senior research
assistants
The data collected were compiled (using standard codes to
clarify the data and computer cards were punched for BO-column
I C T data processing equipment In Nairobi) summarized and
interpreted
Finally conclusions were reached
SUMMARY
British East Africa was the name applied to the territories
in East Africa before It achieved Its Independence The territories
cover a total area of 682469 square miles which was divided into
three parts Kenya Uganda and Tanganyika They all became indeshy
pendent by 1963
The communities continued economic ties among each other
and on June 6 1967 at Kampala the three member nations signed
a treaty which was to re-establish the community
East Africa enjoys a great deal of economic advantages
l It borders the Indian Ocean which provides a cheap means of
exporting and ImportlDg goods 2 It Is a meeting point for trade
(east and central African trades)
East Africa Is divided Into five geographic regions (which
provide a variety of climates)
1 coast region
2 Nylka region or Savanah region
87
3 East and West Highlands
4 Lake Victoria region
Due to the Influehce of the cultural traditions the subshy
slstance element in East African economics is still dominant This
is evident in most of the rural areas The public sector of East
African community plays a very great part In developing the economy
The public sector Is expected to be major employers In the community
and Is expected to provide free public services--free school free
medical services free or subsidized public utilities and housing
On an average scale the population of East Africa is yet
low A clear study shows this Is not true In some locations which
are densely populated varying from two hundred to five hundred
people per s~ure mile The population In urban cities of East
Africa Is still low and the people do not consider cities to be
their home Details show that the major East African cities have
over 50 percent of all the urban population while the minor cities
are far less than 50 percent of the total urban population
Standardization of East African people Is too difficult
due to the fact that the population Is composed of a variety of
sub-races whose traditions differ from each other among the tribes
The sub-races classified are
1 Nilotes
2 Nilo-Hamltes
3 Inter-cush Ite
4 Bantus
Based upon the sub-races of East African people the traditional
heritage carried frnom one generation to the other makes the economy
88
of the community hard to work In Perhaps even more important on
the economic outlook is the Inheritance of continuing extended
family contrasts In age and sex
The study shows that trading Is an extremely important
economic activity even though it Is not Itself productive The
trade Itudy has shown that trade has been playing a smaller part
in East Africa and for those operating Its economic efficiency is
very low The greatest part of trading activities is located in
the major East African cities This conclusion has led to the fact
that the majority of the people are living In rural areas where
means of traveling to cities are difficult for them and the lack
of money has probably created the situation where people have to
live subsistently
CONCLUSIONS
The conclusions of the survey of literature and the analysis
of findings follow
Survey of Literature
If It Is correct as suggested by Kamark that the economic
lives of rural Africans are not Influenced by environmental conshy
dltlons more than by cultural disposition then this would mean
that the Introduction for new technology should bring about economic
changes relatively unhIndered by cultural conservatlsm1 That
Is to say the potentIalIties of natural resources can be more
IKamark M Andrews The Economics of African Development (New York Praeger Incorporated 1967) p 79
89
effectively tapped by the Introduction of new methods and undershy
standing and new forms of organization of production It may be
objected that this In fact has not occurred In East Africa and
precisely some would say because of limitations of cultural
conservatlsm 11 But closer studies quite strongly suggest that
where people can see the advantages to themselves of economic changes
2that are both feasible and safe then the changes do occur Thus
African people have accepted changes first and most radically (indeed
they have often deliberately sought them) In the more favorable
areas where the possibilities of new technology and new Ideas are
more readily applicable and where people are exposed to external
influences and have access to modern communicatIons and living styles
The type of national economic progress which is to emerge
the longer-term political goals the roots of nationhood In the
multiplicity of subcultures and naturally uneconomical tribal ties
out of which national culture is forged remain the crucial unanswered
questIons whIch affect the economic progress of East Africa
Analysis of Findings
The results of the analysis has shown that the elite of
East Africa have advanced to a more desIrable socloeconomlc way
of thinkIng ThIs conclusion has led the author to suggest that
perhaps the integrating forms of tribes can be worked out beginning
with the East African elite for however much too depends ultimately
on local and tribal support they have more chance to see above
2 Ibid p 98
90
the disadvantages of these functions The middle class is still
small flexible mobile and unstable not yet clearly or acceptably
dlfferentl~ted from strata above or below The mass of unskilled
workers are the most temporary and the least Involved If no efforts
or attempts are applied the society will inevitably continue to
live In their life of ethnically based networks and subcultural
pockets
16
AHdflJ )O 118 18
BIBLIOGRAPHY
Abraham R G East African Townshipl in A W Southhall (eds) Social Change In Modern Africa New York Oxford University Press 1970
Baver P T and B S Ymey The Economics of Under-developed Countries C U P Cambridge University Press 1957
Blacker E A Demography New York Oxford University Press 1948
Ethographic Survey of Africa East Central Africa London International African Institute 1970
Boesch H A Geography of World Economy Van Nostrand Princeton University Press 1964
Brown L H in E W Russell (ed) The Resources of East Africa Nairobi Literative Bureau 1968
Burke G Fred Africanls Quest for Order Englewood Cliffs New Jersey~ Prentice Hall 1964
The Economics of Underdeveloped Countries New York OxfOrd University Press 1972
Cley and P Robson IFederation of East Afrlca11 Structure and Administration of E A C S O New York Oxford University Press 1964
Doob W Leonard Periodic Surveys in Subsaharan Africa Nairobi Nairobi Publishing House 1970
East African Community Annual Report Nairobi Kenya Government Press 1966
Economic and Statistical Review Nairobi The East African Statlsshytlcal Department 1964 _
Encyclopedia Americana East Africa Vol 4 1974
Encyclopedia Brltanlca East African Community University of Chicago Macropedla Vol I II 1974
Goldthrope J E and F B Wilson Tribal Maps of East Africa and Zanzibar Kampala East African institute of Social Research 1966
92
93
Good M Cha~les Jr Dimensions of East African Cultures New York Oxford University Press 1970
Gulliver P H Labor Migration in a Rural Economy Kampala E A I S R 1955
Harlow V and E M Chi lver History of East Africa Vol II Oxford Clerendon 1962
Hawks D A IIEast Afrlca1I Trade and Industry Official Journal of Association of East African Industries Nairobi Nairobi Publishing House 1963
Hopkins Elizabeth IIConflict of Tribal and Racial Conflict in Stanley and Burke (eds) Transformation of East Africa New York Basic Books Printers 1966
Industrialization in East Africa 5th Edition Nairobi United Africa Press 1966
Jamal A H The Critical Phase of Emerged African States Afalrasl East African Publishing House 1965
Johnson B F The Staple Food Economics of Tropical Africa Stanford California Stanford University Press 1970
Johnson D H Rainfall in East Africa Q F R Vol 5 Nairobi East African Publishing House 1968
Jones Carey Geographical Journal Vol 131 Part 2 New York Oxford University Press 1965
Kamark M Andrew liThe East African Community The Economics of East African Development New York Praegam Incorporated 1971
Kenya Chamber of Commerce Trade Nairobi Kenya Government Press 1973 --~
Lewis William Allen The Theory of East African Literature Nairobi Bureau Annual Report 1965-6
Morgan W T W IIEast Africa Its People and Resources II People New York Oxford University Press 1969
Morgan W T W and N M Shaffer Distribution and Density New York Oxford University Press 1970
Myrdel Uninnar An International Economy Problem and Prospects New York Harper 1969
OConner A N An Economic Geography of East Africa New York Preager 1966
94
Oxford Economic Atlas East African Community New York Oxford University Press 1972
Reed Moyer and Hullanderc Stanley Markets In Developing Economies Illinois R D Irwin 1968
Republ ic of Kenya Newsletter Washington D C 1975 Vol 3 No5
Richard A I Economic Development and Tribal Change Nairobi East African Publishing House 1969
Rosberg A and A Segal East African Federation Internatlonal Conciliation 1963
Samson H W The Climate of East Africa Nairobi Memoirs Vol II I No2
Schneider in W R Bascom and M J Herskovits Continuity and Change in East African Cultures Chioago University of Chicago Press 1959
Seggerson E P Physiography of East Africa Nairobi Press 1962
Southhall A W Growth of Urban SocletyI Dar-esmiddotSalaam New York Oxford University Press 1969
The East African East African Common Services Report Nairobi Kenya Government Press 1966
Thompson B W The Climate of Africa Nairobi Oxford University Press 1965
UNESCO Populatlon Movements in East Afrlca in K M Barbour and R M Prethere (eds) Essay on African Population Routledge and Kegan New York Oxford University Press 1961
Walder D Problems of Economic Development of East Africa In E A G Robinson (ed) Economic Development of South Sahara London McMillan 1964
Warren J Keezan International Marketing Less Developed Countries Englewood Cliffs New Jersey Prentice Hall Incorporated 1974
Wilson A M Social Change In Modern Africa New York University of Oxford Press 1961
Wilson M Gordon liThe Transformation of East Africa Basic Scale for Periodic Research New York Basic Books Printer 1971
S6
XION3ddf
bull
96
URSAN CENTERS
- bullbullbullo1
IL RUdDIf---J -
( L KENYA I
I I I
hlo10bull I I J
- Tllo
Tflgflylfl
-Dodo TAN3ANYllltA
It
bull Imp ~1 bull
JII
~ ~t - bullKlIer
~ ~ JIOlJLAIO
~ ~~ ~ (0 C~CV ~oo Lindl ~ a CO (1(( 00(tOO
c ~tCC a oocmiddot ~~ L Ny ~tWllra1 c ~~(V( 0 ~J(JC~ ~ l(l~5 7~ ~~~~ i~j~) ~J r =X 0 1 ~O _-A- J 0 100 bull - -
mil bull~~ ~__-- _ llo
l6
bull
o
MII bullbullbullbullbullbull bullbullbullbullbullbulll1li bull bull ~ =
middot1
bullbullbull bullbull~ pound
-w
)
umiddot~middot middotmiddotMI
c
gt amp c o
ImiddotUmiddotmiddot middotmiddot0 L
1 bull l
)
L
~
middotmiddotmiddotmiddot1 L
~
~
1 ~
~ ~ I ~ L ~
i 1 middotmiddotmiddotrmiddotmiddotI bull bull ~
I r j L
-r Y
I~ bull CL -J II w 1
VINVZNVl
eII_
fbullbull bull~1
~ r
z
c
o
11Ie
) 11111_0 -shy
N a n s
~______
middot~middot(1 -bullbull
__rr~)
I
I
I I I
~ I ~
I I I ~ I
vaNv~n
66
o
1 IIit
c
Cl
S iII III J
Ibullbullbull middot1t-11 1 114bullc ~~1
bull
001
INZN1L
10 l
r
01 bull 1middot ) l pltllI1 -tpn I I c
o
z
o
bull
J I
lt
- Njoroge 1975
- Njoroge 1975 pt2
-

4
DEFINITIONS OF TERMS USED
Arusha
The capital city of East African Community (1967 Declarashy
tlon)5
Dar-es-Salaam
Capital and largest city in Tanzania It is also one of
6the chief port cities of East Africa
Duka
Small shops normally operated by a single family7
E A C or Eo A
Abbreviation for East African Community Is an economic
organizaticn consisting of three member countries of Kenya Uganda
and Tanzania (associate members include Zambia Ethiopia Somal ia
and Burundi) The existing community is based on a treaty signed
in Kampala on June 6 1967 to preserve and re-establish a large
part of the corporative relationship that was disappearing 8
5A W Southhall Growth of Urban Society Dar-es-Salaam (New York Oxford University Press 1969) p 483
6 Ibid p 481
7J bull Keezan Warren International Marketing Channels Less Develo ed Countries (Englewood Cliffs New Jersey Prentice Hall Incorporated 197 p 309
8Andr~w M Kamark liThe East African Community The Ecoshynomics of African Development (New York Praegam Incorporated 1971) p 5C
5
Gazetted Township
Go~ernment official papers classifying towns population
by residenc~9
Great Rift Valley
Geologically this structure is called a Ilgra ben 1I This
valley exte~ds as a series of depressions from Syria through the
Dead Sea (the surface is nearly 1300 feet below sea-level) to
Africa In East Africa It divides into two branches western
and eastern Igneous activities and volcanoes are associated with
the rift valley forming such peaks as Kllimanjaro these are now 10
dead
Kampala
Th~ capital and the largest city in Uganda It was made
the capital In 1962 when Uganda previously a British protectorate
bull d d IIbecame an In epen ent nation
Municipalities Grade A amp B Townships
Gr~de A -- Municipal towns these towns have populations
above sixty thousand
Grade B -- Townships under local government authorities
12Normally these towns have populations below sixty thousand
9Rbull ~ Abraham IIEast African Townshipl In A W Southhall (ed ) Social Chane in Modern Africa (New York Oxford University Press 197D) p 33
lOE P Seggerson Physiography of East Africa (Nairobi Na I rob I Pless 1962) p 10
Ilsouthhall op cit p 477 12Abraham loc cit
bull 6
Nairobi
The capital and the largest city In Kenya with a population
13nearing one million people according to the 1971 population census
Non-African
A resident who is an Immigrant from other continents besides
Africa The majority of Non-Africans are Europeans and Asians
(Indians)14
Pound
East African sterling currency (Pound~) 1 ~ bull shs 20
Equivalent to $28 u S currency 1975 15
Settlers
European immigrants farmers to the East Afrlca 16
Shillings
East ~frican sterling currency (shs) shs 20 z l~ 17
13Southhall op cit p 469
14Abraham loc cit Non-Africans comprise people (male or female) of European or American origin Arabs Indians and Far East Asians
15K~nya Newsletter issued by Section of Embassy Republic of Kenya Jashington D C Vol 3 No5 (1975) p 28
16Ellzabeth Hopkins IRacial Minorities in British East Africa in Stanley and Burke (eds) Transformation of East Africa (New York Basic Books Printers 1966) p 87
17Kenya Newsletter loco cit
7
Swahili
A language of the coastal population of East Africa roughly
from Southern Somalia to Mozanlbique and including Zanzibar and
the Comoro Islands It Is spoken by about 15 million people as
a first langu~ge this includes the people In East Africa and
Congo (Klns~asa)18
METHODS OF PROCEDURE
All the published materials listed below were extensively
reviewed Thl~ included library review of both periodicals and
relevant st~dies The writing of this report is thus based on
the Information provided by the following
1 Periodicals books pamphlets and microfilm from the
William Allen White Library of the Emporia Kansas State College
2 Xeroxed materials and books that were secured through
the inter-library loan and from friends
3 uata collected specifically for use In this study by
the Marco Survey Ltd Nairobi Kenya
4 Periodicals Issued by the information section of the
Embassy of the Republic of Kenya Washington D C
PLAN OF STUDY
In the preceding section the purpose of this study Its
importance the limitations assumptions definitions of terms
18Encyclopedia Americana Swahili Vol 26 (1974) p 85
8
and methods of procedure have been outlined Related literature
largely stu~ies of structure with regard to economic development
in East Africa is presented in Chapter 2 Chapter 3 presents a
background of pertinent economic facts concerning East Africa
Chapter 4 deals with an analysis of factors In Chapter 5 the
data is summarized and conclusions are drawn
Chapter 2
THE REVIEW OF RELATED LITERATURE
British East Africa was the name applied to the territories
In East Africa before they achieved Independence The territories
Included the ~olonles and the protectorate of Kenya the United
NatIons trust territory of Tanganyika and Uganda These territories
had a total area of 682469 square mlles l British East Africa was
economicalya system of joint services The East Africa High
Commission which consisted of the Governors of Kenya Tanganyika
and Uganda was responsible for the administration of public services
and functions common to territories including currency roads
customs apd communications Each territory1s government retained
responsibility for local services such as health education and
police 2
After World War I I nationalist feeling was strong throughout
British East Africa As the deadline for Independence approached
Britain attempted to form a federation of East Africa but separate
nationalist aspirations made this Imposslble 3 Tanganyika was the
IEncyclopedla Americana East Africa Vol 4 (1974) p 578
2East Africa Geographical Journal Vol 129 Part 2 1963 pp 140-155
3Abull Ro~berg and A Segal East African Federation IIlntershynational Concll iatlon11 1963 p 30
9
10
4first of the four territories to achieve Independence In 1961
Uganda became independent In- 1962 The following year Kenya and
Zanzibar entered the ranks of Independent states Tanganyika and
Zanzibar merged In 1964 and adopted the name United Republic of
Tanzania 5
After Tanganyika became Independent the East African
High Commission was suceeded by the East African Common Services
Organizatior which performed the same functions as its predecessors 6
Finally the East African Common Services became the East AfrIcan
Community The East African Community was formed to establish a
customs union to facilitate the industrial development of the
area and to carryon research activities and common services preshy
vlously controlled by the East African Common Services organization
The community was re-establlshed by a treaty signed by three member
nations In Kampala Uganda on June 6 1967 7
The community provides for free intercommunity trade and
a system of c~nmon external tariffs there Is also a system of
transfer tnxes that may be Imposed on certain commodities Imported
from other members by a country with a trade deficit wIthIn the
other two members Transportation and communications services
are handled by community corporations for raIlways harbors post
4 Ibid p 8 5 IbId p 12 bull
6Encyclopedia Britanlca East African Community University o~ Chicago Macropedia Vol I I I (1974) p 754
7The East African East African Common Services Report (Nairobi Kenya Government Press 1966) p 3
I I
and telecommunications and alrways8 The East African Development
Bank established in 1967 provides and emphasizes projects that
tend to make the three economies complementary9 Although all
three countries contribute on an equal basis to the bank Kenya
the most advanced receives a smaller share of Investments and
guarantees In accordance with the policy of even development among
the states
East Africa is also the meeting point for all the continents
major linguistic groups Even Click Language l is represented in
Central Tanzania
EAST AFRICAN GEOGRAPHY
Regional Survey
East Africa borders the Indian Ocean for about eight hundred
miles and the coastlands form a very distinctive zone although
the plain Is only one hundred miles wide around the Kenya and
Tanzania border IO Winds from the ocean bring a high ralnfal I
to most of the land close to the coast This fertile land Is quite
densely populated The rainfall drops quite rapidly Inland and
land quickly becomes arid and sparcely populated As one travels
from the Iterior towards the coast the change from scared bush
to forest is evident
8 Ibid p 9
9East African Community Annual Report (Nairobi Kenya Government Press 1969) p 38
IOCharles H Gpod Jr Dimensions of East African Cultures (New York Oxford University Press 1970) p 8B
12
Some of the special characteristics of the coastland stem
from the fact that many people have approached them from the sea
and have ~ot penetrated far inland Although most of the population
is African there is a substantial Arab settlement in sharp contrast
to the rest of East Africa Mombasa Is an old town (see map of
East African cities on page 96) Dar-es-Salaam and Tanga are not
These three cities are distinctive In that through them passes
most of the foreign trade of East Afrlca ll This tends to quicken
the pace of economic activities there although In the whole zone
the high temperature (high humidity) resulting from the low altitude
tends to slow It down
The coastal zone Includes the islands of Zanzibar and
Pamba and Mafia together They constituted a separate state for
middotover one hundred years until they joined with Tanganyika to form
anew state of Tanzania in 1964 12
The Nyika Plateau
Away from the coast the land rises fairly gently to flat
plateaus covering between 3500 to 5000 feet above sea level
known In some areas as Nyika (Swahili for wilderness) This is
an area of short rainfall poor scrub vegetation and very sparce
13population separating richer lands In the Interior from the sea
llA M Wilson Social Change In Hodern Africa (New York Oxford University Press 1961) p 35
12Carey Jones Geographical Journal Vol 131 Part 2 (New York Oxford University Press 1965) p 186
lnE P Seggerson Physiography of East Africa (Nairobi East Africa Publishing House 1962) p 10
13
It is broken by mountain ranges notably Usambara and Pare mountains
Taita h1115 where relief brings about a higher rainfall and where
more people have settled Further south it is broken by a zone
of lowland in the basins of the Ruaha and Rufingi rivers where
settlement Is discouraged by periodic floods and disease rather
than by low r3infall Water scarce in East Africa is abundant
there and cen be controlled This area offers promise for future
agricultural development In the south of Tanzania the plateau
reappears but the rainfall exceeds thirty inches in most years
and much of the land is under cultlvatlon 14 The rainfall Is
unreliable soil is poor and the area is remote from central
economic life in Tanzania 15
Th~ highland south of the Nylka has recent volcanic rocks
It stands up as highlands reaching to 19500 feet including
KilimanJaro Mt Kenya and Elgon (see map on page 14) From the
land over seven thousand feet above sea level it extends three
hundred miles westward almost to the shore of Lake Victoria Although
It Is brokpfl by the lINorth Rift Valleyll (not shown in the map)
the floor of which in places lies six thousand feet below the land
to either side 16 In this highland heavy rainfall and fertile
volcanic soils provide excellent conditions for agriculture Much
14gt H Johnson Rainfall in East Africa Q F R Vol 5 88 (Nairobi East Africa Publishing House 1962) pp 1-9
IS ibid p 10
16Seggerson Ope cit p 10
ofx-----_ - -~~ -----------~
QOO 000 ~I)
-==----=-----shy
~ )00 -OOOt
Wi~Z1 ~ OOOt -0001
u
o
z
o
15
of the land Is under cultivation but the fruit of this agricultural
production is offset by the dense population 17
Lake Victoria Basin
The land falls slightly northward from the central plateau
of Tanzania towards the Lake Victoria Basin and the densIty of
the population is increased greatly The Basin is one of the
richest zores of East Africa supporting over a quarter of the
population of the regIon The country receives more rain and
has more fertile soil than that to the south and advantage has
been taken of its agricultural opportunities The land around
the lake in some ways forms a single unIt although it is divided
among the thr~estates This region Is densely settled by farmers
who produce much cotton as well as animal food crops also bananas
(Uganda) a~d coffee providing a green landscape all year around 18
THE ECONOMY
Subsistence Economy
In terms of the actIvity of an average East African man
or woman the subsistence element in East African economies is
probably still domlnent 19 That is to say the amount of time
the average East African spends on activities that merely keep
17w T W Morgan and N M Shaffer Distribution and Density (New York Oxford University Press 1966) p 36
18 Ibld p 38
19~ F Johnson The Sta Ie Food Economics of Tro ical Africa (Stanford Californ a Stan ord UnIversity Press 1970 p 142
16
him alive ana functioning is greater than the amount of time he
spends ear~ing discretionary income The average East African
is more in than out of the subsistence tribal economy20 He produces
most of the goods and services he consumes
The permeation of the money economy throughout Africa not
only has considerable importance in Its own right but will influence
the whole pace of economic development In the future It is almost
impossible for anyone who has not lived in a subsistence economy
to appreciate how profoundly it affects ones activities and outshy
look To live in a subsistence economy means to live a hand-toshy
mouth existence in a world of great risk and uncertainty Without
the techniques or facilities for storage of food over any appreciable
period the East African is dependent on the yearly crop or his
luck In hunting or fishing Nearly every people have a hungry
season ll when the 1ast season I s crop has been eaten and the new
crop has not yet come In The risk and uncertainty affecting a
whole community is less with the spread of the money economy
because It is possible for individuals both to create a margin of
security for themselves by setting aside a permanent store of value
In the form of money and to survive apart from the communlty21
The Public Sector
From a comparatively late point In the development of East
Africa the government role in the economy was a major one The
private investments and the stimulation of production was encouraged
20 Ibid p 151 21 Ibid p 147
17
by the gov~rnment The corollary of this Is the continuing imporshy
tance of the government as employer and of the publicly owned
sector generally in the national accounts
In East Afri ca Ilcurrent government expend i tures run over
15 percent of the gross national expenditure 1I22 If one adds the
operations of the railway electricity authorities ports etc
and the investments in the whole part public sector the total
approaches Hone-third of the gross domestic product-II Together
they are therefore the dominant economic influence in the money
economy of East Africa 23 Many East Africans expect the state
or public agency to be their employer This has the effect of
reinforcing o~e of the worst heritages of colonialism--the East
Africans arceptance of the idea that the best job to have is a
government post
Excessive Expectations for Public Service
The paternalistic attitude of colonial administration
particularly after World War II also left behind the habit of
expecting co~siderable benefit from free public services--free
schools iree medical services free or subsidized electricity
and subsidized housing 24
22Enclc loped ia Amer icana East Afr ica Vol 4 (1974) p 576
23 Ioid p 577
24Abull H Jamal The Critical Phase of Emerged African States (Afairasi East African Publishing House 1965) p 101
18
The colonial government provided most of this for East
Africa1s cities--usually at the expense of the lIagr icultural popushy
lation I But with the growth of the cities and the legitimate
pol itical de~and for the expansion and extension of these services
throughout the land it becomes financially impossible to maintain
them on the uneconomic basis of the past It is also economic
nonsense to consume resources In subsidies rather than use them
for economic development 25
Thr~ughout the world pressure for such services Is present
The way it is kept in line with what Is economically feasible Is
either to charge the economic price or to hand over responsibility
for the services to the local government concerned in which case
the citizens can make a choice between paying higher taxes or using
26the money for other purposes But with the usual East African
centralization of responsibility for these services in the national
government this economic calculus does not occur so Immediately
and directly Pressure for the services thus tends to lead the
East African governments constantly to Increase their expenditures
for them and to give lower priority to other investments that might
In fact re~ult In faster growth of the national income 27
25Ibid bullbull p 129
26 1bid p 159
~~ 71bid p 179
19
POPULATION DISTRIBUTION
Accorciing to the mid-year population estimates for 1968
the population of East Africa was 268 mllllon 28 Based on the
total land area of 642252 square miles mean populatIon density
of forty-two persons per square mile is obtained When compared
with the m~jor countries of Europe and Asia the mean population
of East Africa is very low According to the 1961 census India
had a total population of 438 million on an area of 126 mil lion
square miles with a mean population density of 319 persons per
square mile 29
Table
Mean Population Estimates Per Space Land (1968)
Estimated Total Land Area Population Mean Population
(Square Mi les) 1968 Per Square Mile
Kenya 219789 9104000 41
Tanzania 342171 10325000 30
Uganda 80292 7367000 92
Regional Population
The population of East Africa may be broadly divided into
three main categories first those around the shores of Lake
2EOxford Economic Atlas East African Community (New York Oxford University Press 1972) pp 174216 and 221
29lbid
20
Victoria ~econd those In the highlands country and In the footshy
hills of the major mountains third those in the coastal belt 30
Lake Victoria Is ringed on almost all sides by areas of
dense population In Tanganyika the lake and west regions which
surround the southern half of the lake comprised in 1967 a popushy
lation of some two and a quarter million over a quarter of the
total popuialon of Tanganyika although the land area formed only
one-eleventh of the countrys total On the north-western and
northern side of the lake the Masaka Mengo and BU50ga districts
of Uganda contained in 196B two and one-half million people
Finally on the north-eastern side Luo country in the Nyanza Province
of Kenya likewise showed In 1968 comparable densities of over two
hundred persons per square mile 31
In the group of the mountain areas we must include the
thickly populated districts of Central Province of Kenya where
the Kikuyu Embu Meru land units cluster In some districts popushy
lation densities range to two hundred to five hundred persons per
square mlleo North Nyanza and around the slopes of Mount Elgon
have densl~ies varying from three hundred to five hundred per square
mile whil~ on the western side of the mountains Uganda districts
have similar densities of between two hundred to three hundred
persons per square mile In Tanzania the category of thickly
populated mountainous regions includes the southern slopes of
30w T W Morgan and N M Shaffer op cit p 29
31Ibid p 27
21
Kilimanjaro ard Mount Meru and Livingstone Mountain in Southern
Highlands 32
The coastal belt consisting of a strip of low lying country
constitutes o~r third region of highly populated density This
area has beell subject to substantial immigration The population
was attracted not only to coastal cities but also by the large
sisal and sugar industrial plants oil refinery and shipping labor
which have drawn immigrant labor from all parts of East Africa 33
Urban Population
Precise international comparisons tend to be vitalized
by the fact that the destination of urban population varied from
country to country and from census to census It Is also true
that urbanization of the population of East Africa is extremely
low
In the Tanzania census of 1968 thirty-three Igazetted
townships were defined which comprises an aggregate population
of 664072 persons of all races or 51 percent of the total popushy
lation of the country34 Of this population over a third were
In Dar-es-Salaam (228742) and Tanga (138053)
In Uganda the census of 1968 contained as gazetted townshy
shlps those which comprised an aggregate population of 409075
32Seggerson Ope cit p 138
33lbid p 139
34Rbull G Abraham East African Townshlp In A W Southhall (ed ) Social Change in Modern Africa (New York Oxford University Press 1970) p 300
22
persons of all races or 2 percent of the population of the country35
Of these over one-third consisted of the populations of Kampala
and Jinja For the purpose of the Kenya population census urban
areas were divided into four categories municipalities grade
A townships grade B townships and trading centers 36 Not all
trading centers were defined as separate census areas and when
the results of the census were obtained it was found that several
of the grade B and even some of the grade A II had such small
populations that they could scarcely be regarded as towns in the
normally accepted meaning of the word The author therefore
defined urban areas as towns with a total of over two thousand
people There are approximately thirty-four towns of over two
hundred population
PEOPLE
It is difficult in the tradition of great social and cultural
diversity to distinguish East Africa by tribe but it Is very
difficult to give definitions of units that will accommodate the
wide range of factors Clearly tribe has reference to a distincshy
tlve group of people that possess the heritage of a common culture
lithe total of their forms of social organization historical trashy
ditions la~ and customs value and beliefs 1I37
35Ibid p 310 36 Ibid p 312
37w T W Morgan East Africa Its People and Resources People (New York Oxford University Press 1969) p 34
23
ThuD it is necessary to be somewhat arbitrary in disshy
tinguishing the various people of East Africa The term tribes
has the same sort of imprecise usefulness difficult to define
specifically as the term c lass in western industrial ized
countries 38 The late Dr Leaky (archeologist and sociologist)
classifies East African people into three distinctive parts
They are broadly classified on III inguistic and traditional basis ll
I into Nllotes Nilo-hlmites and Bantus 39 Such distinctions are
i 1 1 Table 2 1I The 0 1st r ibut ion of the Af r ican and the IINon-Af r ican ll
I in proportion by Cities4 1968 0
I 1 1
Country African INon-Afr Ican ll
Tanzania 4 1 721
Uganda 30 850
Kenya 53 850
very adequa~e to the actlvltes and interests which are of concern
to the people themselves in their ordinary lives For example
the Luo (nilotic) with their communal living society and with a
mixed economy of agriculture do not resemble the Masai (nlloshy
hlmltes) with their pastoral economy who are non-farmers they
~ 38 10 id p 36 39Ibid p 38
4UR G Abraham op cit p 318 IINon-African ll comprises people (male or female) of European or American origin Arabs Indians and Far East Asians
24
do not eat sea food The Bantus In East Africa (found mainly on
the southern hemispheres of Africa) have an exceptionally wide
range of cultures and economic systems 41
The Tribal Iassification
The term East African people identifies about 11110 different
people in the mainland Tanzania about 35 in Kenya and about 37
In Uganda42 Of these five comprise over a million people each
forty-threp exceed one hundred thousand people The smallest
tribes contdln only a few hundred people but their culture intershy
mediate zo~es are generally between one and another 43 Blackers
book of East African lIdemography provides an adequate overall
account of the traditional culture and social system of perhaps
thirty of these tribes 44
A number of larger and Important tribes remain still
undescribed by modern standard needs Published studies of social
and economic changes In recent decades are fewer even for those
people such as Kikuyu and Chagga where change has been most
radical Most books dealing with the traditional cuiture of East
African people were written many years ago and are not reliable
41Morgan Ope cit p 40 42 1bid p 36
43E A Blacker lIDemographyl1 (New York Oxford University Press 1948) p 43 The best general surveys of available Inforshymation are contained In the volume of the lIEthographic Survey of Africa (East Central Africa) 11 (London International African Institute 1970) p 70
441 bId p 79
25
guides for the study of people of East Africa in the second half
of the twentieth century
Historical Clusters
Although some tribes remain as little more than names on
the enthographlc map It Is possible to group the better known
people Into clusters which are identifiable In terms of common
historical traditions linguistic similarities and certain related
social Institutions and values As far as present knowledge goes
the following clusters are fairlyclear Only the larger tribes
are indlca~ed In the lists
Tribal names are given in their root forms
(a) Nilotes--Acholi Alur Lango Luo Padhola (b) Nilo-Hamites--(eastern Nilotes)
1 Teso Cluster--Karamojong Teso Turkana 2 Kalegln-Elgeyo Kipsiqis Nandi Tuqen 3 Masal Cluster--Arusha Masal Samburu 4 Tatoq Cluster--Barabalg
(c) Inter-custrlne Bantu--Ganda Ha Haya Klga Nkole Njoro Rundl Rwanda Soya Toro
(d) Elgon Bantu--Aisu Lugya (e) North Eastern Bantu--Chagga Embu Gusli (kissl)
Kamba Kikuyu Meru Mbere (f) Coast Bantu-Bondei Olgo Mljikenda Sambaa Zigua (g) Nyamwezi Cluster--Bena Hehe Sangu (h) Luguru Cluster--Kaguru Luguru Ngru4(I) Rouma Cluster--Makinde Makua Mawia 5
In no case are all the people of a cluster identical In
their econOOlic system In terms of their traditional economic
systems and the exploitation of the natural resources a more undershy
standable classification can be made In the following way
45 1bId p 15
26
A Primary Pastoral Economy with little or no agrlculture-shyBarabaig Boran Masal Redille Saburu Somalia Pastoral suk Turkana
B Mixed Pastoral and Agricultural Economy I Pastoral Ism predominant--Aogo Karamojong Klpsiqis
Kuna Nandi 2 Agriculturalism predomlnant--Arusha Bela Klssl
Ha Hehe Iraqw Iramba Kamba Lango Luqbata North Luhya Luo Njakjusa Padhola Rangl Hlgland Suk Sukuma Teso Tugen Turu
C Mainly Agricultural Economy with minor pastoral Interests--Acholl Alur Chagga Embu Alsu Kikuyu Nyoro Sambaa Toro
D Primary Agricultural Economy with little or no husshybandry--Digo Ganda Haya Klga K~gjO Makua Ngorl Ngindo Nyanwaz Soga Yao Zaramo Zlqua
There have been great basic changes that have occurred in
the last two decades toward a greater development of agricultural
Interest slight disappearance of tribal territories (traditions
of belief) due density Increasing demand for cash income and
greater att~nton to crop production husbandry by government and
47commercial concerns
AFRICAN HERITAGE
In general African cultural social background relevant
to economic development is very different from that of any other
developing region of the world Because of Africas geography
great size and climate It was after 1900 that the Influence of
the rest of the world began to reach most of Africa South of
Sahara 48
46 I bid p 2I bull 47Morgan Ope cit p 36
48~ K~ Schneider In W R Bascom and M J Herskovlts Continuity and Change In East African Cultures (Chicago University of Chicago Press 1959) pp 144-167
27
Perhaps there is a need to break the old African tradishy
tional heritage that Is passed to modern Africa A study of the
old African economy shows that it was one In which the methods of
production were simple and the units of production were small
The mlddle-nlen were both hated and Indlspensible Agricultural
progress was seriously impeded by the perpetuation of communal
right-over land 49 Chronic underemployment was one of Its basic
problems and despite moral exhortations among the people the
propensity to save was low It was an economy heavily dependent
on foreign sources for improved Industrial and agricultural methods
and to so~e extent for capital 50 The ambitious young men often
preferred careers In the professions and government service Men
here wrongly pinned their hopes on industrialization and economic
nationalism to absorb Its growing population Industrialization
was slow to come and the blessing of economic nationalism proved
to be mixed 51
The Extende~ Family
Perhaps even more Important than economic outlook both
positively and negatively Is the Inheritance of the continuing
strength of the tribal ties to which nearly all East Africans are
subject To begin with one must consider the L1neage Systems
49bld p 152
seA I Richard Economic Development and Tribal (Nairobi East African Publishing House 1969) p 78
Change
51lndustrlallzatlon In East Africa 5th Edition by United Africa Press Natrobl 1966 p 87
Published
28
or extended familyll--under which an individual has deep ties with
and feels obligation to a large number of people beyond the nuclear
family of the fathers mother and chlldren 52 Good fortune is
shared with m~ny others and In crisis one Individual can calion
help from many others
UnfCrtunately in terms of potential economic development
the extended family has many drawbacks It tends to discourage
Individual enterprise and Initiative as the burden of family
53obligations rise with the degree of an indlviduals success
There are other drawbacks Family crises tend to prevent
accumulation of capital or drain away the discretionary purchasing
power 54 The people with small incomes find it hard to comprehend
the greater cost of living of individuals with higher incomes
The age structure for the East African population is sigshy
nificant for as In most underdeveloped countries a large proshy
portion of the population is not of working age 55 Children of
fourteen years or under account for about 45 percent of the total
population which is comparable with the figure for Nigeria or
Brazil and in East Africa many children assist in picking cotton
or herding cattle Nevertheless productivity Is generally far
lower than that of adults and as increasing numbers of children
52UNESCO 11Popuiation Movements in East Africa in K M Barbour an~ R M Prethero (eds) Essay on African Population Routledge and Kegan (New York Oxford University Press 1961) p 96
53Ibid p 98 54( bid p 100
55L H Brown in E W Russell (ed) The Resources of East Africa (Nairobi Llterative Bureau 1968) p 102
29
attend school their contribution is decreasing although education
should enhan~p their income earning capacity in the future
Sh~rp contrasts in age and sex structure exist within East
Africa generally resulting from migration In NJombe and Songea
districts in Southern Tanzania about one-third of the adult men
are usually away Thus adult males make up a much smaller proshy
portion of the resident population than is normal The situation
is similar on~ thousand miles away in west Niles District of Uganda
The males of sixteen or over account for only 22 percent of the
population compared with the national average of 28 percent and
In the Kingezi District less than 20 percent were adult men according
to the 1969 census The absence of adult men Is even more marked
in parts of western Kenya for they comprise only 17 percent of
56the Kakamega District In the Kenya 1968 census
In Q1I these areas the high ratio of children to adults
tends to lo~er the level of economic activity This is not true
of the preponderance of women among the adults for they generally
do more work than men but the ratio of men to women may affect
57the economic activity in each area
Con~ersely an unusually high proportion of men of working
age means ~)re development 58 This is most evident in the cities
but also applies to larger areas such as Buganda or Tanga regions
Other factors must be favorable to attract people but the relatively
56Fred A Burke The Economics of Underdeveloped Countries (New York Oxford University Press 1972) pp 11-15
57 58Ibid p 29 Ibid p 30
30
high level of activity In areas such as Buganda is certainly related
to the age and sex and especially to the numerous Immigrant men
who either work as laborers or grow cash crops on their own account
there rather than In their home area
THE ECONOMIC ACTIVITIES OF EAST AFRICA
Trading Is an extremely Important economic activity even
though It Is not Itself productlve 59 By redistributing goods It
increases their value and It provides much employment in the process
Yet trading is sometimes omitted In studies In marketing geography
partly because of little data available on internal trade in East
Afrlca 60 However the main tradIng pattern of the regIon may be
outlined
Trade plays a smaller part In East African life than in
that of more highly developed regIons where peoples wants are
greater and where they satisfy few of their own requirements It
Is less Important even than in West Africa where It forms the
main Inter~st of an enormous number of people 61 Most East African
people produce theIr own food and cannot afford to buy many other
goods Nevertheless some goods are now sold In many parts of the
region and the proceeds are used to buy goods produced elsewhere
Commerce Is thought to contribute about 10 percent of all paid
59M Andrew Kamark The Economics of African Development (New York Praeger 1971) p 68
60 1bld p 98
61 Abull I Richard Economic Development and Tribal Change (Nairobi East African publishing House 1969) p 83
31
employment This commerce was mainly introduced since 1900 but
It has been superimposed on the traditional pattern of small-scale
trade which has not been entirely superceded
The Importance of trade In East African life has greatly
increased thrQugh the development of new forms of exchange which
Involve selling of goods for cash and buying goods produced far
away Ori31nally such trade consisted almost entirely of sales
for export overseas and the purchase of imported goods but today
an increased volume of sales Is to other parts of East Africa and
many of the commodities purchased have been produced within the
reglon 62
ThIs type of trade has provided the main basis for urban
development Both the large cities and the small towns of the
regions owe much of their present Importance to their trading
function even though many originated as administrative stations
within most rural areas the settlement pattern Is highly dispersed
and the clusters of bui ldlngs which are sometimes termed villages
usually consst mainly of IIdukas 163 Host of these small trading
centers grew up to handle the Import and export trade although
many now serve as markets for local trade
In review of a survey conducted by Keegan East Africa dukas
are very small carry one hundred items and occupy no more than
62Dbull A Hawks Official Journals East African Trade (Nairobi East Afric~ Publishing House 1963) p 10
63Warren J Keegan Multinational Marketing (New Jersey Prentice Hall Incorporated 1974) pp 308-9
32
fifty to seventy-five square feet 64 This indicates that the dukas
were operating on an average gross margin of approximately 12 percent
which is considered to be lower cost form of distributlon 65 The
East African duka Is highly Inefficient as a form of distribution
because the sales per person in the duka are much lower to keep
the duka developing significantly with the community economy
THE DISTRIBUTION OF TRADING ACTIVITY
Nairobi
The most important center of trade In East Africa Is Nairobi
A photograph of Nairobi Is provided on page 33 to give an example
of the modern cities of Africa Administration manufcaturlng and
commerce are three main functions of the city and are all comparable
In importace each employing more than fifty thousand people 66
The 1960 survey of distribution recorded one thousand wholesalers
In and out of a total for Kenya of three thousand It recorded two
thousand retail establishments compared with similar numbers In the
next nine towns of the country together 67 The value of all sales
by these ~airobi traders in 1960 was shs 400 billlon 68
T~e great Importance of Nairobi as a trading center Is
related to the fact that it performs trading functions at several
levels In some fields It serves the whole of East Africa and
64 Ib id p 308 65 Ibid p 309
66Mcrgan op cit p 70 67 Ibld p 72
6RKenya Chamber of Commerce Trade (Nairobi Kenya Governshyment Press 1973) p 5
34
in more ways it serves Kenya and Uganda and a small part of
Tanzania
In retail trade Nairobi serves a large area part of which
is relatively prosperous Its pre-eminence has probably hindered
the growth uf neighboring towns such as Limuru and Ruiru as shopping
centers Even Thlka thirty miles north of Nairobi Is more Important
in manufacturing than In trade 69 Much of the retail trade of
Nairobi however Is dependent on the large population and purchasing
power of the city itself Many people obtain their living by supplying
the needs of the administrations Industrial workers and even the
establishment of groups of up to thirty shops at various points
throughout-the higher class suburbs 70
The iMportance of Nairobi Is trade and Is related to Its
functions as the capital of Kenya and In some respects as administrashy
tive center for East Africa There Is a close relationship In which
its Importance In such fields as banking and Insurance are also
involved T~o other factors which favor Nairobi more than possible
rivals SLch as Mombasa are Its centrality in both Kenya and East
Africa and Its location on the eastern edge of the most prosperous
part of the region No town Is better placed to serve the whole
of Kenya or to serve all countries especially since means of comshy
munication have been on Nairobi The country south and west is
sparcely populated but In that to the north and east much purchasing
power Is concentrated There are substantial ve~y affluent European
69 Ibld p 6
70Ibld p 9
35
and African settlements which are of increasing significance as
71cash Income rl5es
Mombasa
Mombasa is not only the leading port In East Africa but
also a major center of trade The first function has led to the
second and the two together have enabled it to become the second
city of Kelya with a population of 380000 (1969 Census)72
Although many importing and exporting firms have headquarters in
Nairobi and their goods are consigned directly to or from the
port many others have offices in Mombasa and compete successfully
for the trade of a large part of East Africa Most traders in
Moshi for example and many in Kisumu or Kampala obtain supplies
through Mombasa importers The export marketing trade provides
much employment outside the port area far apart from private firms
concerned mainly with exports The Uganda Coffee and Lint Marketing
Board has large warehouses In Mombasa 73
Mombasa functions In retail and local wholesalers markets
but this activity Is small in relation to its size Its sphere
of Influence is inevitably reduced by its coastal location while
much of its immediate inner land is arid and sparcely populated
The ships calling at the port provide extra trade for they generally
71A M Wilson Social Change In Modern African Trade (New York Oxford University Press 1961) p 193
720xford Economic Atlas (New York Oxford University Press 1974) p lQ7
73Encyclopedia Americana East Africa Vol 4 (1974) p 579
36
take on some supplies and their crews and passengers often spend
some time clshore However this is of small Importance In comshy
parison with the export trade
Dar-es-Salaam
In some ways Dar-es-Salaam combines the functions of Nairobi
and Mombasa since it Is both the capital and the leading port of
74Tanzania Each of these roles encourages trade and the city
is much the most Important center of trade In the country On
the other hand It does not dominate the whole country as much
as Nairobi and Mombasa together dominate Kenya for both North
and South have only limited marketing connections with It Arusha
and Moshi have closer tradIng links with Kenya cities and with
the port of Tanga Bukoba has closer ties with Uganda and Kenya
and Mowara Region Is often linked physically with the capital only
by sea and It is therefore commercially Independent to some extent
Dar-es-Salaam also plays a smaller role than Nairobi and Mombasa
combined It Is comparable In size with the latter and Its inhabishy
tants are very much dependent on Its trading functions It is the
main center of import export and wholesale trade for the area
of 280000 square miles and a population of 19 million people 75
It Is also the center of small-scale wholesale and retail trade
for the coastal region while the purchasing power of the city populashy
tion is sufficient to support a wide range of specialized shops
74B F Joh~son The Sta Ie Food Economics of Tro leal Africa Tanzania (Stanford Stan or UnIversity Press 9 p 131
7Ibid p 26
37
Kampala
Kampala is smaller than the three cities mentioned above
but it is very clearly the commercial capital of Uganda Several
of the major importtng and exporting firms of East Africa have
branches there and merchants import goods directly from the port
of Mombasa Many of the businessmen are middlemen who buy from
Nairobi or Mombasa wholesalers and who often sell to other wholeshy
salers in sm~ller townsJ6 Kampala controls most of the trade of
Buganda and Western Uganda but less of that of the east and north
Thus whereas little is obtained their cement is consigned directly
from Toro to the northern towns Little is dispatched to towns in
77the west for these obtain their supplies through Kampala dealers
Although location and the communication pattern limit Kampalas role
as a distribution center for Uganda Kampala middlemen merchants
have extended their sales area in the west beyond the border of
Uganda to Bukoba and to Rwanda
Others
It is not practical to examine the trade of every town in
East Africa but some further features of the distribution of trade
might be noted
Most of the towns classified as others are majority adminisshy
trative centers and their marketing functions have developed from
this Although they differ considerably they are very similar in
76W T W Morgan East Africa Economic Characteristics (Nairobi ~ast Africa Publishing House 1960) p 279
77ibid p 280
38
appearance In addition to administrative functions these towns
provide services such as hospitals and they have generally become
centers of local communication The features tend to enhance their
roles In trade The size and importance of these trading centers
is generally related to the size population and propensity of the
areas they serve Most of these towns are newly created Their
populations range from between three thousand to six thousand and
they have rather less than one hundred shops most along a single
main street 78 All are retailers but many also sell goods to traders
from the countryside and buy some local agricultural products
Mo~t of the towns created are very young and they came into
existence due ~o the scarcity of land These towns are scattered
throughout East Africa and vary In both size and frequency with
the density of population and the local level of income
COMMUNICATION ACTIVITY
Transportation has become an Important economic activity
Official estimates place Its contribution to the Gross Domestic
Product of East Africa at ~45 million which accounts for 61 percent
of the total 79
Road Transportation
Road and rail transportation are probably roughly comshy
parable as sources of Income In East Africa although they differ
78~NESCO Opt cit p 96
790xford Economic Atlas (Oxford Oxford University Press 1966) pp 174216221
39
greatly in structure Road transportation is operated mainly on a
very small scale but there are so many small operators that the
number of people earning a living in road transportation Is very
large SO Motor vehicles came Into general use in the 1920s but
the greatest expansion of road transportation came thirty years
later Today there are many more vehicles per head of population
than in Nigeria or even Egypt approximately six persons per cad IISl
In Table 3 on page 40 road transportation shows that the majority
are private cars but the figure for vans lorries and busses undershy
states the volume of commercial road transportation Cars on many
East Africa roads are used legally or otherwise as taxis proshy
viding many people with good incomes This Is especially well shy
developed in Uganda and helps to explain the small number of busses
there Within each country road transportation activity Is heavily
concentrated In the most prosperous areas especially around the
capital Traffic counts show a far greater intensity on roads around
Nairobi M0mbasa Kampala Jlnja Dar-es-Salaam and Tanga than
elsewhere
The overall Importance and the pattern of road transportation
are both affected by the nature of the road network Road building
has been assisted by the character of the earth in many areas
simple earth murram road serving very well for light traffic
Although few roads are tarred the road network is ~uch better
than In countries such as Sudan and in much of East Africa is
SOlbid pp 147 174 193
81Ibid pp 147 174 183 193
40
Tab Ie 3
Transportation in East Africa (1963-73)82
Kenya Tanzania Uganda Totals
Thousand miles of roads of which bitumen surfaced
(thousands units 000)
Private Vehicles Commercial
Lorries Vans Busses
1963 Flgur~s Private Commercial
Ra 11-Track (In kilometers)
Rail-Vehicles (units 000)
Air-Craft (units 000)
Sea Transportation
nd -- No data available
522
22
1002 295 104 82 26
440 90
962 km
163
05
nd
409
22
726 304 11 I 74 22
220 80
3782 km
42
nd bull nd
39 I
07
619 208 64 70 17
180 60
1 160 km
72
04
nd
1322
5 I
2345 80 1
840 230
59 km
17
82 Ibid pp 174216221
41
adequate for the demand made upon it 83 Some areas without roads
notably in central and western Tanzania are found In other areas
many roads 3re Impassable In the wet season but themiddotdlstrlbutlon
of road transportation activity Is related mainly to factors other
than the roads themselves
Rail Transportation
In spite of competition from the roads railways of East
Africa still undertake most long-distance movement of bulk loads
All are operated by East African Railways Corporation on behalf
of the three governments The rail works employ more than eighty
thousand people
The entire railway system covers 5895 kilometers all
being meter gauge and virtually all single track 84 The East
African Railway Corporation Road Services Is operated mainly In
Uganda and Tanzania although a nucleus of road services between
Mombasa and Nairobi was established to provide express services
for certain commodities
The railway has been Increasing at a moderate rate over
the past few years Between 1965-1971 passenger number rose by
an average of 66 percent per year While the corresponding growth
85rate of freight was approximately 10 percent
83 lbld pp 147 174 193
84 IbId p 39
85Ibld pp 147 174 193
42
Sea Transportation
Sea transportation as an economic activity concerns East
Africa mainly through employment at the ports Sea transportation
administration is operated by the East African Harbors Corporation
on behalf of the East Africa community86 There are several sea
ports which serve Kenya Uganda Tanzania Rwanda and Eastern
Region of Zaire
Periodically these harbors suffer from severe congestion
with serio~s repercussions upon the economy of the entire East
African region The organizational changes within the East African
Cargo Handling Services responsible for handling of cargo as opposed
to the administration of the port makes handling operations slower
and more inefficient
Air Transportation
Air transportation is less than the other forms of transshy
portatlon for it can be used only by the most affluent passengers
and for the most valuable goods In each case the re-fuellng of
planes in transit provides a useful source of income Regular
internal services call at thirty-four places In East Africa of
which twenty-one are In Tanzania 87 The large size and peripheral
populatiofl pattern of that country make air transportation more
appropriate than in Kenya or Uganda Air transportation is unl ikely
to become a major economic activity In East Africa until Its cost
Is greatly reduced
86 Ibld bullbull pp 147 193 87 lbld bull
43
Communication Media
Communication media includes television radio receivers
telephones and dally newspapers These sources are growing at a
88rate of 10 percent per year The growth In urban areas Is higher
than In rurai areas No current data are avaIlable
Tab Ie 4
Communication Medla89 (Thousands) 1963
Kenya Uganda TanzanIa
Television 22 1 100 00
Rad 10 Reef Ivers 70 I 400 300
Telephones 6 1 6 1 32
Da II y Newspapers 190 123 83
SUMMARY
This review of literature was divided Into eight areas which
are pertinent to this study It was designed to provide background
Information related to
A East African Political Environment
1 Regional Survey
2 Nyika Plateau
3 Lake Victoria Basin
88Morgan East Africa Economic Characteristics p 36
890xford Economic Atlas Ope cit Table 1
44
B The Economy
1 Subsistence Economy
2 The Public Sector
3 Excessive Expectations for Public Service
C Population Distribution
1 Regional Population
2 Urban Population
D People
1 Tribal Classification
2 Historical Clusters
E African Heritage
1 The Extended Family
F Understanding the Economic Activities of East Africa
G The Distribution of Trading Activity
1 Na I rob I
2 Mombasa
3 Dar-es-Salaam
4 Kampala
H Communication Activity
1 Road Transportation
2 Rail Transportation
3 Sea Transportation
4 Air Transportation
5 Communication Media
Chapter 3
DESIGN OF THE STUDY
EAST AFRICAN ELITE
This survey was conducted and certain Information provided
to the argument of the study However difficulties of conducting
research 11 the formerly British-controlled territories of East Africa
are no different from those encountered elsewhere only more intense
because of lack of basic bench-mark data and basic socloeconomic
data Stratified probabil ity sampling in more advanced societies
can be designed in many ways Voters rolls rate-payers registers
and the like are usually up-to-date and easily available to the
researchers Such data do not exist in East Africa I Survey
research must be designed therefore on what data are available
There is little constructive value In the criticisms of the purist
that sampling techniques used in Africa do not fit acceptable
Western standards 2 It Is true that they do not but Leonard Doob
states that lithe scholarly or scientific gains to be derived from
ILeonard W Doob Periodic Surve s In Sub-Saharan Africa (Nairobi Nairobi Publishing House Hay 11 1970 p 3 bull
21~id p IS
45
46
valid results are so staggeringly inviting that the frustrations
of the moment Cre rendered almost Impotent- 1I3
Marco Surveys Ltd Nairobi Is the original data source
on its determination to publish Whomiddots Who in East Africa In 1974
Its part information Is the basis for this study
The survey by Marco Survey Ltd Nairobi had faced some
difficulties in deciding who was to be interviewed however It
took several months of careful planning Staff lists were prepared
by the four governments directories of commerce and industry and
membership 1ists of all available professional cultural and warshy
fare organizations and societies were examined Finally the
wage structures of the largest companies were checked and compared
to the wage paid by the four governments Every Interview was
planned and every respondent was presented There were direct
mall intervIews and each respondent signed the completed form
as correct after the interview
The criteria for selection to be interviewed were two The
first criterion was income The optimum cot-off point was an income
of ~I 000 per annum which is higher than the average European
or Asian income and Is also higher than the starting scales for
4university graduates The second criterion was the position held
by the respondent Women who have been Included are el ites In
their own right and not persons who are simply wives of elites
There are only sixty women in the total of 1423 Interviews about
3Eest Africa 1974 (Nairobi Marco Survey Ltd 1974)
4Doob Ope cit p 256
47
4 percent so sex was not used as a basts of tabulating the socloshy
economic data
This data Is presented on a comparative basis to Illustrate
by the basic =lassiflcation data the differences and similarities
of the African elite of the three countrles--Kenya Uganda and
Tanganyika Zanzibar has been Included and treated separately In
most of the tables
This study Is divided Into three parts The first Is an
analysis of the elite In East Africa based on the basic classificatory
data that w~s collected In the original research for Whos Who in
East Africu5 and additional studies which In addition to describing
the elite give Insight Into their opinions attitudes and beliefs
The second is a survey of urban elite opinions on basic social
and economl~ problems and technical assistance It Is based on a
stratified probability sample of those who most closely resemble
the elite in three African capital cities The third describes a
survey which Is beginning to provide research Into changing attitudes
and knowledge that will temporal orientation determlnlsm 11 The
sample will be described at the beginning of the second part for
each of these surveys and a few sample tables will be given to
Illustrate some of the results of this research
Approximately 6 percent of the Africans listed for Intershy
view refu~ed to be Interviewed There were numerous reasons given
for refusing but the chief factors were education and personal
reasons claiming that they were not Important enough to be included
5Marco Survey op cit p 19
Na I rob I
URBAN ELITE OPINION
Order (Englewood Cliffs chapter 4
A recent study poses the hypothesis that the role of the
Standard codes were used to clarify the data and cards
be said that the attitudes and opinions expressed In answer to
East Africa to test the attitudes and opinions of the city African
The interviews were conducted by permanent senior research
48
6Fred G Burke Africans Quest New Jersey Prentice Hall Incorporated
questions are those of the elite but they do represent the opinions
and education The respondent had to have had some secondary edushy
affairs and social problems The sample was stratified by age
the interviews were conducted or had many years of residence there
Inevitably some of those listed were not available for Interview
on certain questions Involving his personal life International
cation and had to be at least eighteen years of age It cannot
a stratified robability sample in each of the capital cities of
Five attempts were made In every case of this type before giving
city in Africa is that of generator communicator Innovator and
Intergrator 6 The research accepted this hypothesis and designed
were punched for 80-column ICT data-processing equipment in
up An estimated 10 percent of those listed were no t avai lable ll
assistants All of these have at least a Bachelor of Arts degree
for interview for one reason or another
or its equivalent and are either nationals of the country in which
49
and attitudes of a probability sample of urban African eighteen
and over who has had some secondary education and who lives in
one of the capital cities of East Africa Therefore the opinions
of this group will be closer to those of the elite than a sample
based on the population as a whole
The people interviewed were chosen in the following manner
Each city including peri-urban and dormitory areas was divided
into geographical units using a grid method on a base map Each
square of the grid was numbered except for those that were in
the business area--marshalling yards ocean and the like--and 10
percent of the squares were chosen by using a table of random numbers
The number of units of housing In each was then determined and
the quota was divided proportionately between each The interval
between units was determined and a starting point selected
The interviewers continued Interviewing to the set interval
until the quota was completed Three callbacks were made where
necessary for each respondent before declaring that interview
void The household was defined as that group which regularly
takes its meals together The head of the household was Intershy
viewed to determine how many In the household of either sex were
over eighteen and had had some secondary school education Those
were then listed and the person to be interviewed was selected
by a system of random numbers Only one person was Interviewed
In each household If the unit did not have at least one person
as defined by education the interviewer then proceeded to the
next household by the fixed interval Ten percent of the intershy
views were checked by field supervisors The Interviews were
50
conducted i~ English for the most part but some Swahili was used
in Dar-es-Salaam
The questionnaires were pretested in each of the capital
cities and the questions were modified where necessary The
translation of Swahili was made in the usual way of two separate
translators who worked from Engl ish to Swahil i and vlce versa
The interviews were conducted from September 15 to October
5 1974 The tables have been shortened for prInting convenience
by grouping items that have less than 5 percent response Into the
category 1I0thers 11 Percentages were rounded to the nearest whole
number or if the percentage was too small in a subsample whole
numbers were given in parentheses
OPINIONS AND ATTITUDES
The following is a description of a few of the questions
which were used in pretesting a series of eighteen questions in
three capital cities of East Afrlca to establish eight scales to
assess opinions and attitudes about temporal orientation governshy
ment confidence and optimism science and determinism conception
of people politics and tribalism or traditionalism It is Intended
that the scales when adequately tested revised and evaluated
can be used for per lodlc surveys at least fixed intervals over
1I7the next five years Such surveys will provide scales that can
be used to measure social change and that can be used to compare
7Gordon H Wilson liThe Transformation of East Africa Basic Scale for Periodic Research (New York Basic Books Printer 1971) p 456
51
data from the three capital cities and also to compare the basic
data between the elite of the urban areas and probability samples
from selected rural areas
The pretests were carried out in Nairobi Kampala and
Dar-es-Salaam Each was based on a probability sample of 150
people stratified by age eighteen and over and education The
respondent must have had some secondary education In fact the
sample for the pretests were chosen on the same basis as the survey
described In the third part A probabilIty sample of this type
Is unavoid~bly composed mostly of males young adults who are
relatively wealthy engaged In the more skilled occupations and
professIons representing the politically and socially Important
members of the community It closely resembles the elIte described
In the second part of this chapter The research selected only
a few questions to Illustrate the possible value of the results
It Is patently evident however that though these one-shotll
results are
bull merely interesting or suggestive they will become significant and really helpful when comparative data are obtained over a period of time so that trends knowledge and public ftplnlon can be detected and measured by established scales
8 b t d p 456
Chapter 4
ANALYSlS OF DATA
The age of the elite of East AfrIca shows some sIgnIfIcant
differences among the four countries Table 5 on page 53 is the
percentage distribution by age If we disregard the not stated
categories the average ages are as follows Kenya 31-45 years
Uganda 36-40 years Tanganyika 31-35 years Zanzibar 41-45 years
East Africa 36-40 years
Table 5 shows the average age of elIte to be higher In
Uganda and Zanzibar than In Kenya and Tanganyika Uganda has 17
percent of elite over fifty years and ZanzIbar 28 percent whIle
4 percent cf elIte are In this age group In Kenya and Tanganyika
Later the analysis will reveal that one-third of the Uganda elite
are Baganda thus the explanation of the older average age may
be that Baganda has had a strong traditional centralized governshy
ment for many years and therefore posItions of power of authority
have been open to the Baganda for a much longer period than for
other East Africans The same explanation can apply to the elite
of Zanz rbar
The process of Africanlzatlon can be seen In Table 6 on
page 54 There Is a smaller percentage of Africans in the civil
service In Kenya than In the other two countries but a higher pershy
centage of elected and appointed representatives due to the regional
52
53
Table 5
East African Elite Age Factor By Percent
Kenya Uganda Tanganyika Zanzibar Total
Up to 25 years 5 1 1 2 3
26-30 years 18 15 18 8 16
31-35 years 26 15 21 5 17
36-40 years 21 20 20 9 20
41-45 years 12 16 11 17 14
46-50 years 4 8 8 5 6
51-55 years 2 9 2 10 4
56-60 years 1 4 2 8 3
61-65 years 1 3 - 7 2
66 and over a 1 - 3
Not stated 10 8 17 26 14
Total 100 100 100 100 100
Base 457 409 444 113 1423
a -shy Less than 5 percent
54
Table 6
East African Elite Occupation Factor Sample by Percentage Distribution
Kenya Uganda Tanganyika Zanz Ibar Total
Civi 1 servant 27 42 51 46 40
Electedappointed 41 34 23 10 31
Commerceindustry 12 10 9 19 11
Trade union politician 13 5 4 6 8
Education 6 6 7 a 7
Professional 3 I I 7 2
Cooporatlvestrade I I 3
Religiouswarfare 2 4 6 - 4
Agriculture I 2 1 3
Miscellaneous 2 3 3 2 3
Total 108 108 108 108 108
Base 457 409 444 113 1423
a -- In a few cases the same person qualified in more than one classification
55
form of government Kenya also has a higher percentage of elite
who qualify as trade unionists
There are several ways of describing occupations Civil
servants for example can be in medical education or other
services Table 7 on page 56 gives occupations of the elite
in East Africa by a different set of criteria
The Education Factor
Tabl~ 8 on page 57 shows that in the categories University
and above East Africa rates 25 percent--with Kenya 25 percent
Uganda 24 percent Tanganyika i9 percent and Zanzibar 32 percent
The high number in the last country is accounted for in Table 7
IIEast African Elite Where Educated A higher percentage were
educated in the United Kingdom and IndiaPakistan (52 percent)
because of lack of local secondary schools Another factor is that
a well established social class structure was part of pre-independence
culture The upper class in Zanzibar and to some extent those
among the Baganda could afford overseas education whereas those
from other countries were dependent on financial help from governshy
ment sources
There was a higher percentage of elected or appointed represhy
sentatives In Kenya and this category was not so highly educated
as the Icivtl servant of a ll others categories It can be seen
that there are more electedappointed representatives than civil
servants or others in the lowest categories of education In the
highest educational brackets we have more civil servants in the
elite of all three countries than in the other two classifications
55
form of government Kenya also has a higher percentage of elite
who qualify as trade unionists
There are several ways of describing occupations Civil
servants for example can be in medical education or other
services Table 7 on page 56 gives occupations of the elite
In East Africa by a different set of criteria
The Education Factor
Tabl~ 8 on page 57 shows that In the categories University
and above East Africa rates 25 percent--wlth Kenya 25 percent
Uganda 24 percent Tanganyika 19 percent and Zanzibar 32 percent
The high number in the last country is accounted for in Table 7
IIEast African Elite Where Educated 1I A higher percentage were
educated in the United Kingdom and IndiaPakistan (52 percent)
because of lack of local secondary schools Another factor is that
a well established social class structure was part of pre-Independence
culture The upper class In Zanzibar and to some extent those
among the Baganda could afford overseas education whereas those
from other countries were dependent on financial help from governshy
ment sources
There was a higher percentage of elected or appointed represhy
sentatives n Kenya and this category was not so highly educated
as the llcivll servant of lIa ll others ll categories It can be seen
that there are more electedappointed representatives than civil
servants or others in the lowest categories of education In the
highest educational brackets we have more civil servants in the
elite of all three countries than in the other two classifications
56
Table 7
East African Elite Specific Occupation Factor By Percent
Kenya Uganda Tanganyika Zanzibar Total
Education (administration) 5 4 6 7 5
Education (teacher) I 3 1 2 2
Medical practicing 4 5 3 5 4
Sciences 1 I I 2
Lawjudicial 1 6 2 8 2
Accountancy 2 1 2
Farmer 1 2 I 3
Entrepreneur 2 2 I 9 2
Senior executive 34 36 61 44 45
Junior administrator 7 14 14 3 1I
Legislator (only) 38 20 7 8 21
Partyunion officials 13 5 4 6 8
Editorsartauthors 1 1 I 5
Clergy senior 1 3 4 - 2
Others (unclassified) 2 5 3 2 3
-Base (all Africans
Interviewed) 457 409 444 113 1423
57
Table 8
East African Elite Education Factor By Percent (1972)
Educational Level Reached Kenya Uganda Tanganyika Zanzibar Total
No formal education
Attended junior secondary 22 13 8 21 15
Attended sen lor secondary 21 18 23 13 20
Obtained certificate of secondary 12 8 3 10 8
Obtained higher certificate high school a a a - a
Nonunlverslty technical studies 5 7 19 6 10
Nonunlverslty teaching studies 4 6 7 - 5
University studies non-graduate - 22 20 17 17
University studies 1st degree 17 15 16 26 17
Post-graduate university ma s te r I s deg ree 5 7 2 4 7
Post-graduate university studies higher degree 2 2 1 2 1
Not stated I - I I a
-Base (all Africans
Interviewed) 457 409 444 113 1423
a -- Less than 5 percent
58
Civil servants In Uganda are more highly qualified than In the
other three countries 59 percent have university education In
Kenya 56 percent In Tanganyika 42 percent and in Zanzibar 56
percent have university education Elected and appointed represhy
sentatives generally have less education In Kenya 22 percent
Uganda 37 percent and in Tanganyika 26 percent (Zanzibar could
not be tabulated) have university education Uganda Is still the
highest among the three countries
Country Where Ed~catlon Was Obtained
Table 9 on page 59 gives details about the country In
which the respondent was educated In his final year of education
It can be seen that the highest percentage of the elite were edushy
cated in local East African schools (58 percent) The United Kingdom
came next (28 percent) followed by the United States (7 percent)
IndiaPakistan and other African countries There are very sigshy
nificant differences between the East African countries however
which are worth noting Zanzibar and Uganda have many more elite
who were edycated overseas and in the United Kingdom particularly
than the other countries Kenya had fewer by 10 percent than
the next lowest which was Tanganyika
It would be a waste of effort to detail all of the East
African schools attended by the East African elite There were
nearly one ~undred What is significant however is to show that
out of this total only a few schools account for handful accounts
for more than 5 percent of the elite In each country and moreover
this handful accounts for a very significant percentage of the elite
59
Table 9
East African Elite Where Educated
Country Educated Kenya Uganda Tanzania Zanzibar Total
East Africa only 67 54 57 42 58
Afrlca--outslde East Afrt ca 3 4 4 1 4
The U S 8 5 8 2 7
The U K 18 38 27 38 28
IndiaPakistan 4 3 3 14 4
Austral la New Zealand a - - - a
Canada - a - - a
Western Continent Europe Ie Germany Norway 1 1 3 2 2
USSRChina or Eastern European Countries - - a - a
Elsewhere outside Afr lea
Not stated 1 - a 2
Total 103 106 100 100 100
Base (All AfrIcan Interviews) 457 409 444 113 1423
a -shy Less than 5 percent
60
The Factor of Rellslon
This survey did not Include Zanzibar and therefore the
paper Is unable to provide comparative figures for Zanzibar of East
Africa as a whole One would logically expect to find relatively
61
the same number of elite as the general percentage for the popushy
lation as a whole In each religious grouping
Table 10 on page 62 is complicated by the category among
the elite of Inormal Chrlstlan1I which did not appear In the first
survey This category has been added because many of the sophisshy
ticated Africans were educated In Christian schools so they do not
regard themselves as pagan and yet they do not belong to any formal
church The category IInormal Christian or simply Christian is
used to describe them We can generalize that fewer Moslems are
among the elite than one would reasonably expect from the above
figures particularly In Tanganyika Fewer Roman Catholics in
Kenya and Uganda are among the elite than one would reasonably
expect from the above figures about the proportions to be expected
Moslem education In East Africa Is less than education
among the other religions Protestant missions have been strongest
in education since earliest times In East Africa and this Is
reflected in Table 10 Even In government schools in the old colonial
tradition the Church of England as the state church dominated
the educational field In the British System and in England today
1Ireligion is taught along with the three Rl s This will explain
the larger number of Protestants In the population as a whole and
among the elite of Uganda and Kenya Zanzibar of course Is a
Moslem country Most of the 7 percent 1I0 ther ll in Zanzibar were
Bahal The white fathers of Tanganyika dominated the field of edushy
cation in early German times and remained a powerful force throughshy
out the Trusteeship period
62
Table 10
East African Elite Religion Factor Compared to Population Percentage
Kenya Uganda Tanganyika Zanzibar Total
Elite Othersa Elite Othersa Elite Othersa Elite Elite
Roman Catholic 21 29 25 34 26 28 4 22
Protestant 54 45 65 50 22 26 43
Moslem 4 16 3 10 16 39 88 14
Pagan 8 6 7
Normal Christian 15 2 24 13
Other 7
Not stated 6 2 5 1I 7
Total 100 100 100 100 100 100 100 100
Base 457 2400 409 2600 440 2000 113 1423
a -- The percentages for others is based on the probability sample (7000) of survey conducted by Fred G Burke Some grass-roots attitudes affecting political and social Intergratlon In East Africa paper delivered to the African Studies Association San Franclsco October 26 1963
63
The Factor of Voluntary Associations
The degree to which Individuals In African societies join
groups of voluntary association is a measure of social change The
comparison between the four countries which is given in Table 11
on page 64 shows significant differences between them Tribal
associations are much stronger in Kenya than elsewhere 21 percent
as against 2 percent to 8 percent In Zanzibar Tanganyika and Uganda
This underlines the felt need of the Africans of Kenya for security
among their own people in the face of Insecurities of the old
colonial system and Its concomitant privileged European and Asian
classes Nowhere else in East Africa was the position of the
settler or trader so strong Moreover political parties were
banned In Kenya on a national basis until comparatively recently
although district associations were encouraged by the administration
Kenya elite rate highest In political party membership (35
percent) as against 17 percent to 22 percent and trade union membershy
ship (20 percent) as against 5 percent to 12 percent
Uganda elite join more groups of voluntary associations
than the elIte of other countries The average Uganda elite has
membership In two groups Kenya 1-7 Zanzibar 1~6 and Tanganyika
1-5 Moreover the kind of groups that the Uganda elite support
are more sophisticated The Uganda elite rate much higher In
religious (16 percent) versus 6 percent to 9 percent professional
(15 percent) versus 4 percent and cultural (16 percent) versus
6 percent to 11 percent The Uganda elite Is only second to the
Zanzibar elite (42 percent) as members of social clubs (36 percent)
but significantly higher than the Kenya elite (23 percent) and the
64
Table 11
East African Elite Voluntary Associations Factor By Percent
Kenya Uganda Tanzania Zanzibar Total
Member of a tribal association 21 8 3 2 10
Religious societyunion 6 16 6 9 9
Business society 5 8 6 11 6
Professional society 9 15 4 15 9
Academic society 12 20 7 17 13
Political party 34 21 22 9 25
Charitable organization 5 13 12 42 10
Social club 23 36 25 9 29
Sporting club 6 16 11 15 11
Other organizations 11 4 5 10 8
Cultural organizations 6 16 11 10 11
Trade union 20 5 12 5 12
Belong to none 18 17 33 17 22
Total a 176 195 157 165 175
Base (All African interviews) 457 409 444 113 1423
a -- Many individuals belong to more than one group
65
Tanganyika elite (25 percent) One In three of the Tanganyika
elite (33 percent) does not belong to many voluntary associations
compared to only 17 percent or 18 percent for the elite who do not
belong to at least one society In the other East African countries
Business is presented equally in each of the four countries
Table 11 Is one of the most significant of the survey The
Uganda elite of whom one in three was Baganda have had University
at Kampala for many years It was once the only center for higher
education In East Africa Therefore culture In the western sense
was for many years a factor of influence on elite of Uganda which
was not available in either Kenya or Tanganyika
The Tribal Factor
The percentage of the elite In each country by tribe
compared to the percentage of the population represented by that
tribe should give an Interesting Index of the degree to which
the tribe has progressed and Indirectly of the Influence of Its
members
The first significant fact which emerges Is that 9 percent
called themselves Tanganyikansll and would not use the label tribe 11
We can only assume that the actual percentage by tribe of this group
Is about the same as described In Table 12 on page 66 with the
obvious Inclusion of some who are of mixed percentage The most
significant fact Is that there were 30 percent who belonged to Kenya
tribes 2 percent Ugandans and 5 percent Zanzlbarees No other
East African country had as high percentages In these categories
That amounts to 37 percent who were of tribes other than those of
66
Table 12
Tanganyika ElIte by TrIbal Group
Tri be Percent of PopulatIon Percent of ElIte
Sukuma 19 3
Nuyamwerl 7 2
Hakonde 6
Haya 6 7
Chagga 6 12
Gaga 6
Ha 5
Hehe 4 1
Nyakusa 4 3
Wguru 4
Sambaa 3
Zaramo 3
Yao 3
Hwevu 2
Others (Less than 2) 13 22
Stated Tanganylkan 9
Kenyan Tr t bes 30
Uganda TrIbes 2
Zanzlbaree 5
Toeal 100 100
Base 10204000 (1973) 444
67
Tanganylkans The major tribe the Sukuma represents one in five
of the Tanganyika population yet has only one In thirty-three
among the elite There are twice as many Chagga among the elite
as their tribal percentage would warrant Surprisingly the Haya
have more than their share although all the rest have fewer except
the ve ry sma 11 Ilothe r ll t r i bes who have nea r 1y tw Ice as many
In Uganda we would expect to find the Baganda over represhy
sented in the elite (see Table 13 on page 68) They have like
the Chagga twice as many (33 percent) as the tribe percentage would
warrant (162 percent) An even higher percentage 28 percent
claimed to be IIUgandans a classification not recorded in the official
census figure Only 1 percent are from Tanganyika and 1 percent
from Kenya Unlike Tanganyika the smaller tribes which each
represent less than 1 percent each of the population have only
half as many elite (6 percent) as their combined percentage (94)
would expect Tanganyika had twice as many The Watoro was the
only other tribe In which the percentage of the elite exceeded
that of the tribe 4 to 32
Kenya Is unique In that there are several tribal groups
that exceed their quota of elite and by almost the same ratio (see
Table 14 on page 69) The Luhya have a slight margin by ratio
over Luo and Kikuyu The Kamba Mero and Embu related tribal
groups are all seriously under their expected percentages Like
Tanganyika but unlike Uganda the small tribal groups--each of
less than 3 percent of the total population but represent 161
percent of It--have 22 percent of the elite A high percentage
of this group of the elite are from the numerous coastal tribes
68
Table 13
Uganda Elite by Tribal Group
Tribe Percent of Population
-Baganda 162
Banyonkole 8 I
Teso 8 I
Basoga 78
Baklga 7 I
Lango 56
Baglsu 5 I
Acho I I 44
Lugbara 37
Wator i 32
Banyaro 29
Karamujong 19
Alur 14
Banyole
Kuma 94
Others (Less than 1) -Not stated
Stated Ugandan -Kenyan tribe
Tanganyika tribe
Total 1000
Base 7367558 (1973)
Percent of Elite
33
3
3
4
2
3
3
4
3
6
28
100
409
69
Table 14
Kenya Elite by Tribal Group
Tri be Percent of Population Percent of Elite
-Kikuyu
Luo
Luhya
Kamba
Meru
Kis i i
Embu
Klpsigis
Nandi
Others (Less than 3)
Stated Tanganyika
195
144
125
117
69
49
39
3
22
16 1
23
19
19
6
2
3
2
22
2
Total 1000 100
Base 9204000 (1973) 457
70
Table 15
Question
What in your opinion is the most important problem facing our country at the present time
Na i rob i Dar-es-Salaam Kampala Total
Education
Poverty-famine
Unemployment
Economic development
High cost of living
Border disputes Inter-African disputes
Pol itical instabi 1ity
Tr i ba 1ism
Land apportionment
Publ ic laziness
Other problems
Don1t knownot stated Refused to answer
22
13
41
6
10
3
2
3
2
2
29
24
6
24
3
6
4
2
28
18
18
12
9
5
3
2
5
3
27
19
18
14
8
3
3
4
2
Total 109 105 105 105
Base 389 451 395 1235
71
Table 16
Question 2
All things considered how satisfied are you with your present standard of 1ivlng--very satisfied fairly satisfied
somewhat dissatisfied or very dissatisfied
Nairobi Dar-es-Sa1aam Kampala Total
Very satisfied
Fairly satisfied
Somewhat dissatisfied
Very dissatisfied
Don I t know
Refused to answer
6 13 4 8
32 50 25 36
32 26 37 31
29 11 32 24
Total 100 100 100 100
Base (a 11 intervi ews) 389 451 395 1235
72
Table 17
Question 3
Do you think political matters should be left to the government or should people like yourself take
some active part in political affairs
Nairobi Dar-es-Salaam Kampala Total
Left to government 26 24 13 21
People to take an active part 72 72 73 72
Other answers 4 2
Dont know 2 8 3
Refused to answer 2 2
Total 100 100 100 100
Base 389 451 395 1235
73
Table 18
Question 4
Which one of the following do you think our country needs most at the present time more schools more hospitals
more housing more factories or more roads
Nairobi Dar-es-Salaam Kampala Total
More schools 40 44 51 45
More factories 40 37 28 35
More hospitals 17 10 15 14
More housing 1 6 5 4
More roads 2 3 1 2
Don I t know
Total 100 100 100 100
Base 389 451 395 1235
74
Table 19
Question 5
Now which one do you think our country needs most an honest government without corruption a government that gets things done fair distribution of wealth
national unity or individual freedom
Nairobi Dar-es-Salaam Kampala Total
An honest government wIthout corruption 44 38 51 44
A government that gets things done 23 18 17 20
National unity 22 20 17 19
Individual freedom 6 14 6 9
Fair distribution of wealth 5 9 8 8
Don I t know
Refused to answer
Total 100 100 100 100
Base 389 451 395 1 235
75
Table 20
Question 6
Which do you prefer--government ownership or private ownership of major industries
Nairobi Dar-es-Salaam Kampala Total
Government ownership 51 43 38 44
Private ownership 38 38 31 36
Mixed (voluntary answer) 10 18 29 19
Don I t know
Refused to answer - - 1shy
Total 100 100 100 100
Base 389 451 395 1235
76
Table 21
Quest Ion 7
As you know there are many different ways In which African states can establish closer ties among themselves Which of the
following ways would you favor an organization for settling disputes between African governments
closer economic relations political federation African military
organization cultural exchanges
Nairobi Dar-es-Salaam Kampala Total
Favor 94 96 85 92
Oppose 3 3 9 5
Don I t know 2 1 4 2
Refused to answer 1 - 2
Total 100 100 100 100
Base 389 451 395 1235
-Closer economic relations 22 49 53 41
Political federation 26 39 27 31
An organization for settling disputes between African governments 34 32 15 28
An African military organization 15 18 11 15
Cultural exchanges 3 10 3 6
Don I t know
Total 100 149 110 121
Base 366 432 337 1135
77
(8 percent) only 2 percent are Tanganylkans and the Ugandans did
not rate statistically
ELITE OPINIONS AND ATTITUDES
Not only does Scale 1 Table 22 Illustrate a sound basic
knowledge of modern methods to prevent crops from being damaged
It also Illustrates a similarity of knowledge between the three
sample areas which are widely separated geographically Scale 1
will be Invaluable when comparing the results of our first rural
study the field work of which has been completed and Is at the
stage of processing
Table 22
Scale
It does not help much to try to prevent crops being damaged by Insects and diseases such losses can
never really be prevented
Kampala Dar-es-Salaam Nairobi East Africa
Agree 8 12 12 11
Disagree 88 85 87 86
Uncertain 4 3 3
Base 153 156 150 459
Scale 2 Table 23 on page 78 also Illustrates but not
so conclusively similarities between the three areas Nairobi
had 17 percent agree whereas Dar-es-Salaam had only 10 percent
with Kampala somewhere Inbetween One could say therefore that
78
there Is a higher degree of tribalism among the elite of Nairobi
than among the elite of Dar-es-Salaam
Table 23
Scale 2
A man should never marry a woman who does not belong to hIs tribe
Kampala Dar-es-Salaam Nairobi East Af rl ca
Agree 12 10 17 13
Disagree 81 83 80 82
Uncertain 7 7 3 5
Base 153 156 150 459
While Scale 3 Table 24 shows a similarity between the
three areas It shows that the respondents of Nairobi are much
Table 24
Scale 3
People have It within their power to bring harm and misfortune to others through magic
Kampala Dar-es-Salaam Nairobi East Africa
Agree 26 28 30 28
Disagree 45 46 61 51
Uncertain 29 26 9 21
Base 153 156 150 459
79
more sophisticated In regard to magic than in the other sample
points and that fewer are uncertain A significant number In each
area however believe that magic can be used to bring harm and
misfortune to others
Scale 4 Table 25 shows a consensus between the three
areas but shows an over all unfavorable knowledge about science
and knowledge The majority 83 percent believe that many imporshy
tant matters can never be positively understood by the human mind
The question can provide a very useful comparison In changing patterns
of knowledge regarding science In the future
Table 25
Scale 4
Science and knowledge are useful of course but many important matters can never be positively
understood by the human mind
Kampala Dar-es-Salaam Nairobi East Africa
Agree 80 79 86 83
Disagree 9 12 13
Uncertain 11 9 6
Base 153 156 150 459
Scale 5 Table 26 on page 80 shows an unfavorable public
opinion about the role of traditional chiefs and the dichotomy caused
by loss of status in recent years by traditional chiefs whose roles
have been largely taken over by the political appointee of the
ruling party The question will also provide useful comparative
80
data between ruralurban areas and will be useful In the future to
measure changes in attitudes and opinions about traditional chiefs
Table 26
Scale 5
A man ought always to obey his traditional chief
Kampala Dar-es-Salaam Nairobi East Africa
Agree 42 38 45 42
Disagree 42 46 49 46
Uncertain 15 16 6 12
Base 153 156 150 459
Scale 6~ Table 27 not only shows an area of new problems
for East African elite but also the wide divergence of response
Table 27
Scale 6
Government and politics are so complicated that the average man cannot really understand what Is going on
Kampala Dar-es-Salaam Nairobi East Africa
Agree 81 65 72 72
Disagree 16 24 22 21
Uncertain 3 11 6 7
Base 153 156 150 459
81
between the three sample points In Kampala 81 percent agree
with the statement and only 3 percent are uncertain whereas In
Dar-es-Salaam 67 percent agree while II percent are uncertain
The statement will provide a useful measure In future of the attl shy
tude of the elite toward government In each of the three sample
points
Scale 7 Table 28 Is a new problem of Investment and
saving which as you can see has brought out differences between
the three sample points and will provide In the future a useful
measure of changing attitudes toward savings and the postponement
of rewards
Table 28
Scale 7
If I had the choice I would prefer to be given a small sum Immediately rather than be promised a very
large sum one year from now
Kampala Dar-es-Salaam Nairobi East Africa
Agree 62 54 62 60
Disagree 24 37 30 30
Uncertain 14 9 B 10
Base 153 156 150 459
There are other examples above of similarities and dlsshy
similarities which are even better than Scale 8 Table 29 on page 82
It does show however a close correspondence between Kampala and
Nairobi while Dar-es-Salaam shows a more tolerant attitude In
82
their response to this statement Once again the comparison between
urban and rural areas should show an Interesting and significant
difference
Table 29
Scale 8
A womans place Is in the home
Kampala Dar-es-Salaam Nairobi East Africa
Agree 45 36 45 42
Disagree 46 61 51 52
Uncertain 9 3 4 5
Base 153 156 150 459
Scale 9 Table 30 shows significant statistical differences
between the response from Kampala and those of the other two sample
Table 30
Scale 9
The traditional ways of the past are the best
Kampala Oar-es-Salaam Nairobi East Africa
Agree 15 33 33 27
01 sag ree 68 58 56 61
Uncertain 17 9 11 12
Base 153 156 150 459
83
points This fact Is even more Interesting when we know that in
Uganda the present form of government has been designed to maintain
the traditional ways of the past whereas In the other two areas
the present government has been designed to change politically
at least traditional ways The reactions of the Kampala respondents
therefore are a significant Indication of their dissatisfaction
with efforts to maintain traditional ways
Scale 10 Table 31 also Illustrates that Kampala has a
different reaction than the other two sample points although there
are less significant differences between Dar-es-Salaam and Nairobi
Table 31
Scale 10
The present Is all too often full of unhappiness It Is only the future that counts
Kampala Dar-es-Salaam Nairobi East Africa
Agree 29 50 60 46
Disagree 44 27 32 34
Uncertain 21 23 8 20
Base 153 156 150 459
Scale 11 Table 32 on page 84 Is a really significant
Indication of the basic dissatisfaction of the Kampala respondents
with the status quo The dissimilarity was also reflected in
Scale 10
84
Table 32
Scale 11
The government Is doing all It can to develop our country
Kampala Dar-es-Salaam Nairobi East Africa
Agree 51 86 84 74
Disagree 21 5 10 12
Uncertain 28 9 6 14
Base 153 156 150 459
Chapter 5
SUMMARY AND CONCLUSIONS
The purposes of this study were to
1 Analyze the factors which have slowed the economic
development of East African communities
2 Identify the major problems encountered In economic
systems In East Africa
3 Determine the problems in developing the economic growth
of the community
4 Identify economic reconstruction needs
All the published materials listed below were extensively
reviewed The review Included library research over both periodicals
and some relevant studies The writing of this report Is thus based
on the Information provided by the following documents
1 Periodicals books pamphlets mlcroflshe from the
William Allen White Library of the Emporia Kansas State College
2 Xeroxed materials and books that were secured through
the Inter-library loans
3 Report collected by the Marco Survey Ltd Nairobi
4 Periodicals Issued by the Information section of the
Embassy of the Republic of Kenya Washington D C
In order to determine the social and economic problems of
East Africa a questionnaire-Interview method was used In total
85
86
1423 elites were I~ervlewed Approximately 6 percent of the
elites listed for interview refused to be interviewed
The Interviews were conducted by permanent senior research
assistants
The data collected were compiled (using standard codes to
clarify the data and computer cards were punched for BO-column
I C T data processing equipment In Nairobi) summarized and
interpreted
Finally conclusions were reached
SUMMARY
British East Africa was the name applied to the territories
in East Africa before It achieved Its Independence The territories
cover a total area of 682469 square miles which was divided into
three parts Kenya Uganda and Tanganyika They all became indeshy
pendent by 1963
The communities continued economic ties among each other
and on June 6 1967 at Kampala the three member nations signed
a treaty which was to re-establish the community
East Africa enjoys a great deal of economic advantages
l It borders the Indian Ocean which provides a cheap means of
exporting and ImportlDg goods 2 It Is a meeting point for trade
(east and central African trades)
East Africa Is divided Into five geographic regions (which
provide a variety of climates)
1 coast region
2 Nylka region or Savanah region
87
3 East and West Highlands
4 Lake Victoria region
Due to the Influehce of the cultural traditions the subshy
slstance element in East African economics is still dominant This
is evident in most of the rural areas The public sector of East
African community plays a very great part In developing the economy
The public sector Is expected to be major employers In the community
and Is expected to provide free public services--free school free
medical services free or subsidized public utilities and housing
On an average scale the population of East Africa is yet
low A clear study shows this Is not true In some locations which
are densely populated varying from two hundred to five hundred
people per s~ure mile The population In urban cities of East
Africa Is still low and the people do not consider cities to be
their home Details show that the major East African cities have
over 50 percent of all the urban population while the minor cities
are far less than 50 percent of the total urban population
Standardization of East African people Is too difficult
due to the fact that the population Is composed of a variety of
sub-races whose traditions differ from each other among the tribes
The sub-races classified are
1 Nilotes
2 Nilo-Hamltes
3 Inter-cush Ite
4 Bantus
Based upon the sub-races of East African people the traditional
heritage carried frnom one generation to the other makes the economy
88
of the community hard to work In Perhaps even more important on
the economic outlook is the Inheritance of continuing extended
family contrasts In age and sex
The study shows that trading Is an extremely important
economic activity even though it Is not Itself productive The
trade Itudy has shown that trade has been playing a smaller part
in East Africa and for those operating Its economic efficiency is
very low The greatest part of trading activities is located in
the major East African cities This conclusion has led to the fact
that the majority of the people are living In rural areas where
means of traveling to cities are difficult for them and the lack
of money has probably created the situation where people have to
live subsistently
CONCLUSIONS
The conclusions of the survey of literature and the analysis
of findings follow
Survey of Literature
If It Is correct as suggested by Kamark that the economic
lives of rural Africans are not Influenced by environmental conshy
dltlons more than by cultural disposition then this would mean
that the Introduction for new technology should bring about economic
changes relatively unhIndered by cultural conservatlsm1 That
Is to say the potentIalIties of natural resources can be more
IKamark M Andrews The Economics of African Development (New York Praeger Incorporated 1967) p 79
89
effectively tapped by the Introduction of new methods and undershy
standing and new forms of organization of production It may be
objected that this In fact has not occurred In East Africa and
precisely some would say because of limitations of cultural
conservatlsm 11 But closer studies quite strongly suggest that
where people can see the advantages to themselves of economic changes
2that are both feasible and safe then the changes do occur Thus
African people have accepted changes first and most radically (indeed
they have often deliberately sought them) In the more favorable
areas where the possibilities of new technology and new Ideas are
more readily applicable and where people are exposed to external
influences and have access to modern communicatIons and living styles
The type of national economic progress which is to emerge
the longer-term political goals the roots of nationhood In the
multiplicity of subcultures and naturally uneconomical tribal ties
out of which national culture is forged remain the crucial unanswered
questIons whIch affect the economic progress of East Africa
Analysis of Findings
The results of the analysis has shown that the elite of
East Africa have advanced to a more desIrable socloeconomlc way
of thinkIng ThIs conclusion has led the author to suggest that
perhaps the integrating forms of tribes can be worked out beginning
with the East African elite for however much too depends ultimately
on local and tribal support they have more chance to see above
2 Ibid p 98
90
the disadvantages of these functions The middle class is still
small flexible mobile and unstable not yet clearly or acceptably
dlfferentl~ted from strata above or below The mass of unskilled
workers are the most temporary and the least Involved If no efforts
or attempts are applied the society will inevitably continue to
live In their life of ethnically based networks and subcultural
pockets
16
AHdflJ )O 118 18
BIBLIOGRAPHY
Abraham R G East African Townshipl in A W Southhall (eds) Social Change In Modern Africa New York Oxford University Press 1970
Baver P T and B S Ymey The Economics of Under-developed Countries C U P Cambridge University Press 1957
Blacker E A Demography New York Oxford University Press 1948
Ethographic Survey of Africa East Central Africa London International African Institute 1970
Boesch H A Geography of World Economy Van Nostrand Princeton University Press 1964
Brown L H in E W Russell (ed) The Resources of East Africa Nairobi Literative Bureau 1968
Burke G Fred Africanls Quest for Order Englewood Cliffs New Jersey~ Prentice Hall 1964
The Economics of Underdeveloped Countries New York OxfOrd University Press 1972
Cley and P Robson IFederation of East Afrlca11 Structure and Administration of E A C S O New York Oxford University Press 1964
Doob W Leonard Periodic Surveys in Subsaharan Africa Nairobi Nairobi Publishing House 1970
East African Community Annual Report Nairobi Kenya Government Press 1966
Economic and Statistical Review Nairobi The East African Statlsshytlcal Department 1964 _
Encyclopedia Americana East Africa Vol 4 1974
Encyclopedia Brltanlca East African Community University of Chicago Macropedla Vol I II 1974
Goldthrope J E and F B Wilson Tribal Maps of East Africa and Zanzibar Kampala East African institute of Social Research 1966
92
93
Good M Cha~les Jr Dimensions of East African Cultures New York Oxford University Press 1970
Gulliver P H Labor Migration in a Rural Economy Kampala E A I S R 1955
Harlow V and E M Chi lver History of East Africa Vol II Oxford Clerendon 1962
Hawks D A IIEast Afrlca1I Trade and Industry Official Journal of Association of East African Industries Nairobi Nairobi Publishing House 1963
Hopkins Elizabeth IIConflict of Tribal and Racial Conflict in Stanley and Burke (eds) Transformation of East Africa New York Basic Books Printers 1966
Industrialization in East Africa 5th Edition Nairobi United Africa Press 1966
Jamal A H The Critical Phase of Emerged African States Afalrasl East African Publishing House 1965
Johnson B F The Staple Food Economics of Tropical Africa Stanford California Stanford University Press 1970
Johnson D H Rainfall in East Africa Q F R Vol 5 Nairobi East African Publishing House 1968
Jones Carey Geographical Journal Vol 131 Part 2 New York Oxford University Press 1965
Kamark M Andrew liThe East African Community The Economics of East African Development New York Praegam Incorporated 1971
Kenya Chamber of Commerce Trade Nairobi Kenya Government Press 1973 --~
Lewis William Allen The Theory of East African Literature Nairobi Bureau Annual Report 1965-6
Morgan W T W IIEast Africa Its People and Resources II People New York Oxford University Press 1969
Morgan W T W and N M Shaffer Distribution and Density New York Oxford University Press 1970
Myrdel Uninnar An International Economy Problem and Prospects New York Harper 1969
OConner A N An Economic Geography of East Africa New York Preager 1966
94
Oxford Economic Atlas East African Community New York Oxford University Press 1972
Reed Moyer and Hullanderc Stanley Markets In Developing Economies Illinois R D Irwin 1968
Republ ic of Kenya Newsletter Washington D C 1975 Vol 3 No5
Richard A I Economic Development and Tribal Change Nairobi East African Publishing House 1969
Rosberg A and A Segal East African Federation Internatlonal Conciliation 1963
Samson H W The Climate of East Africa Nairobi Memoirs Vol II I No2
Schneider in W R Bascom and M J Herskovits Continuity and Change in East African Cultures Chioago University of Chicago Press 1959
Seggerson E P Physiography of East Africa Nairobi Press 1962
Southhall A W Growth of Urban SocletyI Dar-esmiddotSalaam New York Oxford University Press 1969
The East African East African Common Services Report Nairobi Kenya Government Press 1966
Thompson B W The Climate of Africa Nairobi Oxford University Press 1965
UNESCO Populatlon Movements in East Afrlca in K M Barbour and R M Prethere (eds) Essay on African Population Routledge and Kegan New York Oxford University Press 1961
Walder D Problems of Economic Development of East Africa In E A G Robinson (ed) Economic Development of South Sahara London McMillan 1964
Warren J Keezan International Marketing Less Developed Countries Englewood Cliffs New Jersey Prentice Hall Incorporated 1974
Wilson A M Social Change In Modern Africa New York University of Oxford Press 1961
Wilson M Gordon liThe Transformation of East Africa Basic Scale for Periodic Research New York Basic Books Printer 1971
S6
XION3ddf
bull
96
URSAN CENTERS
- bullbullbullo1
IL RUdDIf---J -
( L KENYA I
I I I
hlo10bull I I J
- Tllo
Tflgflylfl
-Dodo TAN3ANYllltA
It
bull Imp ~1 bull
JII
~ ~t - bullKlIer
~ ~ JIOlJLAIO
~ ~~ ~ (0 C~CV ~oo Lindl ~ a CO (1(( 00(tOO
c ~tCC a oocmiddot ~~ L Ny ~tWllra1 c ~~(V( 0 ~J(JC~ ~ l(l~5 7~ ~~~~ i~j~) ~J r =X 0 1 ~O _-A- J 0 100 bull - -
mil bull~~ ~__-- _ llo
l6
bull
o
MII bullbullbullbullbullbull bullbullbullbullbullbulll1li bull bull ~ =
middot1
bullbullbull bullbull~ pound
-w
)
umiddot~middot middotmiddotMI
c
gt amp c o
ImiddotUmiddotmiddot middotmiddot0 L
1 bull l
)
L
~
middotmiddotmiddotmiddot1 L
~
~
1 ~
~ ~ I ~ L ~
i 1 middotmiddotmiddotrmiddotmiddotI bull bull ~
I r j L
-r Y
I~ bull CL -J II w 1
VINVZNVl
eII_
fbullbull bull~1
~ r
z
c
o
11Ie
) 11111_0 -shy
N a n s
~______
middot~middot(1 -bullbull
__rr~)
I
I
I I I
~ I ~
I I I ~ I
vaNv~n
66
o
1 IIit
c
Cl
S iII III J
Ibullbullbull middot1t-11 1 114bullc ~~1
bull
001
INZN1L
10 l
r
01 bull 1middot ) l pltllI1 -tpn I I c
o
z
o
bull
J I
lt
- Njoroge 1975
- Njoroge 1975 pt2
-

5
Gazetted Township
Go~ernment official papers classifying towns population
by residenc~9
Great Rift Valley
Geologically this structure is called a Ilgra ben 1I This
valley exte~ds as a series of depressions from Syria through the
Dead Sea (the surface is nearly 1300 feet below sea-level) to
Africa In East Africa It divides into two branches western
and eastern Igneous activities and volcanoes are associated with
the rift valley forming such peaks as Kllimanjaro these are now 10
dead
Kampala
Th~ capital and the largest city in Uganda It was made
the capital In 1962 when Uganda previously a British protectorate
bull d d IIbecame an In epen ent nation
Municipalities Grade A amp B Townships
Gr~de A -- Municipal towns these towns have populations
above sixty thousand
Grade B -- Townships under local government authorities
12Normally these towns have populations below sixty thousand
9Rbull ~ Abraham IIEast African Townshipl In A W Southhall (ed ) Social Chane in Modern Africa (New York Oxford University Press 197D) p 33
lOE P Seggerson Physiography of East Africa (Nairobi Na I rob I Pless 1962) p 10
Ilsouthhall op cit p 477 12Abraham loc cit
bull 6
Nairobi
The capital and the largest city In Kenya with a population
13nearing one million people according to the 1971 population census
Non-African
A resident who is an Immigrant from other continents besides
Africa The majority of Non-Africans are Europeans and Asians
(Indians)14
Pound
East African sterling currency (Pound~) 1 ~ bull shs 20
Equivalent to $28 u S currency 1975 15
Settlers
European immigrants farmers to the East Afrlca 16
Shillings
East ~frican sterling currency (shs) shs 20 z l~ 17
13Southhall op cit p 469
14Abraham loc cit Non-Africans comprise people (male or female) of European or American origin Arabs Indians and Far East Asians
15K~nya Newsletter issued by Section of Embassy Republic of Kenya Jashington D C Vol 3 No5 (1975) p 28
16Ellzabeth Hopkins IRacial Minorities in British East Africa in Stanley and Burke (eds) Transformation of East Africa (New York Basic Books Printers 1966) p 87
17Kenya Newsletter loco cit
7
Swahili
A language of the coastal population of East Africa roughly
from Southern Somalia to Mozanlbique and including Zanzibar and
the Comoro Islands It Is spoken by about 15 million people as
a first langu~ge this includes the people In East Africa and
Congo (Klns~asa)18
METHODS OF PROCEDURE
All the published materials listed below were extensively
reviewed Thl~ included library review of both periodicals and
relevant st~dies The writing of this report is thus based on
the Information provided by the following
1 Periodicals books pamphlets and microfilm from the
William Allen White Library of the Emporia Kansas State College
2 Xeroxed materials and books that were secured through
the inter-library loan and from friends
3 uata collected specifically for use In this study by
the Marco Survey Ltd Nairobi Kenya
4 Periodicals Issued by the information section of the
Embassy of the Republic of Kenya Washington D C
PLAN OF STUDY
In the preceding section the purpose of this study Its
importance the limitations assumptions definitions of terms
18Encyclopedia Americana Swahili Vol 26 (1974) p 85
8
and methods of procedure have been outlined Related literature
largely stu~ies of structure with regard to economic development
in East Africa is presented in Chapter 2 Chapter 3 presents a
background of pertinent economic facts concerning East Africa
Chapter 4 deals with an analysis of factors In Chapter 5 the
data is summarized and conclusions are drawn
Chapter 2
THE REVIEW OF RELATED LITERATURE
British East Africa was the name applied to the territories
In East Africa before they achieved Independence The territories
Included the ~olonles and the protectorate of Kenya the United
NatIons trust territory of Tanganyika and Uganda These territories
had a total area of 682469 square mlles l British East Africa was
economicalya system of joint services The East Africa High
Commission which consisted of the Governors of Kenya Tanganyika
and Uganda was responsible for the administration of public services
and functions common to territories including currency roads
customs apd communications Each territory1s government retained
responsibility for local services such as health education and
police 2
After World War I I nationalist feeling was strong throughout
British East Africa As the deadline for Independence approached
Britain attempted to form a federation of East Africa but separate
nationalist aspirations made this Imposslble 3 Tanganyika was the
IEncyclopedla Americana East Africa Vol 4 (1974) p 578
2East Africa Geographical Journal Vol 129 Part 2 1963 pp 140-155
3Abull Ro~berg and A Segal East African Federation IIlntershynational Concll iatlon11 1963 p 30
9
10
4first of the four territories to achieve Independence In 1961
Uganda became independent In- 1962 The following year Kenya and
Zanzibar entered the ranks of Independent states Tanganyika and
Zanzibar merged In 1964 and adopted the name United Republic of
Tanzania 5
After Tanganyika became Independent the East African
High Commission was suceeded by the East African Common Services
Organizatior which performed the same functions as its predecessors 6
Finally the East African Common Services became the East AfrIcan
Community The East African Community was formed to establish a
customs union to facilitate the industrial development of the
area and to carryon research activities and common services preshy
vlously controlled by the East African Common Services organization
The community was re-establlshed by a treaty signed by three member
nations In Kampala Uganda on June 6 1967 7
The community provides for free intercommunity trade and
a system of c~nmon external tariffs there Is also a system of
transfer tnxes that may be Imposed on certain commodities Imported
from other members by a country with a trade deficit wIthIn the
other two members Transportation and communications services
are handled by community corporations for raIlways harbors post
4 Ibid p 8 5 IbId p 12 bull
6Encyclopedia Britanlca East African Community University o~ Chicago Macropedia Vol I I I (1974) p 754
7The East African East African Common Services Report (Nairobi Kenya Government Press 1966) p 3
I I
and telecommunications and alrways8 The East African Development
Bank established in 1967 provides and emphasizes projects that
tend to make the three economies complementary9 Although all
three countries contribute on an equal basis to the bank Kenya
the most advanced receives a smaller share of Investments and
guarantees In accordance with the policy of even development among
the states
East Africa is also the meeting point for all the continents
major linguistic groups Even Click Language l is represented in
Central Tanzania
EAST AFRICAN GEOGRAPHY
Regional Survey
East Africa borders the Indian Ocean for about eight hundred
miles and the coastlands form a very distinctive zone although
the plain Is only one hundred miles wide around the Kenya and
Tanzania border IO Winds from the ocean bring a high ralnfal I
to most of the land close to the coast This fertile land Is quite
densely populated The rainfall drops quite rapidly Inland and
land quickly becomes arid and sparcely populated As one travels
from the Iterior towards the coast the change from scared bush
to forest is evident
8 Ibid p 9
9East African Community Annual Report (Nairobi Kenya Government Press 1969) p 38
IOCharles H Gpod Jr Dimensions of East African Cultures (New York Oxford University Press 1970) p 8B
12
Some of the special characteristics of the coastland stem
from the fact that many people have approached them from the sea
and have ~ot penetrated far inland Although most of the population
is African there is a substantial Arab settlement in sharp contrast
to the rest of East Africa Mombasa Is an old town (see map of
East African cities on page 96) Dar-es-Salaam and Tanga are not
These three cities are distinctive In that through them passes
most of the foreign trade of East Afrlca ll This tends to quicken
the pace of economic activities there although In the whole zone
the high temperature (high humidity) resulting from the low altitude
tends to slow It down
The coastal zone Includes the islands of Zanzibar and
Pamba and Mafia together They constituted a separate state for
middotover one hundred years until they joined with Tanganyika to form
anew state of Tanzania in 1964 12
The Nyika Plateau
Away from the coast the land rises fairly gently to flat
plateaus covering between 3500 to 5000 feet above sea level
known In some areas as Nyika (Swahili for wilderness) This is
an area of short rainfall poor scrub vegetation and very sparce
13population separating richer lands In the Interior from the sea
llA M Wilson Social Change In Hodern Africa (New York Oxford University Press 1961) p 35
12Carey Jones Geographical Journal Vol 131 Part 2 (New York Oxford University Press 1965) p 186
lnE P Seggerson Physiography of East Africa (Nairobi East Africa Publishing House 1962) p 10
13
It is broken by mountain ranges notably Usambara and Pare mountains
Taita h1115 where relief brings about a higher rainfall and where
more people have settled Further south it is broken by a zone
of lowland in the basins of the Ruaha and Rufingi rivers where
settlement Is discouraged by periodic floods and disease rather
than by low r3infall Water scarce in East Africa is abundant
there and cen be controlled This area offers promise for future
agricultural development In the south of Tanzania the plateau
reappears but the rainfall exceeds thirty inches in most years
and much of the land is under cultlvatlon 14 The rainfall Is
unreliable soil is poor and the area is remote from central
economic life in Tanzania 15
Th~ highland south of the Nylka has recent volcanic rocks
It stands up as highlands reaching to 19500 feet including
KilimanJaro Mt Kenya and Elgon (see map on page 14) From the
land over seven thousand feet above sea level it extends three
hundred miles westward almost to the shore of Lake Victoria Although
It Is brokpfl by the lINorth Rift Valleyll (not shown in the map)
the floor of which in places lies six thousand feet below the land
to either side 16 In this highland heavy rainfall and fertile
volcanic soils provide excellent conditions for agriculture Much
14gt H Johnson Rainfall in East Africa Q F R Vol 5 88 (Nairobi East Africa Publishing House 1962) pp 1-9
IS ibid p 10
16Seggerson Ope cit p 10
ofx-----_ - -~~ -----------~
QOO 000 ~I)
-==----=-----shy
~ )00 -OOOt
Wi~Z1 ~ OOOt -0001
u
o
z
o
15
of the land Is under cultivation but the fruit of this agricultural
production is offset by the dense population 17
Lake Victoria Basin
The land falls slightly northward from the central plateau
of Tanzania towards the Lake Victoria Basin and the densIty of
the population is increased greatly The Basin is one of the
richest zores of East Africa supporting over a quarter of the
population of the regIon The country receives more rain and
has more fertile soil than that to the south and advantage has
been taken of its agricultural opportunities The land around
the lake in some ways forms a single unIt although it is divided
among the thr~estates This region Is densely settled by farmers
who produce much cotton as well as animal food crops also bananas
(Uganda) a~d coffee providing a green landscape all year around 18
THE ECONOMY
Subsistence Economy
In terms of the actIvity of an average East African man
or woman the subsistence element in East African economies is
probably still domlnent 19 That is to say the amount of time
the average East African spends on activities that merely keep
17w T W Morgan and N M Shaffer Distribution and Density (New York Oxford University Press 1966) p 36
18 Ibld p 38
19~ F Johnson The Sta Ie Food Economics of Tro ical Africa (Stanford Californ a Stan ord UnIversity Press 1970 p 142
16
him alive ana functioning is greater than the amount of time he
spends ear~ing discretionary income The average East African
is more in than out of the subsistence tribal economy20 He produces
most of the goods and services he consumes
The permeation of the money economy throughout Africa not
only has considerable importance in Its own right but will influence
the whole pace of economic development In the future It is almost
impossible for anyone who has not lived in a subsistence economy
to appreciate how profoundly it affects ones activities and outshy
look To live in a subsistence economy means to live a hand-toshy
mouth existence in a world of great risk and uncertainty Without
the techniques or facilities for storage of food over any appreciable
period the East African is dependent on the yearly crop or his
luck In hunting or fishing Nearly every people have a hungry
season ll when the 1ast season I s crop has been eaten and the new
crop has not yet come In The risk and uncertainty affecting a
whole community is less with the spread of the money economy
because It is possible for individuals both to create a margin of
security for themselves by setting aside a permanent store of value
In the form of money and to survive apart from the communlty21
The Public Sector
From a comparatively late point In the development of East
Africa the government role in the economy was a major one The
private investments and the stimulation of production was encouraged
20 Ibid p 151 21 Ibid p 147
17
by the gov~rnment The corollary of this Is the continuing imporshy
tance of the government as employer and of the publicly owned
sector generally in the national accounts
In East Afri ca Ilcurrent government expend i tures run over
15 percent of the gross national expenditure 1I22 If one adds the
operations of the railway electricity authorities ports etc
and the investments in the whole part public sector the total
approaches Hone-third of the gross domestic product-II Together
they are therefore the dominant economic influence in the money
economy of East Africa 23 Many East Africans expect the state
or public agency to be their employer This has the effect of
reinforcing o~e of the worst heritages of colonialism--the East
Africans arceptance of the idea that the best job to have is a
government post
Excessive Expectations for Public Service
The paternalistic attitude of colonial administration
particularly after World War II also left behind the habit of
expecting co~siderable benefit from free public services--free
schools iree medical services free or subsidized electricity
and subsidized housing 24
22Enclc loped ia Amer icana East Afr ica Vol 4 (1974) p 576
23 Ioid p 577
24Abull H Jamal The Critical Phase of Emerged African States (Afairasi East African Publishing House 1965) p 101
18
The colonial government provided most of this for East
Africa1s cities--usually at the expense of the lIagr icultural popushy
lation I But with the growth of the cities and the legitimate
pol itical de~and for the expansion and extension of these services
throughout the land it becomes financially impossible to maintain
them on the uneconomic basis of the past It is also economic
nonsense to consume resources In subsidies rather than use them
for economic development 25
Thr~ughout the world pressure for such services Is present
The way it is kept in line with what Is economically feasible Is
either to charge the economic price or to hand over responsibility
for the services to the local government concerned in which case
the citizens can make a choice between paying higher taxes or using
26the money for other purposes But with the usual East African
centralization of responsibility for these services in the national
government this economic calculus does not occur so Immediately
and directly Pressure for the services thus tends to lead the
East African governments constantly to Increase their expenditures
for them and to give lower priority to other investments that might
In fact re~ult In faster growth of the national income 27
25Ibid bullbull p 129
26 1bid p 159
~~ 71bid p 179
19
POPULATION DISTRIBUTION
Accorciing to the mid-year population estimates for 1968
the population of East Africa was 268 mllllon 28 Based on the
total land area of 642252 square miles mean populatIon density
of forty-two persons per square mile is obtained When compared
with the m~jor countries of Europe and Asia the mean population
of East Africa is very low According to the 1961 census India
had a total population of 438 million on an area of 126 mil lion
square miles with a mean population density of 319 persons per
square mile 29
Table
Mean Population Estimates Per Space Land (1968)
Estimated Total Land Area Population Mean Population
(Square Mi les) 1968 Per Square Mile
Kenya 219789 9104000 41
Tanzania 342171 10325000 30
Uganda 80292 7367000 92
Regional Population
The population of East Africa may be broadly divided into
three main categories first those around the shores of Lake
2EOxford Economic Atlas East African Community (New York Oxford University Press 1972) pp 174216 and 221
29lbid
20
Victoria ~econd those In the highlands country and In the footshy
hills of the major mountains third those in the coastal belt 30
Lake Victoria Is ringed on almost all sides by areas of
dense population In Tanganyika the lake and west regions which
surround the southern half of the lake comprised in 1967 a popushy
lation of some two and a quarter million over a quarter of the
total popuialon of Tanganyika although the land area formed only
one-eleventh of the countrys total On the north-western and
northern side of the lake the Masaka Mengo and BU50ga districts
of Uganda contained in 196B two and one-half million people
Finally on the north-eastern side Luo country in the Nyanza Province
of Kenya likewise showed In 1968 comparable densities of over two
hundred persons per square mile 31
In the group of the mountain areas we must include the
thickly populated districts of Central Province of Kenya where
the Kikuyu Embu Meru land units cluster In some districts popushy
lation densities range to two hundred to five hundred persons per
square mlleo North Nyanza and around the slopes of Mount Elgon
have densl~ies varying from three hundred to five hundred per square
mile whil~ on the western side of the mountains Uganda districts
have similar densities of between two hundred to three hundred
persons per square mile In Tanzania the category of thickly
populated mountainous regions includes the southern slopes of
30w T W Morgan and N M Shaffer op cit p 29
31Ibid p 27
21
Kilimanjaro ard Mount Meru and Livingstone Mountain in Southern
Highlands 32
The coastal belt consisting of a strip of low lying country
constitutes o~r third region of highly populated density This
area has beell subject to substantial immigration The population
was attracted not only to coastal cities but also by the large
sisal and sugar industrial plants oil refinery and shipping labor
which have drawn immigrant labor from all parts of East Africa 33
Urban Population
Precise international comparisons tend to be vitalized
by the fact that the destination of urban population varied from
country to country and from census to census It Is also true
that urbanization of the population of East Africa is extremely
low
In the Tanzania census of 1968 thirty-three Igazetted
townships were defined which comprises an aggregate population
of 664072 persons of all races or 51 percent of the total popushy
lation of the country34 Of this population over a third were
In Dar-es-Salaam (228742) and Tanga (138053)
In Uganda the census of 1968 contained as gazetted townshy
shlps those which comprised an aggregate population of 409075
32Seggerson Ope cit p 138
33lbid p 139
34Rbull G Abraham East African Townshlp In A W Southhall (ed ) Social Change in Modern Africa (New York Oxford University Press 1970) p 300
22
persons of all races or 2 percent of the population of the country35
Of these over one-third consisted of the populations of Kampala
and Jinja For the purpose of the Kenya population census urban
areas were divided into four categories municipalities grade
A townships grade B townships and trading centers 36 Not all
trading centers were defined as separate census areas and when
the results of the census were obtained it was found that several
of the grade B and even some of the grade A II had such small
populations that they could scarcely be regarded as towns in the
normally accepted meaning of the word The author therefore
defined urban areas as towns with a total of over two thousand
people There are approximately thirty-four towns of over two
hundred population
PEOPLE
It is difficult in the tradition of great social and cultural
diversity to distinguish East Africa by tribe but it Is very
difficult to give definitions of units that will accommodate the
wide range of factors Clearly tribe has reference to a distincshy
tlve group of people that possess the heritage of a common culture
lithe total of their forms of social organization historical trashy
ditions la~ and customs value and beliefs 1I37
35Ibid p 310 36 Ibid p 312
37w T W Morgan East Africa Its People and Resources People (New York Oxford University Press 1969) p 34
23
ThuD it is necessary to be somewhat arbitrary in disshy
tinguishing the various people of East Africa The term tribes
has the same sort of imprecise usefulness difficult to define
specifically as the term c lass in western industrial ized
countries 38 The late Dr Leaky (archeologist and sociologist)
classifies East African people into three distinctive parts
They are broadly classified on III inguistic and traditional basis ll
I into Nllotes Nilo-hlmites and Bantus 39 Such distinctions are
i 1 1 Table 2 1I The 0 1st r ibut ion of the Af r ican and the IINon-Af r ican ll
I in proportion by Cities4 1968 0
I 1 1
Country African INon-Afr Ican ll
Tanzania 4 1 721
Uganda 30 850
Kenya 53 850
very adequa~e to the actlvltes and interests which are of concern
to the people themselves in their ordinary lives For example
the Luo (nilotic) with their communal living society and with a
mixed economy of agriculture do not resemble the Masai (nlloshy
hlmltes) with their pastoral economy who are non-farmers they
~ 38 10 id p 36 39Ibid p 38
4UR G Abraham op cit p 318 IINon-African ll comprises people (male or female) of European or American origin Arabs Indians and Far East Asians
24
do not eat sea food The Bantus In East Africa (found mainly on
the southern hemispheres of Africa) have an exceptionally wide
range of cultures and economic systems 41
The Tribal Iassification
The term East African people identifies about 11110 different
people in the mainland Tanzania about 35 in Kenya and about 37
In Uganda42 Of these five comprise over a million people each
forty-threp exceed one hundred thousand people The smallest
tribes contdln only a few hundred people but their culture intershy
mediate zo~es are generally between one and another 43 Blackers
book of East African lIdemography provides an adequate overall
account of the traditional culture and social system of perhaps
thirty of these tribes 44
A number of larger and Important tribes remain still
undescribed by modern standard needs Published studies of social
and economic changes In recent decades are fewer even for those
people such as Kikuyu and Chagga where change has been most
radical Most books dealing with the traditional cuiture of East
African people were written many years ago and are not reliable
41Morgan Ope cit p 40 42 1bid p 36
43E A Blacker lIDemographyl1 (New York Oxford University Press 1948) p 43 The best general surveys of available Inforshymation are contained In the volume of the lIEthographic Survey of Africa (East Central Africa) 11 (London International African Institute 1970) p 70
441 bId p 79
25
guides for the study of people of East Africa in the second half
of the twentieth century
Historical Clusters
Although some tribes remain as little more than names on
the enthographlc map It Is possible to group the better known
people Into clusters which are identifiable In terms of common
historical traditions linguistic similarities and certain related
social Institutions and values As far as present knowledge goes
the following clusters are fairlyclear Only the larger tribes
are indlca~ed In the lists
Tribal names are given in their root forms
(a) Nilotes--Acholi Alur Lango Luo Padhola (b) Nilo-Hamites--(eastern Nilotes)
1 Teso Cluster--Karamojong Teso Turkana 2 Kalegln-Elgeyo Kipsiqis Nandi Tuqen 3 Masal Cluster--Arusha Masal Samburu 4 Tatoq Cluster--Barabalg
(c) Inter-custrlne Bantu--Ganda Ha Haya Klga Nkole Njoro Rundl Rwanda Soya Toro
(d) Elgon Bantu--Aisu Lugya (e) North Eastern Bantu--Chagga Embu Gusli (kissl)
Kamba Kikuyu Meru Mbere (f) Coast Bantu-Bondei Olgo Mljikenda Sambaa Zigua (g) Nyamwezi Cluster--Bena Hehe Sangu (h) Luguru Cluster--Kaguru Luguru Ngru4(I) Rouma Cluster--Makinde Makua Mawia 5
In no case are all the people of a cluster identical In
their econOOlic system In terms of their traditional economic
systems and the exploitation of the natural resources a more undershy
standable classification can be made In the following way
45 1bId p 15
26
A Primary Pastoral Economy with little or no agrlculture-shyBarabaig Boran Masal Redille Saburu Somalia Pastoral suk Turkana
B Mixed Pastoral and Agricultural Economy I Pastoral Ism predominant--Aogo Karamojong Klpsiqis
Kuna Nandi 2 Agriculturalism predomlnant--Arusha Bela Klssl
Ha Hehe Iraqw Iramba Kamba Lango Luqbata North Luhya Luo Njakjusa Padhola Rangl Hlgland Suk Sukuma Teso Tugen Turu
C Mainly Agricultural Economy with minor pastoral Interests--Acholl Alur Chagga Embu Alsu Kikuyu Nyoro Sambaa Toro
D Primary Agricultural Economy with little or no husshybandry--Digo Ganda Haya Klga K~gjO Makua Ngorl Ngindo Nyanwaz Soga Yao Zaramo Zlqua
There have been great basic changes that have occurred in
the last two decades toward a greater development of agricultural
Interest slight disappearance of tribal territories (traditions
of belief) due density Increasing demand for cash income and
greater att~nton to crop production husbandry by government and
47commercial concerns
AFRICAN HERITAGE
In general African cultural social background relevant
to economic development is very different from that of any other
developing region of the world Because of Africas geography
great size and climate It was after 1900 that the Influence of
the rest of the world began to reach most of Africa South of
Sahara 48
46 I bid p 2I bull 47Morgan Ope cit p 36
48~ K~ Schneider In W R Bascom and M J Herskovlts Continuity and Change In East African Cultures (Chicago University of Chicago Press 1959) pp 144-167
27
Perhaps there is a need to break the old African tradishy
tional heritage that Is passed to modern Africa A study of the
old African economy shows that it was one In which the methods of
production were simple and the units of production were small
The mlddle-nlen were both hated and Indlspensible Agricultural
progress was seriously impeded by the perpetuation of communal
right-over land 49 Chronic underemployment was one of Its basic
problems and despite moral exhortations among the people the
propensity to save was low It was an economy heavily dependent
on foreign sources for improved Industrial and agricultural methods
and to so~e extent for capital 50 The ambitious young men often
preferred careers In the professions and government service Men
here wrongly pinned their hopes on industrialization and economic
nationalism to absorb Its growing population Industrialization
was slow to come and the blessing of economic nationalism proved
to be mixed 51
The Extende~ Family
Perhaps even more Important than economic outlook both
positively and negatively Is the Inheritance of the continuing
strength of the tribal ties to which nearly all East Africans are
subject To begin with one must consider the L1neage Systems
49bld p 152
seA I Richard Economic Development and Tribal (Nairobi East African Publishing House 1969) p 78
Change
51lndustrlallzatlon In East Africa 5th Edition by United Africa Press Natrobl 1966 p 87
Published
28
or extended familyll--under which an individual has deep ties with
and feels obligation to a large number of people beyond the nuclear
family of the fathers mother and chlldren 52 Good fortune is
shared with m~ny others and In crisis one Individual can calion
help from many others
UnfCrtunately in terms of potential economic development
the extended family has many drawbacks It tends to discourage
Individual enterprise and Initiative as the burden of family
53obligations rise with the degree of an indlviduals success
There are other drawbacks Family crises tend to prevent
accumulation of capital or drain away the discretionary purchasing
power 54 The people with small incomes find it hard to comprehend
the greater cost of living of individuals with higher incomes
The age structure for the East African population is sigshy
nificant for as In most underdeveloped countries a large proshy
portion of the population is not of working age 55 Children of
fourteen years or under account for about 45 percent of the total
population which is comparable with the figure for Nigeria or
Brazil and in East Africa many children assist in picking cotton
or herding cattle Nevertheless productivity Is generally far
lower than that of adults and as increasing numbers of children
52UNESCO 11Popuiation Movements in East Africa in K M Barbour an~ R M Prethero (eds) Essay on African Population Routledge and Kegan (New York Oxford University Press 1961) p 96
53Ibid p 98 54( bid p 100
55L H Brown in E W Russell (ed) The Resources of East Africa (Nairobi Llterative Bureau 1968) p 102
29
attend school their contribution is decreasing although education
should enhan~p their income earning capacity in the future
Sh~rp contrasts in age and sex structure exist within East
Africa generally resulting from migration In NJombe and Songea
districts in Southern Tanzania about one-third of the adult men
are usually away Thus adult males make up a much smaller proshy
portion of the resident population than is normal The situation
is similar on~ thousand miles away in west Niles District of Uganda
The males of sixteen or over account for only 22 percent of the
population compared with the national average of 28 percent and
In the Kingezi District less than 20 percent were adult men according
to the 1969 census The absence of adult men Is even more marked
in parts of western Kenya for they comprise only 17 percent of
56the Kakamega District In the Kenya 1968 census
In Q1I these areas the high ratio of children to adults
tends to lo~er the level of economic activity This is not true
of the preponderance of women among the adults for they generally
do more work than men but the ratio of men to women may affect
57the economic activity in each area
Con~ersely an unusually high proportion of men of working
age means ~)re development 58 This is most evident in the cities
but also applies to larger areas such as Buganda or Tanga regions
Other factors must be favorable to attract people but the relatively
56Fred A Burke The Economics of Underdeveloped Countries (New York Oxford University Press 1972) pp 11-15
57 58Ibid p 29 Ibid p 30
30
high level of activity In areas such as Buganda is certainly related
to the age and sex and especially to the numerous Immigrant men
who either work as laborers or grow cash crops on their own account
there rather than In their home area
THE ECONOMIC ACTIVITIES OF EAST AFRICA
Trading Is an extremely Important economic activity even
though It Is not Itself productlve 59 By redistributing goods It
increases their value and It provides much employment in the process
Yet trading is sometimes omitted In studies In marketing geography
partly because of little data available on internal trade in East
Afrlca 60 However the main tradIng pattern of the regIon may be
outlined
Trade plays a smaller part In East African life than in
that of more highly developed regIons where peoples wants are
greater and where they satisfy few of their own requirements It
Is less Important even than in West Africa where It forms the
main Inter~st of an enormous number of people 61 Most East African
people produce theIr own food and cannot afford to buy many other
goods Nevertheless some goods are now sold In many parts of the
region and the proceeds are used to buy goods produced elsewhere
Commerce Is thought to contribute about 10 percent of all paid
59M Andrew Kamark The Economics of African Development (New York Praeger 1971) p 68
60 1bld p 98
61 Abull I Richard Economic Development and Tribal Change (Nairobi East African publishing House 1969) p 83
31
employment This commerce was mainly introduced since 1900 but
It has been superimposed on the traditional pattern of small-scale
trade which has not been entirely superceded
The Importance of trade In East African life has greatly
increased thrQugh the development of new forms of exchange which
Involve selling of goods for cash and buying goods produced far
away Ori31nally such trade consisted almost entirely of sales
for export overseas and the purchase of imported goods but today
an increased volume of sales Is to other parts of East Africa and
many of the commodities purchased have been produced within the
reglon 62
ThIs type of trade has provided the main basis for urban
development Both the large cities and the small towns of the
regions owe much of their present Importance to their trading
function even though many originated as administrative stations
within most rural areas the settlement pattern Is highly dispersed
and the clusters of bui ldlngs which are sometimes termed villages
usually consst mainly of IIdukas 163 Host of these small trading
centers grew up to handle the Import and export trade although
many now serve as markets for local trade
In review of a survey conducted by Keegan East Africa dukas
are very small carry one hundred items and occupy no more than
62Dbull A Hawks Official Journals East African Trade (Nairobi East Afric~ Publishing House 1963) p 10
63Warren J Keegan Multinational Marketing (New Jersey Prentice Hall Incorporated 1974) pp 308-9
32
fifty to seventy-five square feet 64 This indicates that the dukas
were operating on an average gross margin of approximately 12 percent
which is considered to be lower cost form of distributlon 65 The
East African duka Is highly Inefficient as a form of distribution
because the sales per person in the duka are much lower to keep
the duka developing significantly with the community economy
THE DISTRIBUTION OF TRADING ACTIVITY
Nairobi
The most important center of trade In East Africa Is Nairobi
A photograph of Nairobi Is provided on page 33 to give an example
of the modern cities of Africa Administration manufcaturlng and
commerce are three main functions of the city and are all comparable
In importace each employing more than fifty thousand people 66
The 1960 survey of distribution recorded one thousand wholesalers
In and out of a total for Kenya of three thousand It recorded two
thousand retail establishments compared with similar numbers In the
next nine towns of the country together 67 The value of all sales
by these ~airobi traders in 1960 was shs 400 billlon 68
T~e great Importance of Nairobi as a trading center Is
related to the fact that it performs trading functions at several
levels In some fields It serves the whole of East Africa and
64 Ib id p 308 65 Ibid p 309
66Mcrgan op cit p 70 67 Ibld p 72
6RKenya Chamber of Commerce Trade (Nairobi Kenya Governshyment Press 1973) p 5
34
in more ways it serves Kenya and Uganda and a small part of
Tanzania
In retail trade Nairobi serves a large area part of which
is relatively prosperous Its pre-eminence has probably hindered
the growth uf neighboring towns such as Limuru and Ruiru as shopping
centers Even Thlka thirty miles north of Nairobi Is more Important
in manufacturing than In trade 69 Much of the retail trade of
Nairobi however Is dependent on the large population and purchasing
power of the city itself Many people obtain their living by supplying
the needs of the administrations Industrial workers and even the
establishment of groups of up to thirty shops at various points
throughout-the higher class suburbs 70
The iMportance of Nairobi Is trade and Is related to Its
functions as the capital of Kenya and In some respects as administrashy
tive center for East Africa There Is a close relationship In which
its Importance In such fields as banking and Insurance are also
involved T~o other factors which favor Nairobi more than possible
rivals SLch as Mombasa are Its centrality in both Kenya and East
Africa and Its location on the eastern edge of the most prosperous
part of the region No town Is better placed to serve the whole
of Kenya or to serve all countries especially since means of comshy
munication have been on Nairobi The country south and west is
sparcely populated but In that to the north and east much purchasing
power Is concentrated There are substantial ve~y affluent European
69 Ibld p 6
70Ibld p 9
35
and African settlements which are of increasing significance as
71cash Income rl5es
Mombasa
Mombasa is not only the leading port In East Africa but
also a major center of trade The first function has led to the
second and the two together have enabled it to become the second
city of Kelya with a population of 380000 (1969 Census)72
Although many importing and exporting firms have headquarters in
Nairobi and their goods are consigned directly to or from the
port many others have offices in Mombasa and compete successfully
for the trade of a large part of East Africa Most traders in
Moshi for example and many in Kisumu or Kampala obtain supplies
through Mombasa importers The export marketing trade provides
much employment outside the port area far apart from private firms
concerned mainly with exports The Uganda Coffee and Lint Marketing
Board has large warehouses In Mombasa 73
Mombasa functions In retail and local wholesalers markets
but this activity Is small in relation to its size Its sphere
of Influence is inevitably reduced by its coastal location while
much of its immediate inner land is arid and sparcely populated
The ships calling at the port provide extra trade for they generally
71A M Wilson Social Change In Modern African Trade (New York Oxford University Press 1961) p 193
720xford Economic Atlas (New York Oxford University Press 1974) p lQ7
73Encyclopedia Americana East Africa Vol 4 (1974) p 579
36
take on some supplies and their crews and passengers often spend
some time clshore However this is of small Importance In comshy
parison with the export trade
Dar-es-Salaam
In some ways Dar-es-Salaam combines the functions of Nairobi
and Mombasa since it Is both the capital and the leading port of
74Tanzania Each of these roles encourages trade and the city
is much the most Important center of trade In the country On
the other hand It does not dominate the whole country as much
as Nairobi and Mombasa together dominate Kenya for both North
and South have only limited marketing connections with It Arusha
and Moshi have closer tradIng links with Kenya cities and with
the port of Tanga Bukoba has closer ties with Uganda and Kenya
and Mowara Region Is often linked physically with the capital only
by sea and It is therefore commercially Independent to some extent
Dar-es-Salaam also plays a smaller role than Nairobi and Mombasa
combined It Is comparable In size with the latter and Its inhabishy
tants are very much dependent on Its trading functions It is the
main center of import export and wholesale trade for the area
of 280000 square miles and a population of 19 million people 75
It Is also the center of small-scale wholesale and retail trade
for the coastal region while the purchasing power of the city populashy
tion is sufficient to support a wide range of specialized shops
74B F Joh~son The Sta Ie Food Economics of Tro leal Africa Tanzania (Stanford Stan or UnIversity Press 9 p 131
7Ibid p 26
37
Kampala
Kampala is smaller than the three cities mentioned above
but it is very clearly the commercial capital of Uganda Several
of the major importtng and exporting firms of East Africa have
branches there and merchants import goods directly from the port
of Mombasa Many of the businessmen are middlemen who buy from
Nairobi or Mombasa wholesalers and who often sell to other wholeshy
salers in sm~ller townsJ6 Kampala controls most of the trade of
Buganda and Western Uganda but less of that of the east and north
Thus whereas little is obtained their cement is consigned directly
from Toro to the northern towns Little is dispatched to towns in
77the west for these obtain their supplies through Kampala dealers
Although location and the communication pattern limit Kampalas role
as a distribution center for Uganda Kampala middlemen merchants
have extended their sales area in the west beyond the border of
Uganda to Bukoba and to Rwanda
Others
It is not practical to examine the trade of every town in
East Africa but some further features of the distribution of trade
might be noted
Most of the towns classified as others are majority adminisshy
trative centers and their marketing functions have developed from
this Although they differ considerably they are very similar in
76W T W Morgan East Africa Economic Characteristics (Nairobi ~ast Africa Publishing House 1960) p 279
77ibid p 280
38
appearance In addition to administrative functions these towns
provide services such as hospitals and they have generally become
centers of local communication The features tend to enhance their
roles In trade The size and importance of these trading centers
is generally related to the size population and propensity of the
areas they serve Most of these towns are newly created Their
populations range from between three thousand to six thousand and
they have rather less than one hundred shops most along a single
main street 78 All are retailers but many also sell goods to traders
from the countryside and buy some local agricultural products
Mo~t of the towns created are very young and they came into
existence due ~o the scarcity of land These towns are scattered
throughout East Africa and vary In both size and frequency with
the density of population and the local level of income
COMMUNICATION ACTIVITY
Transportation has become an Important economic activity
Official estimates place Its contribution to the Gross Domestic
Product of East Africa at ~45 million which accounts for 61 percent
of the total 79
Road Transportation
Road and rail transportation are probably roughly comshy
parable as sources of Income In East Africa although they differ
78~NESCO Opt cit p 96
790xford Economic Atlas (Oxford Oxford University Press 1966) pp 174216221
39
greatly in structure Road transportation is operated mainly on a
very small scale but there are so many small operators that the
number of people earning a living in road transportation Is very
large SO Motor vehicles came Into general use in the 1920s but
the greatest expansion of road transportation came thirty years
later Today there are many more vehicles per head of population
than in Nigeria or even Egypt approximately six persons per cad IISl
In Table 3 on page 40 road transportation shows that the majority
are private cars but the figure for vans lorries and busses undershy
states the volume of commercial road transportation Cars on many
East Africa roads are used legally or otherwise as taxis proshy
viding many people with good incomes This Is especially well shy
developed in Uganda and helps to explain the small number of busses
there Within each country road transportation activity Is heavily
concentrated In the most prosperous areas especially around the
capital Traffic counts show a far greater intensity on roads around
Nairobi M0mbasa Kampala Jlnja Dar-es-Salaam and Tanga than
elsewhere
The overall Importance and the pattern of road transportation
are both affected by the nature of the road network Road building
has been assisted by the character of the earth in many areas
simple earth murram road serving very well for light traffic
Although few roads are tarred the road network is ~uch better
than In countries such as Sudan and in much of East Africa is
SOlbid pp 147 174 193
81Ibid pp 147 174 183 193
40
Tab Ie 3
Transportation in East Africa (1963-73)82
Kenya Tanzania Uganda Totals
Thousand miles of roads of which bitumen surfaced
(thousands units 000)
Private Vehicles Commercial
Lorries Vans Busses
1963 Flgur~s Private Commercial
Ra 11-Track (In kilometers)
Rail-Vehicles (units 000)
Air-Craft (units 000)
Sea Transportation
nd -- No data available
522
22
1002 295 104 82 26
440 90
962 km
163
05
nd
409
22
726 304 11 I 74 22
220 80
3782 km
42
nd bull nd
39 I
07
619 208 64 70 17
180 60
1 160 km
72
04
nd
1322
5 I
2345 80 1
840 230
59 km
17
82 Ibid pp 174216221
41
adequate for the demand made upon it 83 Some areas without roads
notably in central and western Tanzania are found In other areas
many roads 3re Impassable In the wet season but themiddotdlstrlbutlon
of road transportation activity Is related mainly to factors other
than the roads themselves
Rail Transportation
In spite of competition from the roads railways of East
Africa still undertake most long-distance movement of bulk loads
All are operated by East African Railways Corporation on behalf
of the three governments The rail works employ more than eighty
thousand people
The entire railway system covers 5895 kilometers all
being meter gauge and virtually all single track 84 The East
African Railway Corporation Road Services Is operated mainly In
Uganda and Tanzania although a nucleus of road services between
Mombasa and Nairobi was established to provide express services
for certain commodities
The railway has been Increasing at a moderate rate over
the past few years Between 1965-1971 passenger number rose by
an average of 66 percent per year While the corresponding growth
85rate of freight was approximately 10 percent
83 lbld pp 147 174 193
84 IbId p 39
85Ibld pp 147 174 193
42
Sea Transportation
Sea transportation as an economic activity concerns East
Africa mainly through employment at the ports Sea transportation
administration is operated by the East African Harbors Corporation
on behalf of the East Africa community86 There are several sea
ports which serve Kenya Uganda Tanzania Rwanda and Eastern
Region of Zaire
Periodically these harbors suffer from severe congestion
with serio~s repercussions upon the economy of the entire East
African region The organizational changes within the East African
Cargo Handling Services responsible for handling of cargo as opposed
to the administration of the port makes handling operations slower
and more inefficient
Air Transportation
Air transportation is less than the other forms of transshy
portatlon for it can be used only by the most affluent passengers
and for the most valuable goods In each case the re-fuellng of
planes in transit provides a useful source of income Regular
internal services call at thirty-four places In East Africa of
which twenty-one are In Tanzania 87 The large size and peripheral
populatiofl pattern of that country make air transportation more
appropriate than in Kenya or Uganda Air transportation is unl ikely
to become a major economic activity In East Africa until Its cost
Is greatly reduced
86 Ibld bullbull pp 147 193 87 lbld bull
43
Communication Media
Communication media includes television radio receivers
telephones and dally newspapers These sources are growing at a
88rate of 10 percent per year The growth In urban areas Is higher
than In rurai areas No current data are avaIlable
Tab Ie 4
Communication Medla89 (Thousands) 1963
Kenya Uganda TanzanIa
Television 22 1 100 00
Rad 10 Reef Ivers 70 I 400 300
Telephones 6 1 6 1 32
Da II y Newspapers 190 123 83
SUMMARY
This review of literature was divided Into eight areas which
are pertinent to this study It was designed to provide background
Information related to
A East African Political Environment
1 Regional Survey
2 Nyika Plateau
3 Lake Victoria Basin
88Morgan East Africa Economic Characteristics p 36
890xford Economic Atlas Ope cit Table 1
44
B The Economy
1 Subsistence Economy
2 The Public Sector
3 Excessive Expectations for Public Service
C Population Distribution
1 Regional Population
2 Urban Population
D People
1 Tribal Classification
2 Historical Clusters
E African Heritage
1 The Extended Family
F Understanding the Economic Activities of East Africa
G The Distribution of Trading Activity
1 Na I rob I
2 Mombasa
3 Dar-es-Salaam
4 Kampala
H Communication Activity
1 Road Transportation
2 Rail Transportation
3 Sea Transportation
4 Air Transportation
5 Communication Media
Chapter 3
DESIGN OF THE STUDY
EAST AFRICAN ELITE
This survey was conducted and certain Information provided
to the argument of the study However difficulties of conducting
research 11 the formerly British-controlled territories of East Africa
are no different from those encountered elsewhere only more intense
because of lack of basic bench-mark data and basic socloeconomic
data Stratified probabil ity sampling in more advanced societies
can be designed in many ways Voters rolls rate-payers registers
and the like are usually up-to-date and easily available to the
researchers Such data do not exist in East Africa I Survey
research must be designed therefore on what data are available
There is little constructive value In the criticisms of the purist
that sampling techniques used in Africa do not fit acceptable
Western standards 2 It Is true that they do not but Leonard Doob
states that lithe scholarly or scientific gains to be derived from
ILeonard W Doob Periodic Surve s In Sub-Saharan Africa (Nairobi Nairobi Publishing House Hay 11 1970 p 3 bull
21~id p IS
45
46
valid results are so staggeringly inviting that the frustrations
of the moment Cre rendered almost Impotent- 1I3
Marco Surveys Ltd Nairobi Is the original data source
on its determination to publish Whomiddots Who in East Africa In 1974
Its part information Is the basis for this study
The survey by Marco Survey Ltd Nairobi had faced some
difficulties in deciding who was to be interviewed however It
took several months of careful planning Staff lists were prepared
by the four governments directories of commerce and industry and
membership 1ists of all available professional cultural and warshy
fare organizations and societies were examined Finally the
wage structures of the largest companies were checked and compared
to the wage paid by the four governments Every Interview was
planned and every respondent was presented There were direct
mall intervIews and each respondent signed the completed form
as correct after the interview
The criteria for selection to be interviewed were two The
first criterion was income The optimum cot-off point was an income
of ~I 000 per annum which is higher than the average European
or Asian income and Is also higher than the starting scales for
4university graduates The second criterion was the position held
by the respondent Women who have been Included are el ites In
their own right and not persons who are simply wives of elites
There are only sixty women in the total of 1423 Interviews about
3Eest Africa 1974 (Nairobi Marco Survey Ltd 1974)
4Doob Ope cit p 256
47
4 percent so sex was not used as a basts of tabulating the socloshy
economic data
This data Is presented on a comparative basis to Illustrate
by the basic =lassiflcation data the differences and similarities
of the African elite of the three countrles--Kenya Uganda and
Tanganyika Zanzibar has been Included and treated separately In
most of the tables
This study Is divided Into three parts The first Is an
analysis of the elite In East Africa based on the basic classificatory
data that w~s collected In the original research for Whos Who in
East Africu5 and additional studies which In addition to describing
the elite give Insight Into their opinions attitudes and beliefs
The second is a survey of urban elite opinions on basic social
and economl~ problems and technical assistance It Is based on a
stratified probability sample of those who most closely resemble
the elite in three African capital cities The third describes a
survey which Is beginning to provide research Into changing attitudes
and knowledge that will temporal orientation determlnlsm 11 The
sample will be described at the beginning of the second part for
each of these surveys and a few sample tables will be given to
Illustrate some of the results of this research
Approximately 6 percent of the Africans listed for Intershy
view refu~ed to be Interviewed There were numerous reasons given
for refusing but the chief factors were education and personal
reasons claiming that they were not Important enough to be included
5Marco Survey op cit p 19
Na I rob I
URBAN ELITE OPINION
Order (Englewood Cliffs chapter 4
A recent study poses the hypothesis that the role of the
Standard codes were used to clarify the data and cards
be said that the attitudes and opinions expressed In answer to
East Africa to test the attitudes and opinions of the city African
The interviews were conducted by permanent senior research
48
6Fred G Burke Africans Quest New Jersey Prentice Hall Incorporated
questions are those of the elite but they do represent the opinions
and education The respondent had to have had some secondary edushy
affairs and social problems The sample was stratified by age
the interviews were conducted or had many years of residence there
Inevitably some of those listed were not available for Interview
on certain questions Involving his personal life International
cation and had to be at least eighteen years of age It cannot
a stratified robability sample in each of the capital cities of
Five attempts were made In every case of this type before giving
city in Africa is that of generator communicator Innovator and
Intergrator 6 The research accepted this hypothesis and designed
were punched for 80-column ICT data-processing equipment in
up An estimated 10 percent of those listed were no t avai lable ll
assistants All of these have at least a Bachelor of Arts degree
for interview for one reason or another
or its equivalent and are either nationals of the country in which
49
and attitudes of a probability sample of urban African eighteen
and over who has had some secondary education and who lives in
one of the capital cities of East Africa Therefore the opinions
of this group will be closer to those of the elite than a sample
based on the population as a whole
The people interviewed were chosen in the following manner
Each city including peri-urban and dormitory areas was divided
into geographical units using a grid method on a base map Each
square of the grid was numbered except for those that were in
the business area--marshalling yards ocean and the like--and 10
percent of the squares were chosen by using a table of random numbers
The number of units of housing In each was then determined and
the quota was divided proportionately between each The interval
between units was determined and a starting point selected
The interviewers continued Interviewing to the set interval
until the quota was completed Three callbacks were made where
necessary for each respondent before declaring that interview
void The household was defined as that group which regularly
takes its meals together The head of the household was Intershy
viewed to determine how many In the household of either sex were
over eighteen and had had some secondary school education Those
were then listed and the person to be interviewed was selected
by a system of random numbers Only one person was Interviewed
In each household If the unit did not have at least one person
as defined by education the interviewer then proceeded to the
next household by the fixed interval Ten percent of the intershy
views were checked by field supervisors The Interviews were
50
conducted i~ English for the most part but some Swahili was used
in Dar-es-Salaam
The questionnaires were pretested in each of the capital
cities and the questions were modified where necessary The
translation of Swahili was made in the usual way of two separate
translators who worked from Engl ish to Swahil i and vlce versa
The interviews were conducted from September 15 to October
5 1974 The tables have been shortened for prInting convenience
by grouping items that have less than 5 percent response Into the
category 1I0thers 11 Percentages were rounded to the nearest whole
number or if the percentage was too small in a subsample whole
numbers were given in parentheses
OPINIONS AND ATTITUDES
The following is a description of a few of the questions
which were used in pretesting a series of eighteen questions in
three capital cities of East Afrlca to establish eight scales to
assess opinions and attitudes about temporal orientation governshy
ment confidence and optimism science and determinism conception
of people politics and tribalism or traditionalism It is Intended
that the scales when adequately tested revised and evaluated
can be used for per lodlc surveys at least fixed intervals over
1I7the next five years Such surveys will provide scales that can
be used to measure social change and that can be used to compare
7Gordon H Wilson liThe Transformation of East Africa Basic Scale for Periodic Research (New York Basic Books Printer 1971) p 456
51
data from the three capital cities and also to compare the basic
data between the elite of the urban areas and probability samples
from selected rural areas
The pretests were carried out in Nairobi Kampala and
Dar-es-Salaam Each was based on a probability sample of 150
people stratified by age eighteen and over and education The
respondent must have had some secondary education In fact the
sample for the pretests were chosen on the same basis as the survey
described In the third part A probabilIty sample of this type
Is unavoid~bly composed mostly of males young adults who are
relatively wealthy engaged In the more skilled occupations and
professIons representing the politically and socially Important
members of the community It closely resembles the elIte described
In the second part of this chapter The research selected only
a few questions to Illustrate the possible value of the results
It Is patently evident however that though these one-shotll
results are
bull merely interesting or suggestive they will become significant and really helpful when comparative data are obtained over a period of time so that trends knowledge and public ftplnlon can be detected and measured by established scales
8 b t d p 456
Chapter 4
ANALYSlS OF DATA
The age of the elite of East AfrIca shows some sIgnIfIcant
differences among the four countries Table 5 on page 53 is the
percentage distribution by age If we disregard the not stated
categories the average ages are as follows Kenya 31-45 years
Uganda 36-40 years Tanganyika 31-35 years Zanzibar 41-45 years
East Africa 36-40 years
Table 5 shows the average age of elIte to be higher In
Uganda and Zanzibar than In Kenya and Tanganyika Uganda has 17
percent of elite over fifty years and ZanzIbar 28 percent whIle
4 percent cf elIte are In this age group In Kenya and Tanganyika
Later the analysis will reveal that one-third of the Uganda elite
are Baganda thus the explanation of the older average age may
be that Baganda has had a strong traditional centralized governshy
ment for many years and therefore posItions of power of authority
have been open to the Baganda for a much longer period than for
other East Africans The same explanation can apply to the elite
of Zanz rbar
The process of Africanlzatlon can be seen In Table 6 on
page 54 There Is a smaller percentage of Africans in the civil
service In Kenya than In the other two countries but a higher pershy
centage of elected and appointed representatives due to the regional
52
53
Table 5
East African Elite Age Factor By Percent
Kenya Uganda Tanganyika Zanzibar Total
Up to 25 years 5 1 1 2 3
26-30 years 18 15 18 8 16
31-35 years 26 15 21 5 17
36-40 years 21 20 20 9 20
41-45 years 12 16 11 17 14
46-50 years 4 8 8 5 6
51-55 years 2 9 2 10 4
56-60 years 1 4 2 8 3
61-65 years 1 3 - 7 2
66 and over a 1 - 3
Not stated 10 8 17 26 14
Total 100 100 100 100 100
Base 457 409 444 113 1423
a -shy Less than 5 percent
54
Table 6
East African Elite Occupation Factor Sample by Percentage Distribution
Kenya Uganda Tanganyika Zanz Ibar Total
Civi 1 servant 27 42 51 46 40
Electedappointed 41 34 23 10 31
Commerceindustry 12 10 9 19 11
Trade union politician 13 5 4 6 8
Education 6 6 7 a 7
Professional 3 I I 7 2
Cooporatlvestrade I I 3
Religiouswarfare 2 4 6 - 4
Agriculture I 2 1 3
Miscellaneous 2 3 3 2 3
Total 108 108 108 108 108
Base 457 409 444 113 1423
a -- In a few cases the same person qualified in more than one classification
55
form of government Kenya also has a higher percentage of elite
who qualify as trade unionists
There are several ways of describing occupations Civil
servants for example can be in medical education or other
services Table 7 on page 56 gives occupations of the elite
in East Africa by a different set of criteria
The Education Factor
Tabl~ 8 on page 57 shows that in the categories University
and above East Africa rates 25 percent--with Kenya 25 percent
Uganda 24 percent Tanganyika i9 percent and Zanzibar 32 percent
The high number in the last country is accounted for in Table 7
IIEast African Elite Where Educated A higher percentage were
educated in the United Kingdom and IndiaPakistan (52 percent)
because of lack of local secondary schools Another factor is that
a well established social class structure was part of pre-independence
culture The upper class in Zanzibar and to some extent those
among the Baganda could afford overseas education whereas those
from other countries were dependent on financial help from governshy
ment sources
There was a higher percentage of elected or appointed represhy
sentatives In Kenya and this category was not so highly educated
as the Icivtl servant of a ll others categories It can be seen
that there are more electedappointed representatives than civil
servants or others in the lowest categories of education In the
highest educational brackets we have more civil servants in the
elite of all three countries than in the other two classifications
55
form of government Kenya also has a higher percentage of elite
who qualify as trade unionists
There are several ways of describing occupations Civil
servants for example can be in medical education or other
services Table 7 on page 56 gives occupations of the elite
In East Africa by a different set of criteria
The Education Factor
Tabl~ 8 on page 57 shows that In the categories University
and above East Africa rates 25 percent--wlth Kenya 25 percent
Uganda 24 percent Tanganyika 19 percent and Zanzibar 32 percent
The high number in the last country is accounted for in Table 7
IIEast African Elite Where Educated 1I A higher percentage were
educated in the United Kingdom and IndiaPakistan (52 percent)
because of lack of local secondary schools Another factor is that
a well established social class structure was part of pre-Independence
culture The upper class In Zanzibar and to some extent those
among the Baganda could afford overseas education whereas those
from other countries were dependent on financial help from governshy
ment sources
There was a higher percentage of elected or appointed represhy
sentatives n Kenya and this category was not so highly educated
as the llcivll servant of lIa ll others ll categories It can be seen
that there are more electedappointed representatives than civil
servants or others in the lowest categories of education In the
highest educational brackets we have more civil servants in the
elite of all three countries than in the other two classifications
56
Table 7
East African Elite Specific Occupation Factor By Percent
Kenya Uganda Tanganyika Zanzibar Total
Education (administration) 5 4 6 7 5
Education (teacher) I 3 1 2 2
Medical practicing 4 5 3 5 4
Sciences 1 I I 2
Lawjudicial 1 6 2 8 2
Accountancy 2 1 2
Farmer 1 2 I 3
Entrepreneur 2 2 I 9 2
Senior executive 34 36 61 44 45
Junior administrator 7 14 14 3 1I
Legislator (only) 38 20 7 8 21
Partyunion officials 13 5 4 6 8
Editorsartauthors 1 1 I 5
Clergy senior 1 3 4 - 2
Others (unclassified) 2 5 3 2 3
-Base (all Africans
Interviewed) 457 409 444 113 1423
57
Table 8
East African Elite Education Factor By Percent (1972)
Educational Level Reached Kenya Uganda Tanganyika Zanzibar Total
No formal education
Attended junior secondary 22 13 8 21 15
Attended sen lor secondary 21 18 23 13 20
Obtained certificate of secondary 12 8 3 10 8
Obtained higher certificate high school a a a - a
Nonunlverslty technical studies 5 7 19 6 10
Nonunlverslty teaching studies 4 6 7 - 5
University studies non-graduate - 22 20 17 17
University studies 1st degree 17 15 16 26 17
Post-graduate university ma s te r I s deg ree 5 7 2 4 7
Post-graduate university studies higher degree 2 2 1 2 1
Not stated I - I I a
-Base (all Africans
Interviewed) 457 409 444 113 1423
a -- Less than 5 percent
58
Civil servants In Uganda are more highly qualified than In the
other three countries 59 percent have university education In
Kenya 56 percent In Tanganyika 42 percent and in Zanzibar 56
percent have university education Elected and appointed represhy
sentatives generally have less education In Kenya 22 percent
Uganda 37 percent and in Tanganyika 26 percent (Zanzibar could
not be tabulated) have university education Uganda Is still the
highest among the three countries
Country Where Ed~catlon Was Obtained
Table 9 on page 59 gives details about the country In
which the respondent was educated In his final year of education
It can be seen that the highest percentage of the elite were edushy
cated in local East African schools (58 percent) The United Kingdom
came next (28 percent) followed by the United States (7 percent)
IndiaPakistan and other African countries There are very sigshy
nificant differences between the East African countries however
which are worth noting Zanzibar and Uganda have many more elite
who were edycated overseas and in the United Kingdom particularly
than the other countries Kenya had fewer by 10 percent than
the next lowest which was Tanganyika
It would be a waste of effort to detail all of the East
African schools attended by the East African elite There were
nearly one ~undred What is significant however is to show that
out of this total only a few schools account for handful accounts
for more than 5 percent of the elite In each country and moreover
this handful accounts for a very significant percentage of the elite
59
Table 9
East African Elite Where Educated
Country Educated Kenya Uganda Tanzania Zanzibar Total
East Africa only 67 54 57 42 58
Afrlca--outslde East Afrt ca 3 4 4 1 4
The U S 8 5 8 2 7
The U K 18 38 27 38 28
IndiaPakistan 4 3 3 14 4
Austral la New Zealand a - - - a
Canada - a - - a
Western Continent Europe Ie Germany Norway 1 1 3 2 2
USSRChina or Eastern European Countries - - a - a
Elsewhere outside Afr lea
Not stated 1 - a 2
Total 103 106 100 100 100
Base (All AfrIcan Interviews) 457 409 444 113 1423
a -shy Less than 5 percent
60
The Factor of Rellslon
This survey did not Include Zanzibar and therefore the
paper Is unable to provide comparative figures for Zanzibar of East
Africa as a whole One would logically expect to find relatively
61
the same number of elite as the general percentage for the popushy
lation as a whole In each religious grouping
Table 10 on page 62 is complicated by the category among
the elite of Inormal Chrlstlan1I which did not appear In the first
survey This category has been added because many of the sophisshy
ticated Africans were educated In Christian schools so they do not
regard themselves as pagan and yet they do not belong to any formal
church The category IInormal Christian or simply Christian is
used to describe them We can generalize that fewer Moslems are
among the elite than one would reasonably expect from the above
figures particularly In Tanganyika Fewer Roman Catholics in
Kenya and Uganda are among the elite than one would reasonably
expect from the above figures about the proportions to be expected
Moslem education In East Africa Is less than education
among the other religions Protestant missions have been strongest
in education since earliest times In East Africa and this Is
reflected in Table 10 Even In government schools in the old colonial
tradition the Church of England as the state church dominated
the educational field In the British System and in England today
1Ireligion is taught along with the three Rl s This will explain
the larger number of Protestants In the population as a whole and
among the elite of Uganda and Kenya Zanzibar of course Is a
Moslem country Most of the 7 percent 1I0 ther ll in Zanzibar were
Bahal The white fathers of Tanganyika dominated the field of edushy
cation in early German times and remained a powerful force throughshy
out the Trusteeship period
62
Table 10
East African Elite Religion Factor Compared to Population Percentage
Kenya Uganda Tanganyika Zanzibar Total
Elite Othersa Elite Othersa Elite Othersa Elite Elite
Roman Catholic 21 29 25 34 26 28 4 22
Protestant 54 45 65 50 22 26 43
Moslem 4 16 3 10 16 39 88 14
Pagan 8 6 7
Normal Christian 15 2 24 13
Other 7
Not stated 6 2 5 1I 7
Total 100 100 100 100 100 100 100 100
Base 457 2400 409 2600 440 2000 113 1423
a -- The percentages for others is based on the probability sample (7000) of survey conducted by Fred G Burke Some grass-roots attitudes affecting political and social Intergratlon In East Africa paper delivered to the African Studies Association San Franclsco October 26 1963
63
The Factor of Voluntary Associations
The degree to which Individuals In African societies join
groups of voluntary association is a measure of social change The
comparison between the four countries which is given in Table 11
on page 64 shows significant differences between them Tribal
associations are much stronger in Kenya than elsewhere 21 percent
as against 2 percent to 8 percent In Zanzibar Tanganyika and Uganda
This underlines the felt need of the Africans of Kenya for security
among their own people in the face of Insecurities of the old
colonial system and Its concomitant privileged European and Asian
classes Nowhere else in East Africa was the position of the
settler or trader so strong Moreover political parties were
banned In Kenya on a national basis until comparatively recently
although district associations were encouraged by the administration
Kenya elite rate highest In political party membership (35
percent) as against 17 percent to 22 percent and trade union membershy
ship (20 percent) as against 5 percent to 12 percent
Uganda elite join more groups of voluntary associations
than the elIte of other countries The average Uganda elite has
membership In two groups Kenya 1-7 Zanzibar 1~6 and Tanganyika
1-5 Moreover the kind of groups that the Uganda elite support
are more sophisticated The Uganda elite rate much higher In
religious (16 percent) versus 6 percent to 9 percent professional
(15 percent) versus 4 percent and cultural (16 percent) versus
6 percent to 11 percent The Uganda elite Is only second to the
Zanzibar elite (42 percent) as members of social clubs (36 percent)
but significantly higher than the Kenya elite (23 percent) and the
64
Table 11
East African Elite Voluntary Associations Factor By Percent
Kenya Uganda Tanzania Zanzibar Total
Member of a tribal association 21 8 3 2 10
Religious societyunion 6 16 6 9 9
Business society 5 8 6 11 6
Professional society 9 15 4 15 9
Academic society 12 20 7 17 13
Political party 34 21 22 9 25
Charitable organization 5 13 12 42 10
Social club 23 36 25 9 29
Sporting club 6 16 11 15 11
Other organizations 11 4 5 10 8
Cultural organizations 6 16 11 10 11
Trade union 20 5 12 5 12
Belong to none 18 17 33 17 22
Total a 176 195 157 165 175
Base (All African interviews) 457 409 444 113 1423
a -- Many individuals belong to more than one group
65
Tanganyika elite (25 percent) One In three of the Tanganyika
elite (33 percent) does not belong to many voluntary associations
compared to only 17 percent or 18 percent for the elite who do not
belong to at least one society In the other East African countries
Business is presented equally in each of the four countries
Table 11 Is one of the most significant of the survey The
Uganda elite of whom one in three was Baganda have had University
at Kampala for many years It was once the only center for higher
education In East Africa Therefore culture In the western sense
was for many years a factor of influence on elite of Uganda which
was not available in either Kenya or Tanganyika
The Tribal Factor
The percentage of the elite In each country by tribe
compared to the percentage of the population represented by that
tribe should give an Interesting Index of the degree to which
the tribe has progressed and Indirectly of the Influence of Its
members
The first significant fact which emerges Is that 9 percent
called themselves Tanganyikansll and would not use the label tribe 11
We can only assume that the actual percentage by tribe of this group
Is about the same as described In Table 12 on page 66 with the
obvious Inclusion of some who are of mixed percentage The most
significant fact Is that there were 30 percent who belonged to Kenya
tribes 2 percent Ugandans and 5 percent Zanzlbarees No other
East African country had as high percentages In these categories
That amounts to 37 percent who were of tribes other than those of
66
Table 12
Tanganyika ElIte by TrIbal Group
Tri be Percent of PopulatIon Percent of ElIte
Sukuma 19 3
Nuyamwerl 7 2
Hakonde 6
Haya 6 7
Chagga 6 12
Gaga 6
Ha 5
Hehe 4 1
Nyakusa 4 3
Wguru 4
Sambaa 3
Zaramo 3
Yao 3
Hwevu 2
Others (Less than 2) 13 22
Stated Tanganylkan 9
Kenyan Tr t bes 30
Uganda TrIbes 2
Zanzlbaree 5
Toeal 100 100
Base 10204000 (1973) 444
67
Tanganylkans The major tribe the Sukuma represents one in five
of the Tanganyika population yet has only one In thirty-three
among the elite There are twice as many Chagga among the elite
as their tribal percentage would warrant Surprisingly the Haya
have more than their share although all the rest have fewer except
the ve ry sma 11 Ilothe r ll t r i bes who have nea r 1y tw Ice as many
In Uganda we would expect to find the Baganda over represhy
sented in the elite (see Table 13 on page 68) They have like
the Chagga twice as many (33 percent) as the tribe percentage would
warrant (162 percent) An even higher percentage 28 percent
claimed to be IIUgandans a classification not recorded in the official
census figure Only 1 percent are from Tanganyika and 1 percent
from Kenya Unlike Tanganyika the smaller tribes which each
represent less than 1 percent each of the population have only
half as many elite (6 percent) as their combined percentage (94)
would expect Tanganyika had twice as many The Watoro was the
only other tribe In which the percentage of the elite exceeded
that of the tribe 4 to 32
Kenya Is unique In that there are several tribal groups
that exceed their quota of elite and by almost the same ratio (see
Table 14 on page 69) The Luhya have a slight margin by ratio
over Luo and Kikuyu The Kamba Mero and Embu related tribal
groups are all seriously under their expected percentages Like
Tanganyika but unlike Uganda the small tribal groups--each of
less than 3 percent of the total population but represent 161
percent of It--have 22 percent of the elite A high percentage
of this group of the elite are from the numerous coastal tribes
68
Table 13
Uganda Elite by Tribal Group
Tribe Percent of Population
-Baganda 162
Banyonkole 8 I
Teso 8 I
Basoga 78
Baklga 7 I
Lango 56
Baglsu 5 I
Acho I I 44
Lugbara 37
Wator i 32
Banyaro 29
Karamujong 19
Alur 14
Banyole
Kuma 94
Others (Less than 1) -Not stated
Stated Ugandan -Kenyan tribe
Tanganyika tribe
Total 1000
Base 7367558 (1973)
Percent of Elite
33
3
3
4
2
3
3
4
3
6
28
100
409
69
Table 14
Kenya Elite by Tribal Group
Tri be Percent of Population Percent of Elite
-Kikuyu
Luo
Luhya
Kamba
Meru
Kis i i
Embu
Klpsigis
Nandi
Others (Less than 3)
Stated Tanganyika
195
144
125
117
69
49
39
3
22
16 1
23
19
19
6
2
3
2
22
2
Total 1000 100
Base 9204000 (1973) 457
70
Table 15
Question
What in your opinion is the most important problem facing our country at the present time
Na i rob i Dar-es-Salaam Kampala Total
Education
Poverty-famine
Unemployment
Economic development
High cost of living
Border disputes Inter-African disputes
Pol itical instabi 1ity
Tr i ba 1ism
Land apportionment
Publ ic laziness
Other problems
Don1t knownot stated Refused to answer
22
13
41
6
10
3
2
3
2
2
29
24
6
24
3
6
4
2
28
18
18
12
9
5
3
2
5
3
27
19
18
14
8
3
3
4
2
Total 109 105 105 105
Base 389 451 395 1235
71
Table 16
Question 2
All things considered how satisfied are you with your present standard of 1ivlng--very satisfied fairly satisfied
somewhat dissatisfied or very dissatisfied
Nairobi Dar-es-Sa1aam Kampala Total
Very satisfied
Fairly satisfied
Somewhat dissatisfied
Very dissatisfied
Don I t know
Refused to answer
6 13 4 8
32 50 25 36
32 26 37 31
29 11 32 24
Total 100 100 100 100
Base (a 11 intervi ews) 389 451 395 1235
72
Table 17
Question 3
Do you think political matters should be left to the government or should people like yourself take
some active part in political affairs
Nairobi Dar-es-Salaam Kampala Total
Left to government 26 24 13 21
People to take an active part 72 72 73 72
Other answers 4 2
Dont know 2 8 3
Refused to answer 2 2
Total 100 100 100 100
Base 389 451 395 1235
73
Table 18
Question 4
Which one of the following do you think our country needs most at the present time more schools more hospitals
more housing more factories or more roads
Nairobi Dar-es-Salaam Kampala Total
More schools 40 44 51 45
More factories 40 37 28 35
More hospitals 17 10 15 14
More housing 1 6 5 4
More roads 2 3 1 2
Don I t know
Total 100 100 100 100
Base 389 451 395 1235
74
Table 19
Question 5
Now which one do you think our country needs most an honest government without corruption a government that gets things done fair distribution of wealth
national unity or individual freedom
Nairobi Dar-es-Salaam Kampala Total
An honest government wIthout corruption 44 38 51 44
A government that gets things done 23 18 17 20
National unity 22 20 17 19
Individual freedom 6 14 6 9
Fair distribution of wealth 5 9 8 8
Don I t know
Refused to answer
Total 100 100 100 100
Base 389 451 395 1 235
75
Table 20
Question 6
Which do you prefer--government ownership or private ownership of major industries
Nairobi Dar-es-Salaam Kampala Total
Government ownership 51 43 38 44
Private ownership 38 38 31 36
Mixed (voluntary answer) 10 18 29 19
Don I t know
Refused to answer - - 1shy
Total 100 100 100 100
Base 389 451 395 1235
76
Table 21
Quest Ion 7
As you know there are many different ways In which African states can establish closer ties among themselves Which of the
following ways would you favor an organization for settling disputes between African governments
closer economic relations political federation African military
organization cultural exchanges
Nairobi Dar-es-Salaam Kampala Total
Favor 94 96 85 92
Oppose 3 3 9 5
Don I t know 2 1 4 2
Refused to answer 1 - 2
Total 100 100 100 100
Base 389 451 395 1235
-Closer economic relations 22 49 53 41
Political federation 26 39 27 31
An organization for settling disputes between African governments 34 32 15 28
An African military organization 15 18 11 15
Cultural exchanges 3 10 3 6
Don I t know
Total 100 149 110 121
Base 366 432 337 1135
77
(8 percent) only 2 percent are Tanganylkans and the Ugandans did
not rate statistically
ELITE OPINIONS AND ATTITUDES
Not only does Scale 1 Table 22 Illustrate a sound basic
knowledge of modern methods to prevent crops from being damaged
It also Illustrates a similarity of knowledge between the three
sample areas which are widely separated geographically Scale 1
will be Invaluable when comparing the results of our first rural
study the field work of which has been completed and Is at the
stage of processing
Table 22
Scale
It does not help much to try to prevent crops being damaged by Insects and diseases such losses can
never really be prevented
Kampala Dar-es-Salaam Nairobi East Africa
Agree 8 12 12 11
Disagree 88 85 87 86
Uncertain 4 3 3
Base 153 156 150 459
Scale 2 Table 23 on page 78 also Illustrates but not
so conclusively similarities between the three areas Nairobi
had 17 percent agree whereas Dar-es-Salaam had only 10 percent
with Kampala somewhere Inbetween One could say therefore that
78
there Is a higher degree of tribalism among the elite of Nairobi
than among the elite of Dar-es-Salaam
Table 23
Scale 2
A man should never marry a woman who does not belong to hIs tribe
Kampala Dar-es-Salaam Nairobi East Af rl ca
Agree 12 10 17 13
Disagree 81 83 80 82
Uncertain 7 7 3 5
Base 153 156 150 459
While Scale 3 Table 24 shows a similarity between the
three areas It shows that the respondents of Nairobi are much
Table 24
Scale 3
People have It within their power to bring harm and misfortune to others through magic
Kampala Dar-es-Salaam Nairobi East Africa
Agree 26 28 30 28
Disagree 45 46 61 51
Uncertain 29 26 9 21
Base 153 156 150 459
79
more sophisticated In regard to magic than in the other sample
points and that fewer are uncertain A significant number In each
area however believe that magic can be used to bring harm and
misfortune to others
Scale 4 Table 25 shows a consensus between the three
areas but shows an over all unfavorable knowledge about science
and knowledge The majority 83 percent believe that many imporshy
tant matters can never be positively understood by the human mind
The question can provide a very useful comparison In changing patterns
of knowledge regarding science In the future
Table 25
Scale 4
Science and knowledge are useful of course but many important matters can never be positively
understood by the human mind
Kampala Dar-es-Salaam Nairobi East Africa
Agree 80 79 86 83
Disagree 9 12 13
Uncertain 11 9 6
Base 153 156 150 459
Scale 5 Table 26 on page 80 shows an unfavorable public
opinion about the role of traditional chiefs and the dichotomy caused
by loss of status in recent years by traditional chiefs whose roles
have been largely taken over by the political appointee of the
ruling party The question will also provide useful comparative
80
data between ruralurban areas and will be useful In the future to
measure changes in attitudes and opinions about traditional chiefs
Table 26
Scale 5
A man ought always to obey his traditional chief
Kampala Dar-es-Salaam Nairobi East Africa
Agree 42 38 45 42
Disagree 42 46 49 46
Uncertain 15 16 6 12
Base 153 156 150 459
Scale 6~ Table 27 not only shows an area of new problems
for East African elite but also the wide divergence of response
Table 27
Scale 6
Government and politics are so complicated that the average man cannot really understand what Is going on
Kampala Dar-es-Salaam Nairobi East Africa
Agree 81 65 72 72
Disagree 16 24 22 21
Uncertain 3 11 6 7
Base 153 156 150 459
81
between the three sample points In Kampala 81 percent agree
with the statement and only 3 percent are uncertain whereas In
Dar-es-Salaam 67 percent agree while II percent are uncertain
The statement will provide a useful measure In future of the attl shy
tude of the elite toward government In each of the three sample
points
Scale 7 Table 28 Is a new problem of Investment and
saving which as you can see has brought out differences between
the three sample points and will provide In the future a useful
measure of changing attitudes toward savings and the postponement
of rewards
Table 28
Scale 7
If I had the choice I would prefer to be given a small sum Immediately rather than be promised a very
large sum one year from now
Kampala Dar-es-Salaam Nairobi East Africa
Agree 62 54 62 60
Disagree 24 37 30 30
Uncertain 14 9 B 10
Base 153 156 150 459
There are other examples above of similarities and dlsshy
similarities which are even better than Scale 8 Table 29 on page 82
It does show however a close correspondence between Kampala and
Nairobi while Dar-es-Salaam shows a more tolerant attitude In
82
their response to this statement Once again the comparison between
urban and rural areas should show an Interesting and significant
difference
Table 29
Scale 8
A womans place Is in the home
Kampala Dar-es-Salaam Nairobi East Africa
Agree 45 36 45 42
Disagree 46 61 51 52
Uncertain 9 3 4 5
Base 153 156 150 459
Scale 9 Table 30 shows significant statistical differences
between the response from Kampala and those of the other two sample
Table 30
Scale 9
The traditional ways of the past are the best
Kampala Oar-es-Salaam Nairobi East Africa
Agree 15 33 33 27
01 sag ree 68 58 56 61
Uncertain 17 9 11 12
Base 153 156 150 459
83
points This fact Is even more Interesting when we know that in
Uganda the present form of government has been designed to maintain
the traditional ways of the past whereas In the other two areas
the present government has been designed to change politically
at least traditional ways The reactions of the Kampala respondents
therefore are a significant Indication of their dissatisfaction
with efforts to maintain traditional ways
Scale 10 Table 31 also Illustrates that Kampala has a
different reaction than the other two sample points although there
are less significant differences between Dar-es-Salaam and Nairobi
Table 31
Scale 10
The present Is all too often full of unhappiness It Is only the future that counts
Kampala Dar-es-Salaam Nairobi East Africa
Agree 29 50 60 46
Disagree 44 27 32 34
Uncertain 21 23 8 20
Base 153 156 150 459
Scale 11 Table 32 on page 84 Is a really significant
Indication of the basic dissatisfaction of the Kampala respondents
with the status quo The dissimilarity was also reflected in
Scale 10
84
Table 32
Scale 11
The government Is doing all It can to develop our country
Kampala Dar-es-Salaam Nairobi East Africa
Agree 51 86 84 74
Disagree 21 5 10 12
Uncertain 28 9 6 14
Base 153 156 150 459
Chapter 5
SUMMARY AND CONCLUSIONS
The purposes of this study were to
1 Analyze the factors which have slowed the economic
development of East African communities
2 Identify the major problems encountered In economic
systems In East Africa
3 Determine the problems in developing the economic growth
of the community
4 Identify economic reconstruction needs
All the published materials listed below were extensively
reviewed The review Included library research over both periodicals
and some relevant studies The writing of this report Is thus based
on the Information provided by the following documents
1 Periodicals books pamphlets mlcroflshe from the
William Allen White Library of the Emporia Kansas State College
2 Xeroxed materials and books that were secured through
the Inter-library loans
3 Report collected by the Marco Survey Ltd Nairobi
4 Periodicals Issued by the Information section of the
Embassy of the Republic of Kenya Washington D C
In order to determine the social and economic problems of
East Africa a questionnaire-Interview method was used In total
85
86
1423 elites were I~ervlewed Approximately 6 percent of the
elites listed for interview refused to be interviewed
The Interviews were conducted by permanent senior research
assistants
The data collected were compiled (using standard codes to
clarify the data and computer cards were punched for BO-column
I C T data processing equipment In Nairobi) summarized and
interpreted
Finally conclusions were reached
SUMMARY
British East Africa was the name applied to the territories
in East Africa before It achieved Its Independence The territories
cover a total area of 682469 square miles which was divided into
three parts Kenya Uganda and Tanganyika They all became indeshy
pendent by 1963
The communities continued economic ties among each other
and on June 6 1967 at Kampala the three member nations signed
a treaty which was to re-establish the community
East Africa enjoys a great deal of economic advantages
l It borders the Indian Ocean which provides a cheap means of
exporting and ImportlDg goods 2 It Is a meeting point for trade
(east and central African trades)
East Africa Is divided Into five geographic regions (which
provide a variety of climates)
1 coast region
2 Nylka region or Savanah region
87
3 East and West Highlands
4 Lake Victoria region
Due to the Influehce of the cultural traditions the subshy
slstance element in East African economics is still dominant This
is evident in most of the rural areas The public sector of East
African community plays a very great part In developing the economy
The public sector Is expected to be major employers In the community
and Is expected to provide free public services--free school free
medical services free or subsidized public utilities and housing
On an average scale the population of East Africa is yet
low A clear study shows this Is not true In some locations which
are densely populated varying from two hundred to five hundred
people per s~ure mile The population In urban cities of East
Africa Is still low and the people do not consider cities to be
their home Details show that the major East African cities have
over 50 percent of all the urban population while the minor cities
are far less than 50 percent of the total urban population
Standardization of East African people Is too difficult
due to the fact that the population Is composed of a variety of
sub-races whose traditions differ from each other among the tribes
The sub-races classified are
1 Nilotes
2 Nilo-Hamltes
3 Inter-cush Ite
4 Bantus
Based upon the sub-races of East African people the traditional
heritage carried frnom one generation to the other makes the economy
88
of the community hard to work In Perhaps even more important on
the economic outlook is the Inheritance of continuing extended
family contrasts In age and sex
The study shows that trading Is an extremely important
economic activity even though it Is not Itself productive The
trade Itudy has shown that trade has been playing a smaller part
in East Africa and for those operating Its economic efficiency is
very low The greatest part of trading activities is located in
the major East African cities This conclusion has led to the fact
that the majority of the people are living In rural areas where
means of traveling to cities are difficult for them and the lack
of money has probably created the situation where people have to
live subsistently
CONCLUSIONS
The conclusions of the survey of literature and the analysis
of findings follow
Survey of Literature
If It Is correct as suggested by Kamark that the economic
lives of rural Africans are not Influenced by environmental conshy
dltlons more than by cultural disposition then this would mean
that the Introduction for new technology should bring about economic
changes relatively unhIndered by cultural conservatlsm1 That
Is to say the potentIalIties of natural resources can be more
IKamark M Andrews The Economics of African Development (New York Praeger Incorporated 1967) p 79
89
effectively tapped by the Introduction of new methods and undershy
standing and new forms of organization of production It may be
objected that this In fact has not occurred In East Africa and
precisely some would say because of limitations of cultural
conservatlsm 11 But closer studies quite strongly suggest that
where people can see the advantages to themselves of economic changes
2that are both feasible and safe then the changes do occur Thus
African people have accepted changes first and most radically (indeed
they have often deliberately sought them) In the more favorable
areas where the possibilities of new technology and new Ideas are
more readily applicable and where people are exposed to external
influences and have access to modern communicatIons and living styles
The type of national economic progress which is to emerge
the longer-term political goals the roots of nationhood In the
multiplicity of subcultures and naturally uneconomical tribal ties
out of which national culture is forged remain the crucial unanswered
questIons whIch affect the economic progress of East Africa
Analysis of Findings
The results of the analysis has shown that the elite of
East Africa have advanced to a more desIrable socloeconomlc way
of thinkIng ThIs conclusion has led the author to suggest that
perhaps the integrating forms of tribes can be worked out beginning
with the East African elite for however much too depends ultimately
on local and tribal support they have more chance to see above
2 Ibid p 98
90
the disadvantages of these functions The middle class is still
small flexible mobile and unstable not yet clearly or acceptably
dlfferentl~ted from strata above or below The mass of unskilled
workers are the most temporary and the least Involved If no efforts
or attempts are applied the society will inevitably continue to
live In their life of ethnically based networks and subcultural
pockets
16
AHdflJ )O 118 18
BIBLIOGRAPHY
Abraham R G East African Townshipl in A W Southhall (eds) Social Change In Modern Africa New York Oxford University Press 1970
Baver P T and B S Ymey The Economics of Under-developed Countries C U P Cambridge University Press 1957
Blacker E A Demography New York Oxford University Press 1948
Ethographic Survey of Africa East Central Africa London International African Institute 1970
Boesch H A Geography of World Economy Van Nostrand Princeton University Press 1964
Brown L H in E W Russell (ed) The Resources of East Africa Nairobi Literative Bureau 1968
Burke G Fred Africanls Quest for Order Englewood Cliffs New Jersey~ Prentice Hall 1964
The Economics of Underdeveloped Countries New York OxfOrd University Press 1972
Cley and P Robson IFederation of East Afrlca11 Structure and Administration of E A C S O New York Oxford University Press 1964
Doob W Leonard Periodic Surveys in Subsaharan Africa Nairobi Nairobi Publishing House 1970
East African Community Annual Report Nairobi Kenya Government Press 1966
Economic and Statistical Review Nairobi The East African Statlsshytlcal Department 1964 _
Encyclopedia Americana East Africa Vol 4 1974
Encyclopedia Brltanlca East African Community University of Chicago Macropedla Vol I II 1974
Goldthrope J E and F B Wilson Tribal Maps of East Africa and Zanzibar Kampala East African institute of Social Research 1966
92
93
Good M Cha~les Jr Dimensions of East African Cultures New York Oxford University Press 1970
Gulliver P H Labor Migration in a Rural Economy Kampala E A I S R 1955
Harlow V and E M Chi lver History of East Africa Vol II Oxford Clerendon 1962
Hawks D A IIEast Afrlca1I Trade and Industry Official Journal of Association of East African Industries Nairobi Nairobi Publishing House 1963
Hopkins Elizabeth IIConflict of Tribal and Racial Conflict in Stanley and Burke (eds) Transformation of East Africa New York Basic Books Printers 1966
Industrialization in East Africa 5th Edition Nairobi United Africa Press 1966
Jamal A H The Critical Phase of Emerged African States Afalrasl East African Publishing House 1965
Johnson B F The Staple Food Economics of Tropical Africa Stanford California Stanford University Press 1970
Johnson D H Rainfall in East Africa Q F R Vol 5 Nairobi East African Publishing House 1968
Jones Carey Geographical Journal Vol 131 Part 2 New York Oxford University Press 1965
Kamark M Andrew liThe East African Community The Economics of East African Development New York Praegam Incorporated 1971
Kenya Chamber of Commerce Trade Nairobi Kenya Government Press 1973 --~
Lewis William Allen The Theory of East African Literature Nairobi Bureau Annual Report 1965-6
Morgan W T W IIEast Africa Its People and Resources II People New York Oxford University Press 1969
Morgan W T W and N M Shaffer Distribution and Density New York Oxford University Press 1970
Myrdel Uninnar An International Economy Problem and Prospects New York Harper 1969
OConner A N An Economic Geography of East Africa New York Preager 1966
94
Oxford Economic Atlas East African Community New York Oxford University Press 1972
Reed Moyer and Hullanderc Stanley Markets In Developing Economies Illinois R D Irwin 1968
Republ ic of Kenya Newsletter Washington D C 1975 Vol 3 No5
Richard A I Economic Development and Tribal Change Nairobi East African Publishing House 1969
Rosberg A and A Segal East African Federation Internatlonal Conciliation 1963
Samson H W The Climate of East Africa Nairobi Memoirs Vol II I No2
Schneider in W R Bascom and M J Herskovits Continuity and Change in East African Cultures Chioago University of Chicago Press 1959
Seggerson E P Physiography of East Africa Nairobi Press 1962
Southhall A W Growth of Urban SocletyI Dar-esmiddotSalaam New York Oxford University Press 1969
The East African East African Common Services Report Nairobi Kenya Government Press 1966
Thompson B W The Climate of Africa Nairobi Oxford University Press 1965
UNESCO Populatlon Movements in East Afrlca in K M Barbour and R M Prethere (eds) Essay on African Population Routledge and Kegan New York Oxford University Press 1961
Walder D Problems of Economic Development of East Africa In E A G Robinson (ed) Economic Development of South Sahara London McMillan 1964
Warren J Keezan International Marketing Less Developed Countries Englewood Cliffs New Jersey Prentice Hall Incorporated 1974
Wilson A M Social Change In Modern Africa New York University of Oxford Press 1961
Wilson M Gordon liThe Transformation of East Africa Basic Scale for Periodic Research New York Basic Books Printer 1971
S6
XION3ddf
bull
96
URSAN CENTERS
- bullbullbullo1
IL RUdDIf---J -
( L KENYA I
I I I
hlo10bull I I J
- Tllo
Tflgflylfl
-Dodo TAN3ANYllltA
It
bull Imp ~1 bull
JII
~ ~t - bullKlIer
~ ~ JIOlJLAIO
~ ~~ ~ (0 C~CV ~oo Lindl ~ a CO (1(( 00(tOO
c ~tCC a oocmiddot ~~ L Ny ~tWllra1 c ~~(V( 0 ~J(JC~ ~ l(l~5 7~ ~~~~ i~j~) ~J r =X 0 1 ~O _-A- J 0 100 bull - -
mil bull~~ ~__-- _ llo
l6
bull
o
MII bullbullbullbullbullbull bullbullbullbullbullbulll1li bull bull ~ =
middot1
bullbullbull bullbull~ pound
-w
)
umiddot~middot middotmiddotMI
c
gt amp c o
ImiddotUmiddotmiddot middotmiddot0 L
1 bull l
)
L
~
middotmiddotmiddotmiddot1 L
~
~
1 ~
~ ~ I ~ L ~
i 1 middotmiddotmiddotrmiddotmiddotI bull bull ~
I r j L
-r Y
I~ bull CL -J II w 1
VINVZNVl
eII_
fbullbull bull~1
~ r
z
c
o
11Ie
) 11111_0 -shy
N a n s
~______
middot~middot(1 -bullbull
__rr~)
I
I
I I I
~ I ~
I I I ~ I
vaNv~n
66
o
1 IIit
c
Cl
S iII III J
Ibullbullbull middot1t-11 1 114bullc ~~1
bull
001
INZN1L
10 l
r
01 bull 1middot ) l pltllI1 -tpn I I c
o
z
o
bull
J I
lt
- Njoroge 1975
- Njoroge 1975 pt2
-