the main factors affecting on value of maximum power point photovoltaic model using a...
TRANSCRIPT


Ali Jasim, National Aerospace University “Kharkiv Aviation Institute”, Postgraduate Student,
Yuri Shepetov, National Aerospace University “Kharkiv Aviation Institute”, Associate Professor, Candidate of Science
The main factors affecting on value of maximum power point photovoltaic model using a matlab/simulink Abstract: A Matlab-Simulink based simulation study of photovoltaic (PV) cells
is carried out and presented in this paper. The study is helpful in results showed that Maximum Power Point (MPP) strongly depends on sun irradiance, shunt resistance, series resistance, temperature and ideal factor. These results might be used as a guide for PV system users.
Keywords: PV model parameters, Solar Cell Model, MPP, Insolation, Ideal Factor, Fill Factor, Power Conversion Efficiency (PCE), Matlab/Simulink.
1. IntroductionThe development of new energy sources is continuously enhanced because of
the critical situation of the chemical industry fuels such as oil, gas and others. The evolution of renewable energy over the past decade has surpassed all expectations. Global installed capacity and production of all renewable technologies has increased substantially, and supporting policies have continued to spread to more countries in all regions of the world. In fact, the demand for solar energy has increased by 20% to 25% over the past 25 years [1]. The market for PV systems is growing worldwide. In fact, nowadays, solar PV provides around 500 GW. Between 2015 and 2020 [1], grid connected PV capacity reached 21 GW and was increasing at an annual average rate of 77% [1]. By 2050, solar power is anticipated to become the world's largest source of electricity, with solar photovoltaics and concentrated solar power contributing 16 and 11 percent, respectively. In order to get benefit from the application of PV systems, research activities are being conducted in an attempt togain further improvement in their cost, efficiency and reliability. With no pollutant emission, Photovoltaic cells convert sunlight directly to electricity.

Typically, a PV cell generates a voltage around 0.5 to 0.8 volts depending on the semiconductor and the built-up technology. There are several studies which dedicated to calculate the MPP under various conditions using MatLab/ Simulink. The focus of this paper is on solar cell modelling which is discussed in section two. Section three presents the Model of the Solar PV Module. In section four, Environmental parameter variation of PV Module is investigated. Essential PV Module Parameter Variation of PV Module has been presented in section five. Finally, conclusions are made in section six.
2. PV cell modelA solar cell basically is a p-n semiconductor junction. When exposed to light, a
DC current is generated. The generated current varies linearly with the solar irradiance.
To understand its behavior, we used a well-known equivalent circuit of the solar cell. It is called one diode model as displayed in Fig. 1. It consists of a photo current, a diode, a parallel resistor (Rsh) expressing a leakage current, and a series resistor (Rs) describing an internal resistance to the current flow [2-4]. The standardequivalent circuit of the PV cell is shown in Fig. 1.
Fig. 1. Equivalent Circuit of a PV Cell
The basic equation that describes the (I-V) characteristics of the PV module is given by the following equation:
(1)
Where:Iph Photocurrent (A);
Id
Rs
V+
Ipv
-Isc( Iph )
Rsh
Ish

IS Diode saturation current (A); q Electron charge 1.6 10-19 C;kB Boltzmann's constant 1.38 10-23 J/K; T Cell’s temperature in Kelvin; n Ideal factor; Rsh Shunt resistance (Ohm); Rs Series resistance (Ohm); VPV Panel voltage (V).
As a result, the complete physical behavior of the PV cell is in relation with Iph,Is, Rs and Rsh from one hand and with two environmental parameters as the temperature and the solar radiation from the other hand.
When Rsh and RS =0, the model reduces to an ideal model [4]. However, the ideal model is so simple to represent real system. Thus, we used the one diode model in our calculations.
3. Model of the Solar PV ModuleThe mathematical model of the PV module current (I) in equation (1) is
developed by MatLab/Simulink as in Fig. 2. The effect of different parameters including solar irradiance, cell temperature, internal resistance, identity factor, and saturation current on the power-voltage and current-voltage characteristic curves of solar module are studied in the following subsections using the model [2-4] in Fig. 3.
Fig. 2. Simulink model of the solar PV module current Ipv
Ipv
Vpv
PV panel
Ppv
T
G
Irradiance(W/m2)
Temperure[ K ]
25+273
s ps
ps s
ps s
Ramp
Electrical Reference
F(x) = 0SolverConfiguration
X 0.514
0.025
20.02
100
VIpv
DiodeControlled CurrentSource
Current Sensor
Variable ResistorVoltage Sensor

4. Environmental parameter variation of PV Module 4.1 Solar Radiation Variation (G) Fixing all other parameters, we notice that the effect of radiation variation on
the characteristic curves of the solar modules in Fig. 3 (a) & Fig. 3 (b). The P-V and I-V characteristic curves are plotted for solar irradiance equals 400, 600, 800 and 1000 W/m2. The Fill Factor (FF) is defined as Eq. 2
MP MPT SC OC
I VMPPFF= =P I V . (2)Where MPP is the power calculated at maximum current value IMP and
maximum voltage value VMP, and PT is the power calculated at short current value ISCmultiplied by open voltage VOC. We conclude from Fig. 3 that the PV cell current and MPP are highly dependent on solar radiation. The Power Conversion Efficiency (PCE) is the ratio of the electrical power output Pout can be taken to be MPP, compared to the solar power input Pin into the PV cell defined as Eq. 3. The capacity of PV cell can be estimated by knowing, Fill Factor (FF) and Power Conversion Efficiency (PCE) [3].
outin in
P MPP MPPPCE= =P P ACG (3)Where G is the solar intensity per square meter and AC is the area on which
solar radiation falls (m2). When the irradiance increases the output current increases, the open-circuit voltage increases slightly, and the short circuit current increases. MPP increases also FF& PCE increases as irradiance increases. From the figures we notice that MPP at standard irradiance 400 W/m equals 15.1 W and increased to 40.5 W at 1000 W/m . Thus, we conclude that as irradiance increases the output power increases too.
4.2 PV Module Temperature Variation (T) For a constant irradiation 1000 W/m , we can notice the effect of temperature
variation on the characteristic curves of PV module as shown in Fig. 4 (a) and (b). The temperature is given values equal 25 C, 50 C, 75 C and 100 C realize that the voltage is highly dependent on the temperature. When the cell temperature increases, the ISC increases slightly, the VOC decreases and MPP decreases and FF& PCE decrease too.
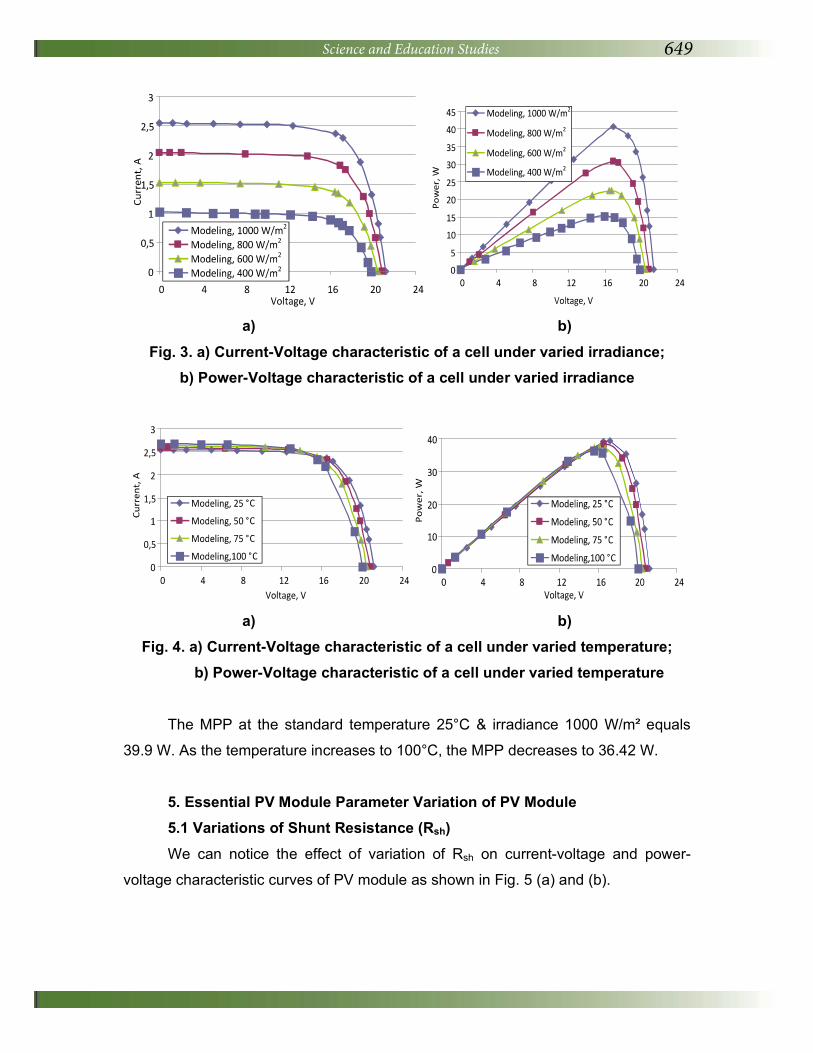
a) b) Fig. 3. a) Current-Voltage characteristic of a cell under varied irradiance;
b) Power-Voltage characteristic of a cell under varied irradiance
a) b) Fig. 4. a) Current-Voltage characteristic of a cell under varied temperature;
b) Power-Voltage characteristic of a cell under varied temperature
The MPP at the standard temperature 25° & irradiance 1000 W/m equals 39.9 W. As the temperature increases to 100° , the MPP decreases to 36.42 W.
5. Essential PV Module Parameter Variation of PV Module5.1 Variations of Shunt Resistance (Rsh)We can notice the effect of variation of Rsh on current-voltage and power-
voltage characteristic curves of PV module as shown in Fig. 5 (a) and (b).
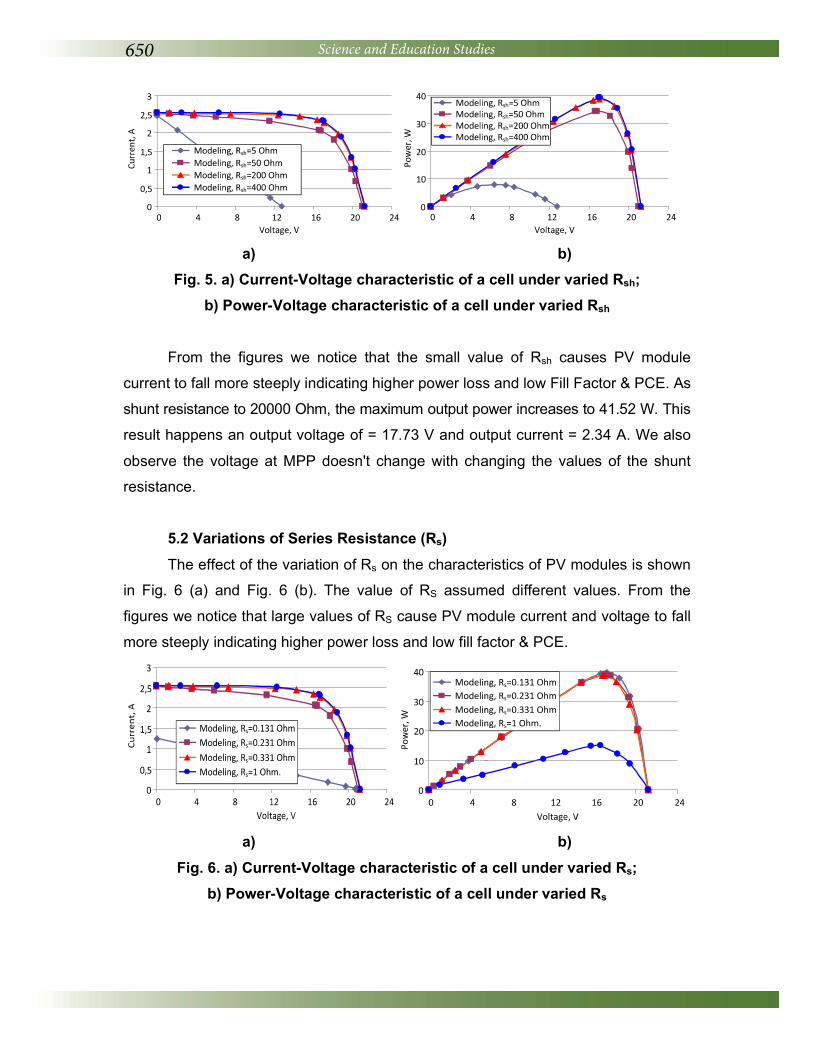
a) b) Fig. 5. a) Current-Voltage characteristic of a cell under varied Rsh;
b) Power-Voltage characteristic of a cell under varied Rsh
From the figures we notice that the small value of Rsh causes PV module current to fall more steeply indicating higher power loss and low Fill Factor & PCE. Asshunt resistance to 20000 Ohm, the maximum output power increases to 41.52 W. This result happens an output voltage of = 17.73 V and output current = 2.34 A. We also observe the voltage at MPP doesn't change with changing the values of the shunt resistance.
5.2 Variations of Series Resistance (Rs)The effect of the variation of Rs on the characteristics of PV modules is shown
in Fig. 6 (a) and Fig. 6 (b). The value of RS assumed different values. From the figures we notice that large values of RS cause PV module current and voltage to fall more steeply indicating higher power loss and low fill factor & PCE.
a) b) Fig. 6. a) Current-Voltage characteristic of a cell under varied Rs;
b) Power-Voltage characteristic of a cell under varied Rs

Thus, series resistance must be low, if we take it into consideration. The MPP at series resistance 0.131 Ohm equals 39.9 W at the output voltage 17.21 V and the output current 2.64 A. As the RS increase to 0.231 Ohm MPP decrease to 38.1 W at the output voltage 17 V and output current 2.3 A. When series resistance increases to 1 ohm, the MPP decreases to 13.83 W at an output voltage equals 15.54 V and output current equals 0.89 A.
5.3 Variations of Ideal Factor (n) With slight modifications Simulink model, the I-V and P-V characteristic with
the changing value of n shown in Fig. 8 (a) and Fig. 7 (b). From the figures we notice that as the value of ideal factor increases, the value of the MPP, FF and PCE decreases. Also, we notice that the open circuit voltage decrease while short circuit current doesn't change as ideal factor decreases.
a) b) Fig. 7. a) Power-Voltage characteristic of a cell under varied ideal factor.
b) Current-Voltage characteristic of a cell under varied ideal factor
5.4 Variations of Saturation Current (Is)The model helps in expecting the behavior of the PV cell for different reverse
saturation currents of the diode. The curves in Fig. 8 (a) & (b). Is varies as shown in Table 6 decreases from 2 10-6A to 2 10-1A.
From the figures, we notice that as the value of Is increases, the MPP, FF, PCE and the open circuit voltage decreases, and the short circuit current doesn't change.

a) b) Fig. 8. b) Current-Voltage characteristic of a PV cell under varied Is;
b) Power-Voltage characteristic of a PV cell under varied Is
6. Conclusion In this research, A Photovoltaic model is easy to be used MatLab/Simulink to
study the effect of different parameters on the performance of PV module including solar irradiance, temperature, shunt and series resistances, ideal factor and saturation current. The simulation used one diode model and parameters are taken from Si PV cell manufactured by Siemens Corp. The results show that when the irradiance increases the MPP, Vpv, Ipv, Voc, Isc and PCE increases but FF decreases. The temperatures of the PV array increases that means MPP decreases, the short circuit current increases slightly and the open circuit voltage decreases. Also, we notice that shunt resistance must be larger to increase output power, Fill Factor and PCE. Thus, small values of Rsh cause PV module current to fall more steeply indicating higher power loss and low Fill Factor & PCE.
While small values of RS cause PV module current and voltage to higher power and higher Fill Factor & PCE. Thus, to maximize the output power of the module, the series resistance must be low. Moreover, MPP increase as Ideal factor increases and saturation current increases. The results can be used as a guide for the solar system users.
References: 1. “Global Market Outlook for Solar Power 2015-2019”, (PDF). http://www.solar-
powereurope.org. Solar Power Europe (SPE), formerly known as EPIA –European Photovoltaic Industry Association. Archived from the original on 9 June 2015. Retrieved 9 June 2015.

2. Ali. M. Jasim, Yu. A. Shepetov, “Mathematical Model of PV model with pulse width modulation control”, Aerospace Engineering and Technology (Ukr.) – 2015. – 2. – P. 51-57.
3. Satyananda Sarangi UG, Indira Gandhi, Sarang, Odisha, “Maximum Power Point Tracking (MPPT) A Review on Innovative Algorithms”, International Journal of Advanced Research in Electrical, Electronics and Instrumentation Engineering – 2015. – 4 (2). ISSN (Print): 2320 – 3765.
4. P. Sathyanarayana, Rajkiran Ballal, Rajkiran Ballal, Lakshmi Sagar P.S and Girish Kumar, “MATLAB-based modeling of shading effects in photovoltaic arrays”, Energy and Power – 2015. – 1A. – P. 1-4. Vol. 5, DOI: 10.5923/c.ep.201501.01.