the longitude of the mediterranean throughout history ... · the longitude of the mediterranean...
TRANSCRIPT

e-Perimetron, Vol. 9, No. 1, 2014 [1-29] www.e-perimetron.org | ISSN 1790-3769
[1]
Luis A. Robles Macías*
The longitude of the Mediterranean throughout history:
facts, myths and surprises
Keywords: History of longitude; cartographic errors; comparative studies of maps;
tables of geographical coordinates; old maps of the Mediterranean
Summary: Our survey of pre-1750 cartographic works reveals a rich and complex evolution of
the longitude of the Mediterranean (LongMed). While confirming several previously docu-
mented trends − e.g. the adoption of erroneous Ptolemaic longitudes by 15th and 16th-century
European cartographers, or the striking accuracy of Arabic-language tables of coordinates−,
we have observed accurate LongMed values largely unnoticed by historians in 16th-century
maps and noted that widely diverging LongMed values coexisted up to 1750, sometimes even
within the works of one same author. Our findings also dispute the important role traditionally
attributed to astronomers in improving the accuracy of Mediterranean longitudes.
Objective and scope
The objective of this study is to reconstruct the chronological evolution of the accuracy and precision
of one cartographic feature: the difference of longitude between the two extremities of the Mediterra-
nean Sea (abbreviated LongMed henceforth). For that, the coordinates of Western and Eastern locali-
ties of the Mediterranean Sea have been measured on a large sample of cartographic works made or
published before the mid 18th century. A voluntary effort has been made to include works of diverse
types, i.e. not only maps but also globes, tables of coordinates and geography texts; and from as di-
verse geographic and cultural origins as possible. The only limitation on the type of works included in
the sample is that it has to be possible to measure longitudes on them. This excludes the large major-
ity of maps made before the 15th century, as they rarely display meridians or any other means by
which longitudes can be ascertained. In particular most of the old maps of the Mediterranean par ex-
cellence, the “portolan charts”, cannot be included in the database because, although they normally
contain scales of distance, they show no indication of angular coordinates.
This article reviews earlier literature on the problem of the longitude of the Mediterranean, explains
the methodology used in the study and outlines the main results obtained to date. New cartographic
works will be added regularly to the database in the future to enable finer analysis of particular trends.
The problem of the longitude of the Mediterranean in historical literature
In our times, finding the difference of longitude between any two points of the surface of the Earth
has become trivial because the cartographic coordinates of every point are easily accessible through a
* Independent scholar. 5684 Bay Street, apt 556. Emeryville, California, 94608 USA
e-Perimetron, Vol. 9, No. 1, 2014 [1-29] www.e-perimetron.org | ISSN 1790-3769
[2]
myriad of sources. It is thus easy to check that the difference of longitude between Punta de Tarifa
(southernmost tip of Spain, and one of several arbitrary markers for the western end of the Mediterra-
nean Sea) and Iskenderun (easternmost location of the Mediterranean) is exactly 41.78 degrees. How-
ever, in the not so distant past measuring differences of longitude was not a trivial task and carto-
graphic works displayed different and often highly erroneous estimates of this value.
It is important to distinguish two related but different concepts: on one hand, the difference of longi-
tude between two points is the angle formed by the planes containing their two meridians, and is al-
most always expressed in sexagesimal degrees; on the other hand, the distance between those same
points is the length of the shortest path over the surface of the Earth that connects the two points, and
is expressed in units like kilometers or miles. Knowledge of the distance between two points is not
enough to compute their difference of longitude; one also needs to know the latitudes of the two
points and the radius of the Earth to do that calculation. In this article, the term “longitude of the
Mediterranean” (LongMed) will always mean the degrees and minutes that separate the Iberian Pen-
insula and Morocco from the Asian continent, and not the distance in kilometers or miles between
such regions.
It is well known to historians of cartography that most maps produced up to around 1700 substantially
overestimated LongMed. This fact may surprise given that ships from numerous civilizations have
sailed across the Mediterranean Sea since the earliest recorded history, and that those same maps that
show largely erroneous representations of the Mediterranean often present quite accurate longitudes
for lands that only recently had come to the knowledge of Europeans, like the Americas or southern
Africa. In the last three centuries several narratives have been put forward to explain such apparent
paradox.
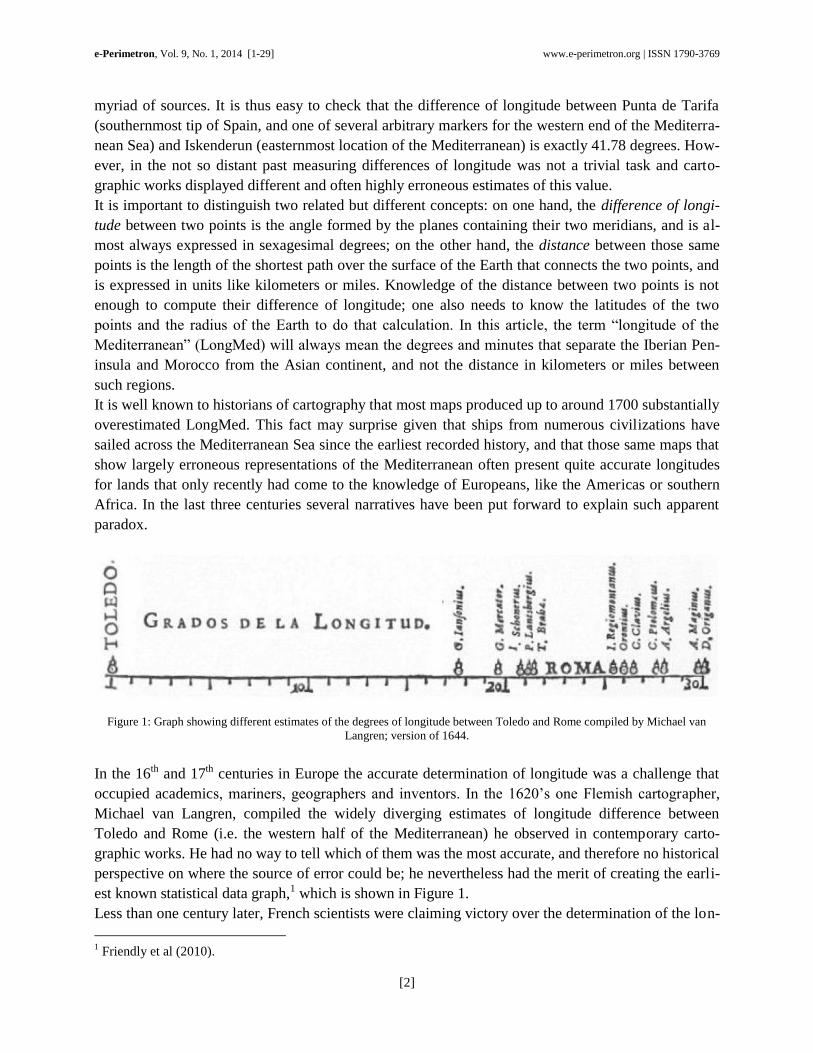
Figure 1: Graph showing different estimates of the degrees of longitude between Toledo and Rome compiled by Michael van
Langren; version of 1644.
In the 16th and 17th centuries in Europe the accurate determination of longitude was a challenge that
occupied academics, mariners, geographers and inventors. In the 1620’s one Flemish cartographer,
Michael van Langren, compiled the widely diverging estimates of longitude difference between
Toledo and Rome (i.e. the western half of the Mediterranean) he observed in contemporary carto-
graphic works. He had no way to tell which of them was the most accurate, and therefore no historical
perspective on where the source of error could be; he nevertheless had the merit of creating the earli-
est known statistical data graph,1 which is shown in Figure 1.
Less than one century later, French scientists were claiming victory over the determination of the lon-
1 Friendly et al (2010).
e-Perimetron, Vol. 9, No. 1, 2014 [1-29] www.e-perimetron.org | ISSN 1790-3769
[3]
gitude of the Mediterranean. Guillaume Delisle made an updated world map for the French crown
with corrected coordinates and in a paper dated 1720 explained his sources and methods and provided
what I think is the earliest historical perspective on the evolution of the error of LongMed. Delisle
explains that the accurate astronomical observations of longitude made a few years earlier by two of
his compatriots, Jean-Matthieu de Chazelles in the Eastern Mediterranean and Louis Feuillée in the
Central Mediterranean, made him realize that nautical charts were much more reliable in their longi-
tudes than the cartes ordinaires.2 He therefore used these marine charts extensively to compile the
latitudes and longitudes of the stretches of coast for which no astronomical observations were avail-
able, which were very numerous at his time, particularly in North Africa west of Tripoli and in the
Iberian peninsula. Delisle praises specifically le Portulan de Jacque Colomb, which must be one of
the nautical atlases published in Amsterdam by Jacob Colom, and that of Vankeulen, most likely the
Nieuwe Lichtende Zee-Fakkel printed by Johannes van Keulen also in Amsterdam. However, none of
the maps of the Mediterranean in these works displays meridians or scales of longitude. From De-
lisle’s explanation it can thus be ascertained that he must have measured distances in leagues on the
nautical charts between points of similar latitude and then computed their difference of longitude us-
ing some accurate estimate of the Earth’s radius.
Delisle concluded that the difference in longitude between Gibraltar and Iskenderun was 41º30’,
compared it with the 56º that one could observe in the cartes ordinaires and reached the astonishing
conclusion that the error of those maps in a sea “that has always been so familiar to us” was much
higher than the error they showed in the difference in longitude between France and China.3 Looking
back to “the ancients” Delisle found that the geographical distances reported by Strabo were roughly
correct, but did not mention Ptolemy’s erroneous longitudes in his paper. Among modern attempts to
correct the longitude of the Mediterranean he only cited Giovanni Riccioli’s compilation of ancient
and modern coordinates,4 but he deemed it too superficial to be useful.
Five decades after Delisle, another famous French cartographer, Jean Baptiste d’Anville, gave a suc-
cinct account of the evolution of LongMed throughout history: Ptolemy had thought LongMed was
equal to 62º whereas recent astronomical observations have shown it to be 42º; but, warned d’Anville,
modern maps should not receive particular credit for this improvement because the shortened Medi-
terranean could already be found in Francesco Maria Levanto’s Specchio del Mare, a nautical atlas
published in 1664.5 D’Anville thus followed Delisle’s opinion according to which the main use of
astronomical observations had been to corroborate that nautical charts were indeed an accurate carto-
graphic source.
In 1784 John Blair wrote a more detailed historical account on the subject, building on Delisle’s pa-
per and completing it with other sources and studies. Blair stated that the exaggerated LongMed in
old maps was due to an amazing Mistake made by Ptolemy, presumably due to dividing the correct
distance in stades by an incorrect number of stades to a degree,6 a hypothesis that was put forward by
Pascal Gossellin a few years later in a seemingly independent and much more comprehensive way.7
2 Delisle (1720: 366).
3 ibidem, p. 368.
4 Riccioli (1661).
5 D’Anville (1769:157).
6 Blair (1784:119-128).
7 Gossellin (1790: 118-122).
e-Perimetron, Vol. 9, No. 1, 2014 [1-29] www.e-perimetron.org | ISSN 1790-3769
[4]
That error, Blair went on, was perpetuated by every geographer and mapmaker down to the early 18th
century, and it was corrected only thanks to astronomical observations made in the 17th century. Blair
pointed that one of the first attempts to rectify the Length of the Mediterranean, was made under the
Auspices of Monsieur de Peiresk in 1635.
This was Nicolas Claude Fabri, Lord of Peiresc a French astronomer who had “Observations made at
Marseilles, Aleppo, and Grand Cairo, of an Eclipse of the Moon” on 27 August 1635. By this mean
the difference of longitude between Marseilles and Aleppo was found only to amount to 30º, instead
of the 45º previously assumed.8 The second achievement he mentions is the maritime expedition
sponsored by the French Academy of Sciences whereby de Chazelles sailed in 1696 up the Levant to
observe the Longitudes and Latitudes of Scanderoon [Iskenderun], Alexandria and Constantinople.
Chazelles applied the method of the eclipses of Jupiter’s satellites, invented by Galileo Galilei in the
early 17th century and first put into practice by Picard in 1671, to find out that Iskenderun laid 34º15’
east of Paris, a very accurate value. These astronomical data allowed Guillaume Delisle to build a
map of the Mediterranean Sea where the longitude between Gibraltar and Iskenderun was shortened
to around 41º30’. Blair correctly pointed out that Delisle measured the longitude difference between
Gibraltar and Paris from Sea Charts because it had not yet been astronomically determined in De-
lisle’s time or even in his own.
Blair’s narrative was echoed by two other British authors, Bell (1829:586) and Lardner (1833:14-19),
both of which however left out the fact that Delisle had used nautical charts as sources. On the con-
trary, they emphasized astronomical observations as the only driving force for the improvement in
cartographic accuracy. In Lardner’s words, the progress of geography towards mathematical correct-
ness had been due to its alliance with the kindred science of astronomy. Lardner lamented that
Peiresc’s astronomical data had been ignored by 17th-century mapmakers like Sanson and Coronelli,
and praised Delisle for the revolution, which he effected in geography.
In 1834 Louis A. Sédillot published his father’s posthumous translation of a 13th-century Arabic-
language astronomical treatise by Abu’l-Hasan Ali Al-Marrakushi. It contained a table with the longi-
tudes of 131 cities mostly in the Mediterranean region, which Sédillot later used to plot a map that he
found out to be very accurate. He concluded that Abu’l-Hasan had a quite clear idea, for his time, of
the length of the Mediterranean and seemed to have corrected Ptolemy’s error.9
Another large set of medieval Mediterranean coordinates with values more accurate than those of
Ptolemy’s was published in the edition by Reinaud (1840) of Abu’l-Fida’s geographical treatise.
Joachim Lelewel (1852) analyzed those findings and others to produce a monumental study that in-
cluded a comprehensive and insightful overview of the cartographic evolution of the Mediterranean
basin. He deduced that Arab astronomers (the word Arab should be taken as shorthand for mostly
Muslim men of diverse ethnic origins who wrote their works in Arabic between the 8th and the 15th
centuries) had substantially reduced LongMed in the times of Azarquiel i.e. the 11th century,10 but he
criticized Arab cartographers, who didn’t extract any advantage from astronomical observations of
longitude.11 Medieval portolan charts in the meantime, Lelewel pointed out, showed accurate Medi-
terranean coastlines and fulfilled their practical purpose without needing to indicate latitude or longi-
8 ibidem, pp.130-132.
9 Sédillot (1842:24-29).
10 Lelewel (1852:lii of volume 1) (all translations into English are mine).
11 ibidem, p.xxxv of volume 1.

e-Perimetron, Vol. 9, No. 1, 2014 [1-29] www.e-perimetron.org | ISSN 1790-3769
[5]
tude.
The translation of Ptolemy’s Geography into Latin in the 15th century was interpreted by Lelewel as
an unfortunate event that created an extreme perturbation in cartography and took LongMed back to
the erroneous value of the Alexandrian, particularly in maps printed by German authors.12 At the
same time, in 16th-century Spanish and Portuguese maps the Mediterranean basin kept its nautical
proportions preserved the precious fruit of previous works.13 Lelewel credited 16th-century Flemish
cartographers, particularly Gerard Mercator, with having reduced LongMed to a more reasonable
53º,14 while some 17th-century authors like Nicolas Sanson increased it to 56º. Then came the Delisle
and the gentlemen of the Académie Royale des Sciences to consummate the reform of continental ge-
ography based on astronomical observations... travelers accounts and topographic plans but, Lele-
wel explained, the march was slow and half a century passed before the correct size of 41º decidedly
prevailed.15
Oscar Peschel (1865: 654-655) drastically simplified Lelewel’s conclusions on the evolution of
LongMed in a mere two pages of his long book, stating that the difference of longitude between
Iskenderun and Gibraltar had been reduced from Ptolemy’s 62º to a less erroneous value of 52º by the
Arabs and the Dutch mapmakers, and that the final reduction from 52º to the real value of 41º41’ was
then accomplished through astronomical observations by Chazelle in 1693 in the Eastern Mediterra-
nean and by Feuillée in 1701-1702 in the Central Mediterranean region. Peschel therefore omitted the
fact that LongMed was already close to its accurate values in some other Arab works as well as in
some products of nautical cartography, as Lelewel had stressed. Peschel’s narrative is similar to
Bell’s and Lardner’s in its underlying theme of continuous progress towards improved accuracy, and
similarly distinguishes two steps of improvement. It differs only in who should be credited for the
first improvement step.
While Bell (1829:601) had minimized the role of medieval Arab geographers – claiming that they all
followed his [Ptolemy’s] system, both in astronomy and geography, without any improvements in the
method of ascertaining longitudes, or taking latitudes and that their astronomical observations are
not very numerous, and are by no means entitled to the praise of accuracy – Peschel put the Arabs on
equal footing with Dutch mapmakers, which by the way Bell had failed to praise too. Peschel’s sim-
plistic historical scheme became popular while Lelewel’s complex and increasingly outdated work
quickly fell into oblivion.16
New findings in the second half of the 19th century enriched historians’ knowledge of medieval as-
tronomy, particularly the publication by Nallino (1896) of Al-Khwarizmi’s table of coordinates, ex-
tracted from a world map presumably drawn in Baghdad under caliph al-Ma’mun. John K. Wright
(1923) could therefore state that in the ninth century, the astronomer Al-Khwarizmi had compiled
geographical tables in which Ptolemy’s estimate of the length of the [Mediterranean] sea was re-
duced from 62º to about 52º and furthermore it was understood by Moslem astronomers during and
after the twelfth century of our era that the Mediterranean was about 42º long, not 62 as [Ptolemy]
would have had it. Wright however cautioned that these coordinates did not find practical application
12
ibidem, pp.lxxxv-lxxxix of volume 1. 13
ibidem, p.169 of volume 2. 14
ibidem, pp.181-192 of volume 2. 15
ibidem, pp.203-204 of volume 2. 16
Giry (1875).

e-Perimetron, Vol. 9, No. 1, 2014 [1-29] www.e-perimetron.org | ISSN 1790-3769
[6]
in geography in the Latin West because the little interest that the men of the Latin West felt in the
whole question of latitudes and longitudes was astronomical and astrological, not geographical i.e.
not for drawing maps even though such maps would have certainly been more accurate than contem-
porary maps. Wright did not comment on the possible relationship between the tables and Arabic
geographical works.
More medieval tables of coordinates, mainly in Arabic, were discovered, systematically analyzed and
published throughout the 20th century, in particular by the Kennedys.17 In the 1990’s Mercè Comes
clarified the different meridians of reference used in those tables, and specifically discussed the issue
of the longitude of the Mediterranean, comparing the coordinates of certain Mediterranean cities
(Tangier, Toledo and Cordova in the West; Alexandria and Damascus in the East) in medieval Arabic
coordinates with the values in Kepler’s Rudolphine Tables of 1627 and in modern maps. She con-
firmed earlier authors’ observation that Al-Khwarizmi had already reduced Ptolemy’s error to a value
comparable to that put forward by Kepler, and went on to realize that in Al-Andalus, the astronomers
(Al-Zayyat, Al-Marrakushi, Al-Maghribi) achieved a more precise adjustment of the size of the Medi-
terranean to its real size, calculating a value surprisingly correct, very close to the modern one.18
The interpretation of the importance of these medieval Arabic or Islamic tables of coordinates became
a controversial topic in the last decades of the 20th century. On one hand Gerald R. Tibbets19 gave a
very negative opinion on their value (impossible to use in any scientific way, haphazard) and only
reluctantly accepted their potential geographic purpose as an unproven hypothesis for a few of them.
He observed that the tables may have been compiled from maps but no attempt to collate maps with
tables has ever been found in the early period, except perhaps in the large sectional maps of al-Idrisi.
In a text that leaves me with doubts about Tibbets’s correct understanding of the basic concepts of
longitude and reference meridian, he stated that these tables were unsystematic because they used dif-
ferent reference meridians and that the problem with most of the prime meridians is that they were
situated in mythical places.20 On the specific subject of the longitude of the Mediterranean Tibbets
acknowledged the reduction performed by Al-Khwarazmi but added that it probably means very little
and does not demonstrate a significant cartographic improvement of the Arabs over the Greeks. He
completely ignored the additional reduction of LongMed observed in later tables.
At the other extreme, Fuat Sezgin claimed the maximum importance for medieval Arabic cartogra-
phy, of which tables of coordinates would have been an essential part. He stated that the field of
mathematical geography [...] experienced here [in the Arab-Islamic culture area] an uninterrupted
process of development from the mid 8th century through into the 16th century. The degrees of longi-
tude and latitude produced in the course of this process have continuously found expression in
maps.21
Sezgin gave great importance to the evolution of LongMed and computed the difference of longitude
between Tangier and Iskenderun in numerous cartographic works up to 1700. He identified two steps
of improvement in accuracy: first by the geographers of caliph al-Ma’mun in Baghdad in the 9th cen-
17
Kennedy (1956) and Kennedy (1987). 18
Comes (1995) and Comes (2000). 19
Tibbets (1992a) covers the “early period” i.e. until around the 11th
century and Tibbets (1992b) covers the period
up to the 15th
century. 20
Tibbets (1992a:102-104). 21
Sezgin (2005:xv-xxiv).

e-Perimetron, Vol. 9, No. 1, 2014 [1-29] www.e-perimetron.org | ISSN 1790-3769
[7]
tury, who reduced the error from Ptolemy’s ca. 20 degrees to ca. 10 degrees; and secondly by astro-
nomical observations carried out later between Baghdad and Toledo, in Muslim-ruled Spain, which
further reduced the Tangier-Iskenderun difference to around 44.5º, very close to its real value of
42.0º. Controversially, Sezgin added that up to the 18th century many of those European maps that
were not based on Ptolemy – including medieval portolan charts – relied directly or indirectly for the
longitude of the Mediterranean on one of the two improved Arab-Islamic models.
Sezgin’s view of the evolution of LongMed is obviously at the antipodes of that given by Bell in the
19th-century. Sezing gives the Arabs all the credit, while Bell had completely neglected them. I would
like to point out however that the two narratives are in fact very similar. They both assume that as-
tronomers led the way by measuring coordinates and mapmakers followed suit. Both authors also
paint a trend of continuous progress over time towards higher accuracy – only the dates and the pro-
tagonists are different.
The results of this study will show that the overall picture of the evolution of LongMed is much more
complicated than that. Of all the authors I have reviewed, only Lelewel seems to have come close to
grasping its actual complexity.
Methodology
The authors mentioned in the previous section computed LongMed as the difference of longitude be-
tween two particular locations at the Western and Eastern ends of the Mediterranean, typically Gi-
braltar or Tangiers in the West and Iskenderun or Alexandria in the East. However, there are two
drawbacks to defining LongMed based on only two arbitrary localities:
First, not even the best known localities appear in each one and all of the studied lists of coordi-
nates or can be easily pinpointed in every map;
Second, in some cartographic work the longitude of chosen few specific locations may be abnor-
mally erroneous due to for example transcription mistakes so, if LongMed is computed based only on
them, a very distorted value will be obtained.
Robust definition
I have preferred to develop a more robust definition of LongMed, using at least three – and normally
many more – localities at each end. More specifically, for each of the pre-1750 cartographic works
included in the database, I have calculated an average error E, and standard deviation σ, of the longi-
tude of the Mediterranean in the following manner:
First I have measured the longitudes of two sets of locations: one set on or near the Western shore
of the Mediterranean and another set on the Eastern edge.
I have then taken each member of the Western set Wmi, and computed its difference of longitude
with each of the members of the Eastern set Emj.
These observed differences Woi – Eoj, have then been subtracted from the real differences of longi-
tude for each couple Wri – Erj, and a relative error thus calculated.
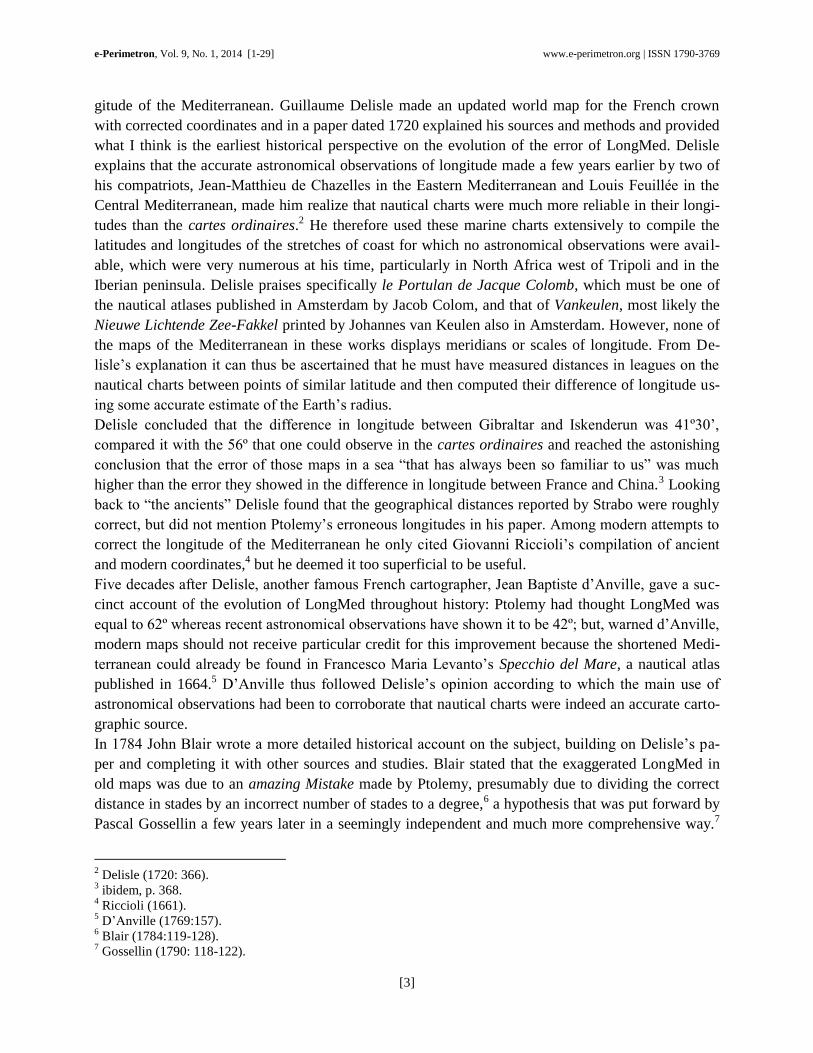
Finally, for each cartographic work, the average E and the standard deviation σ of the individual
errors have been computed using the formulae shown in Figure 2.
It should be noted that σ gives an indication of the underlying dispersion of the values of LongMed in
e-Perimetron, Vol. 9, No. 1, 2014 [1-29] www.e-perimetron.org | ISSN 1790-3769
[8]
each cartographic work and, contrary to other statistical measures like the standard error, does not
decrease as the number of localities used to calculate the average increases:
High σ means that a map is highly distorted in its shape, or that a list of coordinates contains aber-
rations due to copyist mistakes
Low σ indicates that the analyzed cartographic work is internally consistent.
Figure 2: Examples of Western and Eastern localities chosen to calculate the average (E) and standard deviation (σ) of the error of
LongMed by means of the indicated formulae. Background image shows Moxon’s 1657 edition of Wright’s world map.
It should be remarked that the Western and Eastern locations are not necessarily the same for all the
studied cartographic works. This is not a problem because what is being analyzed in this study is the
average longitude of the Mediterranean basin, not the difference of longitude between two specific
cities. The terms Western and Eastern have been applied in a broad sense:
Western locations have been chosen from the Iberian Peninsula, the Balearic Islands, and northern
Morocco and Algeria.
Eastern locations have been selected mainly from the Levant (today’s Syria, Lebanon, Israel and
the Palestinian territories), Egypt and Cyprus, plus several easy-to-identify coastal localities up to Is-
tanbul.
e-Perimetron, Vol. 9, No. 1, 2014 [1-29] www.e-perimetron.org | ISSN 1790-3769
[9]
Coordinates, globes and maps
The cartographic works considered in this study refer to three different types:
1) Lists of numerical coordinates;
2) Globes;
3) Maps.
Extracting relevant longitude values from the coordinates listed in tables and in geography texts is
relatively straightforward. Most tables do not explicitly mention the position of the zero meridian that
was assumed for their longitude values but fortunately that information is not necessary for this study
because what is computed is the difference of longitude between pairs of locations, not the longitude
of each individual place. One difficulty however is that for some place names listed in medieval
works the equivalent actual location is not known, or not precisely. Another problem is the corruption
suffered by the contents of manuscripts over time, some due to copyist mistakes and some due to the
merging of coordinates from different tables without realizing that their longitudes were based on dif-
ferent reference meridians. I have followed the criterion of respecting the contents of the tables and
texts as they have been handed to us by the scholars who edited them in the 19th and 20th centuries,
not correcting copying errors or confusions of reference meridians beyond whatever corrections were
made by the modern editors themselves.
In the case of globes I have been able to measure longitudes directly on the original for only one of
them. In the other cases I have used some type of digital model. For example, for the Behaim Globe I
made use of a digitally constructed high-resolution plate-carrée projection kindly provided by the
Germanische Nationalmuseum and TU Wien.
For fully graduated maps, i.e. those that explicitly display meridians, I have measured longitudes by
graphical interpolation between meridians, on paper copies or on digital reproductions. Some maps
do not contain a complete grid of meridians and parallels but provide auxiliary means to compute
longitudes, e.g. graduated equators. In those cases I have manually or digitally drawn meridians, mak-
ing an assumption on the cartographic projection of the map. These maps have been labeled debat-
able projection in the database and visually distinguished from fully graduated maps in the charts of
this article. As a reminder, this study does not include any map that absolutely lacks any indication of
longitude or latitude, which is the case of all medieval nautical-style or ‘portolan’ charts of the Medi-
terranean with perhaps one sole exception.22
Attribute of dates
Another important methodological note regards how to attribute dates to each cartographic work.
First of all, when a date is known only as a range, a year towards the middle of the range has been
chosen so as to be able to plot the work on the graphs, e.g. the “15th century” date range attributed by
the Biblioteca Nacional to the Alfonsine Tables in ms 4372 has been rendered as 1450 in the database.
A subtler problem arises when the year in which the author compiled a table or drew a map is not the
same as the date of the particular copy of the table or edition of the map that I have used to measure
longitudes and calculate LongMed. In modern works the difference is often small, a matter of years or
22
Lepore et al (2012).

e-Perimetron, Vol. 9, No. 1, 2014 [1-29] www.e-perimetron.org | ISSN 1790-3769
[10]
a at most a few decades; but in medieval works several centuries may separate the original creation of
a work from the extant copy used for this study. Which date should be given priority? I have decided
to keep both in the database, listing for each work the “year of creation” as well as the “year of the
observed copy” that I have actually used.
In the plots shown in the following pages, the vertical axis represents the error of LongMed and the
horizontal axis the date of creation of the cartographic work. This provides a narrative from the car-
tographers’ point of view, allowing for example to identify which earlier works a certain author may
have known. I have prepared, but not included in this article for reasons of space, charts where the
date plotted on the horizontal axis is that of the observed copy. This provides what we could call the
public’s point of view, helping us see which estimates of the longitude of the Mediterranean were in
circulation at a given point in history.
Preliminary results
As of this writing the LongMed database includes values from:
124 maps,
36 textual lists of coordinates, and
6 globes.
The oldest items in it are the tables of coordinates compiled by Claudius Ptolemy in the 2nd century
CE and the most recent one is J. M. Haas's map of Europe of 1743. The longest Mediterranean in the
database is found in Myritius’s world map of 1590 (average error = 67%, standard deviation = 9 per-
centage points; which will henceforth be abbreviated as 67% ± 9%), and the shortest one in the table
of coordinates in Abraham Zacut and Diego de Torres’s astrological treatise of 1487 (error = –16% ±
14%).
All of the sampled works are plotted in Figure 3. The general trends already identified by scholars
since the 19th century can be observed, with nuances, but at the same time numerous intriguing out-
liers come to light.
Ptolemy
Claudius Ptolemy is famous for having written a Geography in which the coordinates of several thou-
sand locations of the entire known world are given in sexagesimal degrees, with longitudes counted
from the meridian of the Islands of the Blest or Fortunate Islands. Ptolemy lived in the 2nd century
CE but the oldest extant manuscripts of the Geography date from around 1300 CE.
It is worth noting that the last book of the Geography, Book 8, contains a second set of coordinates of
358 noteworthy cities, given in a completely different way: latitudes are expressed in terms of the du-
ration of the longest day, whereas longitudes are reported as the difference in local time with respect
to Alexandria, in hours. Its values are generally consistent with those of Books 2 – 7.
Furthermore, another work written by Ptolemy, entitled Handy Tables, contains a list of localities
with coordinates expressed in sexagesimal degrees. Most of these place names are the same as those
found in Book 8 of the Geography but every one of the numerous extant manuscripts shows variants,

e-Perimetron, Vol. 9, No. 1, 2014 [1-29] www.e-perimetron.org | ISSN 1790-3769
[11]
additions and transcription mistakes.23 The Handy Tables were a compendium of tables intended to
make calculations easier for astrologers-astronomers (the two terms will be used interchangeably
henceforth). Its earliest manuscripts, two copies from around 820 CE, are the oldest extant documents
from which LongMed can be calculated. An older fragment of the Handy Tables in papyrus, from the
beginning of the 3rd century CE, contains only a few localities and unfortunately no values from the
extremities of the Mediterranean.
To calculate LongMed for each one of these Ptolemaic sources I have used the recent digital edition
by Stückelberger and Grasshoff (2006 – 2009), who reconstructed the most plausible values of each
coordinate based on the oldest extant manuscripts. This methodology provides a reasonable estimate
of the magnitude of LongMed error in Ptolemy’s original work: 45% on average with 4% of 5% stan-
dard deviation. It doesn’t tell us however how this value evolved in later manuscripts, if at all; such
an investigation could be worthwhile.
23
Stückelberger, Mittenhuber and Koch (2009:141-144).

e-Perimetron, Vol. 9, No. 1, 2014 [1-29] www.e-perimetron.org | ISSN 1790-3769
[12]
Figure 3: LongMed average error (dots) and standard deviation (error bars) vs year of creation of each cartographic work. Dot
shapes and colors distinguish works by type: globes (pink circles), lists of coordinates (orange squares), graduated maps (filled
blue diamonds) and maps with debatable projection (empty diamonds).
e-Perimetron, Vol. 9, No. 1, 2014 [1-29] www.e-perimetron.org | ISSN 1790-3769
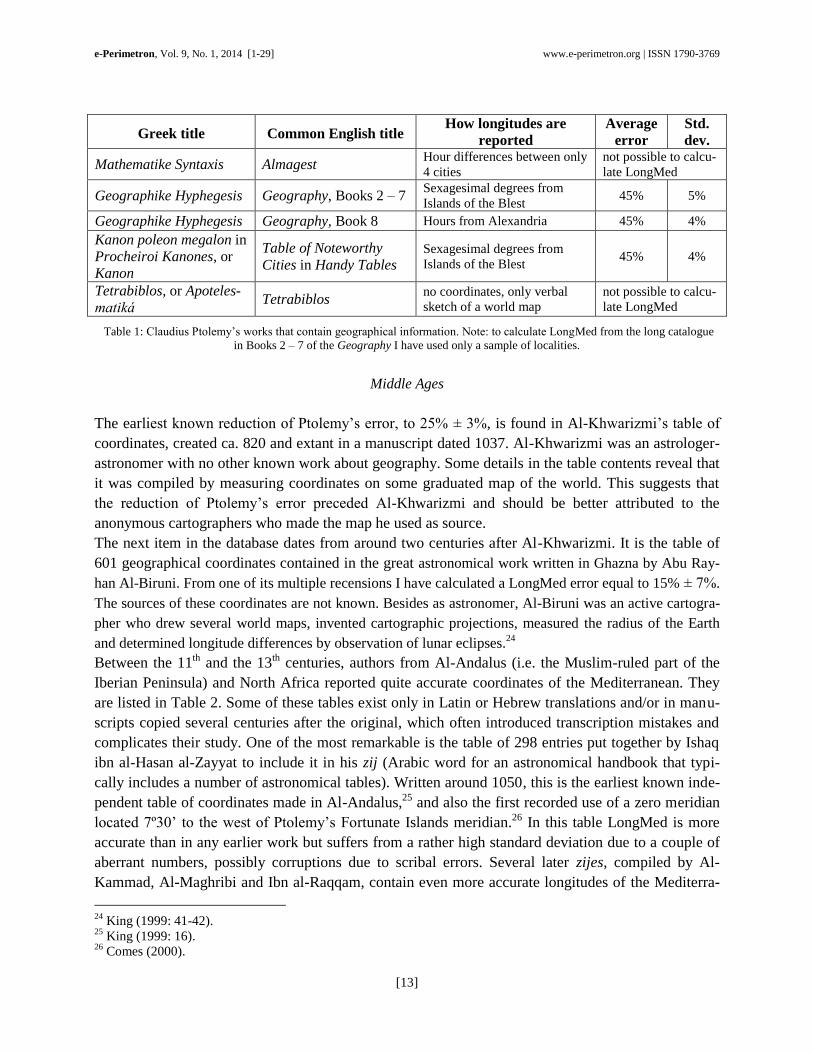
[13]
Greek title Common English title How longitudes are
reported
Average
error
Std.
dev.
Mathematike Syntaxis Almagest Hour differences between only
4 cities
not possible to calcu-
late LongMed
Geographike Hyphegesis Geography, Books 2 – 7 Sexagesimal degrees from
Islands of the Blest 45% 5%
Geographike Hyphegesis Geography, Book 8 Hours from Alexandria 45% 4%
Kanon poleon megalon in
Procheiroi Kanones, or
Kanon
Table of Noteworthy
Cities in Handy Tables Sexagesimal degrees from
Islands of the Blest 45% 4%
Tetrabiblos, or Apoteles-
matiká Tetrabiblos
no coordinates, only verbal
sketch of a world map
not possible to calcu-
late LongMed
Table 1: Claudius Ptolemy’s works that contain geographical information. Note: to calculate LongMed from the long catalogue
in Books 2 – 7 of the Geography I have used only a sample of localities.
Middle Ages
The earliest known reduction of Ptolemy’s error, to 25% ± 3%, is found in Al-Khwarizmi’s table of
coordinates, created ca. 820 and extant in a manuscript dated 1037. Al-Khwarizmi was an astrologer-
astronomer with no other known work about geography. Some details in the table contents reveal that
it was compiled by measuring coordinates on some graduated map of the world. This suggests that
the reduction of Ptolemy’s error preceded Al-Khwarizmi and should be better attributed to the
anonymous cartographers who made the map he used as source.
The next item in the database dates from around two centuries after Al-Khwarizmi. It is the table of
601 geographical coordinates contained in the great astronomical work written in Ghazna by Abu Ray-
han Al-Biruni. From one of its multiple recensions I have calculated a LongMed error equal to 15% ± 7%.
The sources of these coordinates are not known. Besides as astronomer, Al-Biruni was an active cartogra-
pher who drew several world maps, invented cartographic projections, measured the radius of the Earth
and determined longitude differences by observation of lunar eclipses.24
Between the 11th and the 13th centuries, authors from Al-Andalus (i.e. the Muslim-ruled part of the
Iberian Peninsula) and North Africa reported quite accurate coordinates of the Mediterranean. They
are listed in Table 2. Some of these tables exist only in Latin or Hebrew translations and/or in manu-
scripts copied several centuries after the original, which often introduced transcription mistakes and
complicates their study. One of the most remarkable is the table of 298 entries put together by Ishaq
ibn al-Hasan al-Zayyat to include it in his zij (Arabic word for an astronomical handbook that typi-
cally includes a number of astronomical tables). Written around 1050, this is the earliest known inde-
pendent table of coordinates made in Al-Andalus,25 and also the first recorded use of a zero meridian
located 7º30’ to the west of Ptolemy’s Fortunate Islands meridian.26 In this table LongMed is more
accurate than in any earlier work but suffers from a rather high standard deviation due to a couple of
aberrant numbers, possibly corruptions due to scribal errors. Several later zijes, compiled by Al-
Kammad, Al-Maghribi and Ibn al-Raqqam, contain even more accurate longitudes of the Mediterra-
24
King (1999: 41-42). 25
King (1999: 16). 26
Comes (2000).

e-Perimetron, Vol. 9, No. 1, 2014 [1-29] www.e-perimetron.org | ISSN 1790-3769
[14]
nean. The database also contains one work with a similarly accurate table of coordinates, the Jamic al-
mabadi by Abu’l-Hasan Ali al-Marrakushi, that is not a zij but a treatise on astronomical instruments.
Author Work Date Average
error
Std.
dev.
Al-Khwarizmi Kitab surat al-ard ca. 820, extant ms dated 1037 25% 3%
Al-Biruni Qanun al-Mascudi
composed 1030-40; numerous mss and
recensions exist 15% 7%
Al-Zayyat zij "185 ZAJ" author died 1058, extant in undated ms 7% 10%
Al-Zayyat Dikr al-aqalim author died 1058, extant ms ca. 14
th
century 9% 12%
[Azarquiel] /
G. de Cremona Toledan Tables
11th
century; extant in Latin mss 13th
of
14th
century 22% 4%
Abraham bar
Hiyya Sefer ha-Ibbur
original before 1124; Oxford ms ca.
1475; Paris ms 15-16th
century27
10% 8%
[Azarquiel] Marseille Tables 12th
century, later than 1139 20% 6%
[Al-Kammad]
/ J. of Dunpno
Tabula longitudinum
ciuitatum et latitudinum
earum
author died 1195; translated into Latin
1262 5% 6%
Al-Marrakushi Jamic al-mabadi… 13th century, extant ms before 1410 4% 4%
Al-Maghribi zij "300 TAJ" compiled 1258, extant in ms copied
1394 4% 5%
Al-Maghribi zij "350 MAG" compiled 1276, extant in undated ms 6% 4%
Ibn al-Raqqam Al-Zij al-Shamil compiled 1279-80 1% 6%
Ibn al-Raqqam Al-Zij al-Mustawfi compiled after 1280 0% 6%
Table 2: Tables of geographical coordinates compiled between the 9th and 13th centuries. The names of untitled zijes follow the
convention established by Kennedy (1987).
Some of the mentioned astronomers are known to have measured geographic latitudes themselves
through astronomical observations but it is unclear whether they measured, estimated or simply cop-
ied longitudes; the only exception is al-Biruni, who is known to have measured at least some longi-
tude differences. Different opinions exist on whether the tables of coordinates contained in astro-
nomical manuals were ever used to plot maps or had anything today with cartography at all.
As was explained in the historical review section, Tibbets was very skeptical about it whereas Sezgin
took it for granted. We have seen that at least in the case of al-Khwarizmi there is a clear relationship
between the coordinates and a map but it is not that the map was based on astronomically-observed
coordinates; on the contrary, the astronomer copied coordinates from a map in order to use them for
his astronomical calculations.
Biruni was at the same time an astronomer and a cartographer so he is likely to have actively used
tables of coordinates to draw maps but we have no proof. At this point it is important to point out that
geographical coordinates appear in other Arabic-language medieval works, besides zijes: descriptive
geographical books, which indicate numerical coordinates for each city or region they mention. Two
such books have been included in the database because they contain values from the two extremities
of the Mediterranean: the Dikr al-aqalim by al-Zayyat, and the Taqwim al-buldan by Abu’l-Fida. The
27
Personal communication from Ilana Wartenberg.

e-Perimetron, Vol. 9, No. 1, 2014 [1-29] www.e-perimetron.org | ISSN 1790-3769
[15]
purpose of these works is clearly geographic, nothing to do with astrology, and the coordinates are
useful to the reader only if he/she is capable of plotting them, at least mentally, so as to locate cities
with respect to each other. Their relationship with cartography is therefore quite probable, in my
opinion.
It should be noted that the newer, increasingly accurate determinations of longitudes did not necessar-
ily replace the older values, which kept on being transmitted throughout the entire Middle Ages. For
example Mediterranean coordinates similar to those transcribed by Al-Khwarizmi were used by Ibn
al-Zarqali (called Azarquiel in Latin) in 11th century Muslim Spain for his Toledan Tables, which in
turn enjoyed great popularity both in Arabic and in Latin translations up to at least the 14th century. In
parallel, Ptolemy’s coordinates kept on being copied in Greek and Arabic versions of his Geography
and his Handy Tables; the latter being called the Zij Batlamiyus.28
This coexistence of old and new values probably explains why Abu’l-Fida, writing in the early 14th
century, was not certain of which of his coordinate sources was most trustworthy and thus felt the
need to provide several values of longitude for each locality.29 To add to the confusion, longitudes
from different tables were merged by later authors without realizing that they were based on different
reference meridians. This is the reason why several tables of coordinates from the 14 th and 15th centu-
ries show extremely high standard deviations.
16th century
In the first half of the 16th century, LongMed ranged between 35% and 55% in most European carto-
graphic works. These values are of course Ptolemaic in origin but the substantial difference between
the two ends of the range suggests that several opinions on the true value of LongMed coexisted at
that time even within the circles most influenced by Ptolemy.
In the second half of the century the predominant trend shifted towards a somewhat shorter Mediter-
ranean, with 25 – 30% error. Such a reduced LongMed first appeared in print in Mercator’s map of
Europe of 1554 (error = 28% ± 4%), which showed a significant reduction with respect to the same
author’s earlier works. Mercator’s new value was quickly adopted by other commercially successful
mapmakers like Abraham Ortelius. Lelewel’s intuition about the key role of Mercator 30 was there-
fore correct, which is remarkable because Mercator’s 1554 map of Europe was discovered only in
1889,31 decades after Lelewel published his book.
28
Tibbets (1992a: 96). 29
Lelewel (1852: liii). 30
Lelewel (1852: 181-192). 31
Ortroy (1892).

e-Perimetron, Vol. 9, No. 1, 2014 [1-29] www.e-perimetron.org | ISSN 1790-3769
[16]
Author Work Date Average
error
Std. dev.
Gerard Mercator World map on two cordiform hemispheres 1538 49% 5%
Gerard Mercator Globe 1541 46% 7%
Gerard Mercator Europa (1st edition) 1554 28% 4%
Gerard Mercator Rectangular world map 1569 29% 4%
Gerard Mercator Europa (2nd
edition) 1572 28% 4%
Rumold Mercator World map on two circular hemispheres 1587 28% 5%
Rumold Mercator Europa in Atlas 1595 29% 4%
Table 3: LongMed error in cartographic works published by Gerard Mercator and his son Rumold, in chronological order. The
1554 map of Europe is highlighted in bold typeface.
There are, however, several maps and one globe that show substantially lower values of LongMed
than the predominant 16th-century trend. These outliers have been highlighted in Figure 4 and will be
described briefly in the next paragraphs.
Figure 4: Sixteenth-century cartographic works showing LongMed error lower than 30%. Symbols distinguish works by type:
globes (pink circles), graduated maps (filled blue diamonds) and maps without a complete grid of meridians (empty diamonds).
Jean Rotz was a cartographer and navigator from Dieppe, France, who emigrated to England and in
1542 presented a manuscript atlas entitled Boke of Idrography to king Henry VIII. This atlas, now
preserved at the British Library, contains a world map on two circular hemispheres drawn in globular

e-Perimetron, Vol. 9, No. 1, 2014 [1-29] www.e-perimetron.org | ISSN 1790-3769
[17]
projection, with a neatly delineated grid of meridians and parallels. In it the Mediterranean shows a
longitudinal error of 11% ± 3%, therefore substantially more accurate than what Mercator would es-
timate twelve years later. Jean Rotz’s map is remarkable but is not an isolated exception because
there is at least one other example of an unusually short Mediterranean among 16th-century works
from the Norman school of cartography: the sinusoidal world map drawn by Jean Cossin in 1570,
which has an only slightly higher LongMed error of 16% ± 5%.
One very remarkable outlier from the end of the 16th century, with an unusually short Mediterranean
basin and no doubts about its cartographic projection, is the anonymous world map contained in
Richard Haklyut's book Principal Navigations, published in 1598 – 1600. Likely the work of Edward
Wright, this map in Mercator’s projection shows a LongMed error of just 5% ± 3%. Wright himself
with the 1610 edition of his Certaine Errors published a second version of the map.32
Figure 5: Detail of Jean Rotz’s world map in the Boke of Idrography. Meridians are spaced at 10-degree intervals.
Numerous other charts from the 16th century show shorter Mediterranean longitudes than Mercator’s
or even than Rotz’s. Most of them are manuscript; only Waldseemüller’s Carta marina is printed,
among those included in this study’s database. These maps are mostly drawn in “nautical style”, al-
most always showing wind roses and latitude scales. Some of them display one horizontal scale of
longitude and a few vertical meridians, but none has a complete grid of meridians. Therefore if one
wants to compute their LongMed some assumptions need to be made regarding the underlying carto-
graphic projection.
For calculation purposes, I have supposed that meridians are vertical straight lines in all of them. In
those that lack longitude scales I have had to make one additional assumption on how to space me-
ridians. In Table 4 are listed the assumptions and the resulting values of LongMed, which as can be
seen are all quite accurate except for the case of Rosselli’s map.
I would like to emphasize that it is not fully certain that each and every one of these charts, particu-
larly the earliest ones, was deliberately drawn by its author based on a projection with vertical me-
ridians.33 It is not sure either that numerical values of longitude were actually used to plot localities
on all of them; distances and rhumbs may have been used in lieu of angular coordinates for at least
32
Parsons and Morris (1939). 33
Among others, Snyder (1993: 5-8) supported this interpretation for at least some of these maps whereas Gaspar
(2007) rejected it.

e-Perimetron, Vol. 9, No. 1, 2014 [1-29] www.e-perimetron.org | ISSN 1790-3769
[18]
some places. On the other hand, it is clear that at least some of the users of these maps believed them
to have been drawn in some kind of cylindrical projection, as exemplified by the orthogonal grid of
meridians and parallels that Johannes Schöner drew by hand on his copy of Waldseemüller’s Carta
marina. These charts may therefore have transmitted the apparent values of LongMed listed in Table
4 even if their authors were not necessarily aware of or in agreement with those values.
A group of closely-related world maps of this type is particularly worthy of attention because of their
extremely accurate and precise values of LongMed: the Salviati planisphere, the Castiglioni
planisphere and the Carta universal... signed by Diego Ribero and preserved in Vatican, all drawn in
Spain in the 1520’s.34
Author / work Date Location Assumptions on meridian
spacing
Average
error
Std.
dev.
J. de la Cosa, World map 1500 Andalusia I assume distance ‘Cancro’ – Equa-
tor equals 23.5º of longitude 3% 4%
Cantino planisphere c. 1502 Portugal I assume distance Tropics – Equa-
tor equals 23.5º of longitude -10% 3%
F. Rosselli, World map 1508 Venice I assume meridian spacing equal to
parallel spacing per latitude scale 29% 3%
M. Waldseemüller,
Carta marina 1516 Lorraine
Meridian grid hand-drawn by J.
Schöner -14% 3%
Mediterranean map in
Atlas Miller c. 1519 Portugal
Scale of longitude in west part of
the map; I extend it to the whole
map
-2.5% 2.2%
Kunstmann IV, World
map c. 1519
Portugal /
Andalusia?
Equator has unnumbered marks that
I assume represent one degree -4% 3%
Castiglione planisphere 1525 Andalusia? Graduated equator -1.3% 1.7%
Salviati planisphere c. 1525 Andalusia? Equator has unnumbered marks that
I assume represent ten degrees -1.7% 2.2%
J. Vespucci, World map 1526 Andalusia Graduated equator 6% 3%
D. Ribero, Carta univer-
sal (preserved in Vati-
can)
1529 Andalusia Graduated equator -1.3% 1.7%
B. Agnese, map of the
Western hemisphere
1536 –
1564 Venice Graduated equator -3% 4%
A. de Santa Cruz, Medi-
terranean map in Islario c. 1539 Andalusia Scale of longitude at parallel 13ºN 2% 4%
P. Desceliers, World map 1546 Normandy Scale of longitude at southern edge -7.5% 1.7%
S. Gutiérrez, Carta gen-
eral 1551 Andalusia Graduated equator -9% 8%
D. Homem, World map
in Queen Mary Atlas 1558 England
Scales of longitude at northern and
southern edges -7% 5%
Table 4: Apparent LongMed error in a sample of 16th-century nautical-style maps lacking a complete grid of meridians. For all
maps I have assumed vertical equidistant meridians in order to compute LongMed.
34
Sánchez (2013: 180-188 and 194-210).
e-Perimetron, Vol. 9, No. 1, 2014 [1-29] www.e-perimetron.org | ISSN 1790-3769
[19]
All these maps show average errors below 2% in absolute value and standard deviations around 2%,
provided that the meridians are assumed to be represented as equidistant vertical lines. In this case the
assumption is, in my opinion, highly valid due to four features that these maps share:
i) one important meridian – the line of demarcation between Spain and Portugal in the Atlantic – is
drawn as a vertical line;
ii) at least two scales of latitude are drawn as vertical lines as well;
iii) the equator is graduated in longitude with evenly spaced marks that are distant from each other the
same length as the equivalent amount of degrees on the latitude scale, and
iv) the overall rectangular shape of the maps does not suggest any bending of meridians, as opposed
to for example oval world maps.
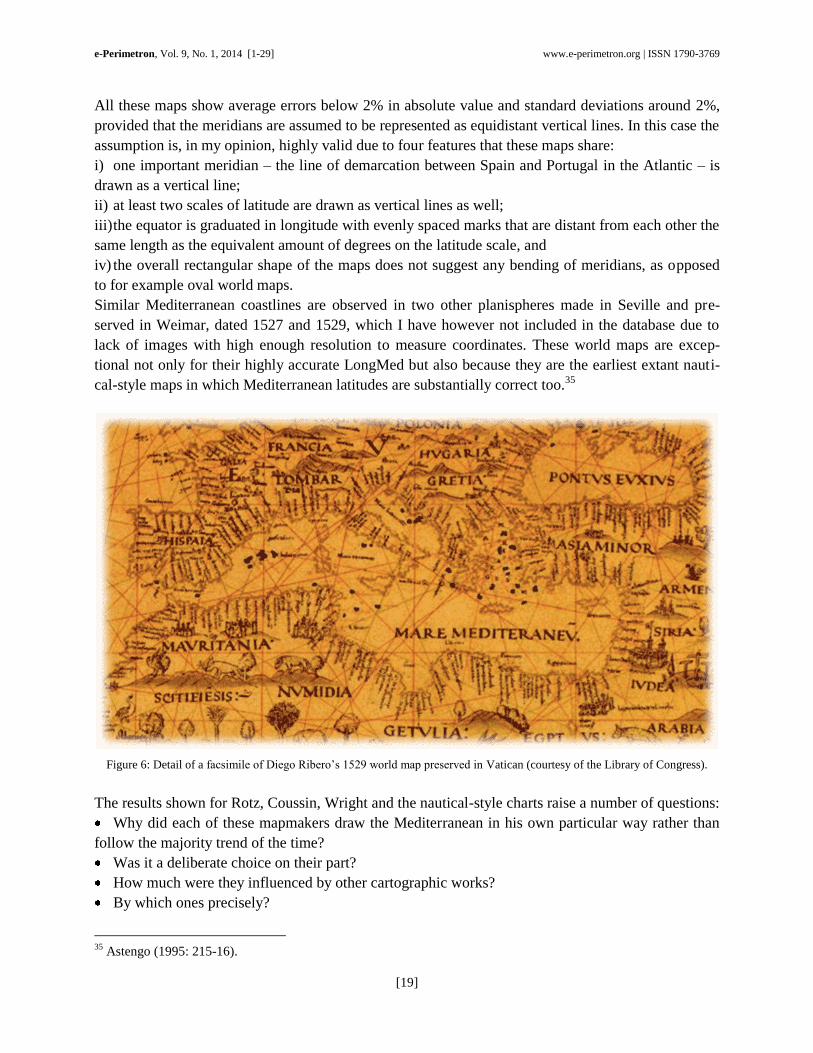
Similar Mediterranean coastlines are observed in two other planispheres made in Seville and pre-
served in Weimar, dated 1527 and 1529, which I have however not included in the database due to
lack of images with high enough resolution to measure coordinates. These world maps are excep-
tional not only for their highly accurate LongMed but also because they are the earliest extant nauti-
cal-style maps in which Mediterranean latitudes are substantially correct too.35
Figure 6: Detail of a facsimile of Diego Ribero’s 1529 world map preserved in Vatican (courtesy of the Library of Congress).
The results shown for Rotz, Coussin, Wright and the nautical-style charts raise a number of questions:
Why did each of these mapmakers draw the Mediterranean in his own particular way rather than
follow the majority trend of the time?
Was it a deliberate choice on their part?
How much were they influenced by other cartographic works?
By which ones precisely?
35
Astengo (1995: 215-16).

e-Perimetron, Vol. 9, No. 1, 2014 [1-29] www.e-perimetron.org | ISSN 1790-3769
[20]
Answering these questions is beyond the scope of this work but I will nevertheless provide some in-
formation on the motives and sources of two of these cartographers: Diego Ribero and Edward
Wright.
Ribero, cosmographer of the Casa de la Contratación, inserted a legend about the shape of the Medi-
terranean in his 1529 world map preserved in Vatican (also found in the 1527 and 1529 maps pre-
served in Weimar). I transcribe the legend here and provide a translation into English:
Diego Ribero Translation (Robles)
“Nota q[ue] el levante que comunmente
llamamos lo que se contiene dende el estrecho
de gibraltar adentro ba / asentado & puesto
por altura dello por dicho de personas q[ue]
en alguas partes del an estado y tomado el sol
/ & en lo demas sigo alos cosmographos que
particularmente ablaron dela latetud d[e] al-
gunos lugares & / los grados delongetud en el
no pueden corresponder alas partes con que
median enla equinoccial / por la minoridad
d[e ]los paralelos porque en la berdad del
cayro almar Roxo o dende Damasco o iheru /
salen al mar persico ay muy poco camino &
aquy se haze mucho por Razon dela menori-
dad delos pa / ralelos como tengo dicho de-
manera que tuve por menor Inconveniente
esto q[ue] no desproporcio / nar el mar &
tierra de levante d[e] como ya esta usado &
conçebido enla mente...”
Note that the Levant, as we commonly call what
is contained inwards from the Strait of Gibral-
tar [i.e. the Mediterranean Sea], is drawn ac-
cording to its height [i.e. latitude] based on the
reports of people who have been to some parts
of it and taken the Sun [i.e. measured latitudes
by means of astronomical observations]; for the
rest I follow the cosmographers who particu-
larly spoke about the latitude of some places.
And in it the degrees of longitude cannot corre-
spond to the parts with which they are measured
on the equinoctial [line] due to the shortening
of the parallels, because in fact from Cairo to
the Red Sea or from Damascus or Jerusalem to
the Persian Gulf there is a very short distance
and here [i.e. on the map] it becomes a long one
due to the shortening of the parallels as I have
said; and so I found this [option] less inconven-
ient than disproportioning the sea and land of
the Levant from what is already usual and con-
ceived in the mind...”
Ribero vaguely describes his sources for latitude data and does not mention any source for his appar-
ently accurate longitudes. Paradoxically he warns the reader that the longitudinal distances in the
Mediterranean cannot match the corresponding number of degrees measured on the equator, as I have
assumed, due to a cartographical artifact: the incorrect rendering of the “minoridad de los paralelos”
i.e. the convergence of meridians. Ribero thus posits that in the map the Mediterranean appears
shorter than it really is.
Based on his words, Ribero cannot be credited with having actively researched the true value of
LongMed and represented it on a map; on the contrary, he seems to have believed that the apparent
value of LongMed one could deduce from this map assuming vertical meridians was incorrectly low.
Curiously Ribero did not dare to correct the shape of the Mediterranean because, he says, it was al-
ready considered ‘usual’ in his time. To me this indicates that he must have copied that shape from
some earlier cartographer.
Edward Wright was a scholar at the University of Cambridge who had an interest in navigation. In
1589 he joined the English naval raid against Spanish and Portuguese shipping around the Azores
islands. Back in Britain he joined as mathematician the team that produced the globes published by

e-Perimetron, Vol. 9, No. 1, 2014 [1-29] www.e-perimetron.org | ISSN 1790-3769
[21]
Emery Molyneux in 1592.36 Molyneux’s terrestrial globe, the first one ever made in England, has a
LongMed error of 20% ± 2%, which is more correct than Mercator’s but still substantially higher than
that of Wright’s later map. Therefore it cannot have been Wright’s source for the Mediterranean.
A cartouche on the globe lists some of Molyneux’s sources: Spanish and Portuguese nautical charts
for the Americas and the East Indies, and English geographers for Northern regions. Other areas like
Africa, where Molyneux had no special information from English or Spanish sources, seem to have
been copied from Jacob van Langren’s 1589 globe,37 which I haven’t been able to measure. In any
case, some new information obtained after 1592 must have pushed Wright to shorten the Mediterra-
nean in his 1598 map further than on the globe. Parsons and Morris (1939) stated that “Wright trans-
ferred the facts and details from Molyneux's globe to his own chart, and [John] Davis and Hakluyt
assisted in recording the latest discoveries.” The navigator John Davis had met Wright in the Azores
in 1589 and in 1596 and 1597 took part in English attacks against respectively Cadiz and the Azores.
Did Davis bring back from those expeditions some captured Spanish or Portuguese map with short
LongMed that Wright then used as source for his world map? A way to confirm or rule out this hy-
pothesis could be to analyze in detail the Mediterranean toponyms and coastal outlines on Wright’s
maps.
17th century
In the 17th century most of the values of LongMed proposed in the previous century remained in use
simultaneously, creating the cartographic confusion that would be denounced by Michael van Lan-
gren, among others. The LongMed values favored by Mercator and Ortelius were adopted by authors
like Hondius (1630, 25% ± 7%) and Visscher (1639-1652, 27% ± 3%) whereas French mapmaker
Nicolas Sanson stuck to a more Ptolemy-like proportion (1654, 35% ± 5%). Willem Blaeu opted for a
somewhat shorter Mediterranean in his Europa recens (1617, 18% ± 2%), while quite accurate
LongMed values were found in one of Jean Guérard’s planispheres (1625, 0.5% ± 4%), in several
maps made by the Colom family (e.g. 1654, 3% ± 6%) and in an updated edition of Wright’s
planisphere (Moxon 1657, 5% ± 3%).
The Norman cartographer Jean Guérard is a curious case because a few years after his map with an
accurate Mediterranean he drew another planisphere with a substantially more erroneous LongMed
(1634, 19% ± 7%). Why he decided to switch to a more erroneous value, I don’t know. Guérard is
not, by the way, the only author to have used two contradictory values of LongMed in his maps. Bat-
tista Agnese and Alonso de Santa Cruz both employed even more widely differing values in their
works in the 16th century: accurate, or at least apparently accurate, LongMed in their nautical-style
charts and highly erroneous, Ptolemy-like values in world maps drawn with full grids of meridians.
It is also instructive to observe the evolution of Mediterranean longitudes in the tables of coordinates
used by European astronomers of this period. From purely Ptolemaic models with high LongMed er-
rors (e.g. Apian 1524, 48% ± 7%), Kepler’s Rudolphine Tables reduced the error to 25% ± 6% in
1627 and then Riccioli to 18% ± 3% in 1661. However, in the two cases maps had been produced
with similarly increased accuracies decades before respectively Kepler and Riccioli published the ta-
36
Wallis (1951). 37
Wallis (1955).

e-Perimetron, Vol. 9, No. 1, 2014 [1-29] www.e-perimetron.org | ISSN 1790-3769
[22]
bles.
This challenges the narrative established by some 19th and 20th-century authors according to which
astronomers would have led the way in improving the accuracy of the Mediterranean longitude, and
mapmakers followed suit. On the contrary, the compiled data tends to support a parallel, independent
development of astronomical tables of coordinates and mapmaking in the 17th century, or perhaps
even the use by astronomers of coordinate values taken from maps in the same manner as Al-
Khwarizmi did in the 9th century.
Around 1700 the French started to produce works with accurate and precise values of LongMed, as
already explained in the review section of this article. This new paradigm seems to have spread
quickly, as almost all European maps registered in the database showed correctly sized Mediterranean
seas within only a few decades.
Some outliers persisted nevertheless, like Nicolas de Fer’s L’Europe of 1716 (12% ± 7%). Further-
more the first maps printed in the Ottoman Empire, in I. Müteferrika’s editions of the Tarih-i Hind-i
Garbi (1730) and the Cihannüma (1732), show rather high errors (17% ± 4% and 30% ± 5% respec-
tively) that attest that the diffusion of the new LongMed values was not so swift beyond Western
Europe.
Figure 7: Kepler’s and Riccioli’s tables of coordinates are highlighted. As can be seen, numerous other cartographic works
showed similar values of LongMed decades before each of those two tables were published.

e-Perimetron, Vol. 9, No. 1, 2014 [1-29] www.e-perimetron.org | ISSN 1790-3769
[23]
Geographical variability
In general, the database reveals that the evolution of LongMed varied significantly across geographi-
cal and linguistic regions. This is hardly surprising given that scientific knowledge is local in origin
and constructed at specific sites through the engagements of particular scientists with particular
skills, materials, tools, theories and techniques.38 For reasons of space, I have to leave the analysis of
those local evolutions for future articles. Figures 8a and 8b nevertheless provide a preview of the evo-
lution of LongMed in four different geographic areas.
38
Turnbull (1996:6).

e-Perimetron, Vol. 9, No. 1, 2014 [1-29] www.e-perimetron.org | ISSN 1790-3769
[24]
Figure 8a: LongMed error between 1500 and 1700 in the Iberian Peninsula (above) and the Kingdom of France (below).

e-Perimetron, Vol. 9, No. 1, 2014 [1-29] www.e-perimetron.org | ISSN 1790-3769
[25]
Figure 8b: LongMed error between 1500 and 1700 in the Low Countries (above) and England (below).
e-Perimetron, Vol. 9, No. 1, 2014 [1-29] www.e-perimetron.org | ISSN 1790-3769
[26]
Conclusion and way forward
The evolution of the longitude of the Mediterranean (LongMed) has been surveyed in 166 carto-
graphic works from Antiquity up to the mid 18th century. The picture that emerges is richer and more
complex than what can be found in most historical narratives. Some of the trends already identified
by earlier historians of cartography are corroborated in this study, for example the increasing accu-
racy of medieval Arabic-language tables of coordinates or the widespread use of erroneous Ptolemaic
longitudes in 16th-century Europe.
Some outliers have however been found that show accurate LongMed values at times when most car-
tographic works were very incorrect and, on the contrary, some maps show substantial LongMed er-
rors decades after the true value had been astronomically determined and published. Diverse and mu-
tually contradictory values of LongMed have been observed to coexist from the High Middle Ages up
to well into the 18th century; such confusion was recognized at different epochs by, among others,
Abu’l-Fida and Michael van Langren. Differences in the way that LongMed evolved are noticeable
across geographical and linguistic regions, and contradictory values are sometimes found even within
the works of a same author.
The results of this study also challenge the narrative put forward by some 19th and 20th-century schol-
ars according to whom astronomers would have led the way in improving the accuracy of the Medi-
terranean, and mapmakers followed suit. On the contrary, all the surveyed European tables of coordi-
nates from the 16th and 17th centuries contain LongMed estimates similar to those already found in
earlier maps and globes.
Some of the findings of this study open avenues for further research, e.g.:
What relationship is there, if any, between the quite accurate Mediterranean coordinates of Arabic-
language tables and contemporary maps?
How were Iberian cartographers of the first half of the 16th century able to draw such an accurate
Mediterranean, and why did their successors seemingly abandon it? Which were Jean Rotz’s, Edward
Wright’s and Jean Guérard’s sources for their relatively correct values of LongMed? How was the
knowledge of the true dimensions of the Mediterranean, as determined by the French Academy of
Sciences, received in different countries and cultures?
In parallel to those future investigations, more maps, globes and lists of coordinates should be added
to the database so as to document the main trends more comprehensively and to identify other outliers
of interest. A higher number of data points is definitely needed to perform finer analyses, like study-
ing the evolution of LongMed in specific geographical or cultural regions. The readers are kindly en-
couraged to suggest additional cartographic works that should be included in the database, which will
be posted online in free access.
Acknowledgements
I am very grateful to Julio Samsó for his cordial advice and for having given me access to numerous
medieval lists of coordinates I could not have obtained otherwise. I also thank Jean-Charles Ducène,
Leif Isaksen, Ilana Wartenberg and Chet van Duzer for their kind help. Thanks are also due to the
anonymous reviewers for their constructive comments and suggestions.

e-Perimetron, Vol. 9, No. 1, 2014 [1-29] www.e-perimetron.org | ISSN 1790-3769
[27]
References
Astengo, C. (1995). L’asse del Mediterraneo nella cartografia nautica dei secoli XVI e XVII. Studi e
Ricerche di Geografia, XVIII (2), 213-237.
Bell, J. (1829). Supplement by the Editor. In C. Rollin, The history of the arts and sciences of the ancients.
Glasgow & Edinburgh: Blackie, Fullarton & Co. and A.Fullarton & Co., 566- 617.
Blair, J. (1784). The history of the rise and progress of geography. London: T. Cadell and W. Ginger.
http://books.google.com/books?id=fFgmAAAAMAAJ
Comes, M. (2000). Islamic Geographical Coordinates: al-Andalus’ contribution to the correct measure-
ment of the size of the Mediterranean. In Science in Islamic Civilization. Studies and Sources on the His-
tory of Science. Istanbul: Research Centre for Islamic History, Art and Culture, 123-138.
Comes, M. (1995). Las tablas de coordenadas geográficas y el tamaño del Mediterráneo según los as-
trónomos andalusíes. In Al-Andalus: el legado científico, Fundación El Legado Andalusí, 22-37
D’Anville, J.-B. B. (1769) Traité des Mesures itinéraires anciennes et modernes, Paris. Reprinted in M.
de Manne (ed.), Oeuvres de d' Anville, Paris: Imprimerie Royale, 1834, 82-246.
http://books.google.com/books?id=gXIHPni3GEAC
Delisle l’Ainé, G. (1720). Détermination géographique de la situation et de l’étendue des différentes par-
ties de la terre. In Histoire de l’Académie Royale des Sciences Année MDCCXX, Paris : Imprimierie
Royale, 1722, 365-384 http://archive.org/stream/histoiredelacad20laca#page/364/mode/2up
Friendly M., Valero-Mora, P. and Ibáñez Ulargui, J. (2010). The First (Known) Statistical Graph: Michael
Florent van Langren and the “Secret” of Longitude. The American Statistician 64 (2): 185–191.
http://www.datavis.ca/papers/vita/Friendly-etal2010langren.html
Gaspar, J. (2007). The Myth of the Square Chart. e-Perimetron, 2 (2): 66-79.
http://www.e-perimetron.org/Vol_2_2/Gaspar.pdf
Giry, A. (1875). Exposition internationale de Géographie à Paris. La Revue scientifique, 16:.301-305.
http://books.google.com/books?id=Zx4gAQAAMAAJ&pg=PA301
Gossellin, P.-F-J. (1790). Géographie des grecs analysée; ou Les systèmes d'Ératosthènes, de Strabon et
de Ptolémée comparés entre eux et avec nos connoissances modernes. Paris: Imprimérie de Didot l'aîné.
http://gallica.bnf.fr/ark:/12148/bpt6k55438586.pdf
Kennedy, E.S. (1956). A Survey of Islamic Astronomical Tables. Transactions of the American Philoso-
phical Society, 46: 123-177.
Kennedy, E.S. and Kennedy, H. (1987). Geographical coordinates of localities from Islamic sources.
Frankfurt am Main: Institut für Geschichte der Arabisch-Islamischen Wissenschaften an der Johann Wolf-
gang Goethe-Universität.
King, D.A. (1999). World Maps for Finding the Direction and Distance of Mecca: Examples of Innova-
tion and Tradition in Islamic Science. Leiden: Brill.
Lepore, F., Piccardi, M., Pranzini, E. (2012). The autumn of mediaeval portolan charts. Cartometric is-
sues. e-Perimetron 7 (1): 16–27. http://www.e-perimetron.org/Vol_7_1/Lepore%20et%20al.pdf
Lardner, D. (1833). The history of maritime and inland discovery, vol. III, book V. London: Longman,
Rees, Orme, Brown & Greene. http://books.google.com/books?id=-oaRjzUr9ysC
e-Perimetron, Vol. 9, No. 1, 2014 [1-29] www.e-perimetron.org | ISSN 1790-3769
[28]
Lelewel, J. (1852). Géographie du Moyen Âge. Bruxelles. Volume 1
(http://archive.org/stream/gographiedumoy01lele#page/n7/mode/2up) and volume 2
(https://archive.org/stream/gographiedumoy02lele#page/n7/mode/2up)
Nallino, C. A. (1896). Al-Huwarizmi e il suo rifacimento della Geografia di Tolomeo. Atti della R. Acca-
demia dei Lincei 1894 Serie Quinta, II: 4–53.
http://www.archive.org/stream/memorieatti02accauoft#page/n9/mode/2up
Parsons, E.J.S. and Morris, W.F. (1939). Edward Wright and his work. Imago Mundi, 3(1), 61-71.
Peschel, O. (1865). Geschichte der Erdkunde, Geschichte der Wissenschaften in Deutschland 4. München:
Bayerische Akademie der Wissenschaften. http://books.google.com/books?id=66kBAAAAYAAJ
Reinaud, J.T. and de Slane (1840). Géographie d’Abulféda. Texte arabe publié d’après les manuscrits de
Paris et de Leyde. Paris: Imprimerie Royale. http://archive.org/details/gographiedabou00abal
Riccioli, G. B. (1661). Geographiæ et hydrographiæ reformatæ libri duodecim. Bologna.
http://books.google.com/books?id=AkI_1g-eg48C
Sánchez, A. (2013). La espada, la cruz y el Padrón: Soberanía, fe y representación cartográfica en el
mundo ibérico bajo la Monarquía Hispánica, 1503-1598. Madrid: CSIC
Sédillot J.J. (1834). Traité des instruments astronomiques des arabes composé au treizième siècle par
Aboul Hhassan Ali, de Maroc. Paris: Imprimérie Royale.
http://archive.org/details/traitdesinstru01marruoft
Sezgin, F. (2005). Mathematical Geography and Cartography in Islam and their Continuation in the Oc-
cident, 3 vols., Geschichte des Arabischen Schrifttums. Frankfurt am Main: Institut für Geschichte der
Arabisch-Islamischen Wissenschaften an der Johann Wolfgang Goethe-Universität.
Snyder, J. P. (1993). Flattening the Earth: Two Thousand Years of Map Projections. Chicago and Lon-
don: The University of Chicago Press.
Stückelberger, A. and Grasshoff , G. (2006 - 2009). Klaudios Ptolemaios Handbuch der Geographie :
griechisch-deutsch, 3 vols. and CD-ROM. Basel: Schwabe Verlag.
Stückelberger, A., Mittenhuber, F. and Koch, L. (2009). Kanon bedeutender Städte, in Klaudios Ptol-
emaios Handbuch der Geographie : griechisch-deutsch, vol. 3, 134-215. Basel: Schwabe Verlag
Tibbetts, G.R. (1992a). The Beginnings of a Cartographic Tradition. In The History of Cartography, Vol-
ume 2, Book 1, 90-107. Chicago: University of Chicago Press.
http://www.press.uchicago.edu/books/HOC/HOC_V2_B1/HOC_VOLUME2_Book1_chapter4.pdf
Tibbetts, G.R. (1992b). Later Cartographic Developments. In The History of Cartography, Volume 2,
Book 1, 137-155. Chicago: University of Chicago Press.
http://www.press.uchicago.edu/books/HOC/HOC_V2_B1/HOC_VOLUME2_Book1_chapter6.pdf
Turnbull, D. (1996). Cartography and science in early modern Europe: Mapping the construction of
knowledge spaces. Imago Mundi, 48(1), 5-24.
Ortroy, F. van. (1892). L’oeuvre géographique de Mercator. Revue des questions scientifiques, 507-571.
http://www.vliz.be/imisdocs/publications/224281.pdf
Wallis, H. M. (1951). The First English Globe: A Recent Discovery. The Geographical Journal, 117 (3),
275-290.
e-Perimetron, Vol. 9, No. 1, 2014 [1-29] www.e-perimetron.org | ISSN 1790-3769
[29]
Wallis, H. M. (1955). Further Light on the Molyneux Globes. The Geographical Journal, 121 (3), 304-
311.
Wright, J.K. (1923). Notes on the knowledge of latitudes and longitudes in the middle ages. Isis, 5, 75-98
http://archive.org/stream/isisacad05acaduoft#page/74/mode/2up