the long-term effects of the chernobyl catastrophe on
TRANSCRIPT

DI
SC
US
SI
ON
P
AP
ER
S
ER
IE
S
Forschungsinstitut zur Zukunft der ArbeitInstitute for the Study of Labor
The Long-Term Effects of the Chernobyl Catastrophe on Subjective Well-Being and Mental Health
IZA DP No. 5906
August 2011
Alexander M. DanzerNatalia Danzer

The Long-Term Effects of the
Chernobyl Catastrophe on Subjective Well-Being and Mental Health
Alexander M. Danzer Ludwig-Maximilians-University of Munich,
OEI Regensburg and IZA
Natalia Danzer Ifo Institute for Economic Research
and IZA
Discussion Paper No. 5906 August 2011
IZA
P.O. Box 7240 53072 Bonn
Germany
Phone: +49-228-3894-0 Fax: +49-228-3894-180
E-mail: [email protected]
Any opinions expressed here are those of the author(s) and not those of IZA. Research published in this series may include views on policy, but the institute itself takes no institutional policy positions. The Institute for the Study of Labor (IZA) in Bonn is a local and virtual international research center and a place of communication between science, politics and business. IZA is an independent nonprofit organization supported by Deutsche Post Foundation. The center is associated with the University of Bonn and offers a stimulating research environment through its international network, workshops and conferences, data service, project support, research visits and doctoral program. IZA engages in (i) original and internationally competitive research in all fields of labor economics, (ii) development of policy concepts, and (iii) dissemination of research results and concepts to the interested public. IZA Discussion Papers often represent preliminary work and are circulated to encourage discussion. Citation of such a paper should account for its provisional character. A revised version may be available directly from the author.

IZA Discussion Paper No. 5906 August 2011
ABSTRACT
The Long-Term Effects of the Chernobyl Catastrophe on Subjective Well-Being and Mental Health*
This paper assesses the long-term subjective well-being and mental health toll of the Chernobyl disaster of 1986 in the general Ukrainian population and estimates the monetary differential necessary to compensate victims of the catastrophe. The analysis is based on two nationally representative Ukrainian data sets and reveals that even 20 years after the accident subjective well-being is negatively associated with self-reported assessments of having been affected by the catastrophe. The causal long-term effect of the disaster on life satisfaction is established by exploiting variation in official radiation data which are linked to survey respondents through information on their place of living in 1986. We find higher depression and trauma rates as well as poorer subjective life expectancy among those stronger affected by Chernobyl. Expressed in monetary terms, the estimated amount of income required to compensate for the experienced utility loss amounts to an annual cost of seven percent of Ukraine‘s GDP. JEL Classification: D60, I18, I31, J28 Keywords: Chernobyl catastrophe, subjective well-being, mental health, instrumental variable Corresponding author: Natalia Danzer Ifo Institute for Economic Research Poschingerstraße 5 81679 München Germany E-mail: [email protected]
* We thank the ESCIRRU consortium for sharing the ULMS data with us. We are grateful for helpful and constructive comments from Andrew Clark, Miles Kimball, Stephan Klasen, Lars Handrich, Hartmut Lehmann, Thomas Siedler, Jan Van Ours, Jonathan Wadsworth as well as from conference and seminar participants at EALE 2009, ESPE 2009, Holzhausen 2011, University of Munich and the ifo Institute Munich.

2
1 Introduction
Natural disasters and wars produce fear and desperation. Victims of such events
suffer from anxiety, posttraumatic stress and depression (Goenjian, Steinberg, Najarian,
Fairbanks, Tashjian and Pynoos 2000) but little is known how the general population fares
in the long run.1 This paper evaluates the long-term effects of the Chernobyl catastrophe on
April 26, 1986, the largest civic nuclear accident to date, in terms of subjective well-being
and mental health.2
Similar to such rare aggregate shocks like natural catastrophes (floods, hurricanes,
tsunamis and earthquakes), terrorist attacks and other man-made accidents (like the
chemical catastrophe of Bhopal, India, in 1984), the Chernobyl disaster represents a non-
insurable ‗public bad‘. This implies that it is ultimately the state which has to bear the costs
by paying for disaster relief and recovery work. Against this background, it seems to be
highly relevant to provide an assessment of the aggregate utility loss caused by such an
event (Luechinger and Raschky 2009).
For a comprehensive assessment of the long-term consequences of Chernobyl, it is
necessary to estimate the effects (and externalities) on the general population and to
quantify the population‘s ‗utility loss‘ (apart from direct clean-up or medical costs, etc.).
Up to now, no large scale analysis based on a nationally representative sample has
evaluated the long-term effect of the Chernobyl disaster on subjective well-being and the
mental health of the Ukrainian population. The empirical analysis of this paper aims at
filling this gap. The scientific research on Chernobyl so far has mainly focused on health
effects and the relationship between radiation and cancer (see the summary of the findings
of the medical literature in, for instance, two United Nations reports from 2001 and 2002
(United Nations 2001, 2002), two UNSCEAR reports from 2000 and 2008 (UNSCEAR
1 ―The concept of stress is invoked to explain the widespread damage to general health and well-being. Stress
can be defined as the process by which adverse mental experiences have negative effects on bodily functions.
The mechanism is physiological, mediated through the autonomic nervous system and the endocrinological
system.‖ (Lee 1996, p. 283) 2 Despite the fact that nuclear accidents seem relatively rare, several events during the past 60 years were
categorized as accidents according to the International Nuclear Event Scale (INES scale 4-7): Chalk River
1952 (USA), Kyshtym 1957 (USSR), Sellafield 1957 (UK), Los Alamos 1958 (USA), Simi Valley 1959
(USA), Idaho Falls 1961 (USA), Charlestown 1964 (USA), Monroe 1966 (USA), Lucens 1969
(Switzerland), Rocky Flats 1969 (USA), Sellafield 1973 (UK), Leningrad 1974 (USSR), Belojarsk 1977
(USSR), Bohunice 1977 (CSSR), Three Mile Islands 1979 (USA), Saint-Laurent 1980 (France), Chernobyl
1982 (USSR), Buenos Aires 1983 (Argentinia), Wladiwostok 1985 (USSR), Chernobyl 1986 (USSR),
Goiânia 1987 (Brazil), Sewersk 1993 (Russia), Tokaimura 1999 (Japan), Fleurus 2006 (Belgium), and
Fukushima 2011 (Japan).
3
2000, 2008) as well as a national report from Ukraine (Baloga, Kholosha and Evdin
2006)). In general, the evidence on cancer and the total health toll of the disaster seem
inconclusive albeit moderate—with the important exception of a significant rise of the
incidence of thyroid cancer in children.
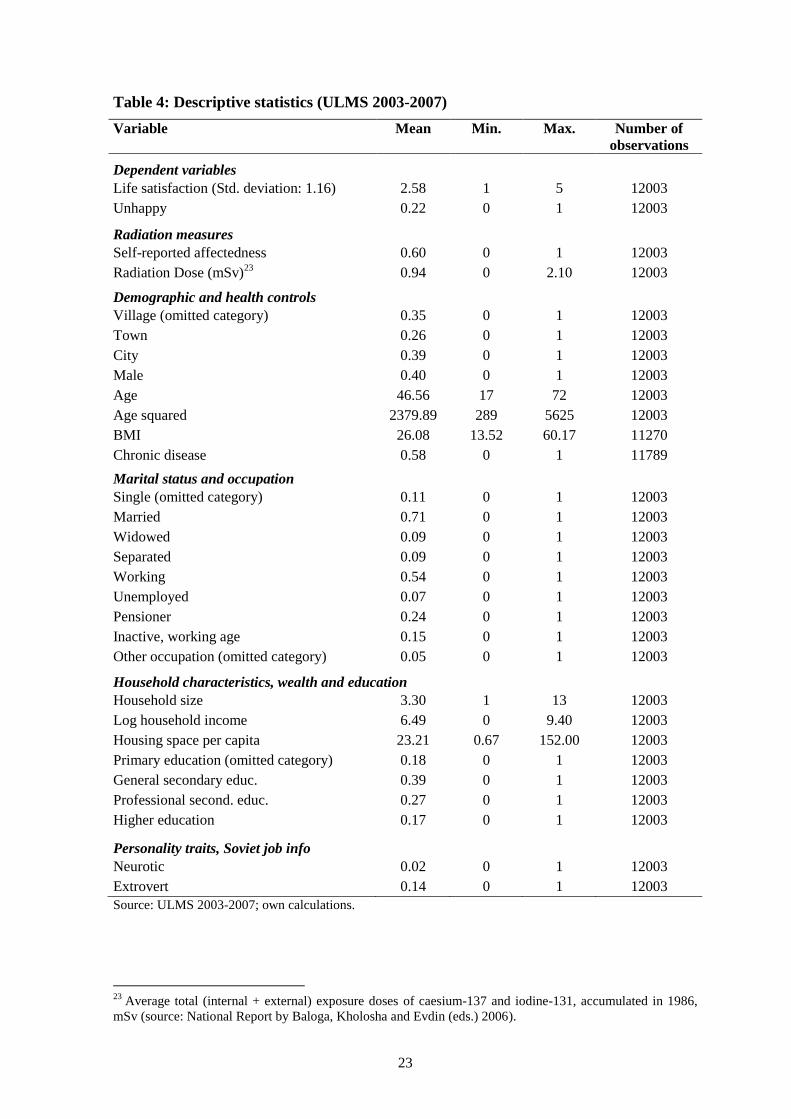
In economics, three recent papers have used the catastrophe of Chernobyl to
investigate various effects. The first two use an identification strategy that exploits regional
variation in radiation levels—a method which will also be employed in the current paper:
Lehmann and Wadsworth (2011) focus not only on health outcomes but also on long-term
labour market consequences of the 1986 nuclear accident using the Ukrainian Longitudinal
Monitoring Survey (ULMS). While they find substantially worse health perceptions among
the affected population in Ukraine, the effect on somatic health and risky behaviour
(drinking, smoking) seems weak and is mostly not significantly different from zero. Yet,
their empirical evidence seems to suggest that Chernobyl victims have a lower attachment
to the labour market which, however, does not translate into income losses. Almond,
Edlund and Palme (2009) evaluate the effect of low-dose pre-natal radiation exposure
caused by the Chernobyl disaster on cognitive and health child outcomes in Sweden. While
they do not find any causal effect on health outcomes at birth or incidence of
hospitalisation during childhood, there seem to be significant adverse consequences on
cognitive ability measured by schooling outcomes in secondary school (around age 16).
Finally, Berger (2009) analyses the impact of the Chernobyl catastrophe on life satisfaction
and on being concerned about the protection of the natural environment in Germany by
taking advantage of the fact that the 1986 wave of the German Socio-Economic Panel was
collected between March and August. Her empirical approach is to compare average levels
of life satisfaction of respondents who were randomly interviewed shortly before with
those interviewed shortly after the nuclear accident. She finds a significant increase in the
likelihood of being very concerned about the environment immediately after the
catastrophe (by 20 percent), but life satisfaction remained unaffected. This empirical
strategy – to exploit variation over time in combination with randomly assigned interview
dates – is similar to a US study using weekly data and finding a negative short term effect
of hurricane Katrina on life satisfaction in 2005 (Kimball, Levy, Ohtake and Tsutsui 2006).
The results of this latter study reveal that the negative effect on average US life satisfaction
lasts slightly longer in regions close to the affected area. A refinement of this identification
strategy is implemented by Metcalfe, Powdthavee and Dolan (2011) who assess the impact

4
of the September 11 attacks on mental distress in the UK in 2001. It is possible that
average subjective well-being levels move systematically over the year, i.e. that there are
underlying trends which are not related to a particular event. This is why simple before-
and-after comparisons might be biased. Metcalfe, Powdthavee and Dolan (2011) apply a
difference-in-difference method which accounts for such possible seasonality effects by
including control years in which there was no attack. The difference-in-differences
estimation is based on interviews randomly split by the attacks into two samples (treatment
and control group). Their findings show a significantly lower subjective well-being
immediately after September 11.
While these latter studies have focused on short-term changes in life satisfaction,
there is increasing evidence that certain shocks can also lead to long run changes in
subjective well-being and thus a shift in the personal baseline level of happiness (Clark,
Frijters and Shields 2008; Diener, Lucas and Scollon 2006; Heady 2008; Oswald and
Powdthavee 2008).
The empirical analysis of this study will use a self-reported measure of ‗being
affected by the Chernobyl catastrophe‘ – which will be referred to as ‗self-reported
affectedness‘ in the remainder of this paper – as well as objective radiation doses from
1986 to establish the causal link between the Chernobyl disaster and life satisfaction as
well as mental health. The results indicate that having been exposed to Chernobyl has a
significantly negative effect on subjective well-being and mental health in the long run.
The results prove robust to several sensitivity checks. Following the recent literature using
subjective well-being regressions to evaluate the monetary costs associated with specific
life events (life satisfaction approach) the amount of income required to compensate for
their experienced utility loss is calculated (for other papers calculating such compensatory
payments, see, for instance, Clark and Oswald 2002, Luechinger and Raschky 2009, van
Praag and Baarsma 2005). Even without this compensation, individuals exposed to higher
levels of radiation seem to be more dependent on state transfers.
This empirical study contributes to the literature on life satisfaction as well as the
literature assessing the impacts of the Chernobyl disaster in several ways: First, it estimates
the causal Chernobyl effect on long-term life satisfaction and mental health outcomes
using large and nationally representative surveys. Second, it investigates the potential
endogeneity of self-reported affectedness measures using objective radiation measures and
instrumental variable techniques. Thus it contributes to the important question whether

5
individuals overstate their true affectedness level (with implications for benefit claims).
Third, the study computes the value of the utility loss caused by the Chernobyl catastrophe
which corresponds to about seven percent of annual Ukrainian GDP – a tremendous
amount considering the fact that the estimates refer to a period of 20 years after the
accident. This implies that the psychological costs of this nuclear disaster are enormous.
The remainder of the paper is structured as follows: Section 2 provides relevant
background information on the nuclear accident of Chernobyl and outlines potential
transmission channels through which the catastrophe might have affected life satisfaction
and mental health. Section 3 describes the two data sets employed for the empirical
analysis of the paper, the Ukrainian Longitudinal Monitoring Survey (ULMS) and the
Ukrainian Household Budget Survey (UHBS). The methodological approach is described
in Section 4. This is followed by the main empirical results as well as several robustness
checks (Section 5 and 6). Section 7 presents the estimates of the required income
compensation. The final Section 8 concludes.
2 Background on the Chernobyl catastrophe and its consequences
The following sections provide detailed information on the nuclear accident and the
size of the affected population in Ukraine. Furthermore, potential channels through which
the Chernobyl catastrophe might affect subjective well-being in the long-run are outlined
with reference to the previous literature.
2.1 The accident of Chernobyl3
On April 26, 1986 one block of the nuclear power plant in Chernobyl, nowadays in
Ukraine and close to the Belorussian border, exploded leading to the biggest civil nuclear
accident ever recorded (UNSCEAR 2000). After the initial explosion, a nuclear cloud
formed and contaminated substantial areas of Belarus, Ukraine and western Russia with
radioactive fallout. Within the countries, wind direction and rainfall patterns led to a
3 This section is based on diverse national and international reports on the nuclear accident of Chernobyl.
More detailed accounts of the timeline of the events as well as technical details can be found, for instance, in
the following publications: the 1998 European Commission Atlas of caesium deposition on Europe after the
Chernobyl accident (European Commission 1998), two United Nations reports from 2001 and 2002 (United
Nations 2001, 2002) and two UNSCEAR reports from 2000 and 2008 (UNSCEAR 2000, 2008) as well as a
national report from Ukraine (Baloga, Kholosha and Evdin 2006).

6
regionally dispersed and unpredictable contamination with radioactive fallout (Figure A 1).
Due to strong eastern winds more western and northern parts of Europe were also affected.
Inside the power plant the fight against the fire lasted for a fortnight and the Soviet
government reacted on a broader basis to the accident only after the global measurement of
the parts-per-trillion concentration of radioactive isotopes in the atmosphere prevented the
incidence from being kept secret. In early May 1986, several ten thousand inhabitants from
the immediate vicinity to the reactor were evacuated and in the following month
approximately 170,000 residents were resettled from inside a 30 kilometre zone of
alienation. Medical treatment with iodine drugs which could prevent the absorption of
radioactive iodine started only days after the catastrophe and control of milk and foodstuff
remained insufficient. Taken together, several hundred thousand people in Ukraine were
exposed to significant levels of radioiodine (iodine-131) and radiocaesium-137 (caesium-
137) either as clean-up workers (fire fighters, liquidators, construction workers of the
concrete shield) or nearby inhabitants (see footnote 3).
Given contradictory statements about the humanitarian and environmental damage
caused by the disaster in the scientific literature, the losses and costs are still hard to
quantify: In the early period, liquidators and close inhabitants were most strongly affected
by radiation exposure. However, only 31 deaths were officially registered by the Soviet
government as a direct consequence of the catastrophe. On a long term basis, many more
people suffered from internal radiation through inhalation or the consumption of
contaminated food. According to the United Nations more than eight million people were
and are affected by this catastrophe in the three most affected countries Belarus, Russia
and Ukraine (United Nations 2001). The number of immediate casualties is highly debated
and varies substantially between nuclear power proponents and critiques, but sharp
increases in thyroid cancer among children immediately after the accident support the idea
of devastating consequences on the health status of people (Demidchik, Mrochek,
Demidchik, Vorontsova, Cherstvoy, Kenigsberg, Rebeko and Sugenoya 1999). Vast areas
of natural resources became unusable for agricultural production.4 Government spending to
alleviate the consequences in Ukraine alone are estimated at 148 billion USD from 1986-
2015 (currently, five to seven percent of Ukraine‘s annual budget are spent on the
alleviation of long term consequences; Oughton, Bay-Larsen and Voigt 2009). The social
4 The total area removed was 784,000 ha of agricultural land and 694,000 ha of forest in Belarus, Ukraine
and Russia together (United Nations 2002). This is equivalent to the size of Kuwait and larger than the state
of Connecticut.

7
costs related to stigma, anxiety and the perception of risk have only started to be
understood. The disaster has affected almost every dimension of human life: For instance,
women who were resettled from the most affected regions hide their origin as they would
be facing difficulties in finding a partner due to widespread fears of congenital anomalies
(Oughton, Bay-Larsen and Voigt 2009). Also, resettlement itself had devastating psycho-
social consequences so that some people who stayed behind in the most affected areas are
in better psychological conditions than those resettled from the same areas (United Nations
2002).
2.2 Quantifying the number of affected persons in Ukraine
Determining who has been affected by the nuclear disaster of Chernobyl is not an
easy task. It is not clear whether to only define someone as a victim whose health has
already deteriorated (and even so, by how much?). What about those who were exposed to
a radioactive dose without having – physically – suffered so far? The problem of radiation
lies in the fact that people were supposedly ‗treated‘ with a specific dosage a long time
ago, but that the effect of this treatment might or might not have manifested itself in
potentially adverse somatic health outcomes and that there is uncertainty as to whether one
eventually will suffer from long-term effects. Furthermore, there might be psychological
effects leading individuals to actually feel negatively affected in their daily life and in their
health (apart from officially diagnosed mental disease this form of affectedness might be
difficult to capture using standard somatic health outcomes). Therefore, this study applies
and compares two measures of affectedness: first, a self-assessment of respondents about
whether their or any of their family members‘ health was affected by the disaster and
second, official effective radiation doses in humans according to their place of living in
1986. Before discussing these two measures in more detail further below (see Section 3.2),
this section will provide an overview of the scale of the disaster based on official numbers
published by the State Statistics Committee of Ukraine (UkrStat) and the United Nations
Scientific Committee on the Effects of Atomic Radiation (UNSCEAR).
According to UkrStat, the number of Ukrainian adults with the status of having
been seriously affected by the Chernobyl catastrophe (recognized by the state as Chernobyl
victim) was around 2 million adults on January 1, 2004 (this number excludes children, see
Table 1), which corresponds to about 4.2 percent of the Ukrainian population of that year
(overall 47.6 million inhabitants at the beginning of 2004). This number is very close to

8
self-reported affectedness in the survey, which will be used in the following empirical
analysis (UHBS data, wave from December 2002): in the sample, around 1,850,000 adults
claim to have been seriously affected by Chernobyl.5
Including children defined as
Chernobyl disaster victims the number of officially registered Chernobyl victims rises to
over 2.7 million persons (5.8 percent of the total population, see Table 1). The figures also
show that the number of liquidators were about 320,000 in these years (about 0.68 percent
of the total population). Although this is a large number, the liquidators make up only for a
small fraction in the total number of registered victims.
Table 1: Persons registered as victims of the Chernobyl nuclear power station
disaster, by type (absolute numbers and population shares)
January 1, 2004
January 1, 2005
absolute
number
% of total
population
absolute
number
% of total
population
Total victims, persons
2,772,060 5.82%
2,646,106 5.60%
out of which
Chernobyl disaster liquidators
324,332 0.68%
318,016 0.67%
Chernobyl disaster victims
1,689,941 3.55%
1,682,280 3.56%
Children defined as Chernobyl disaster
victims
754,934 1.59%
643,030 1.36%
Other persons eligible for benefits
2,853 0.01%
2,780 0.01%
Families receiving benefits due to loss
of breadwinner (whose death is related
to Chernobyl disaster) 15,801
17,448
Source: Information on absolute numbers from State Statistics Committee of Ukraine (2004, 2005); figures
on the population shares are based on own calculations using population numbers for the present population
at the beginning of each year (from the same source).
An UNSCEAR publication from the year 2000 has provided a somewhat lower
estimate of the number of persons affected by Chernobyl (Table 2). However, this can
partly be explained by the fact that evacuation and resettlements after 1986 are not
accounted for and that the number of recovery operations workers was underestimated.
Specifically, the complexity and difficulty in counting the number of affected persons can
be seen from a more recent UNSCEAR report (UNSCEAR 2008) which adjusted the
previous number of recovery operation workers (liquidators) upwards by 40 percent.
Overall it is important to note that the comparability of numbers across studies and years is
5 The questionnaire does not specify what ‗seriously‘ means.

9
difficult due to different definitions of affected and base populations (numerator and
denominator).
Table 2: Number of Chernobyl affected persons in Ukraine (UNSCEAR 2000)
Recovery operation workers (liquidators)a
170,000
Evacuated in 1986b 91,406
Inhabitants of contaminated areas, >=37 kBq/m2 (until 1995)
c 1,295,600
Total 1,557,006 Source: UNSCEAR 2000;
a See Table 18 of the report. The numbers refer to the years 1986-1989 in the
Soviet Republic of Ukraine only. This number was raised in subsequent reports, which however only
reported aggregate numbers for Belarus, Russia and Ukraine together. b See Table 20 of the report.
c See
Table 26 of the report (distribution of inhabitants in 1995 of areas contaminated by the Chernobyl accident).
Over time, the number of registered victims initially rose but then has decreased
steadily decreasing since the year 2000 (in absolute and relative terms). The numbers in
Figure 1 reveal that the total number of registered victims went down to 2.5 million by
2007 and is likely to fall in the future due to the ageing of the most affected cohorts.
Nevertheless, for the time being the number of official Chernobyl victims is still
substantial and makes up a non-negligible part of the population.
Figure 1: Development of number of Chernobyl victims over time
Source: State Statistics Committee of Ukraine (2007)
0%
1%
2%
3%
4%
5%
6%
7%
8%
9%
10%
0
500,000
1,000,000
1,500,000
2,000,000
2,500,000
3,000,000
3,500,000
4,000,000
1995 1996 1997 1998 1999 2000 2001 2002 2003 2004 2005 2006 2007
% in
to
tal p
op
ula
tio
n
Pe
rso
ns
Citizens having the status of victims of the Chernobyl NPP disaster
Liquidators of Chernobyl NPP disaster (subgroup of victims)
% of victims in total population

10
When summarizing these aggregate numbers, it is also crucial to clarify that there
was and is a substantial regional variation in the number of affected individuals – related to
regionally heterogeneous radiation levels. The regions with by far the highest numbers of
affected persons in absolute and relative terms are the northern oblasts of Kiev (48.4
percent of the population are registered victims, i.e. almost 900,000 persons), Rivne (35.3
percent), Zhytomyr (28.2 percent), Volyn (15.6 percent) and Cherkasy (11.8 percent). In
the most Western and Southern regions (Zakarpattya, Crimea and Odessa), the share of
Chernobyl victims is less than half a percent.
Figure 2: Chernobyl victims by Oblast (region), 2004
Source: State Statistics Committee of Ukraine (2004)
2.3 Possible channels on subjective well-being and mental health
The aim of this study is to analyse whether there are long-lasting effects of the
Chernobyl accident on subjective well-being and mental health 17 to 21 years after the
event. Overall, there are at least three theoretical channels through which the 1986 nuclear
catastrophe might have affected subjective life satisfaction and mental health. Since the
catastrophe of Chernobyl was a truly exogenous and unanticipated event, the affected and
0.46%0.47%
0.48%0.49%
0.52%
0.61%0.67%
0.75%0.77%
0.77%0.93%
0.96%1.03%
1.05%1.55%
2.04%2.28%
2.82%5.05%
5.24%7.17%
10.62%11.80%
15.63%
28.20%
35.33%
48.44%
0
100,000
200,000
300,000
400,000
500,000
600,000
700,000
800,000
900,000
0%
10%
20%
30%
40%
50%
60%
70%
Zaka
rpat
tya
Rep
ub
lic o
f C
rim
ea
Od
esa
Cit
y o
f Se
vast
op
ol
Lviv
Zap
ori
zhzh
ya
Do
net
sk
Luh
ansk
Kh
erso
n
Myk
ola
yiv
Dn
ipro
pet
rovs
k
Kh
mel
nyt
skiy
Kh
arki
v
Ivan
o-F
ran
kivs
k
Kir
ovo
hra
d
Po
ltav
a
Sum
y
Ch
ern
ivts
i
Cit
y o
f Ky
iv
Tern
op
il
Vin
nyt
sya
Ch
ern
ihiv
Ch
erka
sy
Vo
lyn
Zhyt
om
yr
Riv
ne
Kyiv
(Ob
last
)
Total number of victims, 2004 Share of victims in regional population (%), 2004

11
unaffected populations should be on average comparable, as they were not systematically
selected.6 In other words, there should be no non-random selection into radiation exposure
based on unobserved heterogeneity (see Section 4).
First, the exposure to radioactive fall-out (external exposure) and the intake of
radionuclide through consumption of contaminated food or inhalation (internal exposure)
might weaken the immune system of the body and lead to deteriorated physical health
(physical health channel).7
It is a highly debated issue whether the catastrophe of
Chernobyl had long-term adverse somatic effects. In the health literature, higher cancer
incidence rates, higher stillbirth incidence and higher mortality rates were recorded and
controversially discussed (Ivanov, Gorski, Maksioutov, Tsyb and Souchkevitch 2001;
Ivanov, Chekin, Parshin, Vlasov, Maksioutov, Tsyb, Andreev, Hoshi, Yamashita and
Shibata 2005). Remennick (2002) shows in a study of immigrants from the former Soviet
Union to Israel that health status of immigrants from contaminated regions was much
lower than of immigrants from non-contaminated Soviet regions and that social adaptation
was significantly poorer. The Chernobyl Forum, a group of eight United Nations
organizations and the three most affected countries Belarus, Russia and Ukraine, has
however reported that measurable health effects are of much lower scale than expected by
common perception once one accounts for the intensified medical screening (United
Nations 2002). Nevertheless, there seems to be consensus on a higher prevalence of
thyroid cancer among children and adolescents in Belarus, Russia and Ukraine
(UNSCEAR 2000). Lehmann and Wadsworth (2011) find a negative association between
Chernobyl exposure and subjective health status in Ukraine, while the association with
objective health measures appears much weaker.
Second, the information policy of the Soviet government which deliberately
concealed the scale and the danger of the accident in 1986 and thereby gave room to
rumours about disastrous health consequences (Baloga, Kholosha and Evdin 2006; Gould
1990), the unresolved scientific debate on expected long-term health consequences as well
as the inability to assess one‘s own type of affectedness have provoked deep rooted fears
6 In the empirical analysis liquidators and evacuees will be excluded from the sample as they might have
been a selected subsample of the population (e.g., military personnel). This will probably underestimate the
size of the true effect. 7 Radionuclides are atoms characterised by the instability of their nucleus. The instability implies radioactive
decay through which gamma rays and subatomic particles are emitted.

12
and uncertainty in the population (Abbott, Wallace and Beck 2006).8 As a consequence,
even physically healthy individuals might be afraid of falling ill. This worry and anxiety
might manifest itself in lower subjective well-being, psychological distress or mental
disease (psychological channel). Mental distress of people exposed to Chernobyl was
found in numerous psychological studies, for both people still residing in affected areas
(Havenaar, Rumyantzeva, van den Brink, Poelijoe, van den Bout, van Engeland and Koeter
1997) and those who emigrated abroad (Zilber and Lerner 1996; Cwikel, Abdelgani,
Rozovski, Kordysh, Goldsmith and Quastel 2000). Symptoms related to the accident and
the following events included, for instance headache, depression, sleep disturbance and
emotional imbalance (UNSCEAR 2000). Significantly higher suicide rates among the
Chernobyl affected population indicate the high mental toll associated to the catastrophe
(Bromet and Havenaar 2007). However, psychological effects are also present when
people care about others. Bridge (2004) finds that emotional stress of parents of disabled
children in Ukraine is substantial and may cause second-order effects on their well-being
and behaviour. Bromet, Goldgaber, Carlson, Panina, Golovakha, Gluzman, Gilbert,
Gluzman, Lyubsky and Schwartz (2000) show that mothers of young children suffer from
serious psychological trauma concerning the health status of their children. Self-
abandonment, feeling of helplessness and lethargy have been described as mental reactions
to uncertainty about own health status and the fear of suffering from cancer
unknowledgeably (United Nations 2002). Overall, mental health stress has been less
contradictory debated in the literature although studies have often used small samples.
Third, there are potential second-order effects on economic success resulting from
Chernobyl related impairment of physical or psychological health: for instance, worse
labour market outcomes, lower income, deprivation or poverty. As Almond, Edlund and
Palme (2009) show Swedish children exposed to the fallout have significantly lower
educational outcomes – which in turn might lead to poorer labour market outcomes in the
long-run. Thus, the catastrophe could also affect subjective well-being indirectly through
these labour market and income channels (indirect channel). Perceived poverty is higher
among those with lower mental well-being (Viinamäki, Kumpusalo, Myllykangas,
Salomaa, Kumpusalo, Kolmakov, Ilchenko, Zhukowsky and Nissinen 1995). Loganovsky,
8 The study by Abbott, Wallace and Beck (2006) rests on qualitative case studies carried out in three different
Chernobyl regions Belarus, Russia and Ukraine in 2003.

13
Havenaar, Tintle, Guey, Kotov and Bromet (2008) find that affected clean-up workers are
more often absent from their workplace due to mental stress.
3 Data and variables
The following subsections describe in more detail the two Ukrainian datasets as
well as the variables used in this study. It also provides an overview of the basic
descriptive statistics of the estimation sample.
3.1 Survey data
To analyse the long-term effects of a catastrophe like Chernobyl on subjective well-
being requires data providing crucial retrospective information on place of living at the
time of the accident (to identify the victims) as well as measures of radio-active irradiation
and personal well-being. The Ukrainian Longitudinal Monitoring Survey (ULMS), a rich
nationally representative panel data set, is a unique source fulfilling all these requirements.
The survey was carried out in the summer months of 2003, 2004 and 2007 by the Kiev
International Institute of Sociology (KIIS) comprising initially more than 8,500 adults aged
15 to 72. The survey comprises an individual questionnaire covering information on socio-
demographic characteristics, labour force participation and occupation, subjective well-
being and health status as well as a household questionnaire focussing on household
composition, incomes and expenditures. One of the main features of the ULMS which will
be exploited in the analysis is a detailed coverage of the retrospective labour market history
(and place of living history) of each individual starting in 1986 – the year of the Chernobyl
catastrophe. The retrospective information is comparatively reliable in the Ukrainian
context because employment details in the Soviet Union and later have been recorded in a
worker specific labour booklet. Interviewers made use of these labour booklets whenever
available.
The sample is restricted to individuals who were born before January 1987 – this
includes all persons born before the catastrophe in April 1986 as well as those children in
utero at that time (as Almond, Edlund and Palme 2009 demonstrate prenatal exposure was
potentially harmful). Furthermore, persons who either acted as liquidators or who were
evacuated from within the 30km exclusion zone or resettled as a consequence of the

14
accident are not included in the regressions.9 The latter two groups were exposed to the
highest doses of external radiation—some of them with lethal doses of 6 Sv and more. The
reasons for excluding these groups are that the aim is to shed light on the average
population affected by low or moderate levels of radiation (and having a lower likelihood
of suffering from somatic diseases) and that these particular persons received special
treatment and attention (e.g., extra health checks and welfare supplements, see Lehmann
and Wadsworth (2011)) so that they are likely to differ from the ordinary population.10
Moreover, this approach circumvents the problems of selective assignment into clean-up
work as well as selective survival of these strongly exposed individuals. The final sample
amounts to 12,000 person-year observations. To be precise, the estimation results will be
representative for the part of the current Ukrainian population which was not subject to
evacuation or Chernobyl related liquidation work and will thus potentially underestimate
the true costs of the catastrophe. It should also be noted that even within this part of the
population it is possible that the most affected individuals will have had a lower survival
probability until the year 2003 and hence a higher probability of being unavailable for the
ULMS interviews (also because of potentially higher morbidity rates or being in hospitals
or nursing homes; it could also be that affected individuals emigrated to other countries).
Their absence from the sample should also generally weaken the results.
A shortcoming of the ULMS is that it does not contain information of mental health
status of the respondents. However, this information is available in another large Ukrainian
micro-data set – the Ukrainian Household Budget Survey (UHBS) conducted by the
Ukrainian Statistical Committee. This annual cross-sectional survey comprises household
and individual level data and takes place each year in December. Each year around 24,000
individuals in about 9,500 households are interviewed. The survey contains an individual
as well as a household questionnaire. Questions on mental health were included in the
years 2004 to 2008, yielding a substantial sample size of more than 95,500 observations for
the analysis. Importantly, in the UHBS survey, each individual is asked whether his/her
health was not at all, somewhat or seriously affected by the Chernobyl catastrophe. The
drawback of the UHBS data is that it lacks retrospective information on place of residence
in 1986. To assure comparability between the two datasets, the UHBS sample is also
9 Questions on whether individuals took part in the liquidation process (70 persons) or whether they were
evacuated or resettled due to the Chernobyl catastrophe (52 persons) were only included in the ULMS survey
in 2007. 10
Evacuated and resettled persons also differ from other (inner) migrants who moved voluntarily, because
they are likely to experience very different problems and chances in their new place of living.

15
restricted to respondents born before 1986 and not older than 72 years at the time of the
interview.
3.2 Self-reported and objective measures of being affected by the
Chernobyl catastrophe
The ULMS 2003 wave contains the following question which is used to construct a
binary measure of being affected by the catastrophe (self-reported affectedness): “Was
your health or the health of a family member affected by the catastrophe in Chernobyl?” 11
The generated variable takes a value of unity for having been affected and zero otherwise.
However, this self-reported measure of affectedness has to be treated with caution for at
least two reasons: First, given the wording of the question, it is not clear whether the
interviewed person was directly affected by the Chernobyl accident or not. Since the
definition of family is rather diffuse (the definition of family does not necessarily coincide
with the definition of household in the survey) this self-reported variable provides a
slightly blurred measure of affectedness (while the variable will measure direct individual
affectedness with an error, it additionally captures possible indirect effects through
affectedness of relatives and therefore provides a more comprehensive measure).12
Second, it is possible that the answers provided by interviewees are correlated with
factors unobservable to the researcher (unobserved heterogeneity, e.g., omitted personality
traits, household or family fixed effects). If these unobservable characteristics
systematically and jointly determine the probabilities of reporting certain levels of life
satisfaction as well as of reporting being affected by the Chernobyl catastrophe this will
lead to biased estimates. Therefore, one of the main goals of this study is to analyse and
test the validity and reliability of these self-reported measures of affectedness.
11
Respondents could answer either yes or no. The question is located at the very end of the individual
questionnaire (next to last question) in the subsection on ecology (containing four questions in total). Hence,
since the question on life satisfaction (as well as on health and work) is covered earlier in the interview, it is
highly unlikely that these answers are biased by having reminded respondents of the Chernobyl catastrophe
(the ordering of the questions makes such emotional spill-overs impossible). Furthermore, since this question
was only included in the 2003 ULMS wave, this 2003 answer is assigned to each individual in the other
survey years as well (thus, emotional spill-overs due to the order of questions should be also highly unlikely
for the life satisfaction answers in 2004 and 2007). 12
If the variable of interest was direct individual affectedness, measurement error of the explanatory variable
should lead to an attenuation bias (underestimation of the true effect).

16
The corresponding Chernobyl question in the UHBS data is very similar: ―Has your
health been affected by the Chernobyl catastrophe?”13
Respondents could answer either
“not at all”, “somewhat affected” or “seriously affected”. The advantage of this variable
is that it is actually more refined than the ULMS question and more precisely targeted at
the individual (rather than the family). However, it can still be influenced from omitted
personality traits.
To this end, results based on the self-reported variable will be contrasted with
estimations using official regional radiation and exposure data that can be matched to
individuals based on their place of residence in the year 1986 (oblast level information).14
This procedure follows the approach by Lehmann and Wadsworth (2011) who also use the
retrospective location information to assign to each individual the corresponding measure
of radioactive exposure. However, while Lehmann and Wadsworth (2011) employ
settlement-level concentrations of caesium-137 deposition in their main analysis (surface
contamination measured in kilobequerels per square metre, kBq/m2), this study uses a
measure of average effective total exposure doses (external and internal)15
of iodine-131
and caesium-137 reflecting the energy absorbed by matter (variable name: radiation
dose).16
While external exposure refers to irradiation from outside of the body, internal
exposure denotes intake of radioactive material into the body through ingestion of food or
inhalation. The relative importance of the external and internal exposure varied widely
across regions in 1986: while the relative contribution of internal to total exposure was less
than 30 percent in several settlements in Zhytomyrska oblast, it was almost 70 percent at
the points of measurement in Vinnitska, Volynska and Cherkaska oblast (see Table 3.3.4 in
the National Report by Baloga, Kholosha and Evdin 2006). Hence, the advantage of this
radiation measure (reflecting the equivalent dose in human bodies) is that it might capture
the actual level radioactive exposure more comprehensively than fallout contamination
(external exposure). This is especially true since household farming activities were
widespread in the Soviet Union so that internal radiation was an important source of
13
Translation by the author (the survey questionnaires are available in Ukrainian only. 14
In the final estimation sample, there are about 500 person-year observations (4.5 percent of the sample)
which did not used to life on Ukrainian territory in 1986. These individuals are assigned zero exposure doses. 15
Although iodine-131 was the most important source of exposure immediately after the accident while
caesium-137 was relatively important, this relative importance changed over time due to the relatively short
half-life of iodine-131 (about 8 days) and the comparatively long half-life of caesium-137 (half-life of 30.8
years). 16
See also explanations in Almond, Edlund and Palme (2009) who use both types of measures in their
analysis.

17
exposure. It should be noted, that Chernobyl-related radiation levels in our sample (as
mentioned before we exclude liquidators and evacuees for several reasons) are modest and
do mostly not exceed the amount of twice the natural background radiation. For the most
affected children, the iodine-137 doses were stronger and equalled about 100 abdominal x-
rays (for adults).
One caveat of radiation data in general is that it is only measured in certain location
points (discrete sampling) and is then extrapolated to larger areas by the scientists.17
In
other words, individual level doses (based on individual medical examinations) are not
available for the entire population and hence, the radiation variables reflect regional
averages (data for the 26 Ukrainian oblasts). These averages hide intraregional variation in
radioactive exposure (loss of precision in the measurement) which was caused by
meteorological conditions (speed and direction of wind and rain) as well as natural borders
and the roughness of the underlying surface (European Commission 1998). In an additional
analysis, gender specific average thyroid doses absorbed by children and adolescents due
to the fallout of radioiodine (especially iodine-131) will be used to investigate the long-run
effect on individuals aged one to 18 years at the time of the accident.18
Table 3 provides an
overview of the radiation measures used in this study.
Table 3: Official exposure doses used in the empirical analysis
Measures of radiation
1. Average total (internal + external) exposure doses, accumulated in 1986, mSv
[Variable name: Radiation dose]
2. Average total (internal + external) exposure doses, accumulated 1986-2005, mSv
3. Average thyroid doses (mGy) due to fallout of iodine-131, females aged 1-18 in 1986
4. Average thyroid doses (mGy) due to fallout of iodine-131, males aged 1-18 in 1986
Notes: Data taken from the official report ‗20 years after Chornobyl Catastrophe. Future outlook: National
Report of Ukraine‘, Tables 3.3.7 and 3.3.9 (Baloga, Kholosha and Evdin (2006), pages 45, 47, 48) While
radiation doses of ground contamination measure the radioactivity of the material (in bequerel), the dose
equivalent of ionising radiation measures the biological effects in the human organisms (in sievert; mSv –
millisievert). The deposited energy is measured in gray (mGy - milligray).
17
The effective internal exposure was estimated based on almost 30,000 WBC measurements in 1986 (whole
body counter; caesium-137 content in residents' organism; see Baloga, Kholosha and Evdin 2006). The
average effective external exposure to caesium-137 takes into account measurements at all rural and urban
settlement points. 18
These average regional absorbed thyroid doses are estimated based on 150,000 direct measurement of
radioiodine activity in the thyroid gland of individuals living in the most contaminated regions (Baloga,
Kholosha and Evdin 2006).

18
Figure 3: Relationship between official and self-reported measures of affectedness
Notes: The deposited energy for the most affected children is equivalent to 100 abdominal X-ray scans for
adults. Number of observations is 12,003. Source: ULMS 2003-2007, own calculations.
.5.6
.7.8
.9
Pro
po
rtio
n c
laim
ing
affecte
dn
ess
0 2 4 6Exposure doses
Dose mSv, 1986
Cumul. Dose mSv, 1986-2005
kernel = epanechnikov, degree = 0, bandwidth = .45
Local polynomial smooth.5
.6.7
.8.9
Pro
po
rtio
n c
laim
ing
affecte
dn
ess
0 20 40 60 80 100Exposure doses
Thyroid dose, females 1-18, mGv, 1986-2005
Thyroid dose, males 1-18, mGv, 1986-2005
kernel = epanechnikov, degree = 0, bandwidth = 5
Local polynomial smooth

19
The unconditional relationship between these official doses and the self-reported
measure of affectedness is illustrated in the two graphs in Figure 3. These graphs plot
estimates from smoothed kernel regressions of regional shares of self-reported affected
individuals on objective average exposure doses. If self-reported measures were good
representations of objective radiation one would expect a positive relationship. Indeed,
both diagrams show a strong positive relationship between the two types of measures.
These strong correlations will be the basis for the first stage in the instrumental variable
approach, where the official radiation levels will be used to test for possible biases in the
self-reported measure.
3.3 Outcome variables
Generally, subjective-wellbeing (utility) is not observable to the researcher.
Therefore survey questions on the personal assessment of life satisfaction have been used
as approximations in the literature. The justification for using these proxies rests on
research during the past decades which has shown that life satisfaction is responsive to
changes in external factors (Clark, Frijters and Shields 2008). The main dependent variable
of individual subjective well-being used in the following analysis is measured on a five-
point Likert scale from fully dissatisfied (1) to fully satisfied (5) and is based on the
question: “To what extent are you satisfied with your life in general at the present time?‖
The distribution of the responses to this question by self-reported affectedness is
shown in Figure 4. The dark grey columns represent the answers of persons who say that
they were affected by Chernobyl. Respondents in this group report being fully dissatisfied
with their life in the period 2003 to 2007 more often than not affected persons (23.8 versus
17.6 percent). Conversely, individuals who say that they were not affected by Chernobyl
have a higher likelihood to be satisfied or fully satisfied with their lives. Hence, this graph
points to a negative relationship between self-reported affectedness and life satisfaction. A
simple mean comparison test reveals that the difference between untreated persons
(average life satisfaction: 2.68) and treated persons (average life satisfaction: 2.48) is
highly significantly different from zero (difference: 0.20, std. error: 0.02; t-value 10.74).

20
Figure 4: Distribution of life satisfaction of affected and non-affected persons (self-
reported measure; %)
Source: ULMS 2003-2007, estimation sample (number of observations: 11,065); own calculations.
In addition to the five-point life satisfaction variable, a binary dependent variable
(unhappy) was generated identifying all individuals who answered being fully dissatisfied
with their life.
The assessment of the effect of the 1986 nuclear accident on subsequent mental
health relies on two alternative outcome variables from the UHBS dataset: depression and
trauma. These two variables are available in the UHBS surveys 2004 to 2008. Depression
is a binary variable indicating persons reported to have ‗chronic anxiety or depression‘ as a
6 months or longer illness or health problem. Trauma indicates respondents who have been
diagnosed by a physician as suffering from a psychological trauma (post-traumatic stress).
In an extension to the main analysis, possible changes in subjective perceptions as
well as behavioural consequences are investigated using the following additional
dependent variables: (i) own survival probability to a specific age (ULMS 2007), (ii)
currently smoking (binary variable indicating risky health behaviour; ULMS, UHBS) and
(iii) dependency on social state transfers (UHBS). The latter variable represents the share
of government transfers in personal income and is used to estimate the transfer dependency
23.8
27.8
24.7
20.3
3.5
17.6
27.6
24.925.9
4.1
0.0
5.0
10.0
15.0
20.0
25.0
30.0
Fully dissatisfied Dissatisfied Neither satisfied, nor dissatisfied
Satisfied Fully satisfied
%
Affected by Chernobyl
Not affected by Chernobyl

21
of a person affected by Chernobyl (these regressions control for employment status and the
receipt of Chernobyl assistance).
3.4 Control variables
To control for possible differences in group composition as well as possible
confounding effects (i.e., omitted variables), several sets of control variables relating to
individual demographic and household characteristics, health status, work and wealth as
well as personality traits will be included in the regressions. Furthermore, all regressions
include a set of basic controls like survey year, interview month and region fixed effects.
The standard socio-demographic controls are gender, age, marital status, education19
and
household size. In the literature age has been regularly found to exhibit a U-shaped impact
on happiness (Blanchflower and Oswald 2008). Therefore a quadratic term is added to the
regressions as well as a cubic in age which seems to further improve the fit of our
regressions. Furthermore, log of per-capita household income and living space per capita
(as a proxy for permanent income) are included to control for wealth status which has been
shown to be positively correlated with subjective well-being in transition countries (Senik
2004; Blanchflower and Oswald 2004). The two health measures used in the analysis as
explanatory variables are a dummy variable for all individuals having at least one out of
seven different chronic diseases20
(chronic) and a variable containing the individuals body
mass index (bmi). As several of these controls might be endogenous in a life satisfaction
regression, they are added in a stepwise fashion. Since the measure of Chernobyl
affectedness is time-invariant, it is not possible to apply fixed effects estimation in order to
control for time-invariant personality traits that are generally highly correlated with life
satisfaction.21
Nevertheless, following the suggestion by Ferrer-i-Carbonell and Frijters
(2004) to account for this potential unobserved heterogeneity, the regressions will also
include proxies for specific individual traits, in particular extroversion and neuroticism.
Although the ULMS does not provide a full battery of questions to study psychological
traits in detail, interviewers have to assess the respondent‘s general behaviour and attitude
19
Education is recoded from highest educational degree obtain into adjusted years of schooling. 20
The seven categories are: heart disease, illness of the lungs, liver disease, kidney disease, gastrointestinal
disease, spinal problems, or other chronic illnesses. 21
Recall though that the individual level of affectedness of the nuclear accident should be orthogonal to the
personality traits (as well as other unobserved heterogeneity) due to the randomness of the exogenous shock.

22
at the end of each interview. Two of these questions are used to generate these two proxy
variables (see Table A 1 in the Appendix for a more detailed description).22
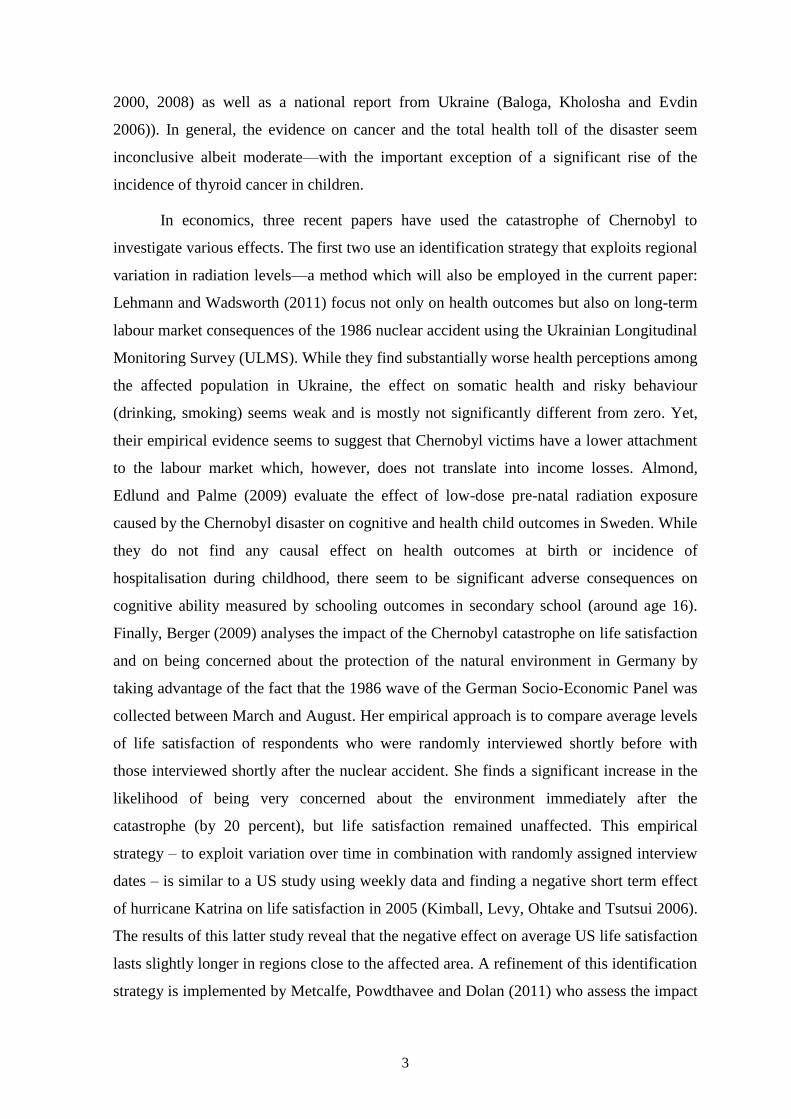
Descriptive statistics of all these variables are provided in Table 4. The mean level
of life satisfaction is 2.58 (with a standard deviation of 1.16). As established for other
transition countries, average life satisfaction in Ukraine is lower than in industrialised
Western economies (Selezneva 2011). About 22 percent of the sample report to be fully
dissatisfied with their lives (unhappy) and 60 percent of the respondents answer that they
were affected by the Chernobyl catastrophe. The majority of the sample lives in urban
areas (town or city), is female (60 percent; this corresponds well to the gender gap
documented in official national statistics, especially at older ages) and married (over 70
percent). The average age of respondents is about 46.5 years. About half of the sample is
working in the reference week and about 20 percent of the observations are non-working
pensioners in the official pension age. As regards the personality traits, only two percent of
the observations are classified as ‗neurotic‘, while 14 percent of the sample is classified as
‗extrovert‘.
22
A simple test on the stability of externally assessed traits over time shows substantial stability for
extroversion, but more mixed evidence for neuroticism. It should be noted, that interviewers (who made the
assessments) might differ over time.
23
Table 4: Descriptive statistics (ULMS 2003-2007)
Variable Mean Min. Max. Number of
observations
Dependent variables Life satisfaction (Std. deviation: 1.16) 2.58 1 5 12003
Unhappy 0.22 0 1 12003
Radiation measures Self-reported affectedness 0.60 0 1 12003
Radiation Dose (mSv)23
0.94 0 2.10 12003
Demographic and health controls
Village (omitted category) 0.35 0 1 12003
Town 0.26 0 1 12003
City 0.39 0 1 12003
Male 0.40 0 1 12003
Age 46.56 17 72 12003
Age squared 2379.89 289 5625 12003
BMI 26.08 13.52 60.17 11270
Chronic disease 0.58 0 1 11789
Marital status and occupation
Single (omitted category) 0.11 0 1 12003
Married 0.71 0 1 12003
Widowed 0.09 0 1 12003
Separated 0.09 0 1 12003
Working 0.54 0 1 12003
Unemployed 0.07 0 1 12003
Pensioner 0.24 0 1 12003
Inactive, working age 0.15 0 1 12003
Other occupation (omitted category) 0.05 0 1 12003
Household characteristics, wealth and education Household size 3.30 1 13 12003
Log household income 6.49 0 9.40 12003
Housing space per capita 23.21 0.67 152.00 12003
Primary education (omitted category) 0.18 0 1 12003
General secondary educ. 0.39 0 1 12003
Professional second. educ. 0.27 0 1 12003
Higher education 0.17 0 1 12003
Personality traits, Soviet job info
Neurotic 0.02 0 1 12003
Extrovert 0.14 0 1 12003
Source: ULMS 2003-2007; own calculations.
23
Average total (internal + external) exposure doses of caesium-137 and iodine-131, accumulated in 1986,
mSv (source: National Report by Baloga, Kholosha and Evdin (eds.) 2006).

24
4 Methodology
In order to analyse the presence of long-term effects of the Chernobyl catastrophe
on subjective well-being/mental health SWBit the following model is estimated:
itioit XssAffectedneSWB '1 . (3.1)
The coefficient of interest is β1 which measures the impact of being affected by
Chernobyl (according to the self-reported or official radiation measures) on subjective
well-being. Should long-term psychological effects exist, the estimated 1 is expected to
have a negative sign. Without adding further controls for potential channels to the
regressions 1 should capture the overall or composite effect of the nuclear accident on
today‘s life satisfaction and mental health. However, to shed light on possible channels
through which Chernobyl might have affected long-term well-being, different sets of
control variables are included in X one after the other. Initially, pre-determined personal
characteristics (gender and age) are added to the regressions to control for possible
composition effects. This is followed by variables measuring the health status of
individuals (health channel), marital status to capture possible effects of widowhood
(widowhood), a set of dummy variables for current occupation (labour force participation
channel), several education, income and wealth indicators (human capital and income
channel), proxies for extroversion and neuroticism (personality traits) as well as three
controls for occupational activity during the Soviet Union. If these sets of variables reflect
different channels, their inclusion should gradually reduce to overall size of the 1
coefficient. All specifications control for type of settlement (village, town or city), region
(26 oblasts) and year as well as month of interview fixed effects.24
As regards the estimation method, at first, pooled cross sectional regressions
controlling for intrapersonal correlation of the error terms over time are estimated by
ordinary least squares (pooled OLS with standard errors clustered at the individual level).
The results are robust to the use of regionally clustered standard errors. While OLS
estimates are intuitively to interpret and are consistent under classical assumptions, they do
not account for the categorical character of the dependent variable (and are therefore less
efficient). To test the sensitivity of the results with respect to this estimation method, the
24
Clark and Oswald (2002) suggest the inclusion of day-of-the-week effects into well-being regressions. The
inclusion of such controls changes the size of the coefficients of interest by less than one percent.

25
same set of specifications will be re-estimated using ordered Probit methods (as argued by
Ferrer-i-Carbonell and Frijters 2004 this should not change the results significantly).
Furthermore, to account for the panel structure of the data (repeated individual
observations over time) panel estimations will be performed as additional robustness
checks. Due to the fact that having been affected by the catastrophe is a time invariant
variable, it is not possible to perform fixed effects estimations (this is true for both, the
self-reported and official radiation measures). Instead, random effects models will be
estimated.
Another econometric issue which might threaten the validity and informational
value of the estimated effects relates to the self-reported measure of affectedness. As
already mentioned, the estimation will be biased if claiming to be affected by Chernobyl is
endogenous (driven by omitted factors which simultaneously affect life satisfaction) or if it
is plagued by measurement error (as the ULMS question alludes to family level rather than
individual affectedness). The last aspect might be less problematic if the actual mechanism
through which Chernobyl impacts subjective well-being involves family member‘s health
and (mental) well-being. Nevertheless, as regards the expected direction of these two
potential biases, the second problem (measurement error) should lead to an attenuation
bias, while the direction of the first potential bias is difficult to predict (there could be an
upward bias (i.e. the effect could be overestimated) if, for instance, more neurotic
individuals were more prone to report being affected as well as having lower levels of life
satisfaction; another example would be, if persons with lower baseline levels of life
satisfaction tend to claim to have been affected by the Chernobyl catastrophe in order to
explain their lower happiness level).
To purge the estimates from these two potential biases individual self-reported
affectedness will be instrumented using the official regional radiation doses. This approach
is based on the implicit assumption that self-reported affectedness is related to radiation
doses in the following way (first stage specification):
itoit XRadiationssAffectedne '1 (3.2)
Radiation is the objectively measured dosage that people living in particular
regions have received according to their place of residence in 1986. X is a set of control
variables. If the self-reported measures are biased, the instrumental variable approach
should help to correct for both problems. The exclusion restriction of this instrumental

26
variable approach assumes that there are no direct effects of radiation on life satisfaction –
other than through perceived affectedness.
Another threat to the identification strategy would be if the 1986 location choice of
individuals and families was endogenous, i.e. if, for instance, certain types were more
likely to live in close proximity to potential sources of danger like nuclear power plants
(Almond, Edlund and Palme 2009). However, this aspect seems to be of minor relevance
(if at all) for the current empirical analysis for at least three reasons: first, during the Soviet
Union the geographical mobility of workers and families was highly regulated and
monitored by the authorities so that location choice by individuals was rather limited25
;
second, it is likely that the awareness of potential hazards by nuclear power plants was
much lower before the Chernobyl disaster than afterwards (the fact that even the first days
after the nuclear accident the event was concealed from the public and that Soviet mass
media was prohibited to report about the recovery work26
seems to support the idea that the
public was not generally aware of potential dangers); third, the weather conditions caused
substantial geographical variation in exposure doses so that the degree of radiation was not
a simple monotonic function of distance to the nuclear power plant (Lehmann and
Wadsworth 2011).
5 Is there a long-term effect of the Chernobyl catastrophe on subjective
well-being?
5.1 Estimation results based on self-reported affectedness
The OLS estimation results based on the self-reported measure of affectedness are
reported in Table 5. With only basic controls, the coefficient of interest is negative and
highly significant suggesting a long-term negative impact of the Chernobyl catastrophe on
subjective well-being (the estimate in column 1 corresponds to one sixth of a standard
deviation).
25
Labour market choices and mobility of individuals were limited due to the internal passport system as well
as to the administrative allocation of housing during the Soviet Union (Gregory and Kohlhase 1988). Choice
options of individuals were also restricted by geographic availability of jobs and industries. The spatial
segregation of production enforced by the planners limited the diversity of industries within certain regions
(Friebel and Guriev 2005). In extreme cases, the entire population of an area was working in a single, large
state-owned enterprise (one company towns). 26
See Chapter 1 in the National Report by Baloga, Kholosha and Evdin (eds.) 2006.

27
Table 5: Self-reported affectedness and life satisfaction (Dependent variable: Life satisfaction; OLS estimations)
(1) (2) (3) (4) (5) (6) (7)
Self-reported affectedness -0.190*** -0.115*** -0.101*** -0.106*** -0.099*** -0.098*** -0.098***
(0.022) (0.022) (0.023) (0.023) (0.022) (0.022) (0.022)
Town 0.105*** 0.097*** 0.105*** 0.114*** 0.097*** 0.042 0.041
(0.028) (0.027) (0.028) (0.028) (0.028) (0.028) (0.028)
City 0.197*** 0.178*** 0.203*** 0.221*** 0.178*** 0.072** 0.068**
(0.027) (0.026) (0.027) (0.027) (0.027) (0.028) (0.028)
Male 0.082*** 0.051** 0.022 -0.006 0.027 0.036
(0.021) (0.022) (0.022) (0.022) (0.022) (0.022)
Age -0.118*** -0.119*** -0.162*** -0.199*** -0.188*** -0.186***
(0.022) (0.022) (0.024) (0.024) (0.024) (0.024)
Age squared 0.002*** 0.002*** 0.003*** 0.004*** 0.003*** 0.003***
(0.001) (0.001) (0.001) (0.001) (0.001) (0.001)
Age cubicA -0.000*** -0.000*** -0.000*** -0.000*** -0.000*** -0.000***
(0.000) (0.000) (0.000) (0.000) (0.000) (0.000)
BMI 0.004* 0.003 0.002 0.003 0.003
(0.002) (0.002) (0.002) (0.002) (0.002)
Chronic disease -0.290*** -0.284*** -0.258*** -0.248*** -0.249***
(0.023) (0.023) (0.023) (0.022) (0.022)
Married 0.263*** 0.241*** 0.255*** 0.249***
(0.045) (0.043) (0.043) (0.043)
Widowed 0.072 0.054 0.103* 0.100*
(0.059) (0.057) (0.057) (0.057)
Separated 0.003 -0.026 0.019 0.016
(0.056) (0.054) (0.053) (0.053)
Working 0.491** 0.402* 0.392*
(0.229) (0.218) (0.220)
Unemployed -0.239 -0.194 -0.200
(0.231) (0.221) (0.222)
Pensioner 0.182 0.201 0.192

28
(0.231) (0.220) (0.221)
Inactive 0.196 0.225 0.218
(0.230) (0.219) (0.221)
Household size -0.013 -0.012
(0.010) (0.010)
Log household income 0.173*** 0.169***
(0.016) (0.016)
Housing space per capita 0.005*** 0.005***
(0.001) (0.001)
General secondary educ. 0.030 0.028
(0.031) (0.031)
Professional second. educ. 0.147*** 0.142***
(0.033) (0.033)
Higher education 0.378*** 0.362***
(0.037) (0.038)
Neurotic -0.210***
(0.065)
Extroverted 0.122***
(0.030)
Constant 3.099*** 5.200*** 5.122*** 5.714*** 5.921*** 4.589*** 4.552***
(0.344) (0.493) (0.432) (0.491) (0.540) (0.556) (0.553)
R-squared 0.088 0.120 0.134 0.141 0.170 0.200 0.202 Notes:
A The actual size of the estimated coefficient is -0.0000145 (column 2). All regressions control for region, year and interview month fixed effects. Number of
observations is 12,003 (columns 1-2) and 11,065 (columns 3-7). Standard errors are clustered on the individual level. Robust standard errors in parentheses. *** p<0.01, **
p<0.05, * p<0.1. Source: ULMS 2003-2007, own calculations.
29
Adding basic demographic characteristics (gender and age, column 2) reduces the
size of the estimated effect significantly (from -0.19 to -0.12). This seems to suggest that
part of the estimated overall Chernobyl effect can be explained by gender and age
differences (which in turn might be related to differential morbidity levels or psychological
responses across age groups and gender). In general, men seem to be significantly more
satisfied with their lives than women (however, this coefficient becomes smaller and
insignificant once further controls are included in the estimation). Furthermore, the
estimated age coefficients seem to support the notion that life satisfaction in Ukraine
follows the U-shape pattern also found in other countries (Blanchflower and Oswald
2008).27
The inclusion of the two proxies for health status (column 3) reduces the Chernobyl
coefficient only slightly, but leads to a drop in the estimated male coefficient (suggesting
gender differences in health status). Perhaps not surprisingly, persons suffering from
chronic illnesses have a lower life satisfaction than healthy persons. Starting from column
3, the estimated coefficient of being affected by the nuclear accident remains almost
unchanged throughout all specifications (about -0.10 which corresponds to about one tenth
of a standard deviation), suggesting only a minor direct role of these other possible
channels. The separate reduced form estimates of having lived in regions that were affected
by high radiation levels in the study by Lehmann and Wadsworth (2011) show that
residents of these areas are slightly less attached to the labour market (lower probability of
working and reduced working hours; but there seems to be no effect on monthly wages).
Nevertheless, as regards the estimated effects of these other control variables on life
satisfaction several important findings emerge: married persons and individuals in work
are on average more satisfied with their lives, widowhood seems to be surprisingly
positively related with life satisfaction. Furthermore, higher household income and wealth
as well as higher levels of education are associated with higher levels of life satisfaction.
The two indicators for personality traits seem to be significantly related to subjective well-
being and show the expected sign: while neurotic persons are on average significantly less
satisfied with their lives, extrovert individuals are more satisfied.
These significantly negative findings of being affected by the Chernobyl
catastrophe on subjective well-being based on the pooled OLS models also hold when
27
Although the cubic coefficient is significantly negative, it is extremely small and excluding the cubic term
from the regression does not affect the found U-shape in age, see Section 5.4.5.

30
estimating ordered Probit (pooled sample, clustering standard errors on the individual
level) and random effects panel models (see Panel A in Table A 2 and Table A 3 in the
appendix). The marginal effects for the five different satisfaction outcomes show that
being affected by the nuclear accident significantly increases the probability of reporting
lower levels of life satisfaction (being fully dissatisfied and dissatisfied) and decreases the
probability of reporting higher levels of satisfaction with life. The size of the estimated
coefficients based on the random effects panel models is almost identical to the pooled
OLS regressions (however, the standard errors become slightly larger).
5.2 Testing causality using official radiation measures
To test whether the estimates based on the self-reported measure of affectedness
suffer from endogeneity or measurement bias, the regressions are re-estimated using the
official regional radiation doses to which individuals were exposed during 1986 (according
to their place of residence at that time). The coefficients of interest from these reduced
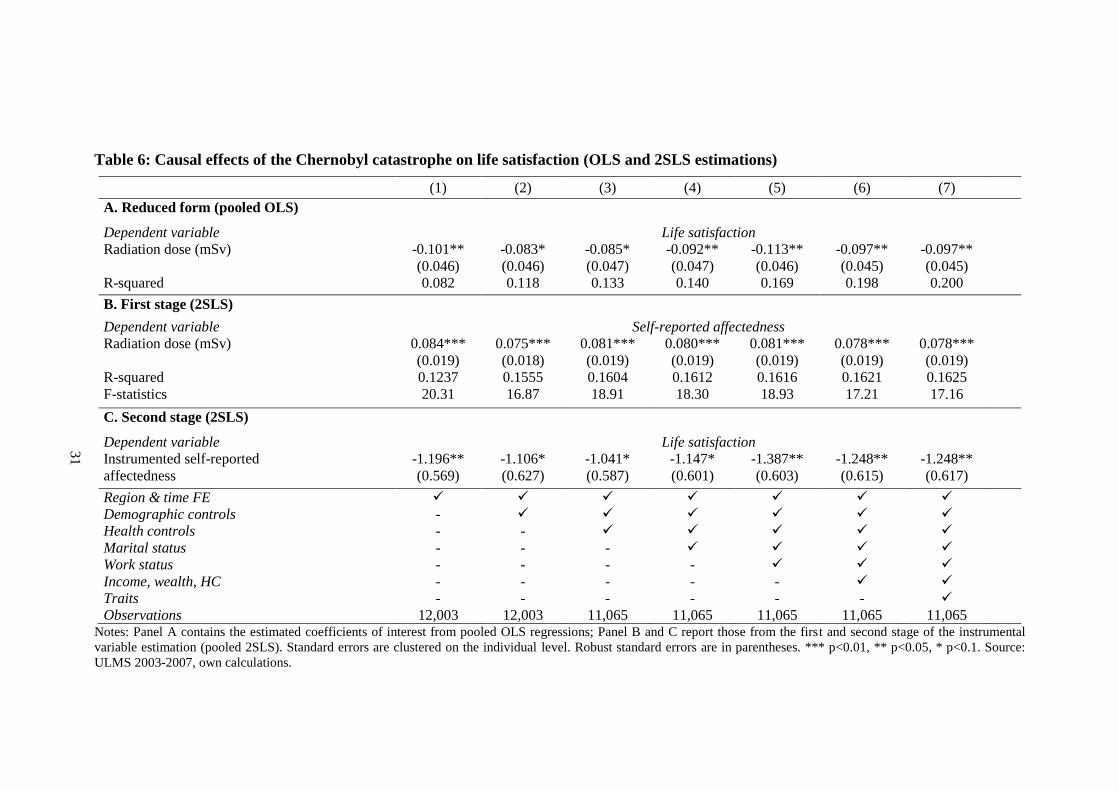
form regressions are reported in Panel A in Table 6. Even though the estimates cannot be
compared directly, since the self-reported measure is a binary variable while the radiation
dose is a continuous variable, the qualitative findings remain the same. Throughout all
specifications higher levels of radiation doses have a significantly negative impact on life
satisfaction even 17 to 21 years after the nuclear accident. Having been exposed to a one
millisievert higher radiation dose causes a drop in subjective well-being by 0.1 points on
the five-point Likert scale. In contrast to the results using the self-reported measure, the
estimates using radiation doses are very stable across specifications suggesting that the
effect is largely unaffected by any of the controls. Still, the results from these reduced form
regressions provide first evidence that the estimates based on the self-reported measures
are not completely driven by biases (spurious correlations). The same is true when
repeating the ordered Probit regressions using the official radiation doses: higher doses
reduce the probability to have higher levels of life satisfaction and increase the likelihood
of being fully dissatisfied with life (see Panel B of Table A 2).
31
Table 6: Causal effects of the Chernobyl catastrophe on life satisfaction (OLS and 2SLS estimations)
(1) (2) (3) (4) (5) (6) (7)
A. Reduced form (pooled OLS)
Dependent variable Life satisfaction
Radiation dose (mSv) -0.101** -0.083* -0.085* -0.092** -0.113** -0.097** -0.097**
(0.046) (0.046) (0.047) (0.047) (0.046) (0.045) (0.045)
R-squared 0.082 0.118 0.133 0.140 0.169 0.198 0.200
B. First stage (2SLS)
Dependent variable Self-reported affectedness
Radiation dose (mSv) 0.084*** 0.075*** 0.081*** 0.080*** 0.081*** 0.078*** 0.078***
(0.019) (0.018) (0.019) (0.019) (0.019) (0.019) (0.019)
R-squared 0.1237 0.1555 0.1604 0.1612 0.1616 0.1621 0.1625
F-statistics 20.31 16.87 18.91 18.30 18.93 17.21 17.16
C. Second stage (2SLS)
Dependent variable Life satisfaction
Instrumented self-reported -1.196** -1.106* -1.041* -1.147* -1.387** -1.248** -1.248**
affectedness (0.569) (0.627) (0.587) (0.601) (0.603) (0.615) (0.617)
Region & time FE
Demographic controls -
Health controls - -
Marital status - - -
Work status - - - -
Income, wealth, HC - - - - -
Traits - - - - - -
Observations 12,003 12,003 11,065 11,065 11,065 11,065 11,065 Notes: Panel A contains the estimated coefficients of interest from pooled OLS regressions; Panel B and C report those from the first and second stage of the instrumental
variable estimation (pooled 2SLS). Standard errors are clustered on the individual level. Robust standard errors are in parentheses. *** p<0.01, ** p<0.05, * p<0.1. Source:
ULMS 2003-2007, own calculations.
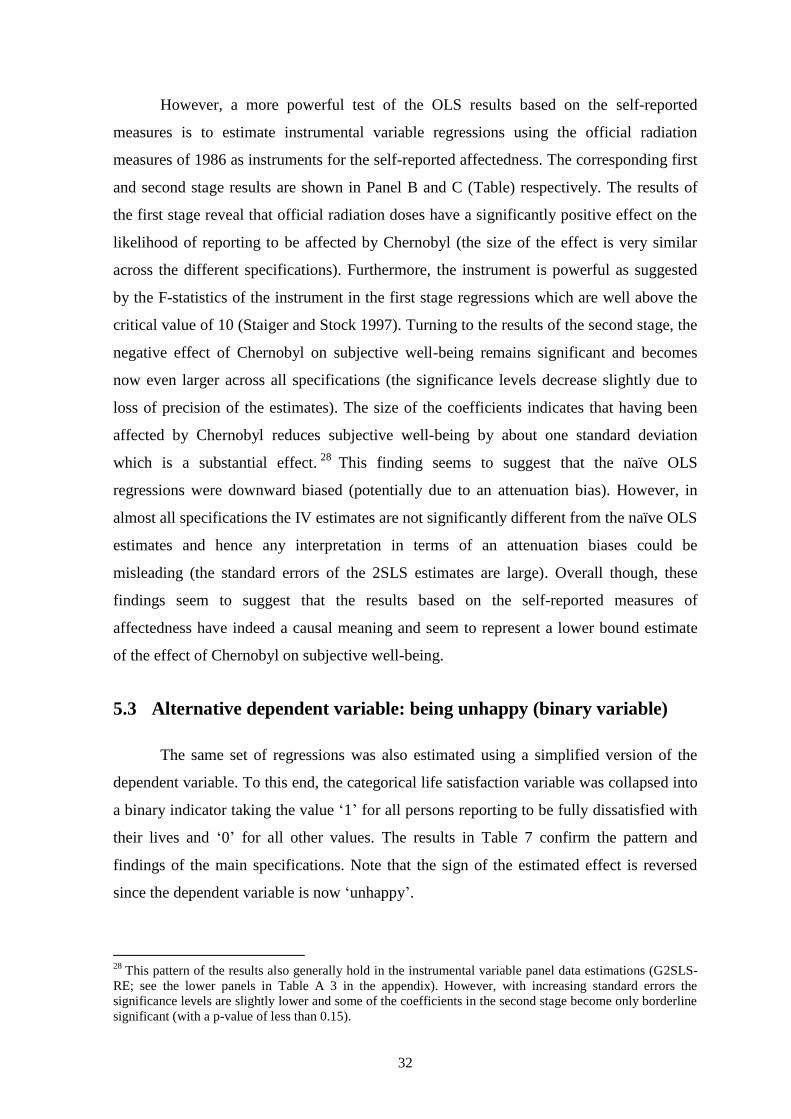
32
However, a more powerful test of the OLS results based on the self-reported
measures is to estimate instrumental variable regressions using the official radiation
measures of 1986 as instruments for the self-reported affectedness. The corresponding first
and second stage results are shown in Panel B and C (Table) respectively. The results of
the first stage reveal that official radiation doses have a significantly positive effect on the
likelihood of reporting to be affected by Chernobyl (the size of the effect is very similar
across the different specifications). Furthermore, the instrument is powerful as suggested
by the F-statistics of the instrument in the first stage regressions which are well above the
critical value of 10 (Staiger and Stock 1997). Turning to the results of the second stage, the
negative effect of Chernobyl on subjective well-being remains significant and becomes
now even larger across all specifications (the significance levels decrease slightly due to
loss of precision of the estimates). The size of the coefficients indicates that having been
affected by Chernobyl reduces subjective well-being by about one standard deviation
which is a substantial effect.28
This finding seems to suggest that the naïve OLS
regressions were downward biased (potentially due to an attenuation bias). However, in
almost all specifications the IV estimates are not significantly different from the naïve OLS
estimates and hence any interpretation in terms of an attenuation biases could be
misleading (the standard errors of the 2SLS estimates are large). Overall though, these
findings seem to suggest that the results based on the self-reported measures of
affectedness have indeed a causal meaning and seem to represent a lower bound estimate
of the effect of Chernobyl on subjective well-being.
5.3 Alternative dependent variable: being unhappy (binary variable)
The same set of regressions was also estimated using a simplified version of the
dependent variable. To this end, the categorical life satisfaction variable was collapsed into
a binary indicator taking the value ‗1‘ for all persons reporting to be fully dissatisfied with
their lives and ‗0‘ for all other values. The results in Table 7 confirm the pattern and
findings of the main specifications. Note that the sign of the estimated effect is reversed
since the dependent variable is now ‗unhappy‘.
28
This pattern of the results also generally hold in the instrumental variable panel data estimations (G2SLS-
RE; see the lower panels in Table A 3 in the appendix). However, with increasing standard errors the
significance levels are slightly lower and some of the coefficients in the second stage become only borderline
significant (with a p-value of less than 0.15).

33
Table 7: Causal effects of the Chernobyl catastrophe on ‘being unhappy’ (Probit and 2SLS regressions)
(1) (2) (3) (4) (5) (6) (7)
A. Naïve regressions (Probit)
Dependent variable Unhappy (0/1)
Self-reported affectedness 0.054*** 0.036*** 0.034*** 0.037*** 0.035*** 0.034*** 0.034***
(0.008) (0.008) (0.008) (0.008) (0.008) (0.008) (0.008)
B. Reduced form (Probit)
Dependent variable Unhappy (0/1)
Radiation dose (mSv) 0.050*** 0.042** 0.036** 0.038** 0.048*** 0.044** 0.045**
(0.018) (0.018) (0.018) (0.018) (0.018) (0.018) (0.018)
C. First stage (2SLS)
Dependent variable Self-reported affectedness
Radiation dose (mSv) 0.084*** 0.075*** 0.081*** 0.080*** 0.081*** 0.078*** 0.078***
(0.019) (0.018) (0.019) (0.019) (0.019) (0.019) (0.019)
F-statistics 20.31 16.87 18.91 18.31 18.93 17.21 17.16
D. Second stage (2SLS)
Dependent variable Unhappy (0/1)
Instrumented self-reported
affectedness
0.561*** 0.559** 0.486** 0.517** 0.593*** 0.570** 0.582**
(0.211) (0.234) (0.216) (0.222) (0.223) (0.231) (0.233)
Region & time FE
Demographic controls -
Health controls - -
Marital status - - -
Work status - - - -
Income, wealth, HC - - - - -
Traits - - - - - -
Observations 12,003 12,003 11,065 11,065 11,065 11,065 11,065
Notes: Panel A and B report marginal effect from pooled Probit regressions for the binary variable ‗unhappy‘; Panel C and D report the estimated coefficients from the 2SLS
regressions (linear probability models). The variable ‗unhappy‘ indicates individuals answering ‗fully unsatisfied‘ on the life satisfaction question. Standard errors are
clustered on the individual level. Robust standard errors are in parentheses. *** p<0.01, ** p<0.05, * p<0.1. Source: ULMS 2003-2007, own calculations.
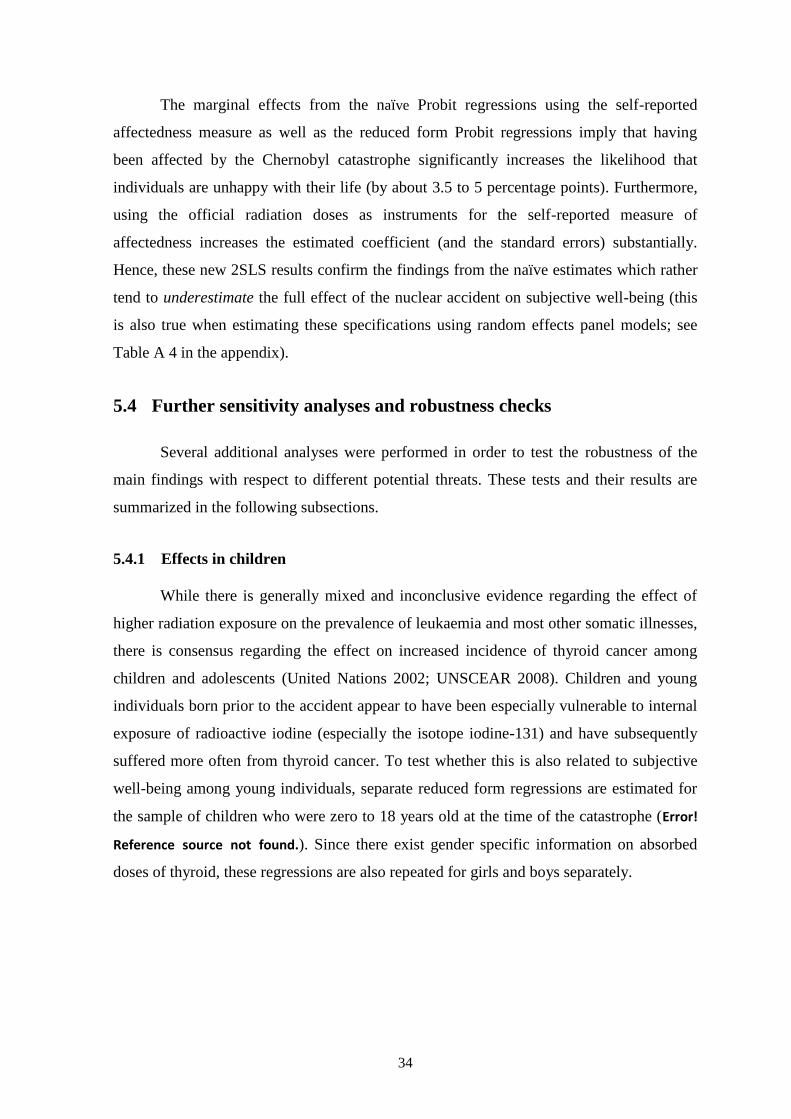
34
The marginal effects from the naïve Probit regressions using the self-reported
affectedness measure as well as the reduced form Probit regressions imply that having
been affected by the Chernobyl catastrophe significantly increases the likelihood that
individuals are unhappy with their life (by about 3.5 to 5 percentage points). Furthermore,
using the official radiation doses as instruments for the self-reported measure of
affectedness increases the estimated coefficient (and the standard errors) substantially.
Hence, these new 2SLS results confirm the findings from the naïve estimates which rather
tend to underestimate the full effect of the nuclear accident on subjective well-being (this
is also true when estimating these specifications using random effects panel models; see
Table A 4 in the appendix).
5.4 Further sensitivity analyses and robustness checks
Several additional analyses were performed in order to test the robustness of the
main findings with respect to different potential threats. These tests and their results are
summarized in the following subsections.
5.4.1 Effects in children
While there is generally mixed and inconclusive evidence regarding the effect of
higher radiation exposure on the prevalence of leukaemia and most other somatic illnesses,
there is consensus regarding the effect on increased incidence of thyroid cancer among
children and adolescents (United Nations 2002; UNSCEAR 2008). Children and young
individuals born prior to the accident appear to have been especially vulnerable to internal
exposure of radioactive iodine (especially the isotope iodine-131) and have subsequently
suffered more often from thyroid cancer. To test whether this is also related to subjective
well-being among young individuals, separate reduced form regressions are estimated for
the sample of children who were zero to 18 years old at the time of the catastrophe (Error!
Reference source not found.). Since there exist gender specific information on absorbed
doses of thyroid, these regressions are also repeated for girls and boys separately.

35
Table 8: Robustness check: Effect of absorbed thyroid doses on 1986-children and
adolescents
(1) (2) (3) (4)
Children aged
0-18 in 1986
Children aged
0-18 in 1986
Girls aged
0-18 in 1986
Boys aged
0-18 in 1986
Dependent variable Life satisfaction
Log thyroid dose -0.013* -0.020**
females aged 1-18 (0.007) (0.009)
Log thyroid dose -0.013* 0.003
dose males aged 1-18 (0.007) (0.013)
Demographic controls
Household controls
Health & traits
Observations 3,532 3,532 2,052 1,480
R-squared 0.195 0.195 0.186 0.240
Notes: Samples comprise only children who were aged zero to 18 in the year 1986 (born before January
1987). Absorbed thyroid doses are log transformed. Standard errors are clustered on the individual level.
Robust standard errors in parentheses. *** p<0.01, ** p<0.05, * p<0.1. Source: ULMS 2003-2007; own
calculations.
The results in the first two columns of Table 8 reveal that exposure to higher iodine
doses has a significantly negative effect on long-run life satisfaction. When splitting the
sample by gender the picture is similar to the findings on the whole population: the
reduced form estimates indicate a significant negative long-run effect for girls, while boys‘
life satisfaction seems to be unaffected.
5.4.2 Personality traits and self-reported affectedness
Although the instrumental variable results already suggest that the estimated effects
based on self-reported affectedness are not spuriously created through confounding omitted
variables, it is possible to provide further support for this claim in the following way. In
order to test whether individual personality traits influence the likelihood of answering
being affected by the Chernobyl catastrophe (which they should not if the shock was truly
random), simple regressions were estimated using the two proxies for extroversion and
neuroticism as explanatory variables. The results of these regressions (pooled OLS) are
reported in Table 9 (the table includes only the two coefficients of interest; the full set of
results is provided in Table A 5 in the appendix). In contrast to the life satisfaction
regressions in which both traits played a significant role, their effect on the propensity to

36
report being affected by the nuclear accident is close to zero and insignificant (irrespective
of the set of included control variables). It is reassuring that the results of these regressions
reveal that the two traits do not explain any of the variation in self-reported affectedness.
Generally, self-reported affectedness is only weakly correlated with demographic and
household controls; the exception is the significantly negative male coefficient. Probably
not surprisingly, health status (column 4) is positively associated with to the propensity to
report affectedness; it seems likely that there is reverse causation (affectedness affecting
health) so that the health coefficients effects should not be interpreted in a causal way.
Table 9: Personality traits and self-reported affectedness (pooled OLS)
(1) (2) (3) (4)
Dependent variable Self-reported affectedness (0/1)
Neurotic 0.018 0.026 0.026 0.033
(0.028) (0.027) (0.027) (0.029)
Extrovert 0.009 -0.001 -0.002 -0.002
(0.013) (0.013) (0.013) (0.013)
Demographic, marital status - Occupation and education -
Household income & wealth - -
Health variables - - -
R-squared 0.122 0.156 0.156 0.162 Notes: The table reports selected coefficients only. The full list of results is provided in Table A 5 in the
appendix. All regressions control for year, month of interview and region fixed effects. Results remain
unaffected when controls for official radiation doses are included. Number of observations is 12,003
(columns 1-3) and 11,065 (column 4). Standard errors are clustered on the individual level. Robust standard
errors in parentheses. *** p<0.01, ** p<0.05, * p<0.1. Source: ULMS 2003-2007; own calculations.
5.4.3 Separate exclusion of most affected regions
The employed radiation doses refer to regional averages and the number of highly
affected regions is rather limited so that the estimation results using these official radiation
measures could potentially be driven by one specific region.
Therefore, six reduced form regressions of radiation doses on life satisfaction were
estimated excluding each of the most affected regions one at a time (Table 10). The test
confirms that the estimates are clearly robust to these omissions and not driven by any
particular region with specific features (e.g., Kiev city being the capital of the country).

37
Table 10: Robustness check: separate omission of most affected regions
Dependent variable Life satisfaction
(1) (2) (3) (4) (5) (6)
Without
Kiev oblast
Without
Zhytomyr
oblast
Without
Cherkasy
oblast
Without
Rivne oblast
Without
Chernihiv
oblast
Without
Kiev city
Radiation dose -0.096** -0.118** -0.137*** -0.103** -0.125*** -0.109**
(0.047) (0.048) (0.047) (0.046) (0.046) (0.047)
Demographic
controls
Household controls
Health & traits
Observations 10751 10767 10743 10823 10870 10565
R-squared 0.199 0.199 0.204 0.195 0.205 0.201
Notes: Pooled OLS regressions. All regressions include full set of controls. Standard errors are clustered on
the individual level. Robust standard errors in parentheses. *** p<0.01, ** p<0.05, * p<0.1. Source: ULMS
2003-2007; own calculations.
5.4.4 Falsification exercises
In order to further assess the credibility of the self-reported affectedness measures,
two ‗falsification exercises‘ are conducted using survey respondents who are less likely to
have been immediately affected by the accident: the first group consists of young
individuals who were born at least one year after the accident and the second group is
made up of persons living in completely unaffected households according to the self-
reported measure, i.e. households where all members answer that they have not been
affected by the Chernobyl catastrophe.
The first robustness check asks to what extent self-reported affectedness reflects
‗personal‘ affectedness of the survey respondent (instead of family affectedness). Those
who were born after 1986 cannot have been personally affected by the most immediate
impact of the catastrophe (especially through iodine-131 which has a half-life of about 8
days).29
Interestingly, although the resulting coefficient has almost the same size as for
those born before 1986 the coefficient is now insignificant (Table 11). This result indicates
29
Altruistic feelings towards affected family members could theoretically still play a role. Hence this test
also helps to understand to what extent this family spill-over matters. Generally though, children who were
born after the accident and grew up in contaminated areas will have accumulated some radiation over time.

38
that individual subjective well-being in the post-disaster generation is on average not
significantly related to the affectedness of other family members.30
The second question asks whether differences in official 1986 radiation measures
assigned to each household member according to his/her place of residence in 1986, can
generate significant differences in life satisfaction among households in which all members
respond that no family member was affected by the catastrophe. If the self-reported
measures are reliable, then the official measure should have no significant effect on life
satisfaction in this particular subgroup. Indeed, the coefficient of the radiation dose is
insignificant providing further credibility to the self-reported measure of affectedness.
Overall, the results from these falsification exercises suggest that individuals and
households respond rather accurately to the question on being affected by Chernobyl.
Table 11: Robustness checks with unaffected samples
Dependent variable Life satisfaction
(1) (2)
Sample Born after 1986 Completely unaffected
households
Self-reported affectedness -0.109
(0.104)
Radiation dose -0.081
(0.075)
Demographic controls
Household controls
Health & traits
Observations 564 4,309
R-squared 0.210 0.216
Notes: All regressions control for full set of controls. Standard errors are clustered on the individual level.
Robust standard errors in parentheses. *** p<0.01, ** p<0.05, * p<0.1. Source: ULMS 2003-2007; own
calculations.
5.4.5 Different age specifications
Some authors have argued that it might be preferable to control for the natural
logarithm of age in order to account for the subjective feeling that the years pass faster as
individuals age (van Praag and Baarsma 2005). Therefore, the regression specification
including the full set of controls was re-estimated using various age specifications, i.e.
including only age (i), age and age squared (ii) and age, age squared and age cubic (iii) in
30
However, since the remaining sample is very small, the estimation of the coefficients might be imprecise
(leading to larger standard errors rendering the effects insignificant). Thus, the power of this test might be
limited.

39
simple as well as in logarithmic form. The reduced form results of the radiation dose on
life satisfaction are robust to these modifications (the estimated radiation effect changes
only marginally; see Table A 6 in the appendix).
6 Long-term effects on mental health
As suggested by several psychological studies (see Baloga, Kholosha and Evdin
2006) as well as by the study by Lehmann and Wadsworth (2011) for Ukraine, the long-
lasting toll of the Chernobyl catastrophe for the Ukrainian population as a whole works
mainly through mental distress and subjective perceptions of poor health rather than
through measurable somatic health effects. The empirical results of a negative long-term
effect on subjective well-being shown in the previous section provide further evidence for
this channel.
To shed more light on this psychological channel this section investigates the effect
of the 1986 nuclear accident on two alternative subjective well-being measures which are
more directly related to mental health as well as on the subjective life expectancy. The
UHBS questionnaires of the years 2004 to 2008 contained a health section, in which
individuals were asked to provide information on their somatic and psychological diseases.
From this list of questions, two binary indicator variables will be used as dependent
variables in the analysis: suffering from (i) psychological trauma (diagnosed by a doctor)
and/or (ii) depression (see detailed data description in Section 3.3). Given that the data is
self-reported and partly subjective information it is possible that these variables are
plagued by measurement error (through under- or over-reporting due to stigma, for
instance). However, as long as the measurement error does only affect the dependent
variable and not systematically related to any of the explanatory variables this only leads to
less precise, but not biased estimates (since it increases the variance of the error term, see
Wooldridge (2002, chapter 4). Generally, the fraction of individuals suffering from
depression is much lower in the UHBS sample than in many Western countries. This could
potentially be explained by cultural norms: mental diseases tend to be stronger related to
stigma and less well diagnosed in Eastern European countries than in Western countries.
Nevertheless, given the possible role of stigma associated with medically assessed
psychological illnesses and doctor visits, it might turn out beneficial that the survey

40
question on depression asks for subjective assessments of the individuals (and not about
officially diagnosed illnesses).31
In order to identify individuals who have been affected by the Chernobyl
catastrophe, the following analysis exploits data on self-reported affectedness. A binary
variable is coded as ‗1‘ if respondents answered that they were either somewhat or
seriously affected and ‗0‘ otherwise. The advantage of this measure is that it is actually
more refined than the ULMS question and more precisely targeted at the individual (rather
than the family). One shortcoming of the UHBS dataset is, however, that it does not
contain any information on the place of living in 1986. Hence, the official radiation
measures cannot be linked to a respondent‘s location at the time of the catastrophe in order
to perform similar tests on the reliability of the self-reported affectedness measure as was
done for the ULMS data. Nevertheless, the preceding ULMS analysis has demonstrated
that the self-reported measures of affectedness appear to have a causal meaning and are not
simply spurious results based on omitted personality traits. Thus, given the findings in the
previous section in combination with the more refined affectedness measure in the new
data set, there seems to be substantial supportive evidence for taking the results using self-
reported affectedness measure as lower bound estimates for the causal effect of the
Chernobyl catastrophe on mental health.32
Moreover, the analysis based on the self-reported affectedness will be
complemented by an amended test making use of the official radiation measures. Instead of
assigning the radiation doses to the respondent‘s place of living in 1986, the 1986 radiation
doses are assigned according to the current residence (oblast). Since people in Post-Soviet
Ukraine are in principle free to move to their preferred location and this location choice is
likely to be endogenous, this test is likely to be less powerful.33
However, the level of
mobility from 1986 to 2003 was very low in Ukraine (especially among the older
population). Lack of housing, liquidity constraints and other administrative barriers kept
mobility very low even after the collapse of the Soviet Union (as shown for Russia by
Andrienko and Guriev 2004). In fact, the ULMS data reveal that only 7.4 percent of the
31
The ideal dataset would consist of a compulsory medical assessment of the entire population to circumvent
the problem of self-selection into seeking medical examinations and treatment. 32
Unfortunately, there are no variables on life satisfaction in the UHBS data to test whether the results based
on the ULMS data can be replicated with this second dataset. 33
The analysis by Lehmann and Wadsworth (2011) seems to suggest that mobility is slightly lower among
Ukrainians living in contaminated areas rather than in other regions of the country.

41
sample in 2003 lived in a different region as compared to 1986.34
Furthermore, less than
one percent of those who moved to another region related the motivation behind their
change of residence to the Chernobyl catastrophe (the ULMS questionnaire asks
respondents to give the reasons for their moves).35
Given this background information on
comparatively limited mobility, the empirical problem due to potentially endogenous
location choice should be less severe.
Table 12 presents the results from the mental health regressions based on five
cross-sections of the UHBS. The first three columns refer to the regressions on trauma,
while the other three columns denote the results related to depression – in each case
controlling for the full set of covariates. The three reported estimates stem from (i) the
naïve OLS regressions using the self-reported affectedness measure, (ii) the reduced form
OLS regressions based on the regional radiation doses and (iii) the 2SLS estimations in
which the self-reported affectedness is instrumented by the official radiation measures. The
lower panel reports the first stage results from the 2SLS regressions.
The regression results based on the naïve OLS regression reveal that being affected
by Chernobyl significantly increases the likelihood of suffering from psychological trauma
or depression (see columns 1 and 4 respectively). This significantly negative long-term
effect on mental health is also found when using the official radiation doses as a measure
of affectedness (reduced form regressions, columns 2 and 4). The 2SLS estimates (with a
highly significant first stage) provide further evidence that this long-term effect on mental
health is indeed causally related to the nuclear accident from 1986. Hence, these results
based on a second data set and using alternative measures of subjective well-being once
more seem to confirm the long-lasting burden of large parts of the Ukrainian society due to
the Chernobyl catastrophe which is manifested in lower subjective well-being and mental
health.
34
This refers to the estimation sample and includes persons who used to live outside the territory of Ukraine
in 1986. 35
Individuals were asked for their reasons of changing residence. The list of answers included 21 items. Most
often, individuals changed residence because they moved out of their parents‘ home, married, purchased an
apartment, were released from military service or started studying.
42
Table 12: The Chernobyl effect on mental health (UHBS 2004-2008)
(1) (2) (3) (4) (5) (6)
OLS
(naïve)
OLS
(reduced
form)
2SLS
(2nd
stage)
OLS
(naïve)
OLS
(reduced
form)
2SLS
(2nd
stage)
Dependent variable Trauma Depression
Self-reported affectedness 0.003*** 0.007*** 0.003*** 0.003*
(0.001) (0.002) (0.001) (0.002)
Radiation dose (Reduced 0.002*** 0.001*
form) (0.001) (0.001)
First stage
Dependent variable: Self-reported affectedness
Radiation dose 0.338*** 0.338***
(0.003) (0.003)
F-statistic 12,507 12,507
Age, age squared
Gender
Education
Employment status
Settlement FE
Time FE
Observations 95,452 95,452 95,452 95,452 95,452 95,452
R-squared 0.001 0.001 0.001 0.003 0.003 0.003 Notes: Sample for the years 2004-2008. Robust standard errors in parentheses. *** p<0.01, ** p<0.05, *
p<0.1. Source: UHBS 2004-2008; own calculations.
Fatalism is generally defined as an attitude or belief of having little power in
determining one‘s life and being exposed to an inevitable fate. As presumably received
radiation doses cannot be removed from human bodies, people might develop a fatalistic
attitude towards their situation. Using the ULMS data it is possible to test whether people‘s
beliefs about their remaining lifetime are significantly altered the more they were exposed
to the Chernobyl disaster. In the 2007 wave, individuals aged 45 and above were asked to
name the probability that they would survive until a certain ‗target age‘ in the future
(typically around 10 years in the future).36
This ‗target age‘ was specified according to the
current age of the respondent: For instance, all respondents aged 45 to 55 (56 to 60) were
36
The corresponding survey question reads: ―What are the chances that you will live to be age [X] and
older?‖ There are about 1,980 observations in the estimation sample for whom this variable is non-missing
(the smaller sample size is due to the fact that the question was only asked in the 2007 wave). The mean of
this variable is 53.9 percent (standard deviation of 27.0).

43
asked to assess their survival probability until age 65 (70) for those aged and so on (see
notes below Table 13Error! Reference source not found.).37
Table 13: Impact of affectedness on subjective survival probability
(1) (2) (3)
Dependent variable Subjective probability of survival to target age (0% to 100%)
A. Naïve regressions (OLS)
Self-reported affectedness -4.178*** -3.935*** -3.640***
(1.287) (1.291) (1.289)
B. Reduced form (OLS)
Radiation dose (mSv) -7.444*** -8.049*** -7.892***
(1.644) (1.585) (1.573)
C. First stage (2SLS)
Dependent variable Self-reported affectedness
Radiation dose (mSv) 0.101*** 0.097*** 0.091***
(0.026) (0.026) (0.026)
F-statistic 15.53 13.98 12.27
D. Second stage (2SLS)
Dependent variable Subjective survival probability
Instrumented self-reported -73.628*** -83.313*** -86.962***
affectedness (23.612) (26.191) (28.844)
Basic controls Individual and health controls -
Traits and household controls - -
Observations 1,981 1,881 1,881
Notes: The target age is 65 for those aged 45 to 55, 70 for those aged 56 to 60, 75 for those aged 61 to 65 and
80 for those aged 66 to 75. All regressions control for full set of age dummies. The questions on the survival
probabilities were asked only in ULMS 2007 to individuals aged 45 and above—hence the limited sample
sizes. In order to increase the degrees of freedom, regressions control for macro regions instead of single
oblasts. Robust standard errors in parentheses. *** p<0.01, ** p<0.05, * p<0.1 Source: ULMS 2007.
Table 13Error! Reference source not found. shows the effects of self-reported
and objective affectedness on these subjective survival probabilities (as well as the 2SLS
results). If respondents identify themselves as being affected by the Chernobyl catastrophe
(self-reported measure), the individual survival expectancy falls by 4.2 to 3.5 percentage
points. The fact that there are significant effects in response to self-reported affectedness
suggests that people think mostly about their personal affectedness (unless people believe
that radiation in other household members can reduce their own life span38
) when
responding to the Chernobyl question. Using the official radiation doses the reduced form
37
Given that the question on whether the respondents health was affected by Chernobyl was only included in
the 2003 questionnaire, direct framing effects that might influence responses can be ruled out. 38
This might be relevant if people perform stressful home care, for instance.

44
effects become even larger: A one mSv higher exposure dose reduces the expected survival
probability by between 7.4 to 8.1 percentage points (a bit less than 30 percent of a standard
deviation). These negative effects of the Chernobyl catastrophe on subjective survival
probabilities is also confirmed when using the instrumental variable approach (the
estimated effects become extremely large – about minus 73.6 to 87.0 percentage points).
7 Compensation and state transfers
This section evaluates the aggregate toll of the Chernobyl disaster on subjective
well-being in terms of required monetary compensating differentials (using the ULMS
data). Additionally, it sheds more light on the relationship between affectedness and the
existing state transfer system.
7.1 Estimation of the monetary value of the aggregate utility loss
As implied by the previous results on subjective well-being the disaster at the
Chernobyl nuclear power plant exerted a large negative externality on the population. In
most countries there are no comprehensive insurance schemes for nuclear plants and
possible nuclear accidents. Furthermore, there are generally no available mechanisms
through which individuals can insure themselves against such nuclear accidents. In other
words, in case of emergency, it is most likely the state which has to bear the costs of the
accident and to compensate individuals for the suffered damage. The nuclear accident of
Fukushima (Japan 2011) showed that the state might have to bear a substantial part of the
costs even when nuclear power plants are privately owned.
Using the estimates from the life satisfaction regressions in Section 5 the following
calculations will provide an estimate of the monetary equivalent of the suffered loss in
subjective well-being. In particular, it is possible to compute the amount of monetary
compensation required to equalise the well-being of affected and non-affected groups of
individuals (Clark and Oswald 2002; van Praag and Baarsma 2005; Winkelmann and
Winkelmann 1998). This approach interprets equation (3.1) as a utility function where life
satisfaction is assumed to proxy for direct experienced utility. Using the relative size of the
affectedness coefficient to the income coefficient, it is possible to compute the
compensating differential in monetary terms for the average individual. In other words, this

45
method helps to assess the monetary equivalent required to raise the lower subjective well-
being of affected individuals up to the level of unaffected persons.
Since the income measure enters the regression equation in log-form the statistical
relationship between these two measures corresponds to a semi-log functional form in
which the estimated income coefficient inc gives the change in the dependent variable (
SWB ) due to a percentage change of the explanatory variable (% income ).39
On the
other hand, the loss in subjective well-being due to being affected by the Chernobyl
disaster is simply given by affect (in the linear regression models).
iiinciaffectoi XincomessAffectedneSWB ')log( (3.3)
The relative income change required for these two opposing effects to neutralize
each other can be expressed by the following equation:
%100ˆ
ˆ%)(
inc
affectinchangeincomengcompensati
(3.4)
In order to express the monetary value of this required percentage change in income
one has to multiply the ratio of the two coefficients with the uncompensated income level.
The results of these calculations are presented in Table 14.
Table 14: Compensating differentials and share of total compensation in GDP
Set of
controls affect inc
inc
affect
ˆ
ˆ
Compensating
differential
(in Hryvnia)
Share of
GDP
I. excluding
health proxies -0.114 0.178 0.64 594.8 7.7%
II. including
health proxies -0.098 0.169 0.58 538.6 6.9%
Notes: Based on self-reported affectedness measure. Unless otherwise noted, the estimates stem from
regressions including the full set of controls as in Table 5, column 7. All reported coefficients are
significantly different from zero. Income is measured in log.
39
See Kennedy (1998, pp. 108-109) for an overview of the interpretation of coefficients in nonlinear
functional forms.

46
The income measure used in the regressions and the compensation calculations is
total monthly household income (all values expressed in June 2004 values).40
The
estimates of affect and inc are taken from the main specification using the self-reported
affectedness measure (i.e. using the lower bound estimate of affect ). With an average
uncompensated real income of 928.8 UAH, the compensation amounts to substantial 594.8
UAH per household and month. This equals around 60 percent of average monthly
household income. A back-of-the-envelope calculation of the fiscal costs of such a
compensatory policy shows that the Ukrainian government would have to additionally
spend between 6.9 and 7.7 percent of annual GDP in order to pay for full
compensation.41
,42
Given that the government already spends five to seven percent of
annual GDP on Chernobyl related social programs, the overall long-term costs of the
catastrophe including the loss in subjective well-being are enormous (Oughton, Bay-
Larsen and Voigt 2009).
7.2 Assessment of the role of current Chernobyl assistance payments
The Ukrainian government runs a costly Chernobyl assistance program which
offers an extremely complex mix of 50 different privileges and social benefits ranging
from direct monetary compensation to subsidized health care, tax exemption, as well as
travel and university grants (Oughton, Bay-Larsen and Voigt, 2009).43
To what extent do
these Chernobyl assistance payments help to mitigate the well-being loss of Chernobyl
victims? To answer this question, the following analysis makes use of the ULMS data
which contains information on whether individuals received Chernobyl assistance
40
The household income measure includes all kinds of payments (including payments in the form of goods
and services) and transfers that the household received in the last month (after tax). There are several
advantages of using household instead of individual income: households tend to pool of resources and also
have joint expenditures, the measure of household income provides a more complete assessment of non-wage
income sources (some transfers are paid to households/families and not to individuals) and it is less
dependent on an individual‘s labour market decision (which can be endogenous to health or Chernobyl
affectedness). 41
For the calculation of the total costs, the number of affected individuals is divided by the average
household size and multiplied with the necessary household compensation. 42
Similar costs apply when compensating affected individuals for 2 mSv of additional radiation. 43
The Ukrainian law «On the status and social protection of citizens who suffered from the ChNPP
catastrophe» from February 29, 1991 – which was amended in the following years – is the legal basis for the
social protection of the Chernobyl victims (see also Chapters 4 and 12 in the National Report from Baloga,
Kholosha and Evdin (2006)).

47
payments in the last 30 days (binary variable).44
Furthermore, the previous model (3.1) is
amended by introducing interaction terms between 1986 radiation doses (three categories:
close to zero, medium and high levels) with the binary indicator variable for Chernobyl
assistance payments:
'.*.3
1
,32
3
1
,1 XAssistRadnceAssistaRadiationWk
k
k
koit
(3.5)
The estimated coefficients help to disentangle the effect of radiation exposure and
state assistance of victims and to what extent these assistance payments help to mitigate the
radiation effect. In particular, based on the estimated 321ˆˆ,ˆ and coefficients, it is
possible to express the relative subjective well-being loss/gain of a person having been
exposed to medium/high radiation doses and having/having not received Chernobyl
assistance payments to the ‗baseline‘ comparison group of unaffected persons (zero
radiation dose). For instance, in comparison to an unaffected person, the well-being
loss/gain of someone with medium levels of radiation, but no assistance amounts to2,1 ,
while the loss/gain of a person having been exposed to the same radiation dose, but
receiving compensatory assistance payments at the same time corresponds to the sum of
the three coefficients2,322,1
ˆˆˆ . These estimated well-being losses/gains have been
calculated for the four different categories of persons and are represented graphically in
Figure 5Error! Reference source not found..
Several interesting findings emerge. Positive (non-zero) radiation levels have a
significant negative impact on subjective well-being among those who do not receive any
accident-related benefits (see the two left bars in Figure 5). The size of the coefficient is
around -0.2 irrespectively of whether individuals received a medium or high dosage.
Turning to the respondents receiving Chernobyl assistance payments, individuals with
medium dosage still suffer from a well-being discount of more than -0.2, however, the
increased standard errors render the effect insignificant. In other words, medium affected
individuals receiving assistance payments have no significantly lower well-being than non-
affected individuals. In contrast are the results for those who suffered from high radiation
44
The corresponding question in the ULMS 2007 questionnaire asks respondents about whether they
personally received any Chernobyl assistance in the last 30 days prior to the interview (monetary payments or
payments in the form of goods or services). About 1.4 percent of the sample answer that they received such
payments.

48
doses and receive Chernobyl assistance. Their well-being toll amounts to almost -0.8
points despite the compensatory assistance payments. This surprising finding could be
related to the fact that the official 1986 radiation measures used in the regressions refer to
the regional level and represent average values and not personal radiation dosimetry
measures (even in small areas there was non-negligible variation in radiation exposure
across space). However, if benefits are targeted to the most affected individuals within
regions this significantly negative effect could identify those individuals who were more
severely exposed to the radiation so that the assistance payments are not sufficient to fully
compensate them (in contrast to individuals with medium radiation exposure).45
Figure 5: The effect of radiation levels and Chernobyl assistance on subjective well-
being
Notes: Figure shows effects of radiation dose on subjective well-being (bar) with 90% confidence interval.
Baseline category is ‗no additional radiation‘. Effects based on regressions with full set of controls and
individually clustered standard errors.
45
On the other hand, the payment of compensation might work as a signal for the own (partially
unobservable) radiation status and lead to lower well-being levels. The latter explanation, however, stands in
contrast to the compensation effect found among those with medium radiation levels. There are more
indications in favour of the first explanation: individuals in the group of high radiation levels receiving
assistance are on average 60 percent more likely to suffer from one out of seven chronic diseases than those
with similar radiation levels but no compensation. This higher incidence of poor health conditions also
translates into substantially larger medical out-of-pocket expenditures (183 UAH per month compared to 65
UAH) and—conditional on working—more days of sickness absence during a period of the past three
months (14.8 days compared to 6.7 days). These numbers indicate that compensated individuals in the high
radiation group suffer indeed from a worse health status.

49
7.3 Social state transfer dependency of Chernobyl victims
Psychologists have argued that traumatised individuals might suffer from
psychological illnesses, depression, anxiety and lethargy leading to increased levels of
state aid dependency (Osiatynski 2004; Udovyk 2007). To analyse whether this
behavioural effect can be also found in the data used in this study the following analysis
will take advantage of the fact that the UBHS data consistently collected relevant
information on individual social state transfer receipt across years.46
The dependent
variable is the transfer share in total income which is constructed using the single income
components reported by the individuals. A higher state aid dependency (higher transfer
share) could indicate that affected persons indeed suffer from stronger feelings of
powerlessness and are less able to help themselves.
Table 15 provides OLS and 2SLS results from this empirical assessment. Columns
(1) to (4) exploit a wider definition of state transfers (including Chernobyl benefits) while
columns (5) to (8) exclude all benefits related to the catastrophe. Results are provided for
two levels of self-reported affectedness: The first dummy variable (somewhat affected)
includes all individuals who report to be personally somewhat affected, while the second
variable (seriously affected) identifies only those whose health was strongly affected.
The results in Table 15 reveal that there is a significant positive association
between Chernobyl affectedness and transfer dependency: persons affected by the nuclear
accident have a significantly higher transfer share in their total income – irrespective of
whether explicit Chernobyl payments are included in the measure of state transfers or not
(the coefficients decrease only marginally when Chernobyl payments are not accounted
for). Furthermore, while the somewhat affected individuals have on average a two
percentage point higher state transfer ratio, the effect rises to between four and nine
percent for the seriously affected. The table also demonstrates that the average state
dependency decreased over time as indicated by the time trend against the base year 2001.
Moreover, women and older persons are on average more dependent upon state transfers
(which probably relates retirement and old-age pensions; also note that the legal retirement
age is five years lower for women (age 55) than for men (age 60)).
46
Unfortunately, structural inconsistencies in the income sections of the ULMS over time prevent an analysis
of the extent of transfer dependency using the panel data set.
50
Table 15: The Chernobyl effect on the transfer share in total income
(1) (2) (3) (4) (5) (6) (7) (8)
OLS 2SLS OLS 2SLS OLS 2SLS OLS 2SLS
Dependent variable Transfer share in total income Transfer share in total income
(excluding all Chernobyl related benefits)
Somewhat affected 0.017*** 0.020*** 0.016*** 0.017*** (0.001) (0.004) (0.001) (0.004) Seriously affected 0.042*** 0.087*** 0.038*** 0.075*** (0.003) (0.019) (0.003) (0.019) Age 0.005*** 0.005*** 0.005*** 0.005*** 0.005*** 0.005*** 0.005*** 0.005*** (0.000) (0.000) (0.000) (0.000) (0.000) (0.000) (0.000) (0.000) Age squared 0.000*** 0.000*** 0.000*** 0.000*** 0.000*** 0.000*** 0.000*** 0.000*** (0.000) (0.000) (0.000) (0.000) (0.000) (0.000) (0.000) (0.000) Female 0.029*** 0.029*** 0.029*** 0.029*** 0.029*** 0.029*** 0.029*** 0.029*** (0.001) (0.001) (0.001) (0.001) (0.001) (0.001) (0.001) (0.001) Year 2002 -0.012*** -0.014*** -0.004 -0.007** -0.012*** -0.013*** -0.004 -0.006** (0.003) (0.004) (0.003) (0.003) (0.003) (0.004) (0.003) (0.003) Year 2003 -0.030*** -0.032*** -0.022*** -0.024*** -0.030*** -0.031*** -0.023*** -0.024*** (0.003) (0.004) (0.003) (0.003) (0.003) (0.004) (0.003) (0.003) Year 2004 -0.024*** -0.026*** -0.016*** -0.018*** -0.025*** -0.025*** -0.017*** -0.018*** (0.003) (0.004) (0.003) (0.003) (0.003) (0.004) (0.003) (0.003) Year 2005 -0.024*** -0.026*** -0.016*** -0.018*** -0.024*** -0.025*** -0.017*** -0.018*** (0.003) (0.004) (0.003) (0.003) (0.003) (0.004) (0.003) (0.003) Year 2006 -0.031*** -0.033*** -0.023*** -0.025*** -0.031*** -0.032*** -0.023*** -0.025*** (0.003) (0.004) (0.003) (0.003) (0.003) (0.004) (0.003) (0.003) Year 2007 -0.033*** -0.034*** -0.024*** -0.025*** -0.033*** -0.033*** -0.025*** -0.025*** (0.003) (0.004) (0.003) (0.003) (0.003) (0.004) (0.003) (0.003) Year 2008 -0.035*** -0.037*** -0.027*** -0.028*** -0.035*** -0.036*** -0.027*** -0.028*** (0.003) (0.004) (0.003) (0.003) (0.003) (0.004) (0.003) (0.003) Constant -0.206*** -0.205*** -0.207*** -0.205*** -0.204*** -0.204*** -0.205*** -0.204*** (0.007) (0.007) (0.007) (0.007) (0.007) (0.007) (0.007) (0.007) R-squared 0.794 0.794 0.794 0.794 0.794 0.794 0.794 0.794
Notes: All regressions include controls for educational attainment, economic status as well as regions. The number of observations is 140,869 in all columns. The first stage F-
statistics is 1937.4. *** p<0.01, ** p<0.05, * p<0.1. Robust standard errors in parentheses. Source: UHBS 2001-2008; own calculations.

51
8 Conclusions
This paper analysed long-term effects of the Chernobyl catastrophe on life
satisfaction and mental health in Ukraine more than 17 years after the nuclear accident. To
identify persons who were exposed by radiation the study uses self-reported affectedness
measures as well as objective 1986 radiation doses which can be assigned to individuals
according to their place of living in 1986. Since the Chernobyl disaster was unexpected
and randomly affected certain parts of the Ukrainian population more than others
(geographic variation in radiation doses) the empirical analysis can generate estimates of
the causal effect of the nuclear accident on various outcomes. The results suggest that
individuals who were affected by the catastrophe exhibit significantly lower levels of life
satisfaction as well as higher probabilities of suffering from depression or psychological
traumas (posttraumatic stress disorders). Furthermore, the study also finds evidence on
effects on subjective life expectancy (subjective survival probabilities during the next ten
years). These results hold irrespective of the measure of affectedness used (self-reported or
official measures), although the instrumental variable estimations which aim at correcting
potential measurement as well as endogeneity problems of the self-reported measure seem
to imply that the results based on the latter can be interpreted as lower bound estimate.
In order to evaluate the monetary costs of these subjective well-being losses (utility
losses) and to assess the negative externality of the catastrophe on the general population
and the economy as a whole, the paper also provides estimates of the monetary value
needed to compensate victims for their burden. The estimated compensating income
differentials suggest a total annual cost around seven percent of Ukrainian‘s GDP. This is a
remarkable sum considering the fact that the Chernobyl disaster took place such a long
time ago.

52
9 References
Abbott, Pamela, Claire Wallace and Matthias Beck. 2006. ―Chernobyl: Living with risk
and uncertainty.‖ Health Risk & Society, 8 (2): 105-121.
Almond Douglas, Lena Edlund and Mårten Palme. 2009. ―Chernobyl's Subclinical
Legacy: Prenatal Exposure to Radioactive Fallout and School Outcomes in
Sweden.‖ The Quarterly Journal of Economics, 124 (4): 1729-1772.
Andrienko, Yuri, and Sergei Guriev. 2004. ―Determinants of interregional mobility in
Russia.‖ Economics of Transition, 12 (1): 1-27.
Baloga, V.I, V.I. Kholosha and O.M. Evdin (eds.). 2006. ―20 years after Chornobyl
Catastrophe. Future outlook: National Report of Ukraine‖, 216 pages, Kiev: Atika.
Available at: http://chernobyl.undp.org/english/docs/ukr_report_2006.pdf
Berger, Eva M. 2010. ―The Chernobyl Disaster, Concern about the Environment, and Life
Satisfaction.‖ Kyklos, 63 (1): 1-8.
Blanchflower, David G. and Andrew J. Oswald. 2004. ―Well-being over time in Britain
and the USA.‖ Journal of Public Economics, 88 (7-8): 1359-1386.
Blanchflower, David G. and Andrew J. Oswald. 2008. ―Is well-being U-shaped over the
life cycle?‖ Social Science & Medicine, 66 (8): 1733-1749.
Bridge, Gillian. 2004. ―Disabled children and their families in Ukraine: Health and mental
health issues for families caring for their disabled child at home.‖ Social Work in
Health Care, 39 (1-2): 89-105.
Bromet, Evelyn J., Dmitry Goldgaber, Gabrielle Carlson, Natalia Panina, Evgenii
Golovakha, Semyon F. Gluzman, Thomas Gilbert, Daniil Gluzman, Sergey
Lyubsky, Joseph E. Schwartz. 2000. ―Children's well-being 11 years after the
Chornobyl catastrophe.‖ Archives of General Psychiatry, 57 (6): 563-571.
Bromet, Evelyn J. and Johan M. Havenaar. 2007. ―Psychological and perceived health
effects of the Chernobyl disaster: A 20-year review.‖ Health Physics, 93 (5): 516-
521.
Clark, Andrew E., Paul Frijters, and Michael A. Shields. 2008. ―Relative Income,
Happiness, and Utility: An Explanation for the Easterlin Paradox and Other
Puzzles‖ Journal of Economic Literature, 46 (1): 95-144.
Clark, Andrew E. and Andrew J. Oswald. 2002. ―A simple statistical method for
measuring how life events affect happiness.‖ International Journal of
Epidemiology, 31 (6): 1139-1144.
Cwikel, Julie G., Anna Abdelgani, Uri Rozovski, Ella Kordysh, John R. Goldsmith,
Mike R. Quastel. 2000. ―Long-term stress reactions in new immigrants to Israel
exposed to the Chernobyl accident.‖ Anxiety Stress and Coping, 13 (4): 413-439.
Demidchik Evgeny P., Anton Mrochek, Yuri Demidchik, Tatiana Vorontsova,
Eugeny Cherstvoy, Jacov Kenigsberg, V. Yuri Rebeko and Akira Sugenoya.
1999. Thyroid cancer promoted by radiation in young people of Belarus (clinical
and epidemiological features). G. Thomas, A. Karaoglou, E.D. Williams (Eds.).
53
―Radiation and thyroid cancer.‖ Proceedings of the international seminar on
radiation and thyroid cancer. Brussels, Luxembourg: World Scientific.
Diener, Ed, Richard E. Lucas, and Christie N. Scollon. 2006. ―Beyond the hedonic
treadmill - Revising the adaptation theory of well-being.‖ American Psychologist,
61 (4): 305-314.
European Commission. 1998. ―Atlas of Caesium Deposition on Europe after the
Chernobyl Accident.‖ Edinburgh: The Edinburgh Press.
Ferrer-i-Carbonell, Ada and Paul Frijters. 2004. ―How important is methodology for
the estimates of the determinants of happiness?‖ The Economic Journal, 114 (497):
641-659.
Friebel, Guido and Sergei Guriev. 2005. ―Attaching Workers through In-Kind Payments:
Theory and Evidence from Russia.‖ World Bank Economic Review, 19 (2): 175-
202.
Goenjian, Armen, K., Alan M. Steinberg, Louis M. Najarian, Lynn A. Fairbanks,
Madeline Tashjian and Robert S. Pynoos. 2000. ―Prospective Study of
Posttraumatic Stress, Anxiety, and Depression Reactions after Earthquake and
Political Violence.‖ American Journal of Psychiatry, 157 (6): 911-916.
Gould, Peter. 1990. Fire in the Rain: The Democratic Consequences of Chernobyl.
Baltimore: Johns Hopkins University Press.
Gregory, Paul R. and Janet E. Kohlhase. 1988. ―The Earnings of Soviet Workers:
Evidence from the Soviet Interview Project.‖ The Review of Economics and
Statistics, 70 (1): 23-35.
Havenaar, Johan M., Galina M. Rumyantzeva, Wim van den Brink, Nico W. Poelijoe,
Jan van den Bout, Herman van Engeland, and Maarten W.J. Koeter. 1997.
―Long-term mental health effects of the Chernobyl disaster: An epidemiologic
survey in two former Soviet regions.‖ American Journal of Psychiatry, 154(11):
1605-1607.
Heady, Bruce. 2008. ―The Set-Point Theory of Well-Being: Negative Results and
Consequent Revisions.‖ Social Indicators Research, 85(3): 389–403.
Ivanov, Victor K., Sergey Y. Chekin, Vladimir S. Parshin, Oleg K. Vlasov, Marat A.
Maksioutov, Anatoli F. Tsyb, Vladimir A. Andreev, Masaharu Hoshi, Shunichi
Yamashita, Yoshisada Shibata. 2005. ―Non-cancer thyroid diseases among
children in the Kaluga and Bryansk regions of the Russian Federation exposed to
radiation following the Chernobyl accident.‖ Health Physics, 88 (1): 16-22.
Ivanov, Victor K., Anton I. Gorski, Marat A. Maksioutov, Anatoly F. Tsyb, Anton G.
Souchkevitch. 2001. ―Mortality among the Chernobyl emergency workers:
Estimation of radiation risks (preliminary analysis).‖ Health Physics, 81 (5): 514-
521.
Kennedy, Peter. 1998. ―A Guide to Econometrics.‖ Cambridge, MA: The MIT Press.
Kimball, Miles, Helen Levy, Fumio Ohtake and Yoshiro Tsutsui. 2006. ―Happiness
After Hurricane Katrina.‖ NBER working paper 12062.

54
Kupets, Olga. 2006. ―Determinants of Unemployment Duration in Ukraine.‖ Journal of
Comparative Economics, 34 (2): 228-247.
Lee, Terence R. 1996. ―Environmental stress reactions following the Chernobyl accident.‖
In: One Decade after Chernobyl. Summing up the Consequences of the Accident.
Proceedings of an International Conference. Vienna, IAEA: 283-310.
Lehmann, Hartmut and Jonathan Wadsworth. 2011. ―The Impact of Chernobyl on
Health and Labour Market Performance.‖ Centre for Economic Performance
Discussion Paper No. 1052.
Loganovsky, Konstantin, Johan M. Havenaar, Nathan L. Tintle, Lin T. Guey, Roman
Kotov and Evelyn J. Bromet. 2008. ―The mental health of clean-up workers 18
years after the Chernobyl accident.‖ Psychological Medicine, 38 (4): 481-488.
Luechinger, Simon and Paul A. Raschky. 2009. ―Valuing flood disasters using the life
satisfaction approach.‖ Journal of Public Economics, 93 (3-4): 620-633.
Metcalfe, Robert, Nattavudh Powdthavee and Paul Dolan. 2011. ―Destruction and
Distress: Using a Quasi-Experiment to Show the Effects of the September 11
Attacks on Mental Well-Being in the United Kingdom.‖ The Economic Journal,
121 (550): F81-F103.
Osiatynski, Jerzy. 2004. ―Ukrainian Chernobyl National Programs Enhancement.‖
Analytical study for UNDP. Mimeo.
Oswald, Andrew J. and Nattavudh Powdthavee. 2008. ―Does happiness adapt? A
longitudinal study of disability with implications for economists and judges.‖
Journal of Public Economics, 92 (5-6): 1061-1077.
Oughton, Deborah, Ingrid Bay-Larsen and Gabriele Voigt. 2009. Social, Ethical,
Environmental and Economic Aspects of Remediation. Radioactivity in the
Environment, Vol. 14. Chapter 10, 427-451.
Remennick, Larissa I. 2002. ―Immigrants from Chernobyl-affected areas in Israel: the
link between health and social adjustment.‖ Social Science & Medicine, 54 (2):
309-317.
Selezneva, Ekaterina. 2011. ―Surveying transitional experience and subjective well-
being: Income, work, family.‖ Economic Systems, 35(2): 139-157.
Senik, Claudia. 2004. ―When information dominates comparison - Learning from Russian
subjective panel data.‖ Journal of Public Economics, 88 (9-10): 2099-2123.
Staiger, Douglas and James H. Stock. 1997. ―Instrumental Variables Regression with
Weak Instruments.‖ Econometrica, 65 (3): 557-586.
State Statistics Committe of Ukraine. 2004. ―Statistical Yearbook of Ukraine 2003‖.
Kiev, Ukraine.
State Statistics Committe of Ukraine. 2005. ―Statistical Yearbook of Ukraine 2004‖.
Kiev, Ukraine.
State Statistics Committe of Ukraine. 2007. ―Statistical Yearbook of Ukraine 2006‖.
Kiev, Ukraine.

55
Udovyk, Oleg. 2007. ―Learning from Chernobyl: Past and Present Responses.‖ In:
Mothersill, C. et al. (eds.). Multiple Stressors: A Challenge for the Future, Chapter
34: 449-453.
United Nations. 2001. ―Optimizing the international effort to study, mitigate and minimize
the consequences of the Chernobyl disaster.‖ Report of the Secretary-General
A/56/447. Available at: http://daccess-dds-ny.un.org/doc/UNDOC/ GEN/ N01/568
/09/PDF/N0156809.pdf?OpenElement
United Nations. 2002. ―The Human Consequences of the Chernobyl Nuclear Accident. A
Strategy for Recovery.‖ A Report Commissioned by UNDP and UNICEF with the
support of UN-OCHA and WHO. Available at:
http://chernobyl.undp.org/english/docs/strategy_for_recovery.pdf
UNSCEAR. 2000. ―Exposures and effects of the Chernobyl accident‖, Annex J of the
UNSCEAR 2000 Report “Sources and Effects of Ionizing Radiation”, Volume II,
United Nations, United Nations Office at Vienna. Available at:
http://www.unscear.org/docs/reports/annexj.pdf
UNSCEAR. 2008. ―Health effects due to radiation from the Chernobyl accident‖, Annex
D of the UNSCEAR 2008 Report “Sources and Effects of Ionizing Radiation”,
Volume II, United Nations, United Nations Office at Vienna. Available at:
http://www.unscear.org/unscear/en/publications/2008_2.html
van Praag, Bernard M. S. and Barbara E. Baarsma. 2005. ―Using Happiness Surveys
to Value Intangibles: The Case of Airport Noise.‖ The Economic Journal, 115
(500): 224-246.
Viinamäki, Heimo, Esko Kumpusalo, Markku Myllykangas, S. Salomaa, L.
Kumpusalo, S. Kolmakov, I. Ilchenko, G. Zhukowsky, A. Nissinen. 1995. ―The
Chernobyl Accident and Mental Well-Being - a Population Study.‖ Acta
Psychiatrica Scandinavica, 91 (6): 396-401.
Winkelmann, Liliana and Rainer Winkelmann. 1998. ―Why are the Unemployed So
Unhappy? Evidence from Panel Data‖, Economica, 65 (257): 1-15.
Wooldridge, Jeffrey M. 2002. ―Econometric analysis of cross section and panel data.‖
Cambridge, MA: MIT press.
Zilber, Nelly and Yaacov Lerner. 1996. ―Psychological distress among recent
immigrants from the former Soviet Union to Israel. 1. Correlates of level of
distress.‖ Psychological Medicine, 26 (3): 493-501.

56
Appendix
Figure A 1: Regional variation of Total caesium-137 deposition in 1986 in Ukraine

57
Table A 1: Variable definition (ULMS survey)
Variable name Variable definition Comments
Dependent variable
Life satisfaction Life Satisfaction: To what extent are you
satisfied with your life in general at the
present time? Answer options: 1 Fully
dissatisfied/ 2 Rather dissatisfied/ 3 Neither
satisfied, nor dissatisfied/ 4 Rather
satisfied/ 5 Fully satisfied
Sociodemographic and household characteristics
Age ‗Corrected age
information‘; Birth
year, month and day
have corrected based
on cross-year
consistency checks
Male = 1, if male; =0 otherwise
Marital status
Single = 1, if single
Married = 1, if married (lives in registered or
unregistered marriage)
Divorced = 1, if separated or divorced
Widowed = 1, if widowed
Education
Primary education = 1, if person has primary or unfinished
secondary education
Coded according to
Kupets (2006)
General secondary
education
= 1, if person has diploma of high-school or
PTU with secondary education (vocational
secondary education)
Coded according to
Kupets (2006)
Professional secondary
education
= 1, if person has diploma from college
(technical, medical, music, etc.) or
incomplete professional education (at least
3 years in institute, university, etc.)
Coded according to
Kupets (2006)
Higher education = 1, if person has diploma from
institute/university (bachelor, diploma,
Master, Doctor of science)
Coded according to
Kupets (2006)
Chronic disease = 1, if person has at least one of seven
chronic diseases (self-reported): heart
disease, illness of the lungs, liver disease,
kidney disease, gastrointestinal disease,
spinal problems, other chronic illnesses.
BMI Body-Mass-Index calculated as (body
weight (kg)/(body height (m)2)
Extrovert Personality trait indicator generated on the
basis of interviewer assessment at the end
of the interview. Answer ‗3‘ to question:
Assess the sincerity and openness of the
respondent. The respondent was: 1 – very
introverted, insincere; 2 – as sincere and
open as most respondents; 3 – more sincere
and open than most respondents.
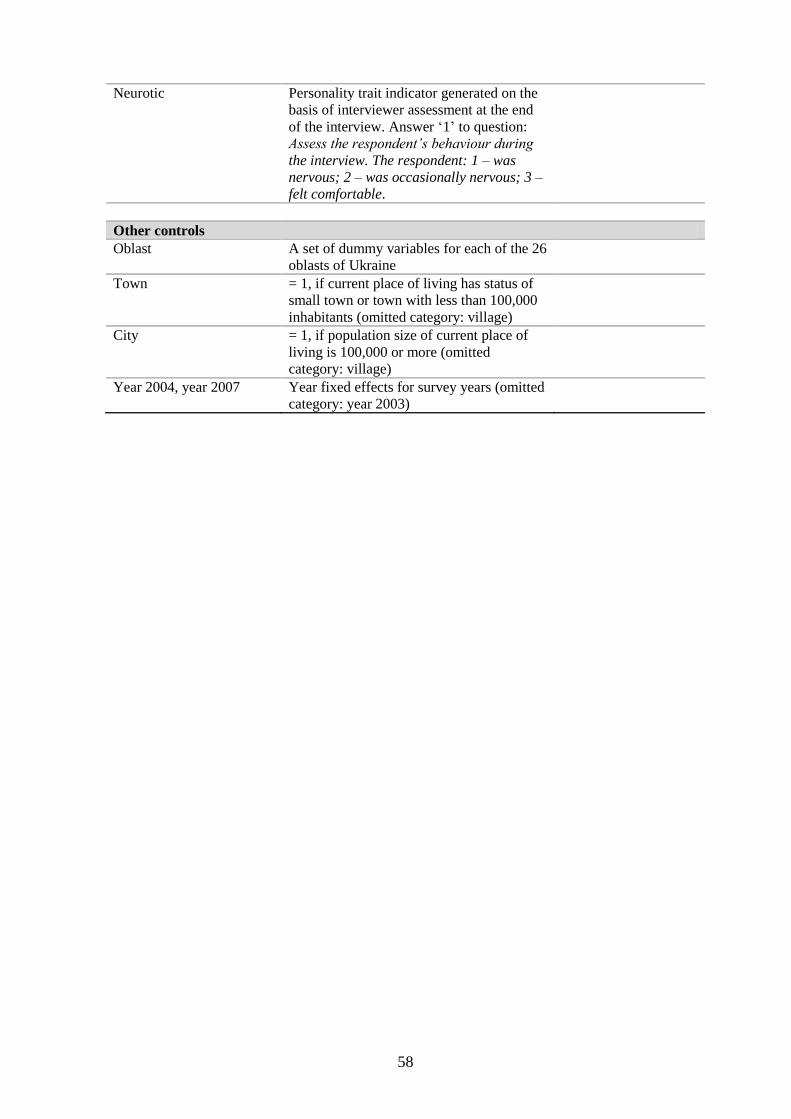
58
Neurotic Personality trait indicator generated on the
basis of interviewer assessment at the end
of the interview. Answer ‗1‘ to question:
Assess the respondent’s behaviour during
the interview. The respondent: 1 – was
nervous; 2 – was occasionally nervous; 3 –
felt comfortable.
Other controls
Oblast A set of dummy variables for each of the 26
oblasts of Ukraine
Town = 1, if current place of living has status of
small town or town with less than 100,000
inhabitants (omitted category: village)
City = 1, if population size of current place of
living is 100,000 or more (omitted
category: village)
Year 2004, year 2007 Year fixed effects for survey years (omitted
category: year 2003)

59
Table A 2: Ordered Probit regressions (marginal effects) using self-reported and
official measures of affectedness
(1) (2) (3)
Dependent variable Life satisfaction
A. Self-reported affectedness
Self-reported affectedness (β) -0.182*** -0.099*** -0.100***
(0.025) (0.026) (0.025)
Pseudo R-squared 0.0304 0.0619 0.0751
Marginal effects
Fully unsatisfied (outcome 1) 0.051*** 0.026*** 0.026***
(0.007) (0.007) (0.007)
Unsatisfied (outcome 2) 0.021*** 0.013*** 0.014***
(0.003) (0.003) (0.003)
Neither/nor (outcome 3) -0.014*** -0.009*** -0.009***
(0.002) (0.002) (0.002)
Satisfied (outcome 4) -0.045*** -0.025*** -0.025***
(0.006) (0.007) (0.006)
Fully satisfied (outcome 5) -0.013*** -0.006*** -0.006***
(0.002) (0.002) (0.001)
B. Official radiation measures
Radiation dose (β) -0.098* -0.116** -0.104**
(0.052) (0.052) (0.051)
Pseudo R-squared 0.0284 0.0615 0.0747
Marginal effects
Fully unsatisfied (outcome 1) 0.028* 0.031** 0.028**
(0.015) (0.014) (0.014)
Unsatisfied (outcome 2) 0.011* 0.015** 0.014**
(0.006) (0.007) (0.007)
Neither, nor (outcome 3) -0.008* -0.010** -0.010**
(0.004) (0.005) (0.005)
Satisfied (outcome 4) -0.024* -0.029** -0.026**
(0.013) (0.013) (0.013)
Fully satisfied (outcome 5) -0.007* -0.007** -0.006**
(0.004) (0.003) (0.003)
Region & time FE
Demographics, health, work -
Income, wealth, traits - -
Observations 12,003 11,065 11,065 Notes: The included controls in columns (1), (2) and (3) correspond to columns (1), (5) and (7) in Table.
Standard errors are clustered on the individual level. Robust standard errors in parentheses. *** p<0.01, **
p<0.05, * p<0.1, † p<0.15. Source: ULMS 2003-2007; own calculations.

60
Table A 3: Alternative estimation method: Generalized Least Squares Random
Effects and Generalized Two-Stage Least Squares Random Effects (GLS-
RE and G2SLS-RE)
(1) (2) (3)
A. Naive GLS-RE
Dependent variable Life satisfaction
Self-reported affectedness -0.190*** -0.096*** -0.096***
(0.027) (0.026) (0.025)
R-squared overall 0.0873 0.1691 0.2008
B. Reduced form GLS-RE
Dependent variable Life satisfaction
Radiation dose -0.088† -0.102** -0.088*
(0.056) (0.052) (0.050)
R-squared overall 0.0819 0.1681 0.1997
C. First stage G2SLS-RE
Dependent variable Self-reported affectedness
Radiation dose 0.083*** 0.079*** 0.077***
(0.019) (0.019) (0.019)
z-value of instrument 4.40 4.11 3.99
D. Second stage G2SLS-RE
Dependent variable Life satisfaction
Instrumented self-reported -1.045† -1.254* -1.112
†
affectedness (0.713) (0.768) (0.737)
R-squared overall 0.0507 0.0845 0.1182
Region & time FE
Demographics, health, work -
Income, wealth, traits - -
Observations 12,003 11,065 11,065 Notes: The included controls in columns (1), (2) and (3) correspond to columns (1), (5) and (7) in Table.
Standard errors are clustered on the individual level. Robust standard errors in parentheses. *** p<0.01, **
p<0.05, * p<0.1, † p<0.15. Source: ULMS; own calculations.

61
Table A 4: Causal effects on the likelihood of being unhappy – alternative estimation method (GLS-RE and G2SLS-RE)
(1) (2) (3) (4) (5) (6) (7)
Naive GLS-RE
Dependent variable Unhappy (0/1)
Self-reported affectedness 0.055*** 0.036*** 0.035*** 0.037*** 0.034*** 0.034*** 0.034***
(0.009) (0.009) (0.009) (0.009) (0.009) (0.009) (0.009)
Reduced form GLS-RE
Dependent variable Unhappy (0/1)
Radiation dose 0.045** 0.040** 0.038** 0.040** 0.047*** 0.043** 0.044**
(0.018) (0.018) (0.018) (0.018) (0.018) (0.017) (0.017)
GLS-RE First stage
Dependent variable Self-reported affectedness
Radiation dose 0.083*** 0.073*** 0.080*** 0.078*** 0.079*** 0.077*** 0.076***
(0.019) (0.019) (0.019) (0.019) (0.019) (0.019) (0.019)
Z-value of instrument 4.40 3.93 4.16 4.09 4.11 3.99 3.98
G2SLS-RE Second stage
Dependent variable Unhappy (0/1)
Instrumented self-reported
affectedness
0.519* 0.529* 0.468* 0.499* 0.579** 0.546* 0.558*
(0.271) (0.304) (0.268) (0.280) (0.294) (0.289) (0.293)
Region & time FE
Demographic controls -
Health controls - -
Marital status - - -
Work status - - - -
Income, wealth, HC - - - - -
Traits - - - - - -
Observations 12,003 12,003 11,065 11,065 11,065 11,065 11,065
Notes: Panel A and B report marginal effect from pooled Probit regressions for the binary variable ‗unhappy‘; Panel C and D report the estimated coefficients from the 2SLS
regressions (linear probability models). The variable ‗unhappy‘ indicates individuals answering ‗fully unsatisfied‘ on the life satisfaction question. Standard errors are clustered
on the individual level. Robust standard errors are in parentheses. *** p<0.01, ** p<0.05, * p<0.1. Source: ULMS 2003-2007, own calculations.

62
Table A 5: Personality traits and self-reported affectedness (pooled OLS)
(1) (2) (3) (4)
Dependent variable Self-reported affectedness
Neurotic 0.018 0.026 0.026 0.033
(0.028) (0.027) (0.027) (0.029)
Extrovert 0.009 -0.001 -0.002 -0.002
(0.013) (0.013) (0.013) (0.013)
Male -0.115*** -0.115*** -0.083***
(0.009) (0.009) (0.011)
Married 0.015 0.015 0.029
(0.019) (0.019) (0.020)
Widowed 0.013 0.016 0.028
(0.024) (0.024) (0.025)
Separated -0.031 -0.030 -0.017
(0.023) (0.023) (0.024)
Age 0.007 0.008 0.009
(0.010) (0.010) (0.010)
Age squared 0.000 0.000 -0.000
(0.000) (0.000) (0.000)
Age cubic -0.000 -0.000 -0.000
(0.000) (0.000) (0.000)
General secondary educ. 0.005 0.004 -0.002
(0.013) (0.013) (0.013)
Professional second. educ. -0.018 -0.019 -0.026*
(0.013) (0.013) (0.014)
Higher education -0.006 -0.007 -0.018
(0.016) (0.016) (0.016)
Working -0.077 -0.079 -0.110
(0.125) (0.126) (0.137)
Unemployed -0.061 -0.059 -0.081
(0.126) (0.127) (0.138)
Pensioner -0.052 -0.052 -0.081
(0.126) (0.127) (0.138)
Inactive -0.067 -0.066 -0.102
(0.126) (0.126) (0.137)
Household size -0.006 -0.007**
(0.003) (0.004)
Log of household income 0.006 0.005
(0.005) (0.006)
Living space per capita -0.000*** -0.000***
(0.000) (0.000)
BMI 0.002
(0.001)
Chronic disease 0.077***
(0.010)
Constant 0.225 0.051 0.053 0.068
(0.226) (0.274) (0.261) (0.260)
R-squared 0.122 0.156 0.156 0.162 Notes: Results remain unaffected when control for objective radiation doses are added. Regressions
control for year, month of interview and region fixed effects. Number of observations is 12,003 (columns
1-3) and 11,065 (column 4). Standard errors are clustered on the individual level. Robust standard errors
in parentheses. *** p<0.01, ** p<0.05, * p<0.1. Source: ULMS 2003-2007, own calculations.

63
Table A 6: OLS regressions of subjective well-being (reduced form), various age
controls
(1) (2) (3) (4) (5) (6)
Dependent variable Subjective well-being
Radiation dosage -0.080* -0.097** -0.102** -0.085* -0.101** -0.099**
(0.046) (0.045) (0.045) (0.045) (0.045) (0.045)
Age -0.013*** -0.065*** -0.188***
(0.001) (0.006) (0.024)
Age squared 0.001*** 0.004***
(0.000) (0.001)
Age cubic -0.000***
(0.000)
Log(Age) -0.595*** -7.157*** -34.845***
(0.046) (0.807) (9.405)
Log(Age) squared 0.908*** 8.658***
(0.111) (2.618)
Log(Age) cubic -0.719***
(0.242)
Full controls
Observations 11,065 11,065 11,065 11,065 11,065 11,065
R-squared 0.192 0.197 0.200 0.195 0.200 0.201
Notes: Full controls see Table. Standard errors are clustered on the individual level. Robust standard
errors in parentheses. *** p<0.01, ** p<0.05, * p<0.1. Source: ULMS 2003-2007; own calculations.