the long-run impact of the dissolution of the english
TRANSCRIPT

The Long-Run Impact of the Dissolution ofthe English Monasteries∗
Leander Heldring James A. Robinson Sebastian Vollmer
April 2021
Abstract
We examine the long-run economic impact of the Dissolution of the English monas-teries in 1535, during the Reformation. Since monastic lands were previously not mar-keted and relatively unencumbered by inefficient types of customary tenures linked tofeudalism, the Dissolution provides variation in the longevity of feudal institutions,which is plausibly linked to labor and social mobility, the productivity of agricultureand ultimately the location of the Industrial Revolution. We show that parishes im-pacted by the Dissolution subsequently experienced a ‘rise of the Gentry’, had higherinnovation and yields in agriculture, a greater share of the population working out-side of agriculture, and ultimately higher levels of industrialization. Where Catholicslingered, there was less development. Our results are consistent with explanations ofthe Agricultural and Industrial Revolutions which emphasize the commercializationof society as a key pre-condition for taking advantage of technological change andnew economic opportunities.
Keywords: Church land, Agriculture, Industry, Gentry.JEL classification: N43, N63, N93, O14, Q15.
∗Heldring: Nortwestern University, Kellogg School of Management, 2211 Campus Drive,Evanston, IL 60208, USA; e-mail: [email protected]. Website:www.leanderheldring.com. Robinson: University of Chicago, Harris School of Public Policy and Depart-ment of Political Science, 1155 E 60th Street, Chicago, IL 60637, e-mail: [email protected]: University of Gottingen, Department of Economics, Platz der Gottinger Sieben 3, Germany; e-mail: [email protected]. We are grateful to Robert Barro, Pol Antras and three anonymousreferees for their many comments and suggestions. We would also like to thank Daron Acemoglu, RobertAllen, Josh Angrist, Rui Esteves, Joe Ferrie, Jeremiah Dittmar, Regina Grafe, Felicity Heal, Clive Holmes,Joel Mokyr, Kevin O’Rourke, Orlando Patterson, Daniel Smail, Beth Truesdale, Noam Yuchtman and sem-inar participants at Harvard, Northwestern, Brown, Oxford, Gottingen, Munster, Mannheim, Heidelberg,ETH Zurich, Delhi School of Economics, Hertie School of Governance, the 2014 EEA meetings, the 2015CEPR-NYU Economic History Conference and the NBER Development of the American Economy meetingfor helpful comments, Bruce Campbell, James Dowey, Samuel Gibbs, Rosalind Morris, and Max Satchellfor kindly sharing their data and Giovanni Zambotti for GIS assistance. We would like to thank JohannesBettin, Kathrin Ellieroth, Vivan Coelho, Narrelle Gilchrist, Wiebke Gumboldt, Jakob Hauth, ThiviyaKumaran, Anna Lane, Tram Nguyen, Amol Pai, Stefanie Pechar, Timo Stibbe and Juditha Wojcik forvaluable research assistance.
1

A remarkable economic transition took place in large parts of the world in the past
250 years. This “Great Divergence” (Pomeranz, 2000) led to the gap between poor and
rich nations of the world expanding from a factor of 4 or 5, to as much as 100. It started
with technological innovation, industrialization and urbanization in Britain. Critical to
this process was a labor force that was mobile enough to move to the new factories and
industrial cities such as Manchester and Birmingham and an agricultural surplus to feed
them. The ability of factors of production to be allocated through the market, rather than
via feudal regulation or custom, has long been hypothesized to be a major factor behind the
success of Britain, and is one hypothesis for why the Industrial Revolution started there,
rather than elsewhere (Pirenne, 1927, 1936, Polanyi, 1944, Hicks, 1969).
In this paper we empirically test this ‘commercialization’ hypothesis. We do so by fo-
cusing on the Dissolution of the English monasteries, which occurred during the English
Reformation in the 1530s, as a natural experiment.1 The most prominent historical hy-
pothesis on the effects of the Dissolution is due to Tawney (1941a,b) who stressed that the
expropriation, and subsequent fire sale, of the assets held by the monasteries in England,
including about 1/3 of all land, led to the ‘rise of the Gentry’, a class of commercialized
farmers. We build on his hypothesis in two ways. First, while Tawney emphasized the Dis-
solution as a shock affecting all of England, we study its impact within England, exploiting
local variation in the incidence of the Dissolution. Second, while we directly test for a rise of
the Gentry, we additionally hypothesize that the effect of the Dissolution extended beyond
the rise of the Gentry to agricultural modernization and ultimately industrialization. This
hypothesis motivates our use of the Dissolution as a natural experiment for studying the
commercialization thesis.
Why would the expropriation of monastic assets create markets and impact subse-
quent development patterns? Before the Reformation, monastic land could legally not be
1The Dissolution began in 1535 when Henry VIII expropriated all monastic assets in England. By doingso, he broke with the Catholic Church and founded the Anglican Church.
2

sold, thus inhibiting its efficient allocation to people who could use it best. The Disso-
lution changed this because the Crown rapidly sold off the expropriated monastic assets
(Habakkuk, 1958). In terms of marketability of land, this put monastic land on a par with
non-entailed non-monastic land.2 Yet, a key difference between monastic and non-monastic
lands that enabled higher subsequent development lies in the lower incidence of ‘feudal’ land
tenure on monastic lands. Critically, few monastic tenures were perpetual, “customary”,
copyholds (Kerridge, 1969).3 Feudal land tenure disincentivized investment and labor mo-
bility. After the Dissolution, when monastic lands became marketable, the greater tenurial
flexibility meant that both land and labor were now free to be reallocated through the
market, allowing sale to whoever could use them best. In addition, more flexibility meant
stronger investment incentives. To illustrate why perpetual copyhold tied farmers to the
land and disincentivizes investment we develop a simple, historically grounded model of
perpetual copyhold tenure in the Appendix. First, even though a copyholder, paying a
fixed nominal rent, is the residual claimant of the returns on his investment, the invest-
ment is specific. This leads to inefficiently low rates of separation and labor mobility since
the specific investments cannot be liquidated in the presence of potentially attractive out-
side options. Second, for the copyholder, the presence of such options naturally leads to
under-investment, since a more attractive outside option may come along. Third, the pres-
ence of perpetual copyholding undermines the efficient allocation of land because those
owners who could use it best are unable to benefit from any productivity increases they
bring since such benefits would completely accrue to the copyholders.4
2As much as half of the land owned by the aristocracy (this is Habakkuk’s estimate, 1950, pp. 18-19),was held in entail and could not be sold - see Beckett (1984) for a discussion of the nature and importanceof entail.
3Most important for us was a specific type of customary tenure known as copyhold of inheritance. Thisfixed the nominal rent of the tenant (and his heirs) in perpetuity. There were other forms of copyholdwhose rents could be re-negotiated, usually after three lives, effectively 100 years.
4One can think of this in terms of “misallocation” in the sense of Hsieh and Klenow (2009). Restucciaand Santaeulalia-Llopis (2017) provide evidence on the relationship between this and the commercializationof land, though in a very different context.
3

The difference in the incidence of feudal tenure between monastic and non-monastic
land was a direct consequence of the Black Death. The monasteries, and the Church
more broadly, were powerful landlords, and whereas tenants negotiated perpetual leases at
low fixed nominal rents after the Black Death with non-monastic landlords, monasteries
were more effective at negotiating short leases. As a result, the incidence of perpetual
copyhold tenure on monastic lands was 70% lower than on non-monastic lands. We therefore
anticipate monastic lands to be relatively more commercialized after the Dissolution.
To test this hypothesis we collected data on the local impact of the Dissolution, on
commercialization, as well as on the hypothesized social and economic changes that may
have resulted from the commercialization of the English countryside across 15,000 parishes
- the lowest administrative unit in England until about 1860.
To measure the impact of the Dissolution we digitized the Valor Ecclesiasticus, the
survey of each monastic asset in the entire country with its annual income that Henry
VIII commissioned prior to the expropriation in 1535. One very important feature of
this data is that it records every manor each monastery owned, generating variation in
where monasteries were landlords, rather than where the monks themselves lived. For
our main explanatory variable we coded an indicator variable to measure the presence of
monastic properties in a parish. This captures the discrete impact of the release of the
monastic lands following the Dissolution. To validate our narrative on the local impact of
the Dissolution we first use data on the presence of markets in 1600 and the survival of
perpetual copyhold into the nineteenth century. We find that former monastic parishes are
substantially more likely to have a recurring market, and are less likely to be unencumbered
by ‘feudal’ copyhold tenure, validating our interpretation of the shock.
Our first main results focus on social change. Firstly, we directly test the rise of the Gen-
try hypothesis following Tawney (1941a,b). He argued that the Dissolution spurred social
change, creating a class of commercialized farmers, the ‘Gentry’, in between the tradition-
4

ally feudal classes of Lords and the yeomen farmers (the model of Doepke and Zilibotti
(2008) can be thought of as a microfoundation for this change). We use a unique census
from 1700 that records the number of Gentry in each of 24,000 of the largest towns/cities
and villages in England and Wales to measure the presence of the Gentry. The Reformation
was not just about the breaking up of monastic assets of course. Potentially more profound
was the religious conversion that scholars since Weber (1905) and Tawney (1926) have con-
nected to entrepreneurship, human capital formation and industrialization (Becker and
Woessmann, 2009, Cantoni, 2015, Barro and McCleary, 2003, McCleary and Barro 2019).
To investigate the effect of the Dissolution on religion we digitized the 1767 Returns of
papists, which was a government investigation reporting the number of Catholics in each
parish. We find, consistent with Tawney, that Gentry are more likely to be present on for-
merly monastic lands. We also find that monastic lands experienced more rapid conversion
and thus subsequently had fewer Catholics, a point to which we return below.
As our second set of main results we directly test the effect of the Dissolution on long-
run development - specifically, structural change and industrialization. Using census data
we show that monastic parishes employ a smaller share of the working age male population
in agriculture in 1831 and a commensurately larger share in commercialized sectors, like
trade and handicraft. Moreover, using data on all textile mills in England in 1838, we
find that monastic parishes are more industrialized than non-monastic parishes. Figure 2
visualizes the relationship between the Dissolution and industrialization, and Figure 3 does
the same for employment in agriculture.
Naturally, the pre-Dissolution distribution of monastic assets was not randomly as-
signed. Monasteries were endowed by rich patrons, who gave manors to support the
monastery. Such monastic endowment occurred by and large in the two centuries fol-
lowing the Norman conquest of 1066 and ended around 1300. To capture the potential
(dis)incentives to gift a particular plot of land, we control for a large number of potential
5

determinants of the location of monastic lands. Most importantly, we use a tax census
from just before the Dissolution as a summary measure of pre-existing differences in devel-
opment. Naturally, monastic parishes may still have been on different trends. To examine
this whether this is the case we collected information on our outcome variables from be-
fore the Dissolution, and compare monastic to non-monastic parishes, before and after the
Dissolution, in a two-period panel. We first verify that monastic parishes were in fact on
parallel pre-trends, using four cross-sections of tax revenues before the Dissolution. Then,
using data on markets and copyhold from the sixteenth century, the presence of Gentry
and water mills from the fifteenth century, as well as data on occupational structure from
the fourteenth century, we verify our main results: former monastic parishes are 35% more
likely to be home to the Gentry, and have 33% fewer Catholics living in them. Employment
in monastic parishes is 15% less agricultural, and 13% higher in commercialized sectors of
the economy and, finally, monastic parishes are one percentage point more likely to be
industrialized, relative to the mean of four percent.
Taken together, our results are consistent with the rise of the Gentry thesis, and with
commercialization of the countryside as a precondition for industrialization. The final part
of our paper aims to understand the mechanisms via which the changes in society (Gentry
and Catholics) and economic institutions (markets) may have impacted structural change
and industrialization.
To do so we use data on agricultural patents filed by parish residents, enclosure of
commonly owned and governed land, the use of capital in agriculture and crop yields as
proxies for productivity and measures of innovation and investment in agriculture.
Our theory suggests that the better allocative efficiency that arose from allowing those
best able to use lands unencumbered by feudal tenures would spur investment. We measure
investment using data recently compiled by Dowey (2013) on the number of agricultural
patents registered in a parish between 1672 and 1850. We use data from Heldring, Robinson
6

and Vollmer (2020) on the universe of Parliamentary enclosures, an investment in the re-
organization of property rights. We use data from Caprettini and Voth (2020) on where
threshing machines were used between 1800 and 1830 to capture capital investment in
agriculture. Finally, we use data on wheat yields per acre in 1836 from Kain (1986) to
directly proxy agricultural productivity. We find that the presence of formerly monastic
properties in a parish is positively and significantly correlated with patenting, enclosure,
investment and agricultural yield. These results are consistent with our model of the
adverse incentive effects of perpetual copyholding.
What was the role of the social changes we documented in these processes? It is plausi-
ble that the impact of Gentry or the persistence of Catholics on these investment outcomes
were significant. The Gentry would have had greater investment incentives, a point we sub-
stantiate with a review of the case study literature, since they could enter into economically
rational tenurial relations. They could also more effectively enclose common land because
they had good connections to Parliament that had to enact this type of property rights
rationalization. Catholics, on the other hand, were discriminated against, facing arbitrary
expropriation of land and assets, higher tax rates, and exclusion from becoming Members
of Parliament or state employees. The case study literature suggests this severely inhibited
their incentives to invest as we discuss in the next section. We assess the relative impor-
tance of the Gentry and Catholics in a correlational mediation exercise, where we regress
the presence of a textile mill on the share of Catholics in the population before the Indus-
trial Revolution, and on the number of local Gentry. We find that Catholics are strongly
negatively associated with industrialization, whereas the presence of Gentry is strongly
positively correlated. These effects operate independently, as including both measures in
a horse-race exercise does not change their estimated effects, nor the estimates’ precision.
Our results showing that places with more Catholics do worse economically are consistent
with Cantoni, Dittmar and Yuchtman (2018) who show that, in Germany, expropriation of
7

monasteries during the Reformation led to university students moving into secular subjects,
and building efforts being redirected towards more secular uses.
Taken together, our findings link the spread of the market, brought about by the Disso-
lution, to economic and social change. These changes have been hypothesized to be crucial
preconditions for the Agricultural Revolution and ultimately industrialization, but have
not been tested before. Our results suggest that the end of monastic restrictions on the
marketability of 1/3 of the land in England and relative incidence of customary tenure, it-
self directly linked to feudalism, were important for fundamental changes within England.
The lagged abolition of feudal land tenure in France and Germany may be behind why
England pulled ahead on the world stage in the eighteenth century. Continental Europe
only transformed after their political revolutions in the nineteenth century finally did away
with servile labor and customary land tenure relationships (Acemoglu, Cantoni, Johnson
and Robinson, 2011).5
Our paper is related to quite a few other contributions in addition to those we have
discussed above. Our findings are consistent with the literature on the Agricultural Revolu-
tion which has stressed that this was due to changes in economic institutions, particularly
the spread of markets often in connection with enclosures (Jones, 1974, Overton, 1996).
Though our evidence does not speak to the issue of the extent to which the Agricultural
Revolution helped to cause the Industrial Revolution (see Clark, 2014) they are consistent
with them being connected. Our results are also consistent with Tawney’s hypothesis and
also with Catholicism being an impediment to industrialization.
5While our account restores a rather traditional theory of the prominence of England among WesternEuropean countries to the center of the discussion, our findings likely generalize outside this context. Pre-colonial Africa, for example, was characterized by an almost total absence of factor markets and land isnot a marketable asset in most of the continent today. Though a labor market appeared in the colonialperiod, slavery also persisted until after World War II in large areas. Similarly, eastern Europe wasrelatively poor and characterized by serfdom until the middle of the nineteenth century. In Latin America,explicit restrictions on indigenous labor persisted in Guatemala until the 1940s and Bolivia until the 1952revolution. Finally, scholars point to the development of factor markets in Song China as one of the reasonswhy it had higher living standards than England before the Industrial Revolution (von Glahn, 2016).
8

The paper proceeds as follows. The next section provides some important historical
background including a discussion of the process of the Dissolution of the monasteries
and what happened to monastic lands afterwards. Section 3 discusses the data in detail,
particularly the collection of the Valor, and how we compiled this data. We also discuss
the other variables we use in the analysis and present some of the descriptive statistics.
Finally, we describe our econometric models. Sections 4-8 present our results. Section 9
concludes.
1 Setting: The monasteries and customary tenure
In this section, we provide the necessary background to the Dissolution of the Monasteries
and our hypotheses. We discuss the initial establishment of monasteries in England, and
their subsequent development. We focus on the crucial role of the Black Death and the
Dissolution in determining the incidence of feudal tenure across parishes in England. We
also discuss the key friction which made copyhold of inheritance, the relatively more com-
mon form of land tenure in non-monastic parishes, detrimental to productivity and labor
mobility. Finally, we discuss how monastic regulations impeded transactions in monastic
lands prior to the Dissolution.
Early monasteries. After the fall of the Western Roman empire, several large monas-
teries were founded, such as Glastonbury, Lindisfarne and Jarrow. Many of these Bene-
dictine establishments were raided by the Vikings, resulting in the virtual, but not full,
destruction of monasticism in England by the early ninth century. The fraction of land
held by monasteries in the north, where raids were more frequent, fell to well below 10%
(Fleming, 1985). On the eve of the Norman Conquest, there were a mere 35 monasteries
in England (Douglas, 1964).
After the Norman conquest in 1066, there was a steep acceleration in monastic founda-
tion. About 600 monasteries were founded in the century after 1066 (Knowles & Hadcock,
9

1994). At the time of the Dissolution in 1535, there were 825 monasteries in all of England
and Wales. This boom in foundations was closely related to the process through which
monasteries are founded, which we discuss now.
Monastic foundation. Monasteries were founded by a patron, usually the head of a
wealthy landowning family. This person would endow the monastery with land to build the
physical monastery on, and with lands that would generate income to support the monks.
Over time, patrons from the same family could add land to the endowment of the monastery.
In exchange, the patron was entitled to stay at the monastery, and it was understood that
the monks would pray for their patron. Endowing a monastery was seen as an act of piety.
After 1300 because of legal changes we discuss below, we see that new foundations drop
considerably. Instead, endowing private chapels in churches, or ‘chantries’, becomes the
popular expression of piety. Monastic patronage could be sold, but if a family died out,
monastic patronage escheated to the crown (Stoeber, 2007).
Because patrons endowed monasteries with land from their own holdings, the pattern of
monastic landholding was determined by where the patron owned land. We know a great
deal about landownership around the conquest because it was recorded in the Domesday
book. The Domesday book recorded the annual income, or ‘value’, of essentially all pro-
ductive assets in England in both 1086, when it was collected, and retrospectively for 1066.
It also records the name of the owner and their feudal overlords. In addition, it provides
estimates of the annual income of each unit before the Conquest.6 William the Conqueror
expropriated all Anglo-Saxon nobles save a handful, and redistributed their lands to his
followers from Normandy. He deliberately scattered their landholdings. He did this because
lords could raise militias in proportion to their landholdings, and William worried that if
6The original survey is not complete. It excludes London and Winchester, which were tax exempt, andDurham, where the bishop had the right to tax. In addition, Westmorland, Cumberland, and Northum-berland are missing. It records for each tenant of the King, his subtenants, the productive assets they own,like land, ploughs, and salt pans. It then estimates the annual income, or ‘value’, these assets create. TheDomesday online project aggregated the value of all assets, and has transcribed the location of each asset.This allows us to map the total value of productive assets in the Domesday to our parishes (Hull, 2018).
10

he gave consolidated landholdings a lord could raise a large army in one place and challenge
him. He made an exception for the Welsh and Scottish borders, where he needed ‘marcher’
lords to defend the country (Douglas, 1964). We see the scattering of landholdings in our
data. Many monasteries hold land all over England.
We can validate the claim that by and large monastic landownership was determined
by the scattering of properties by William using data from the Domesday Book (Hull,
2018). We compute the total income generated in a parish in 1086, and in 1066, before the
Conquest. For each manor in the Domesday book, we record whether it was owned by a
monastery before the Conquest in 1066 and after, in 1086. We code an indicator equal to
one if a manor was not owned by a monastery before the conquest, but was passed to a
monastery after the conquest. We regress this indicator on the income generated by the
manor before the conquest, in 1066, in a bivariate linear regression. Results are in table A-2
in the Appendix. If monasteries were endowed with particularly (un)productive land, we
expect to see a correlation between income before the Conquest and our indicator. Absence
of such a correlation would be consistent with the historical narrative in this section. We
find a small and insignificant correlation. This suggest that where monasteries got land
in the wave of monastic foundation after the conquest is uncorrelated with the economic
output of a manor, and is consistent with the scattering of landholdings for political rather
than economic purposes.
After this initial wave of establishment, monastic endowment effectively stopped after
Magna Carta in 1215 and the passing of the Statutes of Mortmain in 1279 and 1290 (Raban,
1974). These documents prohibited donating land to monasteries because the feudal dues
on the land were no longer payable to the Crown after donation.
The subsequent relevant history of the monasteries revolves around two massive events:
the Black Death, which created variation between monastic and non-monastic landlords in
the type of tenancies they had on their lands, and the Dissolution, which ended monasticism
11

in England, but bequeathed the difference in land tenure relationships to the new owners
of the monastic lands.
The Black Death and the incidence of feudal tenure. The Black Death ended
serfdom as the dominant way of organizing rural labor relationships. Due to the large drop
in population, the ‘villeins’ enjoyed increasing bargaining power, and were able to negotiate
advantageous leases at low fixed nominal rents, called copyholds. They sought to maximize
the wedge between rental rate and the price they got for agricultural output (see Bailey
(2016) for a comprehensive review of the evidence on the decline in serfdom and French
and Hoyle (2007) for a clear discussion of the nature and importance of copyhold). There
were two sorts of copyholds: ‘of inheritance’ which lasted forever, and ‘for lives’ usually
three lives (or three generations). It was called copyhold because a copy of the agreement
was kept in the local manor court. The link between villeinage and copyhold has been
pointed out frequently by medieval historians. Vinogradoff (1923, p. 80) traces copyhold
to norms that “a free man ... cannot be ejected by his lord against his will, providing he
is doing the services due from the holding” arguing that this was the “germ of copyhold
tenure”. Tawney (1912, pp. 46-47) observed “copyholders are the descendents of villeins ...
copyhold tenure, is in fact, villein tenure to which the courts from the end of the fourteenth
century have gradually extended their protection” and Overton (1996, p. 31) notes “villein
tenure gradually changed its name to copyhold”. Villeins preferred such tenure because
rents were lower. We can see this in an inquisition made in the early sixteenth century into
‘inclosures’ by the Tudor government. Rents are lowest for copyholders, lower than rents
on the demesne, for leaseholders, freeholders or tenants-at-will (Davenport and Leadam,
1898, pp. 561-565).
Importantly, there was variation in the success of villeins in securing indefinite copyhold.
Swanson (1989) notes that the Church was more aggressive in opposing the changes which
were forced on landowners by the collapse in their labor supply arguing that after the
12

Black Death there was a “gradual decline (but not total abolition) of serfdom. Here again,
ecclesiastics faced the same forces as their lay counterparts, but were seemingly less willing
to give way” (Swanson, 1989, pp. 201-202). For example, Durham priory was drawing
up lists of serfs until well into the 15th century, in 1497 Tavistock abbey was collecting
servile dues and enforcing labour services and in 1502-3 the bishopric of Lichfield and
Westminster Abbey demesne leases were still demanding customary labor services from
serfs (see MacCulloch (1988) on the widespread persistence of serfdom into early Tudor
England). These authors suggest that, because monasteries were better able to bargain
with villeins, the incidence of the ‘feudal’ tenure which was most favorable to the ex-villein,
copyhold of inheritance, was lower on monastic lands. Instead, the predominant forms of
tenure were leasehold, or copyhold for lives, which usually expired every 99 years, though
there was regional variation in what was considered a life.
How stark was the difference between monastic and non-monastic landlords? At the
time of the Dissolution, as much as two thirds of all land in England was held as copyhold
(Youings, 1967, p. 308). Although we are not aware of systematic medieval surveys of
the extent of types of land tenure, we are able to reconstruct a partial picture.7 When a
monastic property was expropriated as part of the Dissolution, surveyors would oftentimes
draw up a final valuation which determined the tax base when its customary taxes reverted
to the crown. In some cases, these records include additional information on the type of
contract between the monastery and the tenant. These additional returns are published in
the seven volumes of the Monasticon Anglicanum (Dugdale, 1693). For 2,136 tenure con-
tracts we are able to ascertain whether it was a perpetual copyhold of inheritance contract
or another type of contract. 13% of these contract were copyhold of inheritance contracts.
Though it is not clear how representative this sample is, the number is consistent with
the conventional wisdom amongst historians that copyholding of inheritance was relatively
7see French and Hoyle (2007) for a discussion of available sources.
13

rare on monastic lands. Youings’ estimate is that 2/3 of land was under copyhold in all
of England, with about half copyhold of inheritance and half copyhold for lives (Tawney,
1912, p. 26, Overton, 1996, p. 35). Therefore, our estimate of 13% for monastic lands
implies that the incidence of copyhold of inheritance is almost 70% lower there.
Remarkably, copyhold tenure, a direct descendent of feudal tenure, lasted until it was
finally abolished in 1925 by the Law of Property Act. In 1688 around 2/3 of the land
remained under copyhold (Allen, 1992, p. 95). Even as late as the 19th century copyhold
was widespread and Beckett and Turner (2004) document that the Copyhold Commission,
formed in 1841 to convert copyholds into freeholds, had to deal with thousands of cases,
nearly all, logically enough, copyholds of inheritance.
The frictions introduced by copyhold of inheritance. The difference between
monastic and non-monastic tenancies is significant because copyholds of inheritance, rela-
tively absent from monastic lands, had significantly negative effects on productivity, labor
mobility and the efficient allocation of land. We make these points more formally in the
Appendix with a simple model of the copyhold of inheritance tenure. We show three main
results. First, compared to different types of contractual relationships, copyhold of inheri-
tance led to lower investment. Second, it led to inefficiently low labor mobility. Finally, it
was associated with inefficient matching between farmers and farms.8
The intuition for these results is simple. A tenant (and his dynasty) with a copyhold of
inheritance pay a fixed nominal rent. They are thus the residual claimant on investment.
However, the investment is specific in the sense that if they leave, they cannot liquidate
it. In a world of increasing mobility and potentially attractive outside options this leads
to inefficient under-investment relative to a situation either where the landowner farms the
land or rents it out at market rents. Under copyhold of inheritance the landlord does not
8These results all necessitate some degree of financial market imperfections or liquidity constraintsotherwise the landlord could buy the tenant out of the copyhold of inheritance contract which was legallypossible.
14

want to invest, because the returns would accrue to the tenant. The fact that investment
is specific leads not just to too little investment, but also inefficiently low mobility because
individuals wish to stay to enjoy their investments. Finally, the nature of this contract
means that there will not be efficient matching. In a world where some farmers can use
the land more productively than others, there will be no tendency for matching to be
efficient when all of the productivity gains accrue to a copyholder. These effects were less
pronounced on copyhold for lives because, while nominal rents were also fixed at customary
levels, after three lives, possibly 100 years, the copyhold contract lapsed and had to be
renegotiated. At such a juncture landlords could adopt more market based contracts in
order to claim part of the agricultural surplus which accrued to tenants under customary
land relations. Such inefficiencies were even less prevalent on shorter leases, like freeholds.
The situation before the Dissolution. On the eve of the Dissolution, there were
825 monasteries in England and Wales.9 These monasteries, together with cathedrals and
parish churches owned about a third of all land in England and Wales (see Table 1, Mingay,
1976, p. 44 and Woodward, 1966, p. 33). We saw that these lands were spread out all
over England, and often were far away from where the monks lived. The largest monastic
orders were the Benedictines and the Franciscans, but Cluniacs, Cistercians and Gilbertines
operated several houses in England as well.
The Dissolution. Henry VIII, who had become King in 1509, declared himself head
of the Church in 1534. His initial objective was to appropriate all taxes that churches and
monasteries traditionally paid to the Pope. In order to assess the revenue potential of the
Church, Henry ordered an assessment of the yearly income of all ecclesiastical possessions
in England. The resulting reports are published in 1535 as the Valor Ecclesiasticus.10
9See Woodward (1966, p. 2). There were many types of monastic religious establishments, such asnunneries, friaries, abbeys and priories. We use the term monasteries throughout this paper. Much hasbeen written on the Dissolution and the reformation more generally, see for instance Gasquet (1899),Woodward (1966), Youings (1971), Knowles (1979) and Duffy (2005). Savine (1909) deals exclusivelywith the Valor Ecclesiasticus. See Haigh (1993) and Bernard (2007) on the Reformation more broadly,Scarisbrick (1968) on Henry VIII and Elton (1953) on Henry’s government.
10We list and describe the titles and specifics of the relevant acts, the state of the surviving Valor records,
15

Between 1536 and 1540 Parliament passed several acts that transferred the ownership
of all monasteries in England to the Crown, effectively expropriating all assets of the
entire monastic sector.11 Expropriation often involved a peaceful handover of the monastic
buildings and its assets to the Crown, and the pensioning off of the monks and nuns.
Sometimes it was done forcefully and many important Catholic relics were destroyed in the
fervor that accompanied ‘dissolution’. The Dissolution went hand in hand with Henry’s
withdrawal from the Roman Catholic church and as such constituted the Reformation in
England.
Initially, Henry had intended to manage the monastic lands and collect taxes. He
instituted a new ministry for this purpose, the court of Augmentations, but he soon decided
to sell all formerly monastic land to finance an escalating war with France. He sold some
of his most coveted assets, like the monastic buildings that he left standing, to friends
and followers, but individual manors were by and large sold at the fixed price of 20 years
income. We do not have a full manifest of who bought what, but what is clear is that many
of the former non-religious functionaries of the monasteries, like the bailiffs who collected
rents for the monks, and the stewards, who represented the monasteries in civil society,
were often among the buyers (Liljegren, 1924, Savine, 1909).
It is also clear that the Dissolution greatly thickened the land market. In 1603, one
commentator remarks: “In these days there go more words to a bargain of ten-pound land
a year than in former times were used in the grant of an earldom” (Youings, 1967, p. 304).
By 1600, the land market had developed, and many buyers had consolidated small pieces
of lands into estates. One commentator remarks in 1610: “lands pass from one to another
the methods of the Valor enumerators as well as our method of coding the Valor data in the Appendix. Wealso include a description of the Valor records for the manor of Helton, Lolbroke and Bell as an example.
11Dissolution of church property was not without precedent in England. During the Hundred Years Warand throughout the later Middle Ages, the alien priories, priories that were dependent on a monasteryin France, were dissolved. In 1520 Cardinal Wolsey dissolved some twenty monasteries to pay for thefoundation and endowment of an Oxford college and a school in Ipswich. On the continent, Swedish,German and Swiss rulers had successfully dissolved several Catholic monasteries in the early sixteenthcentury (Woodward, 1966, p. 49).
16

more in these latter days than ever before” (Youings, 1967, p. 303). In Devon, the number
of transactions in the land market tripled in the years immediately after the Dissolution
(Kew, 1970). The most comprehensive study of the land market after the Dissolution is
Habakkuk (1958), who first documented the increased dynamism in land markets. These
changes contrast with non-monastic lands, for which there had always been a land market,
with the important exception that land held by the aristocracy was often held in entail.
Habakkuk (1950) estimates that as much as half of the land owned by the aristocracy (pp.
18-19), was held in entail and could not be sold (see also Beckett (1984)).
The Rise of the Gentry. The most famous historical hypothesis about the effects
of the Dissolution is Tawney’s Rise of the Gentry (Tawney 1941a,b). Tawney noted the
emergence of a class of commercialized farmers in the sixteenth and seventeenth century
who ‘rose’ relative to other groups in society. The Gentry rose but were not a new class (see
for example Table 1 and see Coss (2005) on the origins of the English Gentry). Tawney
related the rise of the Gentry to support for Parliament in the English Civil War and
hypothesized that the Dissolution enabled their rise.12 There is a large body of case study
evidence that suggests that the people who bought the monastic land became members
of the Gentry later on.13 For instance, of the leading Gentry families in Hertfordshire in
1642 less than 10% had been settled there before 1485. In Essex this figure stood at 18%,
12Tawney’s papers generated a large literature. This focused on a plethora of issues; whether or not thearistocracy had really declined in favor of a rising class of Gentry (Stone, 1965); whether or not Gentryreally were more commercial or efficient than large landowners (Heal and Holmes, 1994, Chapter 3 for thisliterature); and whether or not the Gentry were the group who led the rebellion against Charles I (see Jha,2015, for evidence on this). The consensus view of historians on these issues, as expressed by Clay (1984,1985) and Overton (1996), now seems to be that indeed there was a big change in the distribution of landin 16th century England as a result of the Dissolution and, moreover, it makes sense to talk about the riseof the Gentry.
13Despite the preponderance of the term there is no one definition of “the Gentry”. Mingay (1976, p. 2)states that a gentleman was distinguished by “education, profession, military rank, wealth, freedom frommanual labor, and the right to wear arms”. An often quoted contemporary definition is from Harrison in1577: “Whosoever studieth the laws of the realm, whoso abideth in the university ... or professeth physicand the liberal sciences, or besides has service in the room of a captain in the wars, or good counsel athome, whereby his commonwealth in benefitted ... is able to bear the port, charge and countenance of agentleman, he shall for money have a coat and arms bestowed upon him by the heralds ... [and be] reputedfor a gentleman ever after” (Harrison, 1968 cited in Holmes and Heal, 1994, pp. 113-114).
17

in Norfolk at 42% and in Suffolk at 13% (Mingay, 1976, p. 9).14 Families such as the
Knatchbulls from Kent and the Cholwichs from Devon were yeomen at the beginning of
the sixteenth century but rose to be among the Gentry over the course of the century,
rising to the peerage later. Overall, as noted in Table 1, the proportion of land owned
by the Gentry increased from 25% in 1436 to 45-50% by 1688. The Church and Crown’s
share went from 25-35% in 1436 to 5-10% in 1688.15 The shares of land owned by great
landowners and the yeomanry were relatively stable. The numbers in this table square
with a great deal of other evidence. For example, the 1524 Lay Subsidy suggests that there
were 200 knightly families and 4,000 to 5,000 esquires and gentlemen in England at that
time. Thomas Wilson, in his book The State of England Anno. Dom, 1600, estimated that
these numbers had increased to 500 and 16,000 respectively (Wilson, 1936). Gregory King’s
calculations of the social structure of England in 1688 (King, 1810) suggest there were 620
knights, 3,000-3,500 esquires and between 12,000 and 20,000 gentlemen (see Thirsk and
Cooper, 1972, pp. 755, 766-8, Cooper, 1983, pp. 20-42). Even though the population of
England approximately doubled over this period this suggests that the Gentry were indeed
relatively rising. Micro estimates for different counties tell a similar story, for instance in
Yorkshire heraldic evidence suggests that there were 557 Gentry families in 1558, 641 in
1603 and 679 in 1642 (Cliffe, 1969, pp. 5f). For Warwickshire a similar measure increases
from 155 families in 1500 to 288 in 1642 (Carpenter, 1992, p. 90, and see Heal and Holmes,
1994, pp. 11-12, for more discussion).
In the introduction to the paper we suggested that even though this connection has
not been explored much before, there is a great deal of case study evidence that suggests
that the Gentry played important roles in the Industrial Revolution (see also Bogart and
Richardson (2009, 2011)). For example, in his seminal study of the history of the British
14For additional evidence for Monmouthshire, see Gray (1987). For evidence on sales of monastic landaround 1600, see Outhwaite (1971).
15For a detailed study of these patterns in Huntingdonshire, see Bedells (1990).
18

coal industry Nef pointed out the intensity with which Gentry were involved not just in
mining the coal under their own lands but also renting other lands with coalfields. In
Lancashire and the West Riding of Yorkshire there were
“the Andersons of Lostock, who had pits in Leeds and the surrounding manors,
the Ashtons, a well-known Lancashire family with many branches who had
pits in the lands around Oldham, the Hultons of Preston, who had pits near
Bolton, the Listers, a West Riding family with colliery interest about Halifax
and also at Colne, the Gascoignes of Gawthorpe, with colliery interests at Kip-
pax and Barwick-in-Elmet, the Mallets of Normanton, who worked coal in the
adjoining manor of Rothwell, and many others. Among the Lancashire families,
the Listers alone appear to have been of yeoman extraction. In Durham and
Northumberland many of the prominent local Gentry became interested during
the sixteenth and seventeenth century in the coal industry” (Nef, 1966, p. 9).
The central role of the Gentry in the Lancashire coal mining industry is amply doc-
umented by Langton (1979a,b). He notes for the period 1590 to 1689 that in the coal
industry “the landed Gentry provided most of the investment and ability” (1979a, p. 74).
Though the Gentry suffered financial problems after this, his data indicates that for the
period between 1690 and 1739 almost 50% of the collieries in central Lancashire were both
owned and operated by landed Gentry while more were leased and operated by Gentry
(1979a, Figure 28, p. 124).16
A fascinating case which brings together many of our arguments is that of the Hesketh
family. The Hesketh family had lived in Rufford in Lancashire from around 1250. On the
eve of the Dissolution, the family owned several manors around Rufford and leased lands
from Chester Abbey. After the Dissolution, these lands were leased from the king. One
16Swain (1986, p. 197) concludes his study of Lancashire by noting “Thus we find that the Gentrypredominated amongst colliery entrepreneurs.” See Jenkin (1983) for a similar conclusion in the case ofSouth Wales.
19

member of the Hesketh family, Thomas, was knighted in 1553 and in 1561 he purchased the
manor of Hesketh-with-Becconsall (around five miles from Rufford) that had until recently
been part of the Priory of St. John of Jerusalem in England. His son, called Sir Robert
Hesketh, was elected a member of Parliament for Lancashire. His will indicates that he
had the right to ‘dig and delve for coal and other materials’. Indeed, by the middle of
the seventeenth century we find the Heskeths partnering with four local gentlemen and a
yeoman to open a mine in Wrightington, some six miles from Rufford. Many years later, in
1761, a Thomas Hesketh acquired the title of baronet. The baronetcy is called ‘the Hesketh
baronetcy, of Rufford in the county palatine of Lancaster’. By this time, the Heskeths were
not only regular members of Parliament but they were financing the Industrial Revolution,
being involved in several mines in Shevington, a mere eight miles from Rufford (Farrer and
Brownbill, 1908; Langton, 1979a, pp. 76, 126; Hasler, 2006).
Note that the importance of the Gentry was not simply that they themselves were
involved in industry, but that they also played an important role in forming partnerships
and financing the main entrepreneurs - for example the relationship between the gentleman
Thomas Bentley and Josiah Wedgewood (McKendrick, 1964) (see Hudson, 2002, for more
examples).
The Reformation The Dissolution was part of the much broader Reformation. In
1530, to a first approximation, 100% of people in England were Catholics. Initially the
creation of the Church of England did not stop people maintaining their Catholic beliefs. In
fact it was only during the reign of Elizabeth I, particularly after the Pope excommunicated
her in 1570, that strong pressure was brought to convert. Already the 1559 English Act
of Uniformity had required all men and women to attend Protestant churches on Sunday
or pay a 12 shilling fine. A 1563 act levied a fine of 100 marks and up to a year in prison
on anyone attending a Catholic mass. A 1581 Act raised the fine for failing to attend
church to 20 pounds per month and equated the activities of priests with treason. This
20

latter decision was spurred by an influx of continental trained Catholic priests after 1574
aimed at re-converting the country. Over one hundred priests were executed. Penalties for
refusing to convert, typically signalled by a refusal to attend a Protestant church on Sunday,
became known as “recusancy”. In addition to the monthly fine a convinced recusant could
be imprisoned (many were) and 2/3 of their lands and all their goods were potentially forfeit.
In the reign of Charles I this was adjusted so that alternatively recusants would have to
pay rent to the government on 2/3 of their land. As Charles himself put it, he wanted to
make sure that “in the course of time they would [not] become mendicants” adding “we do
not seek their ruin” (quoted in Havran (1962), p. 92). James I had previously strengthened
the “recusancy laws” by barring Catholics from the professions and from holding public
office. He also introduced an oath of allegiance which if refused, something which the
Pope advocated, could be met with life imprisonment and the forfeiture of all property.
Catholics were discriminated against until the Catholic Emancipation Act of 1829. After
1693 Catholics had to pay double the rate of the land tax and after 1700 were forbidden
to buy land and Protestant next of kin could claim the inheritance of Catholics.
The net effect of these measures, amongst other things, was a sharp decline in the
number of Catholics. An authoritative estimate, due to Bossy (1975, p. 192) is that in
1603 there were 40,000 Catholics in England (see Sheils, 2004, p. 257, 264, for an argument
that is likely a serious under-estimate, probably by one half). For 1760, we see in our data
that there are 64,300 recorded Catholics in England.
The literature has proposed various explanations for the different rates of conversion in
different parts of England.17 From our perspective, however, the economic consequences of
17There are three main arguments in the historical literature. Bossy (1975) placed central emphasis onthe role of Catholic missionary activity from the continent. He argued that more Catholics lived wherethe missionaries went. He also recognized however that Catholicism persisted longer in the north and westbecause there were “a variety of administrative barriers between oneself and hostile authority” (1975, p.82). Effectively, people feared the implementation of the fines and penalties less and this reduced theopportunity cost of staying Catholic. Finally, Haigh (1975) argues that Catholicism persisted in placeswhere religious beliefs were more intense and especially where there was a devotion of Mary and the Saints.See also Pfaff (2013) on the importance of saint’s cults, and Barro and McCleary (2016) on sainthood. As
21

remaining Catholic must have been highly significant. Undoubtedly the fines and penalties
on the Gentry were imperfectly enforced with Cliffe (1969, p. 221) noting “the pressure
applied was not so consistently heavy as to force them inexorably into bankruptcy and
ruin”. Nevertheless, between 1600 and 1642 102 Yorkshire families had their main estates
seized for recusancy (Cliffe, 1969, p. 224). Cliffe’s reconstruction of the finances of Philip
Constable, a Catholic gentleman from Everingham shows in 1632-33 he paid about 20% of
his income in recusancy fines (p. 222). He concludes “the potential dangers could not be
lightly ignored and many Catholic landowners preferred to attend Protestant services rather
than hazard their estates” (Cliffe, 1969, p. 181). Heal and Holmes’s (1994) conclusions are
similar and they record that “Catholic families experienced financial difficulties, became
enmired in debt, and sold up” (p. 150).18 19
These facts have two important implications for our study. First, holding the intensity
of people’s religious beliefs constant, whether or not one converted depended on the oppor-
tunity costs of doing so. In highly productive places, for example, the threat of losing one’s
land is greater. Second, to the extent that one remained Catholic, the threat to property
rights and excess taxes might plausibly reduce investment. Since our argument is that the
Dissolution created better economic opportunities, one would then expect this first argu-
ment to imply that more Catholics converted in places impacted by the Dissolution. The
second implies that the greater the number of Catholics in a parish, the worse long-run
economic outcomes ought to be.
Sheils puts it “the distribution of Elizabethan Catholics reflected those areas with the strongest attachmentto traditional forms in the early sixteenth century” (2004, p. 259).
18“Some figures suggest that financial embarrassment was suffered by a higher proportion of recusantthan of Protestant gentry families: a disproportionate number of the gentry families in late ElizabethanSussex and Surrey obliged to sell land were recusants; in early Stuart Yorkshire 51% of recusant families,as against 34% of their Protestant counterparts, were in financial difficulties” (Heal and Holmes, 1994,p. 150). Aveling (1966) and Manning (1969) contain many similar examples from Yorkshire and Sussexrespectively.
19An alternative hypothesis would be that Catholics held back development through lower investment ineducation and human capital. Though we do not have historical sources to investigate this, the availableevidence does not make this channel likely. Most Catholics were in the north and as Houston (1982)showed, if anything literacy was higher in northern early Modern England than the rest of the country.
22

In sum, we hypothesize that the Dissolution’s immediate impact was on markets and
the allocation of factors of production. Following Tawney, we hypothesize that there was
an intermediate impact of the Dissolution on social change. Finally, we hypothesize that
ultimately there was a reduced form effect of the Dissolution on industrialization, in line
with the commercialization explanation of the English Industrial Revolution.
2 Data and Empirical Framework
For our empirical specifications we use parishes as our unit of observation. There were about
15,000 parishes and parish-like units in England in the nineteenth century.20 Parishes
are the relevant local ecclesiastical and civil administrative unit for much of England’s
history, and their boundaries changed very little between the Dissolution and the Industrial
Revolution. Importantly, medieval manors, the relevant economic unit in the countryside,
were often coincidental with parishes. Names of individual villages and manors within our
parishes sometimes changed considerably over time. Section 3 in the Appendix describes
the procedure we followed to assign observations in different datasets to the appropriate
parish.21 We provide a full overview of all data sources in section 6 of the Appendix.
2.1 The Valor Ecclesiasticus
We obtain our main independent variable, an indicator for whether a monastery owned a
manor within a parish, from the Valor Ecclesiasticus. We refer to such parishes as monastic
parishes. We use a transcript of the surviving original returns made by the British Record
Commission in the first half of the nineteenth century as our source (Caley and Hunter,
1810, 1814, 1817, 1821, 1825, 1831). We exploit the fact that each manor is located in
20In some parts of England, territories were covered by hamlets, chapelries, extra-parochial tracts, orother local units. We use these instead of a parish if they are the relevant lowest level administrative unit.
21Kain and Oliver (2001) reconstructed the administrative map of parishes for England. Their map hasbeen digitized as the GIS of ancient parishes, which we use in this paper.
23

a village and a parish and, therefore, has a place name. This enables us in principle to
identify each unit and attribute it to a parish, even though the owner of the unit, such as
a monastery, may be located elsewhere. This way we measure whether the local lord of
the manor is a monastery, irrespective of where the monastery is located. Figure 1 maps
the spatial distribution of Monastic properties across England, and shows that our data
covers modern England almost entirely.22 In our Appendix, we discuss the Valor in detail
and Figure A-1 of the returns for the manor of Helton, Lolbroke and Bell. We alternatively
measure the impact of the Dissolution by the total revenue generated in a parish, with
similar results.
2.2 Outcome variables
We record most of our outcome variables at two points in time, once after the Dissolution
and once before. In this section we describe each data sources we use.
Markets. To measure the initial development of markets following the Dissolution
we use the Gazetteer of Markets and Fairs in England and Wales to 1516 (Letters et al.,
2003). This source records medieval physical markets and fairs in towns and villages across
England up to 1516, and their survival until 1600. Because the total number of markets fell
over this period, we measure whether a market survived until 1600 with an indicator equal
to one if a parish had a market in 1600, zero if it had one in 1516 but no longer in 1600
and missing otherwise. It is important to note that these are goods markets primarily, and
we use these data instead of measures of the development of the land or labor market from
the mid-sixteenth century, which are not available to us.
Copyhold. We record copyhold from two sources. Post-Dissolution, we rely on the an-
nual reports of the Copyhold Commission which, between 1842 and 1883, published yearly
22We restrict our attention to income from physical assets. This income is referred to in the records as‘temporal income’. The Valor also records ‘spiritual income’, which are mostly customary duties payableto monastic or ecclesiastical officers.
24
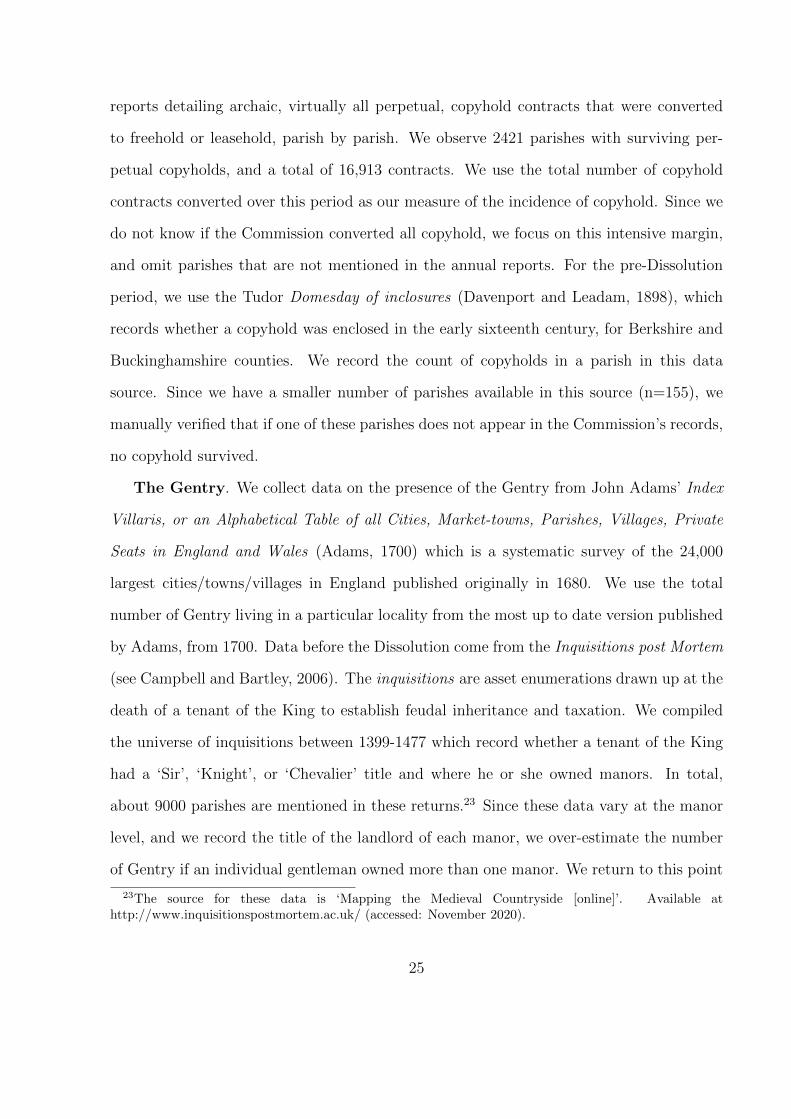
reports detailing archaic, virtually all perpetual, copyhold contracts that were converted
to freehold or leasehold, parish by parish. We observe 2421 parishes with surviving per-
petual copyholds, and a total of 16,913 contracts. We use the total number of copyhold
contracts converted over this period as our measure of the incidence of copyhold. Since we
do not know if the Commission converted all copyhold, we focus on this intensive margin,
and omit parishes that are not mentioned in the annual reports. For the pre-Dissolution
period, we use the Tudor Domesday of inclosures (Davenport and Leadam, 1898), which
records whether a copyhold was enclosed in the early sixteenth century, for Berkshire and
Buckinghamshire counties. We record the count of copyholds in a parish in this data
source. Since we have a smaller number of parishes available in this source (n=155), we
manually verified that if one of these parishes does not appear in the Commission’s records,
no copyhold survived.
The Gentry. We collect data on the presence of the Gentry from John Adams’ Index
Villaris, or an Alphabetical Table of all Cities, Market-towns, Parishes, Villages, Private
Seats in England and Wales (Adams, 1700) which is a systematic survey of the 24,000
largest cities/towns/villages in England published originally in 1680. We use the total
number of Gentry living in a particular locality from the most up to date version published
by Adams, from 1700. Data before the Dissolution come from the Inquisitions post Mortem
(see Campbell and Bartley, 2006). The inquisitions are asset enumerations drawn up at the
death of a tenant of the King to establish feudal inheritance and taxation. We compiled
the universe of inquisitions between 1399-1477 which record whether a tenant of the King
had a ‘Sir’, ‘Knight’, or ‘Chevalier’ title and where he or she owned manors. In total,
about 9000 parishes are mentioned in these returns.23 Since these data vary at the manor
level, and we record the title of the landlord of each manor, we over-estimate the number
of Gentry if an individual gentleman owned more than one manor. We return to this point
23The source for these data is ‘Mapping the Medieval Countryside [online]’. Available athttp://www.inquisitionspostmortem.ac.uk/ (accessed: November 2020).
25

in the results section.
Religion. In the eighteenth century, the English House of Lords initiated several sur-
veys to document the extent of Catholicism in England. The most complete of such ‘Return
of Papists’ is from 1767 and it documents 64,000 Catholics in nearly 2,500 parishes (Wor-
rall, 1980, 1989). We digitized this source and count the total number of Catholics in each
parish. We normalize the total number of Catholics by population in 1831.24
Occupational structure. We use the digitized version of the 1831 Population Census
(Gatley, 2005) to compute shares of the adult male population that is older than twenty
employed in different occupational categories.25 We focus on the share of adult males over
20 years of age employed in agriculture which, on average, equals 62 percent across our
dataset of parishes, and the share employed in trade and handicraft. Other categories that
are distinguished in the census data are people employed as laborers, people employed as
bankers or in other skilled professions and a category for those not fitting one of these
categories. There is a small category for manufacturing, employing two percent of adult
males. Since we can not find a credible matching category in the fourteenth century for
manufacturing, we focus on trade and handicraft. Results using just manufacturing for the
nineteenth century are similar.26 To measure occupation structure before the Dissolution
we record the fraction of people employed in agriculture and in trade and handicraft from
the 1381 poll tax, which was raised to fund the ongoing Hundred Year’s war (Gibbs, 2015
and Fenwick, 1998, 2001). In our data we observe about 33,000 individuals with their
occupations, and we map each individual occupation to a category that matches the 1831
census categories. We report the conversion table of occupations to occupational categories
24We assume that if a parish does not appear in the Return of Papists, there were no Catholics. Notethat the normalization means that the number of observations we have for this variable is equal to thenumber of observations in the 1831 census.
25The 1831 census is the first proper complete census in England, earlier returns in 1801, 1811 and 1821are all incomplete and were collected indirectly (for example by asking local priests).
26We have been able to reconstruct census data for about twelve thousand of our parishes. Regressionsincluding variables based on the census will therefore have a lower number of observations than variablesthat do not include such variables.
26

in the Appendix, section 5.
Industrialization. In 1838 Parliament ordered a return of the “number of persons
employed, of the description of the manufacture, and of the nature and amount of the
moving power in all the Factories...” (Parliament, 1839, p. 3). This return records each
industrial mill in England indicating its manufacture (cotton, wool, worsted, flax or silk),
whether it was water or steam powered and the number of people employed. We coded
an indicator variable equal to one if a parish contains at least one textile mill, and a
variable measuring the number of mills in a parish. To capture the potential location of
manufacturing mills before the Dissolution we record the presence of mills in the fifteenth
century (1399-1477) from the Inquisitions post Mortem. Since these surveys record all
assets with their manors, we can record whether a manor had a water mill in the fourteenth
century.
2.3 Mechanisms
Agricultural Patents. We compute the number of patent holders from the returns of
patent holders in Woodcroft (1854), which were previously used by Dowey (2013). These
returns record the place of residence of the patent holders and we used this place to ge-
ographically locate the patents. We use the count of patents in a particular place, not
the count of patentees (there can be multiple patentees on one patent). The variable we
construct is the total number of patents that were registered to people living in a parish
between 1872 and 1850.
Enclosures. We use data on the location of Parliamentary enclosures from A Domesday
of English enclosure acts and awards by Tate and Turner (1978) as compiled and analyzed
by Heldring, Robinson and Vollmer (2020). We record parishes mentioned in each enclosure
act and code a dummy that is equal to one if land in a parish was enclosed between 1750
and 1840.
27

Threshing machines. Following Caprettini and Voth (2020) we use the presence of
threshing machines in a parish as a measure of capital investment. We use their data, which
records the number of threshing machines present in a parish between 1800 and 1830.
Agricultural yield. We record wheat yields from the 1836 tithe surveys, digitized by
Kain (1986), as our proxy measure of productivity. As part of the tithe commutation act of
1836 which commuted the tithe into money payments, agricultural statistics were collected
for large parts of England. After assigning parishes to individual yield observations in this
dataset we obtain a sample of 4148 parishes for which we have wheat yield, measured in
bushels per acre.
2.4 Control Variables
Lay Subsidies. We record a proxy for income from the lay subsidies at two points in time,
1332 and 1525, as a summary measure of development differences before the Dissolution.
The Lay Subsidies taxed movable wealth, and the extant returns record, parish by parish,
total tax revenue and the total number of taxpayers. For 1525, our source is the Tudor lay
subsidies analyzed by John Sheail (Sheail, 1968, see Hoyle, 1994, for a useful introduction
to interpreting Tudor tax subsidies) and for 1332 we rely on Glasscock (1975). The 1525
Lay Subsidy taxed, for each household, the most important source of income of the head of
a household, defined as either personal property, landed incomes, or wages (Sheail, 1968,
p. 111).27 Tax rates were: a flat rate of four pence per pound if the primary source of
income was wage income, one-fortieth (six pence per-pound) on goods and one-twentieth
(one shilling per pound) on landed incomes. If the goods were valued at more than twenty
pounds, the rate increased to one-twentieth as well. Hence taxation was to some extent
progressive. If the household did not earn at least one pound in wages per year, had one
27The returns cover the entire country except the counties Northumberland, Durham, Cumberland,Westmorland and Cheshire (all in the North). The Cinque Ports (Hastings, New Romney, Hythe, Doverand Sandwich) were also omitted. Sometimes there are several returns available (such as one for 1524 andone for 1525). In these cases, we average over the available returns.
28

pound in landed income per year, or possessed two pounds worth of goods, it was not
recorded in the survey. From this data, we record total tax revenue normalized by the
number of taxpayers in each parish. The Lay Subsidy for 1332 was similar. It taxed one-
tenth of all movable wealth above a threshold, but excepted personal effects like household
goods. We proceed similarly, and record total tax revenue, normalized by the number of
taxpayers.
2.5 Other Data
We use several geographical covariates. To account for the different sizes of parishes, we
control for parish area throughout. Using ArcGIS we compute the distance to London, the
distance to the sea or the border with Scotland (whichever one is nearest) and the distance
to the nearest river (we include here all rivers with year round water flow (perennial) since
we care more about water as a source of power than transport). From the Food and
Agricultural Organization we got data on wheat suitability and soil type.28 In ArcGIS we
then measure for each of our parishes the soil type and wheat suitability under the centroid
in this parish. Ideally, we would like to average over the shape, but the granularity of
the suitability and soil type grids is too coarse to enable us to do this. We also control
for elevation and slope, again measured under the centroid. To obtain the distance to
the nearest coalfield for each parish we digitized a map of the coalfields in England and
Wales in 1912 (Strahan, 1912) and computed the distance in ArcGIS. Finally, we control
28The FAO has classified the earth’s land surface into 32 reference soil groups, based on observablecharacteristics such as accumulation of organic matter and porosity (for a full description, see IUSS, 2014).These classifications have been published as a GIS raster file. The most common soil types in our datasetare Cambisols (“Soils with at least the beginnings of horizon differentiation in the subsoil, evident fromchanges in structure, colour, clay content or carbonate content”, p. 143), Gleysols (“Soils with clear signsof groundwater influence”, p. 150), Luvisols (“Soils with a pedogenetic clay differentiation (especially claymigration) between a topsoil with a lower and a subsoil with a higher clay content, high-activity clays anda high base saturation at some depth”, p. 156) and an “Urban, mining, etc.” group. Soil groups differin irrigation and drainage requirements, salinity, and fertility, and are therefore differentially suitable foragriculture. Cambisols, for instance, “generally make good agricultural land and are used intensively” (p.144). For Gleysols, on the other hand, “the main obstacle to utilization is the necessity to install a drainagesystem to lower the groundwater table” (p. 150).
29

for distance to the nearest market town in 1680. The data come from John Adams’ Index
Villaris which is described above.
2.6 Descriptive Statistics
Table 2 contains the descriptive statistics of our outcome variables, and our variable of
interest, an indicator equal to one if a parish was ‘monastic’. The first two columns give
means and standard deviations of all variables. Subsequent columns give means for parishes
that were monastic and parishes that were not. The last two columns provide a t-test of the
difference of means. In Appendix Table A-1 we provide summary statistics for all variables
used in this paper.
There are several interesting patterns in this table. First, about a third of parishes are
monastic, which is in line with the estimates cited in section 1 of the total share of land
owned by monasteries being equal to about a third. Second, when we implement a simple
difference of means exercise in panel I we see that monastic parishes have more markets,
and fewer copyholds. We also see that the number of Gentry is higher, and the number
of Catholics lower. Finally, monastic parishes are more likely to have a textile mill, and
employment is lower in agriculture and higher in commercialized professions in monastic
parishes. We now introduce our estimation framework for estimating the effect of being
monastic on these outcomes studied in this section.
2.7 Estimation framework
In this section we present our main estimating equations, and discuss the nature of selection
into monastic status.
Our starting point is a simple model which aims to estimate the cross-sectional relation-
ship between the impact of the Dissolution of the Monasteries and our outcome variables.
30

We estimate the following model using OLS:
ypc = γc + αM ·Mp + X′p · αX + εp (1)
Here ypc is our dependent variable of interest in parish p in county c which could be, for
instance, the proportion of the labor force employed in agriculture. Mp is an indicator
if a monastery owned land in parish p so that αM is the main coefficient of interest. γc
is a vector of county fixed effects (n=44). The vector X′p always includes the physical
area of parish p and Lay Subsidy revenues per capita in 1525, as a summary measure of
development differences before the Dissolution. Finally, εp is a heteroskedasticity robust
(White) standard error. We report Conley (1999) standard errors throughout as well, to
understand whether spatial correlation affects inference.
In a series of robustness checks, we allow the level of fixed effects to vary, and include
numerous covariates in X′p. These covariates capture the broad geographical attractive-
ness of a parish for attracting economic activity, such as the proximity of coal deposits,
underlying soil productivity, and proximity to markets or London.
Cross-sectional selection. We naturally face the question of what determines whether
a manor is owned by a monastery. Ultimately, as we described in section 2, this is the prod-
uct of a long historical process, starting with the founding of early Benedictine monasteries
after the collapse of the Roman empire. Because most of these early monasteries were
destroyed in Viking raids, the most important defining event for the distribution of monas-
tic properties was the Norman Conquest in 1066. William the Conqueror redistributed
virtually all land in England to his knights and to abbots of new monasteries. This in-
troduced the continental orders to England (e.g. Franciscans, Cluniacs), and reshaped the
pattern of land ownership in England. We saw that in the immediate aftermath of the con-
quest, monasteries did not get particularly (un)attractive land. But, subsequent patterns
of bequest of land to the monasteries may have favored land that was more desirable.
31

We approach this issue firstly through the use of covariates, the most important ones
being differences in development as captured by income in the Lay Subsidies and county
fixed effects. These covariates ensure that we make local comparisons. If historically
monasteries were simply located in the richest or most productive parts of the country,
we would not expect to see a relationship between the Dissolution and industrialization,
conditional on our covariates. It may of course still be the case that there are unobservables
that vary at the parish level that correlate with subsequent development, and are not
captured by pre-existing income differences. We can not rule this out, but we think it is
relatively unlikely in light of the overall development of the English economy between the
late Middle Ages and the Industrial Revolution. Before the Dissolution, the richest and
most developed part of England was the South, which was heavily involved in wool trade
with the Continent. The Industrial Revolution made the North the richest part of the
country (Darby et al, 1979). Our results are therefore more likely to be confounded by
monastic and non-monastic parishes being on different trends.
Trends, and comparisons over time. The second part of our empirical analyses
instead focuses on differences over time. For most of our outcome variables, we observe
data at two points in time, after the Dissolution early on in the Industrial Revolution, and
in the later Middle Ages. This allows us to estimate changes over time, comparing changes
in monastic parishes to changes in non-monastic parishes. We do so by estimating the
following model:
ypt = βM ·Mp · Tpost + Tpost + rp + νpt (2)
Where now ypt is an outcome of interest for parish p either before or after the Dissolution,
t ∈ {pre, post}. Tpost is a time-period fixed effect and Mp · Tpost measures the effect of a
parish being monastic after the Dissolution. Since rp is a vector of parish fixed effects, βM
measures the change over the Dissolution in monastic parishes, relative to the same change
32

in non-monastic parishes. νpt is a heteroskedasticity robust standard error, clustered at
the parish level. For each outcome, we restrict the sample to create a balanced two-period
panel. In practice this means we restrict to parishes for which we have pre-Dissolution
data.
In order for a comparison of changes to be identified, we require monastic and non-
monastic parishes to be on parallel pre-trends. We assess this assumption in Table 3,
using data from the Domesday book for 1066, before the Conquest, and for 1086, after the
conquest, and the Lay Subsidies of 1332 and 1525. We compute the changes in income or
tax revenue per capita/tax payer in between each of these surveys, and estimate equation
1 using these measures as the dependent variable.29 Columns report the different pairwise
comparisons, and our indicator for a parish being monastic is the variable of interest. We
report standardized coefficients (coefficients obtained after subtracting from each outcome
and right hand side variable its mean and dividing by its standard deviation). Row 1
reports results. For example, column (1) uses the change in tax revenue per tax payer in
between the 1332 and 1525 Lay Subsidies as the dependent variable. If we find that our
monastic indicator is correlated with this measure this means that monastic parishes are
growing differently than non-monastic parishes between 1525 and 1332. We find a small and
insignificant coefficient. We find similarly small coefficients for each pairwise comparison.
This suggests that, on average, monastic parishes were not on different trends prior to the
Dissolution.
The Reformation as a simultaneous shock. When we estimate equation 2 we in-
clude parish fixed effects, accounting for any unobserved level differences between parishes.
Because monastic parishes are not on different pre-trends, we capture the change in out-
come variable due to the expropriation of Monastic parishes, subject to one important
29Before we compute percentage changes, we min-max rescale each measure to obtain unit-free measures.We also omit the Lay Subsidy covariate from equation 1 since it is now part of the construction of thedependent variables.
33

caveat. An informal requirement for models like ours is that any effects are observed close
in time to treatment. If this isn’t the case, other shocks may have happened that correlate
with the Dissolution. The most natural candidate for such a shock is the Reformation it-
self. The Reformation had two main effects that are relevant for our study: the conversion
of Catholics to Anglicans, and the pensioning off of monks and nuns. We discussed the
first shock at length in section 1, and we will test for a direct effect of the Dissolution on
the presence of Catholics below. The effect of the removal of monks may be important,
in light of previous contributions emphasizing the cultural importance of the presence of
monks and nuns (Andersen et al., 2017). Note that, however, we measure the impact of
the Dissolution using data on where the monks owned land and were landlords. This does
include parishes with the monastic buildings themselves. In the Appendix, we implement
a robustness check that restricts the sample to parishes that are far away from monastic
buildings. It may also be the case that the Dissolution proxies for a future correlated shock.
However, the consensus in the historical literature on agricultural development certainly
is that the Dissolution was a watershed event, perhaps only rivalled by the Parliamentary
Enclosure movement in terms of impact on the countryside, but we cannot rule out that
there is some unmeasured other shock affecting our results. Subject to this caveat, we
pursue our interest in the long-run effect of the Dissolution, and we refer to estimates from
our model as ‘long-diff’ estimates, emphasizing this aspect of our study.
2.8 Markets and copyhold
We argued that the Dissolution had two early impacts. First, by making land available
on the land market that was not previously tradable, the Dissolution facilitated matching
of productive individuals to land. Monastic land, in addition, was less encumbered by
perpetual copyhold tenure. This meant that land tenure contracts would lapse after the
Dissolution and could be renegotiated.
34

In this section we attempt to measure both these impacts. We have no means to
directly measure the depth of land markets, but we hypothesized that the greater levels of
investment and productivity induced by the Dissolution should have spurred markets more
broadly. We therefore use as an outcome variable presence of local goods markets from
Letters et al. (2003). To measure copyhold, we count the number of copyholds that were
converted in the nineteenth century. For the sixteenth century, we count the number of
copyholds in a smaller set of parishes from Davenport and Leadam (1898).
Table 4 shows results. We find that monastic parishes are 9 percentage points more
likely to have a surviving market, relative to a mean of 0.3. As we noted in the data section,
the sample consists of parishes that had a market in 1516. The sample average therefore
shows that one-third of parishes that had a market in 1516 still had a market in 1600. In
monastic parishes, the survival rate is 9 percentage points higher. As a verification, we
find an equal treatment effect in column (2), estimating equation 2. In column (3) and (4)
we test for the presence of copyhold. In column (3), we find a negative treatment effect,
indicating that between 1842 and 1883, monastic parishes had fewer surviving copyholds.
This effect is negative, but imprecisely estimated. Importantly, however, we can compare
changes over time in column (4). We find that in the balanced sample of parishes for
which we have information before the Dissolution, the Dissolution is associated with a
large reduction in the number of copyholds equal to about 23% of the sample mean of
the nineteenth century copyholds (The overall sample mean is lower since the number
of recorded contracts per parish is lower in the sixteenth century data). Since after the
Dissolution, copyhold for lives contracts got converted into shorter leases on both monastic
and non-monastic lands (Youings, 1967), we interpret the lower incidence of copyhold on
monastic lands as consistent with our claim that perpetual copyhold - surviving into the
nineteenth century - was lower on monastic lands before the Dissolution.
These results are consistent with the idea that the impact of the Dissolution was to
35

increase the dynamism of markets, and that, prior to the Dissolution, monastic lands
were relatively less encumbered by perpetual copyhold tenure, and validate our use of the
Dissolution as a shock to the legacy of feudal land tenure in England. In the rest of the
paper, we test the long-run impact of the Dissolution.
3 Main Results
In this section we present the main results of our paper. We first focus on social changes
brought by the commercialization of the countryside. Tawney’s famous ‘Rise of the Gentry’
thesis posited that the Dissolution facilitated the rise in income and social status of the
Gentry, a social class of commercial farmers, in between the feudal lords and yeomen. We
find that monastic parishes are home to more members of the Gentry in 1700. Due to the
taxation and formal repression of Catholics, it was much less attractive to be Catholic in
places that rapidly transformed after the Dissolution. As a result, we find fewer Catholics
in monastic parishes in 1767. We then estimate the reduced form effect of the Dissolution
on economic outcomes during the Industrial Revolution. We find that parishes that were
impacted by the Dissolution employ fewer people in agriculture and more in trade and
handicraft. Finally, these parishes were more likely to be industrialized in the nineteenth
century.
3.1 The Rise of the Gentry and Catholic conversion
We study the effect of the Dissolution on the presence of Gentry and Catholics in Table
5. In column (1) we use the number of Gentry in 1700 as our outcome. Most parishes
with Gentry are home to one gentleman, but some central London parishes have up to 12
gentlemen. On average, parishes have 0.67 gentlemen, and the median parish has none.
In column (2) we use our data from the Inquisitions Post Mortem to understand the pre-
36

Dissolution distribution of Gentry. Here we rely on titles, such as ‘Knight’, to identify those
who are precursors of the later commercial gentry (Coss, 2005). Parishes have a maximum
of two gentlemen in the fifteenth century. However, we cannot distinguish between where a
gentleman lives, and where he owns land. Therefore, the median parish in this data source
has one gentleman. On average, parishes have 0.74 gentlemen. We do not think that this
matters very much for our results. First, all Gentry-owned parishes are in the control group
because they are not owned by monasteries. Therefore, if we over-estimate the number of
Gentry in the control group, our estimates will be biased downwards. Second, we account
for the period-specific mean number of Gentry through time fixed effects.
In column (3) we use the number of Catholics in 1767, normalized by population from
the first reliable census, from 1831. The median parish does not have any Catholics. Some
parishes have a large number of Catholics. East Lulworth, for example, is home to 114
Catholics in 1767 and was, from 1786 onward, also home to the first newly built Catholic
chapel in England after the Reformation. As a validation, in column (4), we in addition
assume that everyone was Catholic before the Dissolution estimate equation 2 using the
share of Catholics as the dependent variable as well.
Columns (1) and (2) study the the presence of the Gentry. We find positive and sig-
nificant effects in both our OLS and ‘long-diff’ models. We find that the effect of the
Dissolution is associated with a 0.2 (s.e. 0.02) increase in the number of Gentry, relative
to a sample mean of about 0.7. This result is as far as we are aware the first test of the
connection made by Tawney between the Dissolution and the ‘Rise of the Gentry’ (Tawney,
1941a,b).30 More broadly, this result is consistent with the case study evidence cited in
section 2 on the Gentry being able to take advantage of the opportunities offered by the
Dissolution.
In columns (3) and (4) we test for the effect of the Dissolution on the geographical
30Jha (2015), using different sources of information, fails to find support for Tawney’s secondary claimsabout the Gentry’s role in the English Civil War.
37

spread of Catholics. We find that monastic parishes have a significantly lower share of
Catholics in the cross-section (column (3)) as well as in our panel (column (4)). In Column
(3), for example, we find that the fraction of Catholics is about one percentage point lower
in monastic parishes, relative to a sample mean of 3 percent. We validate this result in
column (4), subject to the caveat that the pre-period share of Catholics is artificially set
to 1 everywhere.
Naturally, an important open question is whether having Gentry or Catholics is associ-
ated with improved or worse economic outcomes. We return to this point below.
3.2 Occupational structure
In Table 6 we directly study the commercialization thesis. The core of this thesis is the no-
tion that as the technological changes that precipitated the Industrial Revolution unfolded,
England was particularly well positioned to take advantage of its opportunities because
factors of production, especially labor, were more mobile. In column (1), we use the frac-
tion of the adult male labor force employed in agriculture to test this idea. In column (2)
we estimate our long-diff model, using the share of individuals in agriculture in the 1381
poll tax as our pre-Dissolution observation. Note that due to the different divisors (adult
male population, or total population), the share of the labor force employed is higher in
1831. Naturally, we difference these means out. In columns (3)-(4) we look at more ‘com-
mercialized’ professions. In the 1831 census, these are individuals employed in ‘trade and
handicraft’. We code professions in the 1831 poll tax to match this category.
In Table 6, as before, odd columns present estimates of equation 1 and even columns
present estimates of equation 2. In column (1) we show the cross-sectional estimated effect
of the Dissolution on employment in agriculture. We find a negative and statistically
significant effect of being Monastic on the fraction of males over 20 in agriculture. This
effect is virtually all absorbed by a commensurate increase in the fraction of males over 20
38

in trade or handicraft, which goes up. Monastic parishes see a 3 percentage point reduction
in employment in agriculture, and 2 percentage point increase in employment in industry.
Relative to its mean of 62%, the reduction in agricultural employment does not appear
to be large. But, most of this decrease goes into an increase in employment in trade and
handicraft. A 2 percentage point increase in employment in industry is about 11 percent
of its mean. In columns (2) and (4) we instead estimate ‘long-diff’ effects. We find similar
effects, especially for employment in trade and handicraft. We find a larger estimated
negative effect for employment in agriculture, which may be due to the smaller sample size
as a consequence of the lower number of parishes enumerated as part of the fourteenth
century poll tax.
The commercialization thesis’ objective is to explain industrialization. In the next
section, we therefore directly estimate the reduced form effect of the Dissolution on indus-
trialization.
3.3 Textile mills
In this section we estimate the effect of the Dissolution on industrialization. We code an
indicator equal to one if a parish was home to a textile mill in 1838 to capture the location
of the Industrial Revolution. We also construct a count variable for the number of mills.
When we show estimates of equation 1 we measure these variables in 1838. When we show
estimates of equation 2 we instead measure mills in either the 14th century or in 1838, as
described in section 2.
Column (1) of Table 7 provides estimates of equation 1 using the mill indicator as
the dependent variable. The estimated effect of the Dissolution is in row 1. Column (2)
provides estimates of equation 2, using the same outcome variable. The estimated effect
of the Dissolution is in row 2. Columns (3) and (4) follow the same structure but use
the number of mills as the dependent variable. We find a strong, positive relationship
39

between the Dissolution and the location of industrial activity, using either model. Take
the estimated effect in column (1), αM = 0.01 (s.e. 0.004). This estimate implies that
monastic parishes are more likely to have a textile mill in 1838, with the effect size about
equal to one quarter of the sample mean. In column (2), we re-estimate the effect of
the Dissolution in our two-period panel, where we control for parish fixed effects. Since we
have data on pre-Dissolution mills, we study whether the Dissolution differentially increased
the presence of mills. We find a very similar treatment effect, 0.01 (clustered s.e. 0.006).
Monastic parishes are about 25 percent more likely to have a textile mill than non monastic
parishes. This estimate also suggests that the presence of ‘wrights’ in some parts of the
country does not confound our results (Mokyr et al., 2020). When we look at the scale of
industrialization in columns (3)-(4), monastic parishes are also more industrialized on the
intensive margin, although these results are less precisely estimated.
Our results on textile mills and employment speak most directly to the hypothesis
advanced by Pirenne (1927, 1936), Polanyi (1944) and Hicks (1969). Their argument was
that the commercialization or ‘marketization’ of the English economy led to labor being
able to freely be reallocated to new economic opportunities when they arose. Consistent
with these ideas, we find that the Dissolution impacts the composition of the labor force
and, ultimately, industrialization.
3.4 Robustness
In the Appendix we undertake a large number of robustness checks which we will only
briefly mention here. In section 4 of the Appendix we discuss all robustness checks at
length. The most important exercise we do is to vary our fixed effects. In our baseline
tables we compare parishes within each of 44 counties. In Table A-3 and A-4 we vary
this. In Table A-3 we report our results without any covariates. Not only do our results
go through, but our estimated effects are very similar. In Table A-4 we first tighten our
40

fixed effects, using ‘hundred’ fixed effects (hundreds are an administrative unit in between
counties and parishes; there are about 900 hundreds). Then we construct a grid which we
overlay on England, and use to add 10 by 10 kilometer grid cell fixed effects and 5 by 5
kilometer grid cell fixed effects. In our full sample, there are about 5,100 5 by 5 kilometer
grid cells which means that we have on average about three parishes in each cell. In all
these exercises, our estimated effects are very similar to our baseline effects, showing that
unobservables that vary above the parish level are unlikely to confound our results. This
finding is consistent with the idea that the parish is a natural historical economic unit of
analysis, as it coincides with historical manors.
In Table A-5 we include a large number of additional geographical covariates. Our
results are unchanged, but some of our estimated effects are of independent interest. In
line with the arguments made by Pomeranz (2000), Allen (2009), and Wrigley (2010), for
example, we find that parishes closer to coalfields are more likely to industrialize. This
effect operates independently from the effect of the Dissolution. In Table A-6 we show that
we can substitute our monastic parish indicator with a continuous measure of the impact
of the Dissolution without repercussions for our results.
In Table A-7, we follow Andersen et al., (2017) and study the Cistercians. They argue
that the Cistercians were involved in human capital transmission which may have had a
long-run effect. We expect this effect to be muted in our data because we focus on variation
in where the monasteries owned land rather than where the monks lived. Nevertheless, we
show that our results are robust to removing all manors owned by Cistercians from our
sample.
4 Mechanisms
In the previous section we showed that the Dissolution is positively associated with the rise
of the Gentry, with fewer Catholics present, and - ultimately - industrialization. In this
41

section we focus on several plausible mechanisms linking the Dissolution to these outcomes,
and especially the Gentry to industrialization. Specifically, we study innovation, enclosure,
capital investment, and agricultural yields. Each outcome captures a form of investment
or innovation, which - in line with the case study evidence on the capital investment of
the Gentry we cited in section 2 - is the type of change that would be facilitated by better
developed factor markets or more commercially minded Gentry.
In column (1), we use the number of agricultural patents filed by residents of parish
p in the period 1672-1850. In total we have 388 patents in our data, and 95% of patents
are filed after 1780. The majority of the patents have to do with machinery. For example,
we observe several patents for improved ploughs, seed drills, or for finishing wool. For 234
patentees we have occupation data, and 52 (22%) of these patentees are members of the
Gentry, which constitute the largest single occupation group. This number is far larger
than, for example engineers (16). When we aggregate smaller professions such as cloth
manufacturer and cotton spinner into elite (nobility, lawyers, professors), Gentry, skilled
artisans and farmers, the artisans constitute the largest occupational category. In column
(2) we instead measure enclosure during the Parliamentary enclosure movement. Heldring
et al. (2020) provide an introduction to these data. Enclosure was a legal procedure which
assigned private property rights to commonly owned and governed lands. The enclosure
process had to be initiated by landowners, and more commercially minded individuals,
such as the Gentry, may be more likely to push for enclosure. Heldring et al. (2020) find
that enclosure is associated with higher productivity in agriculture. Here was ask whether
enclosure is more likely to occur on monastic parishes. In column (3), we directly measure
capital investment, by measuring the number of threshing machines in a parish. We observe
409 parishes with threshing machines, and the median parish with a threshing machine has
one. Finally, in column (4) we measure wheat yield in bushels per acre. We do not have
pre-Dissolution observations for these variables, and we therefore estimate equation 1 for
42

these outcomes.
Table 8 reports results. In column (1) we use the number of agricultural patents as the
dependent variable. We find an significantly higher number of patents filed by residents of
monastic parishes. The increase, 0.02 (s.e. 0.007) is equal to the sample mean. In column
(2) we use our enclosure indicator as the dependent variable, and find that monastic parishes
are 8 percentage points more likely to be enclosed by Parliament, relative to a mean of 0.37.
In column (3) we find that monastic parishes have more threshing machines. Finally, in
column (4) we find that monastic parishes have higher wheat yields.
5 Comparing Catholics and Gentry
In Table 9 we take our intermediate results on the Catholics and the Gentry and study their
correlation with industrialization. Both variables capture potentially important channels of
transmission from the Dissolution to the Industrial Revolution, but they capture different
aspects. We interpret the presence of Gentry, following Tawney, as a direct outcome of
increased economic dynamism and commercialization of the countryside. The presence of
Catholics plausibly also affects economic development through other mechanisms, such as
discrimination, as we saw in section 2.
In column (1) we simply estimate equation 1 with our mill indicator as the dependent
variable and the share of the population that is Catholic in 1767 as the right hand side
variable. We find a negative and significant correlation with economic development. The
mean share of Catholics is about 3 percent. This implies that in parishes with a share
of Catholics which is higher by its mean is associated with a decline in the probability of
having a mill of about 10% of its sample mean. This effect is consistent with both repression
of Catholics, as well as arguments that put an emphasis on cultural attitudes of Catholics
being less conducive to investment (Weber, 1905). For Gentry, we observe the opposite
correlation (column (2)). Having an additional member of the Gentry is associated with
43

a higher probability of having a mill by about 25% of its sample average, consistent with
the evidence in section 1 on the involvement of the Gentry in funding and engaging in
industrialization. It is important to note that neither of these results are interpretable as
causal.
An interesting question is whether these mechanisms operate separately, or that in
parishes where people remained Catholic fewer Gentry ‘rose’. In column (3) we include
both measures simultaneously. Both point estimates are unchanged and equally precisely
estimated, suggesting that the presence of Catholics and Gentry are orthogonal correlates
with industrialization. A final question we ask is whether the Catholics and Gentry jointly
explain the full effect of the Dissolution. We do not expect this to be the case since our
hypothesis is that the increased dynamism of the land and labor markets affected farmers
as much as Gentry by ‘freeing’ them from the legacy of feudal land tenure relationships.
In column (4) we include our indicator for monastic parishes as an additional regressor as
well, and we find that it correlates with industrialization, even when we include the share
of Catholics and number of Gentry.
6 Conclusions
In this paper we conducted what to our knowledge is the first empirical investigation of
one aspect of the salient commercialization thesis about the causes of industrialization and
the industrial revolution in England. Though we cannot test the idea that it was commer-
cialization that caused the industrial revolution, we used the impact of the Dissolution of
the monasteries in England between 1536 and 1540 as a source of variation in the extent of
commercialization within England. Tawney (1941a,b) first proposed that the Dissolution
and subsequent sell off of church land, representing around 1/3 of agricultural land in Eng-
land, created a huge shock to the land market with profound consequences. We argue that
this can be viewed as a natural experiment in the modernization of economic institutions
44

and we hypothesized that the subsequent thickening of the land market would have had a
major positive impact on resource allocation and incentives. This was particularly because
monastic lands were relatively free of customary perpetual copyhold tenancies which were
a direct legacy of feudalism. To investigate this we digitized the 1535 Valor Ecclesiasticus,
the census that Henry VIII commissioned on monastic incomes.
Using the presence of monastically owned land at the parish level as our main explana-
tory variable we showed that the Dissolution had significant positive effects on industrial-
ization which we measured using data from the 1838 Mill Census, the first time the British
government collected systematic data on this driving sector of the Industrial Revolution.
We also showed the Dissolution was associated with structural change, specifically the
movement of labor out of agriculture and into more industrialized sectors of the economy.
We then examined several channels which might link the Dissolution to these long-
run outcomes. We showed that the Dissolution was associated, as Tawney hypothesized,
with social change and the rise of a new class of commercially minded farmer. It was
also associated with faster conversion from Catholicism, another factor plausibly linked to
better economic performance.
We further found the Dissolution to be associated with greater agricultural investment,
measured by parenting and land enclosures, and higher wheat yields.
All in all, our findings support a quite traditional theory of the industrial, and perhaps
the agricultural, revolution; that it was at least partially caused by the increasing commer-
cialization of the economy which had a series of institutional, social and economics effects.
31
31Though it is not the focus of our analysis, our findings also support other channels, such as theimportance of the presence of natural resources emphasized by Clark and Jacks (2007), Allen (2009),Crafts and Wolf (2014) and Fernihough and O’Rourke (2014).
45

7 References
Acemoglu, Daron, Davide Cantoni, Simon Johnson and James A. Robinson
(2011) “The Consequences of Radical Reform: The French Revolution,” American Eco-
nomic Review, 101(7), 3286-3307.
Adams, John (1700) Index Villaris, London: Sprint.
Allen, Robert C. (1992) Enclosure and the Yeoman, Oxford: The Claredon Press.
Allen, Robert C. (2009) The British Industrial Revolution in Global Perspective,
New York: Cambridge University Press.
Andersen, Thomas Barnebeck, Jeanet Bentzen, Carl-Johan Dalgaard and
Paul Sharp (2017) “Pre-reformation Roots of the Protestant Ethic,” Economic Journal,
127, 604, 1756-1793.
Aveling, J. C. Hugh (1966) Northern Catholics: the Catholic recusants of the North
Riding of Yorkshire, 1558-1790, London: Chapman.
Bailey, Mark (2016) The Decline of Serfdom in Late Medieval England: From
Bondage to Freedom, Rochester: Boydell Press.
Barro, Robert J., and Rachel M. McCleary (2003) “Religion and Economic
Growth across Countries,” American Sociological Review, 68(5), 760-781.
Barro, Robert J. and McCleary, Rachel M (2016) “Saints marching in, 1590–
2012,” Economics, 83 (331), 385–415.
Becker, Sascha O. and Ludger Woessmann (2009) “Was Weber Wrong? A
Human Capital Theory of Protestant Economic History,” Quarterly Journal of Economics,
124(2), 531-596.
Beckett, J.V. (1984) “The Pattern of Landownership in England and Wales, 1660-
1880,” The Economic History Review, 37, 1, 1-22.
Beckett, John V. and Michael E. Turner (2004) “Freehold from copyhold and
leasehold: tenurial transition in England between the sixteenth and nineteenth centuries,”
46

in B.J.P. Bavel and P. Hoppenbrouwers eds. Landholding and land transfer in the North
Sea area, Turnhout: Brepols Publishers.
Bedells, John (1990) “The Gentry of Huntingdonshire,” Local Population Studies,
44, 30-40.
Bernard, George W. (2007) The King’s Reformation: Henry VIII and the remaking
of the English Church, New Haven: Yale University Press.
Bogart, Dan and Gary Richardson (2009) “Making property productive: reor-
ganizing rights to real and equitable estates in Britain, 1660–1830,” European Review of
Economic History , 13(1), 3-30.
Bogart, Dan and Gary Richardson (2011) “Property Rights and Parliament in
Industrializing Britain,” The Journal of Law & Economics , 54(2), 241-274.
Bossy, John (1975) The English Catholic Community, 1570-1850, London: Darton,
Longman Todd.
Caley, John and John Hunter (eds.) (1810) Valor ecclesiasticus temp. Henr.
VIII: auctoritate regia institutus, Volume I, London: Record Commission.
Caley, John and John Hunter (eds.) (1814) Valor ecclesiasticus temp. Henr.
VIII: auctoritate regia institutus, Volume II, London: Record Commission.
Caley, John and John Hunter (eds.) (1817) Valor ecclesiasticus temp. Henr.
VIII: auctoritate regia institutus, Volume III, London: Record Commission.
Caley, John and John Hunter (eds.) (1821) Valor ecclesiasticus temp. Henr.
VIII: auctoritate regia institutus, Volume IV, London: Record Commission.
Caley, John and John Hunter (eds.) (1825) Valor ecclesiasticus temp. Henr.
VIII: auctoritate regia institutus, Volume V, London: Record Commission.
Caley, John and John Hunter (eds.) (1831) Valor ecclesiasticus temp. Henr.
VIII: auctoritate regia institutus, Volume VI, London: Record Commission.
Campbell, Bruce M.S. and Ken Bartley (2006) England on the Eve of the Black
47

Death: an atlas of lay lordship, land and wealth, 1300–49, Manchester and New York:
Manchester University Press.
Cantoni, Davide (2015) “The Economic Effects of the Protestant Reformation: Test-
ing the Weber Hypothesis in the German Lands,”Journal of the European Economic As-
sociation, 13: 561-598.
Cantoni, Davide, Jeremiah Dittmar and Noam Yuchtman (2018) “Religious
Competition and Reallocation: The Political Economy of Secularization in the Protestant
Reformation,” Quarterly Journal of Economics, 133(4), 2037–2096.
Carpenter, Christine (1992) Locality and Polity: a Study of Warwickshire Landed
Society, 1401-99, New York: Cambridge University Press.
Caprettini, B., and Voth, H. J. (2020) “Rage against the machines: Labor-saving
technology and unrest in industrializing England,”American Economic Review: Insights,
2(3), 305-20.
Clark, Gregory (2014) ““The Industrial Revolution” in Handbook of Economic Growth,
Volume 2, eds. Philippe Aghion and Steven Durlauf, Amsterdam: North-Holland.
Clark, Gregory and David Jacks (2007) “Coal and the Industrial Revolution,
1700-1869,” European Review of Economic History, 11(1), 39-72.
Clay, Christopher G.A. (1984) Economic Expansion and Social Change: England
1500-1700: Volume 1, People, land and towns, New York: Cambridge University Press.
Clay, Christopher G.A. (1985) Landlords and estate management in England, 1640-
1750 in Joan Thirsk ed. The Agrarian History of England and Wales, 1640-1750, Volume
5 (2), New York: Cambridge University Press.
Cliffe, J.T. (1969) The Yorkshire Gentry: From the Reformation to the Civil War,
London: The Athlone Press.
Conley, Timothy G. (1999) “GMM Estimation with Cross Sectional Dependence, ”
Journal of Econometrics, 92(1), 1-45.
48

Cooper, John P. (1983) Land, Man and Beliefs: Studies in Early-Modern History,
London: The Hambledon Press.
Coss, Peter R. (2005) The Origins of the English Gentry, Cambridge: Cambridge
University Press.
Crafts, Nicholas and Nikolaus Wolf (2014) “The Location of the UK Cotton
Textiles Industry in 1838: a Quantitative Analysis,” Journal of Economic History, 74(4),
1103–1139.
Darby, Henry C. , Robin E. Glasscock, John Sheail, George R. Versey (1979)
“The changing geographical distribution of wealth in England: 1086-1334-1525,” Journal
of Historical Geography, 5(3) 247-262.
Davenport, F.G. and I.S. Leadam (Ed.) (1898) “The Domesday of Inclosures,
1517–18, being the Extant Returns to Chancery for Berks, Bucks, Cheshire, Essex, Le-
icestershire, Lincolnshire, Northants, Oxon, and Warwickshire by the Commissioners of
Inclosures in 1517, and for Bedfordshire in 1518, together with Dugdale’s MS. Notes of the
Warwickshire Inquisitions in 1517, 1518, and 1549,” Oxford: Oxford University Press.
Doepke, Matthias and Fabrizio Zilibotti (2008) “Occupational Choice and the
Spirit of Capitalism,” Quarterly Journal of Economics, 123(2), 747-793.
Douglas, William (1964) William the Conqueror: the Norman impact upon England,
Berkeley: University of California Press
Dowey, James (2013) “Mind over Matter: Access to Knowledge and the British
Industrial Revolution,” Ph.D. thesis, London School of Economics.
Dugdale, William (1693) Monasticon Anglicanum - The history of the ancient abbies,
and other monasteries, hospitals, cathedral and collegiate churches in England and Wales
Duffy, Eamon (2005) The Stripping of the Altars: Traditional Religion in England,
c. 1400- c. 1580, New Haven: Yale University Press.
Elton, Geoffrey R. (1953) The Tudor Revolution in Government: Administrative
49

Changes in the Reign of Henry VIII, Cambridge: Cambridge University Press.
Farrer, William and J. Brownbill (1908) The Victorian history of the county of
Lancaster, Volume 2, London: Constable.
Fenwick, Carolyn C. (1998) The Poll Taxes of 1377, 1379 and 1381: Part 1:
Bedfordshire-Leicestershire, Oxford: Oxford University Press.
Fenwick, Carolyn C. (2001) The Poll Taxes of 1377, 1379 and 1381: Part 2:
Lincolnshire-Westmorland, Oxford: Oxford University Press.
Fernihough, Alan and Kevin H. O’Rourke (2014) “Coal and the European In-
dustrial Revolution,” The Economic Journal, forthcoming
Fleming, Robin (1985) “Monastic Lands and England’s Defence in the Viking Age,
”The English Historical Review , 100(395) , pp. 247-265
French, Henry R. and Richard Hoyle (2007) The character of English Rural
Society: Earls Colne, 1550-1750, Manchester: Manchester University Press.
Gatley, David A. (2005) “1831 Census Database as Organised by the Registration
Districts of 1851,” [computer file]. SN: 4961, http://dx.doi.org/10.5255/UKDA-SN-4961-1.
Gasquet, Aidan (1899) Henry VIII and the English monasteries. London: Nimmo.
Gibbs, Samuel (2015) The service patterns and socialeconomic status of English
archers, 1367-1417: The evidence of the muster rolls and poll tax returns. PhD Thesis,
University of Reading
Glasscock, Robin E. (1975).The Lay Subsidy of 1334, Oxford: Oxford University
Press for the British Academy.
von Glahn, Richard (2016) The Economic History of China, New York: Cambridge
University Press.
Gray, Madeleine (1987) “Crown property and the land market in south-east wales
in the sixteenth century,” Agricultural History Review, 35 (2), 133-150.
Habakkuk, John (1950) “Marriage Settlements in the Eighteenth Century,” Trans-
50

actions of the Royal Historical Society, 4th ser. XXXII (I950), 15-30.
Habakkuk, John (1958) “The market for monastic property, 1539-1603,” The Eco-
nomic History Review, 10(3), 362–380.
Haigh, Christopher (1975) Reformations and Resistance in Tudor Lancashire, New
York: Cambridge University Press.
Haigh, Christopher (1993) English Reformations: Religion, Politics, and Society
Under Tudors, Oxford: Oxford University Press.
Harrison, William (1968) The Description of England, Ithaca: Cornell University
Press.
Hasler, Peter W. (2006) The History of Parliament: The House of Commons, 1558-
1603, London: Boydell and Brewer
Havran, Martin J. (1962) The Catholics in Caroline England, Stanford: Stanford
University Press.
Heal, Felicity and Clive Holmes (1994) The Gentry in England and Wales, 1500-
1700, Stanford: Stanford University Press.
Heal, Felicity (2008) Of Prelates and Princes: A Study of the Economic and Social
Position of the Tudor Episcopate, New York: Cambridge University Press.
Heldring, Leander, James A. Robinson and Sebastian Vollmer (2020) “The
economic effects of the English enclosures,” work in progress.
Hicks, John R. (1969) A Theory of Economic History, Oxford: Clarendon Press.
Hsieh, Chiang-Tai and Peter J. Klenow (2009) “Misallocation and Manufacturing
TFP in China and India,” Quarterly Journal of Economics, 124, 1403-1448.
Houston, R.A. (1982) “The Development of Literacy: Northern England, 1640-
1750,” Economic History Review, 35, 2, 199-216. Hoyle, Richard W. (1994) Tudor
Taxation Records: A Guide for Users, London: Public Records Office.
Hudson, Pat (2002) The Genesis of Industrial Capital: A Study of West Riding Wool
51

Textile Industry, c.1750-1850, New York: Cambridge University Press.
Hull (2018) The Hull Domesday project. http://www.domesdaybook.net/home
IUSS Working Group WRB (2014) World Reference Base for Soil Resources 2014.
International soil classification system for naming soils and creating legends for soil maps.
World Soil Resources Reports No. 106, FAO, Rome. http://www.fao.org/3/a-i3794e.pdf
Jenkin, Philip (1983) The Making of a Ruling Class: The Glamorgan Gentry 1640-
1790, New York: Cambridge University Press.
Jha, Saumitra (2015) “Financial Asset Holdings and Political Attitudes: Evidence
from Revolutionary England,” The Quarterly Journal of Economics, 130(3), 1485–1545.
Jones, Eric L. (1974) Agriculture and the Industrial Revolution, Hoboken: John
Wiley & Sons.
Kain, Roger (1986) Atlas of Agriculture in England and Wales, c.1840. [data collec-
tion]. UK Data Service. SN: 1659, http://dx.doi.org/10.5255/UKDA-SN-1659-1.
Kain, Roger and Richard Oliver (2001) “Historic Parishes of England and Wales:
an Electronic Map of Boundaries before 1850 with a Gazetteer and Metadata,” [computer
file]. SN: 4348, http://dx.doi.org/10.5255/UKDA- SN-4348-1.
Kerridge, Eric (1969) Agrarian Problems in the Sixteenth Century and After, Lon-
don: George Allen and Unwin, Ltd.
Kew, J. (1970) “The Disposal of Crown Lands and the Devon Land Market, 1536-58,”
The Agricultural History Review, 18(2), 93-105.
Knowles, David (1979) The Religious Orders in England, Volume 3. Cambridge:
Cambridge University Press.
Knowles, David and Hadcock, Neville (1994) Medieval religious houses, England
and Wales, London: Longman.
Langton, John (1979a) Geographical Change and Industrial Revolution: Coalmining
in South West Lancashire, 1590-1799, New York: Cambridge University Press.
52

Langton, John (1979b) “Landowners and the Development of Coalmining in South-
West Lancashire, 1590-1799,” in H.S.A. Fox and Robin A. Butlin eds. Change In The
Countryside - Essays on Rural England 1500-1900, London: Institute of British Geogra-
phers.
Letters, Samantha and Fernandes, Mario and Keene, Derek and Myhill,
Olwen (2003) Gazetteer of Markets and Fairs in England and Wales to 1516, Kew: List
and Index Society; Special Series vols 32 and 33.
Liljegren, Sten Bodvar (1924) The fall of the monasteries and the social changes
in England leading up to the great revolution, Lund: C. W. K. Gleerup.
King, Gregory (1810) Natural and Political Observations and Conclusions Upon the
State and Condition of England, 1696, London: Stockdale.
MacCulloch, Diarmaid (1988) “Bondmen under the Tudors,” in Claire Cross, David
Loades and J.J. Scarisbrick eds. Law and Government under the Tudors, New York: Cam-
bridge University Press.
McCleary, Rachel M. and Robert J. Barro (2019) The Wealth of Religions: The
Political Economy of Believing and Belonging, Princeton: Princeton University Press.
McKendrick, Neil (1964) “Josiah Wedgwood and Thomas Bentley: An Inventor-
Entrepreneur Partnership in the Industrial Revolution,” Transactions of the Royal Histor-
ical Society (Fifth Series), 14, 1–33.
Manning, R.B. (1969) Religion and Society in Elizabethan Sussex, Leicester: Leices-
ter University Press.
Mingay, Gordon E. (1976) The Gentry: The Rise and Fall of a Ruling Class, London:
Longman.
Mokyr, Joel, Assaf Sarid and Karine van der Beek (2020) “The Wheels of
Change: Technology Adoption, Millwrights, and Persistence in Britain’s Industrialization”
CEPR Discussion Paper 14138.
53

Nef, John U. (1966) The Rise of the British Coal Industry, Volume II, Routledge.
Outhwaite, Brian R. (1971) “Who bought crown lands? the pattern of purchases,
1589–1603,” Historical Research, 44 (109), 18–33.
Overton, Mark (1996) Agricultural Revolution in England, New York: Cambridge
University Press.
Parliament (1839) Return of All the Mills and Factories
Pfaff, Steven (2013) “The true citizens of the city of God: the cult of saints, the
Catholic social order, and the urban Reformation in Germany,” Theory and Society, 42,
189–218.
Pirenne, Henri (1927) Medieval Cities: Their Origins and the Revival of Trade,
Princeton: Princeton University Press.
Pirenne, Henri (1936) Economic and Social History of Medieval Europe, Harcourt
Brace.
Polanyi, Karl (1944) The Great Transformation, New York: Farrar & Rinehart.
Pomeranz, Kenneth (2000) The Great Divergence: China, Europe, and the Making
of the Modern World Economy, Princeton, N.J.: Princeton University Press.
Raban, Sandra (1974) “Mortmain in Medieval England,” Past & Present, 62, 3-26.
Restuccia, Diego and Raul Santaeulalia-Llopis (2017) “Land Misallocation and
Productivity” NBER Working Paper 23128.
Savine, Alexander (1909) “English Monasteries on the Eve of the Dissolution,”
In Paul Vinogradoff ed., Oxford Studies in Social and Legal History, Volume I, Oxford:
Clarendon Press.
Scarisbrick, John J. (1968) Henry VIII, Berkeley: University of California Press.
Sheail, John (1968) The regional distribution of wealth in England as indicated in the
1524/5 lay subsidy returns, The List and Index Society special series, London: The List
and Index Society.
54

Sheils, William (2004) “Catholics and Recusants” in Robert Titler and Norman
Jones eds., A Companion to Tudor Britain, Oxford: Wiley-Blackwell.
Stoeber, Karen (2007) Late Medieval Monasteries and Their Patrons: England and
Wales, C.1300-1540, Boydell & Brewer.
Stone, Lawrence (1965) Crisis of the Aristocracy, 1558-1641, Oxford: Clarendon
Press.
Strahan, Aubrey (1912) “Map Showing Visible and Proved Coal Fields of England
and Wales,” in W. McInnes, D. Dowling, and W. Leach eds., The Coal Resources of the
World, Toronto: Morang & co.
Swain, John T. (1986) Industry Before the Industrial Revolution: North-east Lan-
cashire, C. 1500-1640, Manchester: University of Manchester Press.
Swanson, Robert N. (1989) Church and Society in Late Medieval England, Oxford:
Basil Blackwell.
Tate, William E. and Michael Turner (1978) A Domesday of English enclosure
acts and awards, Reading: University of Reading.
Tawney, Richard H. (1912) The Agrarian Problem in Sixteenth Century, New York:
Longmans, Green, and Company.
Tawney, Richard H. (1926) Religion and the Rise of Capitalism, New York: Har-
court, Brace and Company.
Tawney, Richard H. (1941a) “The Rise of the Gentry,” Economic History Review,
11(1), 1-38.
Tawney, Richard H. (1941b) “Harrington’s Interpretation of his Age,” Proceedings
of the British Academy, 27, 199-223.
Thirsk, Joan and J.P. Cooper eds. (1972) Seventeenth Century Economic Docu-
ments, Oxford: Oxford University Press.
Vinogradoff, Paul G. (1923) Villainage in England: Essays in English Mediaeval
55

History, Oxford: The Clarendon Press.
Weber, Max (1905) The Protestant Ethic and the Spirit of Capitalism, Routledge,
London.
Wilson, Thomas (1936) The State of England, ”Anno Dom.” 1600, Camden Society.
Woodcroft, Bennet (1854) Titles of Patents of Invention, Chronologically Arranged:
From March 2, 1617 (14 James I.) to October 1, 1852 (16 Victoriae), London: G.E. Eyre
& W. Spottiswoode.
Woodward, George W. O. (1966) The Dissolution of the Monasteries, London:
Blandford Press.
Worrall, Edward S. (1980) Returns of papists, 1767, Diocese of Chester, London:
Catholic Record Society
Worrall, Edward S. (1989) Returns of papists, 1767, London: Catholic Record
Society
Wrigley, Edward Anthony (2010) Energy and the English Industrial Revolution,
Cambridge: Cambridge University Press.
Youings, Joyce A. (1971) The Dissolution of the Monasteries, London: Allen and
Unwin.
Youings, Joyce A. (1967) “The church” in Joan Thirsk, ed., The Agrarian History
of England and Wales, Volume 4, 1500–1640, New York: Cambridge University Press.
56

Figure 1: Spatial distribution of Monastic property. A cross indicates a location of amonastery around 1535. These we plot for both England and Wales, as well as a singlemonastery on the Isle of Man. Dots indicate at least one monastic manor in a parish in1535. These we plot for England only.
57

Figure 2: The Dissolution and industrialization in 1838
● ●
●
●●
●
●
●
●
●
● ●●
●
● ●
●
0.02
0.03
0.04
0.05
0.06
0.0 0.4 0.8 1.2
E[Monastic (yes/no) | X]
E[M
ill (
yes/
no)
1838
| X
]
The regression line is fitted on our full dataset. The dots summarize thedata by computing the mean of the monastic and mill indicators within 17bins of values of the monastic indicator, after partialling out income percapita in the 1525 Lay Subsidies, parish area and a vector of county fixedeffects.
58

Figure 3: The Dissolution and employment in agriculture in 1831
●
● ●
●●
●
●●
●
●
●●
●●
●
●
●
0.575
0.600
0.625
0.650
0.675
0.0 0.4 0.8 1.2
E[Monastic (yes/no) | X]
E[S
hare
in a
gric
ultu
re 1
831
| X]
The regression line is fitted on our full dataset. The dots summa-rize the data by computing the mean of the monastic indicatorand the share of males over 20 in agriculture in 1831 within 17bins of values of the monastic indicator, after partialling out in-come per capita in the 1525 Lay Subsidies, parish area and avector of county fixed effects.
59

Table 1: Distribution of Landownership in England in 1436 and 1688: Per-centages of cultivated land owned
1436 1688
Aristocracy and greater Gentry 15-20 15-20Middling and lesser Gentry 25 45-50Yeomen, family farmers and other small owners 20 25-33Church & Crown 25-35 5-10
Notes: Adapted from Clay (1986, p. 143)
Table 2: Summary statistics for selected outcome variables
N Mean S.D. Non-Monastic Monastic Difference t-stat
Panel I: Post-DissolutionMonastic (yes/no) 16290 0.32 0.47Market (yes/no) 1600 2146 0.31 0.46 0.27 0.35 0.08 4.01Copyhold count 1842-83 2075 6.75 15.75 7.13 5.95 1.18 1.60Number of Gentry 1700 16290 0.67 1.00 0.58 0.87 0.29 17.61Share Catholic 1767 12546 0.03 0.11 0.04 0.02 -0.01 -7.65Share in agriculture 1831 12859 0.62 0.25 0.62 0.62 -0.01 -1.82Share in trade/handicraft 1831 12859 0.18 0.13 0.17 0.19 0.02 7.86Mill (yes/no) 1838 16290 0.04 0.20 0.04 0.05 0.01 2.26Nr. of Mills 1838 16290 0.16 2.28 0.14 0.19 0.05 1.34
Panel II: Pre-DissolutionMonastic (yes/no) 16290 0.32 0.47Copyhold count 1520 155 0.41 0.88 0.34 0.54 -0.20 -1.33Number of Gentry 1399-1477 9321 0.74 0.45 0.73 0.77 0.04 4.41Share in agriculture 1381 1035 0.35 0.34 0.33 0.37 0.04 1.78Share in trade/handicraft 1381 1035 0.12 0.18 0.12 0.13 0.01 0.91Mill (yes/no) 1399-1477 9321 0.06 0.24 0.06 0.06 0.00 0.14Nr. of Mills 1399-1477 9321 0.07 0.29 0.07 0.07 0.00 0.29
Monastic (yes/no) is an indicator equal to one if a parish contained at least one manor owned by amonastery in 1535. Market (yes/no) is an indicator if a parish had a market. Copyhold count is thenumber of copyhold contracts recorded in a parish. Number of Gentry is the number of members of theGentry that live in a parish in 1700. For the fifteenth century, it is the number of Gentry either living ina parish, or owning the manor in a parish. Share Catholic is the number of Catholics that live in a parishin 1767 normalized by population. Before the Dissolution, we assume everyone was Catholic. Share inagriculture is the share of the population (male, over 20 years old) employed in agriculture, for 1831. For1381, it is the share of the total working population employed in agriculture, male and female, in the 1381poll tax. Share in trade/handicraft is the share of the population (male, over 20 years old) employed intrade or handicraft, for 1831. For 1381, it is the share of the total working population employed in tradeor handicraft, male and female, in the 1381 poll tax. Mill (yes/no) is an indicator equal to one if a parishhad a textile mill in 1838, or a water mill in the fifteenth century. Nr. of Mills is the number of textilemills a parish had in 1838, or the number of water mills in the fifteenth century.
60

Table 3: Trends before the Dissolution
Dep. var: % change in income/revenue p.c. between 1332-1525 1086-1525 1066-1525 1086-1332 1066-1332 1066-1086(1) (2) (3) (4) (5) (6)
Monastic (yes/no) 0.0139 -0.00844 0.0149 -0.0198 -0.00879 0.00145(0.0121) (0.0125) (0.0129) (0.0201) (0.0242) (0.0126)
Control for parish area Y Y Y Y Y YCounty fixed effects Y Y Y Y Y Y
Conley Standard Error 0.0121 0.0125 0.0128 0.0200 0.0240 0.0125Observations 6645 7105 5480 3928 2757 5480Nr. fixed effects 34 40 40 28 28 40R2 0.04 0.01 0.03 0.02 0.05 0.06
Notes: All regressions are estimated using OLS. The unit of observation is a parish. The dependentvariables are percent changes in tax revenue or income per capita or per tax payer between four surveys,the 1525 Lay Subsidy, the 1332 Lay Subsidy, which record tax revenue and the 1086 Domesday survey, andthe 1066 Domesday survey, which record income. We min-max rescaled revenue or income recorded in eachsurvey, by subtracting the maximum value, and dividing by the range (max-min). We compute percentagechanges between surveys using these rescaled measures. Monastic (yes/no) is an indicator equal to oneif a parish contained at least one manor owned by a monastery in 1535. Parish area is the geographicalarea of a parish. County fixed effects are indicators for ancient counties. Standard errors correcting forheteroskedasticity at the parish level are in parentheses. * indicates significance at the 10 percent level, **at the 5 percent level, *** at the 1 percent level.
61
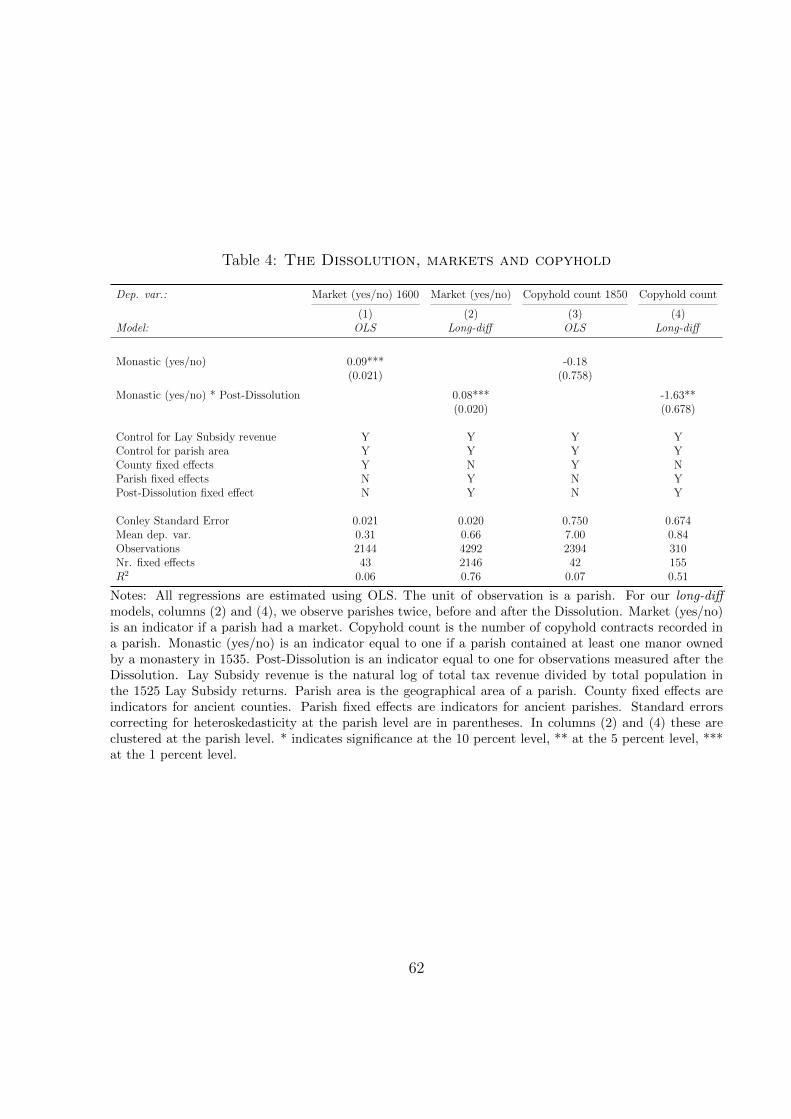
Table 4: The Dissolution, markets and copyhold
Dep. var.: Market (yes/no) 1600 Market (yes/no) Copyhold count 1850 Copyhold count
(1) (2) (3) (4)Model: OLS Long-diff OLS Long-diff
Monastic (yes/no) 0.09*** -0.18(0.021) (0.758)
Monastic (yes/no) * Post-Dissolution 0.08*** -1.63**(0.020) (0.678)
Control for Lay Subsidy revenue Y Y Y YControl for parish area Y Y Y YCounty fixed effects Y N Y NParish fixed effects N Y N YPost-Dissolution fixed effect N Y N Y
Conley Standard Error 0.021 0.020 0.750 0.674Mean dep. var. 0.31 0.66 7.00 0.84Observations 2144 4292 2394 310Nr. fixed effects 43 2146 42 155R2 0.06 0.76 0.07 0.51
Notes: All regressions are estimated using OLS. The unit of observation is a parish. For our long-diffmodels, columns (2) and (4), we observe parishes twice, before and after the Dissolution. Market (yes/no)is an indicator if a parish had a market. Copyhold count is the number of copyhold contracts recorded ina parish. Monastic (yes/no) is an indicator equal to one if a parish contained at least one manor ownedby a monastery in 1535. Post-Dissolution is an indicator equal to one for observations measured after theDissolution. Lay Subsidy revenue is the natural log of total tax revenue divided by total population inthe 1525 Lay Subsidy returns. Parish area is the geographical area of a parish. County fixed effects areindicators for ancient counties. Parish fixed effects are indicators for ancient parishes. Standard errorscorrecting for heteroskedasticity at the parish level are in parentheses. In columns (2) and (4) these areclustered at the parish level. * indicates significance at the 10 percent level, ** at the 5 percent level, ***at the 1 percent level.
62

Table 5: The Dissolution and Social Change
Dep. var.: Nr. Gentry 1700 Nr. Gentry Share catholic 1767 Share catholic
(1) (2) (3) (4)Model: OLS Long-diff OLS Long-diff
Monastic (yes/no) 0.23*** -0.01***(0.018) (0.002)
Monastic (yes/no) * Post-Dissolution 0.20*** -0.01***(0.025) (0.002)
Control for Lay Subsidy revenue Y Y Y YControl for parish area Y Y Y YCounty fixed effects Y N Y NParish fixed effects N Y N YPost-Dissolution fixed effect N Y N Y
Conley Standard Error 0.018 0.025 0.002 0.002Mean dep. var. 0.67 0.77 0.03 0.51Observations 16243 18642 12522 25092Nr. fixed effects 43 9321 42 12546R2 0.12 0.52 0.17 0.99
Notes: All regressions are estimated using OLS. The unit of observation is a parish. For our long-diffmodels, columns (2) and (4), we observe parishes twice, before and after the Dissolution. Number ofGentry is the number of members of the Gentry that live in a parish in 1700. For the fifteenth century, itis the number of Gentry either living in a parish, or owning the manor in a parish. Share Catholic is thenumber of Catholics that live in a parish in 1767 normalized by population. Before the Dissolution, weassume everyone was Catholic. Monastic (yes/no) is an indicator equal to one if a parish contained at leastone manor owned by a monastery in 1535. Post-Dissolution is an indicator equal to one for observationsmeasured after the Dissolution. Lay Subsidy revenue is the natural log of total tax revenue divided by totalpopulation in the 1525 Lay Subsidy returns. Parish area is the geographical area of a parish. County fixedeffects are indicators for ancient counties. Parish fixed effects are indicators for ancient parishes. Standarderrors correcting for heteroskedasticity at the parish level are in parentheses. In columns (2) and (4) theseare clustered at the parish level. * indicates significance at the 10 percent level, ** at the 5 percent level,*** at the 1 percent level.
63

Table 6: The Dissolution and Occupational Structure
Dep. Var.: Share of working population in Agriculture 1831 Agriculture Trade/handicraft 1831 Trade/handicraft
(1) (2) (3) (4)Model: OLS Long-diff OLS Long-diff
Monastic (yes/no) -0.03*** 0.02***(0.005) (0.003)
Monastic (yes/no) * Post-Dissolution -0.07** 0.02*(0.027) (0.013)
Control for Lay Subsidy revenue Y Y Y YControl for parish area Y Y Y YCounty fixed effects Y N Y NParish fixed effects N Y N YPost-Dissolution fixed effect N Y N Y
Conley Standard Error 0.005 0.027 0.003 0.013Mean dep. var. 0.62 0.47 0.21 0.16Observations 12831 1754 12831 1754Nr. fixed effects 42 877 42 877R2 0.10 0.63 0.11 0.71
Notes: All regressions are estimated using OLS. The unit of observation is a parish. For our long-diffmodels, columns (2) and (4), we observe parishes twice, before and after the Dissolution. Share in agri-culture is the share of the population (male, over 20 years old) employed in agriculture, for 1831. For1381, it is the share of the total working population employed in agriculture, male and female, in the 1381poll tax. Share in trade/handicraft is the share of the population (male, over 20 years old) employed intrade or handicraft, for 1831. For 1381, it is the share of the total working population employed in tradeor handicraft, male and female, in the 1381 poll tax. Monastic (yes/no) is an indicator equal to one if aparish contained at least one manor owned by a monastery in 1535. Post-Dissolution is an indicator equalto one for observations measured after the Dissolution. Lay Subsidy revenue is the natural log of total taxrevenue divided by total population in the 1525 Lay Subsidy returns. Parish area is the geographical areaof a parish. County fixed effects are indicators for ancient counties. Parish fixed effects are indicators forancient parishes. Standard errors correcting for heteroskedasticity at the parish level are in parentheses.In columns (2) and (4) these are clustered at the parish level. * indicates significance at the 10 percentlevel, ** at the 5 percent level, *** at the 1 percent level.
64

Table 7: The Dissolution and Industrialization
Dep. var.: Mill (yes/no) 1838 Mill (yes/no) Nr. mills 1830 Nr. mills
(1) (2) (3) (4)Model: OLS Long-diff OLS Long-diff
Monastic (yes/no) 0.01*** 0.11**(0.004) (0.052)
Monastic (yes/no) * Post-Dissolution 0.01** 0.11**(0.006) (0.052)
Control for Lay Subsidy revenue Y Y Y YControl for parish area Y Y Y YCounty fixed effects Y N Y NParish fixed effects N Y N YPost-Dissolution fixed effect N Y N Y
Conley Standard Error 0.004 0.006 0.052 0.052Mean dep. var. 0.04 0.05 0.16 0.09Observations 16243 18642 16243 18642Nr. fixed effects 43 1 43 1R2 0.05 0.53 0.02 0.50
Notes: All regressions are estimated using OLS. The unit of observation is a parish. For our long-diffmodels, columns (2) and (4), we observe parishes twice, before and after the Dissolution. Mill (yes/no) isan indicator equal to one if a parish had a textile mill in 1838, or a water mill in the fifteenth century. Nr.of Mills is the number of textile mills a parish had in 1838, or the number of water mills in the fifteenthcentury. Monastic (yes/no) is an indicator equal to one if a parish contained at least one manor ownedby a monastery in 1535. Post-Dissolution is an indicator equal to one for observations measured after theDissolution. Lay Subsidy revenue is the natural log of total tax revenue divided by total population inthe 1525 Lay Subsidy returns. Parish area is the geographical area of a parish. County fixed effects areindicators for ancient counties. Parish fixed effects are indicators for ancient parishes. Standard errorscorrecting for heteroskedasticity at the parish level are in parentheses. In columns (2) and (4) these areclustered at the parish level. * indicates significance at the 10 percent level, ** at the 5 percent level, ***at the 1 percent level.
65

Table 8: Mechanisms
Dep. var.: Nr. Patents Enclosure Nr. of threshing machines Wheat yield
(1) (2) (3) (4)
Monastic (yes/no) 0.02*** 0.08*** 0.01*** 0.24*(0.007) (0.008) (0.004) (0.134)
Control for Lay Subsidy revenue Y Y Y YControl for parish area Y Y Y YCounty fixed effects Y Y Y Y
Conley Standard Error 0.007 0.008 0.004 0.133Mean dep. var. 0.02 0.37 0.03 21.71Observations 16243 16243 16243 4025Nr. fixed effects 43 43 43 42R2 0.00 0.19 0.05 0.30
Notes: All regressions are estimated using OLS. The unit of observation is a parish. Nr. of patents filedby residents is the number of agricultural patents filed by residents between 1750 and 1830. Enclosure(yes/no) is an indicator equal to one if a parish was enclosed at any point between 1750 and 1830. Nr.of threshing machines is the number of threshing machines in a parish between 1800 and 1830. Wheatyield (bushels per acre) is the number of bushels of wheat that a typical acre yields in 1840. Monastic(yes/no) is an indicator equal to one if a parish contained at least one manor owned by a monastery in1535. Lay Subsidy revenue is the natural log of total tax revenue divided by total population in the 1525Lay Subsidy returns. Parish area is the geographical area of a parish. County fixed effects are indicatorsfor ancient counties. Standard errors correcting for heteroskedasticity at the parish level are in parentheses.* indicates significance at the 10 percent level, ** at the 5 percent level, *** at the 1 percent level.
66

Table 9: Mechanisms comparison - industrialization
Dep. var.: Mill (yes/no) 1838(1) (2) (3) (4)
Share Catholic 1767 -0.11*** -0.10*** -0.10***(0.016) (0.016) (0.016)
Number of Gentry in 1700 0.01*** 0.01*** 0.01***(0.002) (0.002) (0.002)
Monastic (yes/no) 0.01***(0.004)
Control for Lay Subsidy revenue Y Y Y YControl for parish area Y Y Y YCounty fixed effects Y Y Y Y
Mean dep. var. 0.04 0.04 0.04 0.04Observations 12522 16243 12522 12522R2 0.05 0.05 0.05 0.05
Notes: All regressions are estimated using OLS. The unit of observation is a parish. Mill (yes/no) 1838 is anindicator equal to one if a parish had a textile mill in 1838. Share Catholic is the number of Catholics thatlive in a parish in 1767 normalized by population. Before the Dissolution, we assume everyone was Catholic.Number of Gentry is the number of members of the Gentry that live in a parish in 1700. For the fifteenthcentury, it is the number of Gentry either living in a parish, or owning the manor in a parish. Monastic(yes/no) is an indicator equal to one if a parish contained at least one manor owned by a monastery in1535. Lay Subsidy revenue is the natural log of total tax revenue divided by total population in the 1525Lay Subsidy returns. Parish area is the geographical area of a parish. County fixed effects are indicatorsfor ancient counties. Standard errors correcting for heteroskedasticity at the parish level are in parentheses.* indicates significance at the 10 percent level, ** at the 5 percent level, *** at the 1 percent level.
67

Appendix for: The Long-Run Impact of the
Dissolution of the English Monasteries
This appendix contains supplementary material for the paper The Long-Run Impact of the
Dissolution of the English Monasteries. We first provide a model of copyhold agriculture,
which substantiates our claim that perpetual copyhold was inefficient. We then provide
detail on the process of Dissolution and the Valor Ecclesiasticus as a source. After providing
additional and robustness results, we provide a table that shows our recoding of professions
in the 1381 poll tax to occupational categories and a table of data sources.
1: A model of copyhold agriculture
We now develop a simple model to illustrate the argument in the introduction that copy-
holding is economically inefficient and which provides a theoretical foundation for why the
Dissolution of the Monasteries led to greater labor mobility and higher productivity. We
then extend the model to deduce the implications for the efficient allocation of land. We
focus on copyholding of inheritance because this was permanent. With copyholding for
lives, at some point, often after three lives, a landlord could refuse to re-new the copyhold
and could instead rent out the land under a different market based tenancy agreement.
One could imagine therefore that as copyholding became less efficient, such copyholders
vanished. Indeed, the gap between copyhold rents and market rents became increasingly
large. Tawney (1912, p. 122) gives many examples of the divergence between customary
and market rents. For example, “At Amble, in 1608, the surveyor gives the rent of the cus-
tomary tenants as 16 pounds and five pence” while the market rent would be “93 pounds
4 shillings and 4 pence”. On the manor of Hexham, 314 copyholders paid a rent which
was one quarter of the market rent. Thus we would expect copyhold for lives to vanish.
This is exactly what Beckett and Turner’s (2004, p. 288) data suggest since they find that
95% of the cases dealt with by the Copyhold Commission in the nineteenth century were
68

copyholds of inheritance.
Copyholders of inheritance were a different matter. As Clay (1984, p. 88) puts it “the
only way open to the lord of a manor to rid himself of copyholders of inheritance was to
buy their farms if and when they were prepared to sell.” The data suggest that this by
and large did not happen and this would be consistent with the type of imperfect capital
markets story formalized by Galor and Zeira (1993) and particularly Banerjee and Newman
(1993) where capital market imperfections stop efficient ownership structures emerging.
The key theoretical observation is that in a copyholding contract, while copyholders
had the right to pay a fixed ‘customary rent’ (and a ‘fine’ which we abstract from since
adding it into the analysis does not change anything of substance) and therefore were the
residual claimants on their own investments, this can only lead to efficient outcomes in
the case where the copyholder (or his dynasty) remains on the land forever. Yet in the
period we consider, early modern and modern England, there was rapid socio-economic
change, urbanization and industrialization, so it is very plausible that attractive outside
options were emerging. In this case, while a copyholder may have a low fixed rent, he
cannot liquidate or realize the value of any investment in the land, which is specific. This
feature leads to two outcomes; under-investment relative to the social optimum; and a
socially inefficient level of separations since the presence of the fixed investment leads the
copyholder to stay on the land when, from the social point of view, they should be exercising
the outside option. This is so since we assume that a landlord can hire someone else to farm
the land should the copyholder quit. We show that copyholding was inefficient relative to
both the farming of the land by the owner and “rack renting” which seem to have been
the two most important alternatives. Our model also shows that various arguments in the
economic history literature about the efficiency of copyholding are implausible.
69

The Model
Consider a farm with the land owned by a landowner which can be farmed by one tenant.
The model is static and all agents have linear utilities. At the start of the period the
tenant can make an investment i to increase productivity. After doing so he may receive
an outside option w ∈ {wH , wL} with wH > wL. We assume that the option wH arises
with probability p, wL arises with probability q and with probability 1− p− q there is no
outside option. If the tenant does not take any of the outside options then he produces
output which is a differentiable, strictly increasing and strictly concave function f of i,
with derivative denoted f ′.
We first consider the case of a copyholder. In this simplest of models, if the copyholder
does not quit, he pays a fixed ‘customary’ rent rc to the landowner, making him the residual
claimant on his investments. We assume that if an agent quits then whoever is the owner
of the land has the ability to hire another agent to farm the land and that person would
be willing to accept a contract as long as f(i) − rc ≥ 0.32 Though the copyholder is the
residual claimant if he does not quit, since he does not own the land, this investment is
specific in the sense that the copyholder cannot realize its value unless he stays on the farm.
It is immediate that the copyholder will quit if
ws ≥ f(i)− rc for s ∈ {H,L} (3)
To focus on the case of interest we now state a sufficient condition on rc so that when the
outside option is high, the copyholder will find it optimal to quit, while when it is low he
will not. This is
f(f ′−1(1
1− p))− wL > rc > f(f ′−1(1))− wH . (4)
The second inequality in (4) implies that even if the copyholder invests at the surplus
32It would be straightforward to allow for frictions in this process and it would not alter the basicconclusions of the analysis, though of course the details would change in important ways.
70

maximizing level, it is still optimal to quit if the outside option is high. The first inequality
assures that it is not optimal to quit in the low state.
Such a copyholder therefore solves the maximization problem (folding in the optimal
quitting decisions using backward induction)
maxi−i+ pwH + (1− p) (f(i)− rc) (5)
This problem has the first-order condition at an interior solution 1 = (1 − p)f ′(ic). Since
1− p < 1 and f is concave, investment is below the socially optimal level. This is for the
intuitive reason that the investment is specific to the land. The copyholder has the right to
farm the land and pay the fixed rent rc, but he cannot realize the value of any investment if
he leaves and this leads to under-investment. If the value of the outside option is extremely
attractive, then the copyholder quits anyway.
Not only is investment inefficiently low here, but so are separations. The fact that in
state wL the copyholder does not quit is because he cannot realize the value of his specific
investment. In this model, give the assumption about frictionless replacement, expected
total surplus is f(i) − i+ pwH + qwH which is obviously maximized when the copyholder
quits if an outside option materializes.
It is clear in this set-up that the landlord himself would not have any incentive to invest
in the land, this is because all marginal rents would accrue to the copyholder. This is
consistent with the historical record. Clay (1985, p. 206) observes “Inevitably customary
tenants ... received less day-to-day attention from their landlords ... than did those let
for rack rents” and in many cases they were “left to their own devices” since custom did
not entitle “Landlords to regulate their tenants’ husbandry practices in detail in the way
that owners of non-customary lands ... were able to do”. He also notes that copyholders
“stood in the way of estate reorganization” (Clay, 1984, p. 87). French and Hoyle (2007, p.
9) describe copyhold as “fatal to the landowning interest” and Tawney describes it as “a
71

safeguard of the tenants’ interest rather than of those of the manorial authorities” (1912,
p. 132).
We now consider the polar opposite case where the agent owns the land. In this case
if an attractive outside option appears then the agent can exercise it and sell the land.
Denote the price of the plot of land by `. To simplify notation, we fold in the fact that it
will be optimal to sell the land in the case that the agent receives an outside option. Hence
his optimization problem is
maxi−i+ p
(wH + `
)+ q
(wL + `
)+ (1− p− q)f(i)
The price of land will be determined by its value. If the landowner has invested an amount
i, then the plot will produce f(i) and someone would be willing to pay up to that amount.
Hence ` ≤ f(i). For simplicity we assume that the landowner is on the short side of
the market so that this inequality holds as an equality. In this case we can re-write the
maximand
maxi−i+ p
(wH + f(i)
)+ q
(wL + f(i)
)+ (1− p− q)f(i).
It is immediate that investment is efficient and 1 = f ′(i`) with i` > ic and that with
probability p+q the landowner takes the outside option and sells his land. With probability
1− p− q no outside option appears and the landowner works his own land.
In this model it is clear that separations are also socially efficient. Now that the tenant
owns the land he can realize his specific investment by selling the land and thus take
advantage of the outside option.
A third situation which arises frequently in the literature on British economic history
is so-called “rack rent”. The loose idea is that in such a contract the landlord is able
to manipulate the rental rate on the land in order to extract all of the surplus from the
tenant. A simple way of formulating this idea in the context of the present model would
72

be to assume that the landlord can set the rental rate and that he also himself decides
on the amount of investment in the farm. Let rR denote the rental rate. Let rQ be the
rental rate charged to a new tenant who is brought in if the initial tenant quits. Under the
assumptions so far, f(i)− rQ ≥ 0.
Now the landlord chooses these rates and the amount of investment to maximize ex-
pected profits net of investment costs and taking into account the endogenous decision of
the tenant to take the outside option. This maximization problem has to satisfy a partic-
ipation constraint so that a tenant initially accepts the contract. Define 1wH≥wR to be an
indicator function such that 1wH≥wR = 1 if wH ≥ wR where wR is the income a tenant
receives if they stay on the farm and pay the rent rR. If the tenant quits the landlord hires
a new tenant and pays then rQ. The participation constraint follows from the fact that if a
tenant does not accept the contract we assume they get in expectation pwH + qwL. Hence
it is
p(1wH≥wRwH + (1− 1wH≥wR)
(f(i)− rR
))+q
(1wL≥wRwL + (1− 1wL≥wR)
(f(i)− rR
))+(1− p− q)
(f(i)− rR
)≥ pwH + qwL
In considering the optimal level of rR note that for the landlord to always stop the tenant
quitting then it would have to be that rR = f(i)−wH . However, since, if we assume that a
replacement tenants breaks indifference by accepting a contract, we have rQ = f(i) > rR.
Thus it cannot be optimal to stop quitting. This implies that the participation constraint
73

collapses to
pwH + qwL + (1− p− q)(f(i)− rR
)≥ pwH + qwL
or (1− p− q)(f(i)− rR
)≥ 0.
Thus the rack-renting landlord maximizes
maxipf(i) + qf(i) + (1− p− q)f(i)− i
imposing rQ = f(i) and from the participation constraint f(i) = rR. Investment is again
efficient with 1 = f ′(iR). Moreover, separations are also socially efficient.
We now make two simple additions to the model. Assume that farms have idiosyn-
cratic factors that influence their productivity, plausibly related to the nature of the soil,
availability of water, or micro-climatic variation, denote this Aj on farm j. Also assume
that landowners have varying levels of human capital relevant for productivity, denote
the human capital of landowner o by Ho. In the context this could be knowledge of new
agricultural techniques like crop rotation or new mechanical devices like seed drills. The
production function is now f(i, Aj, Ho) and we assume all partial and cross partial deriva-
tives are positive. Aj is fixed and cannot be accumulated and Ho cannot be hired but is a
characteristic of the landowner. With these assumptions is clear we are in a world where
output will be maximized by positive assortative matching. If there is a distribution of
levels of Aj and Ho then the efficient allocation of resources will match the highest Aj with
the highest Ho and so forth. If all land were marketed and worked by the owner, or that
owner could hire a tenant at rack rent then it is clear that matching would be efficient.
This is because the landowner with the highest Ho can use the plot with the highest Aj
more efficiently than any other landowner and therefore would be willing to pay more for it
than the person with the next highest H. It is easy to put more structure on this argument
74

but the relation to Becker’s (1973) paper is clear. Now consider the allocation of resources
when there exist copyhold of inheritance. In this case the return to a landowner with Ho
is rc which is independent of not only Ho but also Aj. If the landowner has high human
capital the benefits accrue entirely to the copyholder. Thus there is no incentive for the
landowner whose human capital is most complementary with a farm to buy it and we would
expect copyholding to break efficient matching.
We can sum up the results of this model in the following way with the addition of one
further assumption which is that it is not the case that the initial matching of landowners to
plots just happens to be efficient. Obviously if it were the case that initially the plots with
the highest Aj happened to be owned by the people with the highest H then copyhold would
not be an impediment to efficient matching - since the match would already be efficient.
In our context this is equivalent to saying that at the time of the Dissolution it was not
efficient that the Monks were the landowners and that there existed higher H people who
could then buy the land and indeed had more incentive to do so than buying non-monastic
lands encumbered with copyholds of inheritance. This re-matching is a critical part of our
story as to why aggregate productivity and investment should increase.
Proposition: Compare two parishes with the same distribution of Aj, the same set of
outside options, but one dominated by copyholding of inheritance and the other not.
The parish with copyholding would be characterized by lower average productivity
as a consequence of lower average investment and less efficient matching of farms to
landowners. It would also have lower rates of exit from agriculture.
This is the main result which we use to interpret our data. It is worth emphasizing
again that it does hinge on imperfect capital markets. If these were not present then the
landowner would be able to buy out the copyholder of inheritance and move to either of the
other options. However, as we have discussed, the assumption that capital markets were
imperfect seems reasonable in early modern England and as a matter of fact, extensive
75
copyholds of inheritance persisted into the 19th century. Critically, as we discussed in the
introduction, monastic lands seem not to have developed copyholds of inheritance which
predominated in non-monastic lands. Hence the Dissolution made available land which was
not encumbered by such contractual forms.
It is worth discussing a common argument in the literature about the efficiency of
copyholding. French and Hoyle (2007, p. 11) state, for example, that “it is not clear why the
survival of copyhold should have inhibited capitalist development, because copyholds could
be bought, sold and let just like any form of freehold property”. Our model shows that this
argument is not correct unless the transaction sold the land to the sitting copyholder. The
fact that a landlord could sell a copyhold to someone else, who was not the copyholder, does
not imply that copyhold was economically efficient. Anybody who bought such a copyhold
would have a sitting copyholder with exactly the incentives that we have outlined. The
new owner would anticipate that the copyholder might receive an attractive outside option
in the way we have modelled it above and would tend to under-invest. Therefore, even
if one bought a copyhold from an existing landlord, this does not stop the logic driving
the inefficient under-investment derived above, or the socially inefficient quitting decision.
Therefore, although an individual would be prepared to pay up to the maximized value of
(5) to obtain a copyholding, the fact that they did so does not imply that the allocation of
resources is efficient. Finally, the last argument we made shows that even if land subject
to copyholds was transacted, there were no incentives for the person who could have used
that land best to purchase it.
One final important conceptual issue to discuss is how, when the results of this section
depend on imperfect capital markets, it was possible for a land market to emerge after the
Dissolution. If people could afford to buy land why could they not buy out copyholders of
inheritance? The reason seems to be related to the distribution of wealth. Landowners who
had sitting copyholders of inheritance were outside the monastic sector. They got a very
76

poor return on their lands and would not have been in a position to buy out their tenants,
nor purchase monastic lands. Instead these were likely bought and sold by others, both by
favorites of the Crown who had received the lands on the cheap and by new Gentry who
had made their money elsewhere, for example in commerce.
2: Further historical background
This section reviews the historical background to the Dissolution of the monasteries and
the Valor Ecclesiasticus, the relationship between the expropriation of the monastic lands,
institutional change in the land market and the rise of then Gentry.
Acts of Parliament leading up to the compilation of the Valor
In 1532 Parliament passed ‘An Acte concernynge restraynt of payment of Annates to the
See of Rome’.33 This act diverted the Annates payed by anybody with the rank of bishop
or higher from the Pope to the Crown. Hunter (1834) argues that this act was meant
to strengthen the King’s bargaining position with the Pope. A second act was passed
in the Parliament that sat from January 15th 1534. This act made it ‘unlawful to make
any payment on any pretence to the See of Rome, and severing the connection which had
existed between the two states’ (Hunter, 1834, p.13).
Parliament next decided that all payments to the Pope were now to be paid to the
King instead. This passed in the Parliament that sat from November 3rd 1534 in the
act titled ‘An Acte Concerninge the payment of Firste Fruites of all dignities benefices and
promocyons spirituall, and also concerning one annuell pencyon of the tenthe parte of all the
possessions of the Churche, spirituall and temporall, graunted to the Kinges Highnes and
his heires’. This act also named the king as the head of the Church of England for the first
33This section builds mostly on Hunter (1834). See also Youings (1971) and Knowles (1979). Annatesare synonymous with first fruits or first year’s profits of every benefice, to be collected when the beneficechanged occupier. A benefice is an ecclesiastical position, such as a parish priest.
77
time. In order to assess how much revenue Henry VIII could expect he sent out surveyors,
called commissioners, to record the value of incomes generated by ecclesiastical property
in England. The Valor Ecclesiasticus is the summary report of these commissioners.
How the Valor Ecclesiasticus was compiled
Every diocese received commissioners, at least three, tasked with assessing the value of all
ecclesiastical possessions in that diocese. The survey started on January 30th 1535 and was
to be finished by the Octaves of Holy Trinity (usually the 8th Sunday after Easter; Knowles
(1979) cites the 1st of May). All commissioners were to be local notables, below the rank of
Baron (Hunter, 1834, p. 19). These notables were usually the justices of the peace, mayors,
sheriffs and the local Gentry (Savine, 1909, p. 17). The oath of the commissioners can be
found in the second volume of the Valor. The commissioners then split up into parties of at
least three, divided the diocese among them and administered the survey. The subsequent
collection of the incomes was left to the bishops who were expected to collect the amount
due by Christmas and deliver it to the Exchequer by April of the following year (Savine,
1909, p. 3).
After the survey, Henry decided to expropriate the English monasteries. He started
with the monasteries that were valued under 200 pounds. In 1536, Parliament passed an
act popularly known as the Dissolution of the Lesser Monasteries Act, which expropri-
ated 453 monasteries (Jack, 1970, p.1). In 1539, The Second Act of Dissolution followed,
expropriating all remaining monasteries.34
The process of dissolution
There were three broad ways in which the Crown obtained ownership of a monastery. The
first was outright expropriation. This method was most commonly used when dealing
34For an exact chronology of the Dissolution of the lesser monasteries see Jack (1970) and Hoyle (1995).Gasquet (1899) includes in appendix I a list of monasteries that paid the Crown to not be dissolved.
78

with smaller monasteries. The abbot would sign a ‘deed of gift’ transferring ownership
to the Crown. A second way was surrender. After the initial wave of dissolution, larger
monasteries were charged with some crime and were given the choice to surrender and
receive pensions or to be tried in court. The third way was dissolution by negotiation.
Some of the larger abbeys managed to secure favorable arrangements for themselves before
signing the deed of gift. The full procedure of dissolution is outlined in Youings (1971, p.
73).
After the Dissolution, some of the expropriated lands were given away as gifts by the
King. Even before the first commission for the sale of lands was established in 1539 a total
of 234 grants had been made (Youings, 1971, p. 117). Not coincidentally, one of the first
grantees was the Chancellor of the Court of Augmentations (the government body in charge
of the dissolution), Richard Rich.35 Other grantees included Henry’s Chief Minister Thomas
Cromwell and several members of the aristocracy. The total amount of land granted appears
to have been relatively small. For Devon, it was about 25% of the expropriated monastic
land and for Leicestershire around 15% (Youings, 1967, p. 343).
Although the Crown initially intended to lease out the remaining land, it quickly decided
to sell the land because the task of managing vast tracts of land was beyond the bureaucratic
capacity of the government. Additionally, in 1543 a war with France broke out which left
the Crown in need of quick cash. It is therefore no surprise that although selling of the lands
started as early as 1539, between 1543 and 1547 the Court of Augmentations oversaw the
sale of two thirds of all expropriated land. By 1558 virtually land had been sold (Habakkuk,
1958).36 Most sales of monastic land were concluded at the fixed price of 20 years income.
35Richard Rich was originally a lawyer with no noteworthy background. He would be knighted and bestyled Baron Rich during his lifetime. For three centuries his descendants would be part of the Englishpeerage (Carter, 2004).
36The process of obtaining land was as follows: Prospective buyers would need to obtain an updatedassessment of the income of the lands they desired from the local augmentations officer. The requestand the updated valor would then be submitted to the Court in London. If approved, the sale would beconcluded. The prices were initially set at twenty years’ rent. Around 1560 the price had gone up to theequivalent of 30 years’ rent and by 1600 it was 40 (Habakkuk, 1958).
79

Who were the people that bought the monastic land? Although no comprehensive
data source exists, the case study evidence suggests that monastic lands were often sold
to people who were associated with the monasteries, either as employees or as tenants
(Youings, 1971). This meant that monastic land was sold locally. From the perspective of
the Court of Augmentations, under pressure to sell land fast, selling to local people was
the expedient manner to dispose of the land. For instance, almost all religious houses had
a steward, who would officially represent the monastery, acting as an ambassador, and one
or more receivers, who would collect rents and other dues. Most houses also employed
bailiffs, associated with the manor courts.37 Once the Dissolution started, these officials
often secured new leases on monastic land seeking to entrench their positions. After the
Dissolution, they renewed these leases with the Court of Augmentations (Woodward, 1966,
p. 328; Jack, 1965). Local people were also involved in the Dissolution as short-term
employees of the court of augmentations. After the Dissolution, they were often the first
to acquire former monastic lands (Youings, 1971, pp. 67, 70).
After the Dissolution of the Monasteries there were three remaining categories of church
landholders: bishops, cathedrals, and colleges (both ecclesiastical and Oxford/Cambridge).
Yet as Heal (2008) documents, by 1650 the lands of the bishops and cathedrals were sold
off as a consequence of them siding with Charles I in the Civil War. Though after the
Restoration the bishops got their land back it was generally leased out to the new occupant
in very long leases (typically 99 years). At the end of this process, the only remaining
lands in the hands of the Church were held by Oxford and Cambridge colleges and some
cathedrals, and parish churches which owned the plot of land they were on.
We now discuss the Valor Ecclesiasticus in more detail.
37For a description of the various offices associated with a early modern manor, see Levett (1927).
80

The Valor Ecclesiasticus
This section describes the state of the Valor Ecclesiasticus archival records, our method for
coding the data and an example from the manor of Helton, Lolbroke and Bell.
The state of the Valor Ecclesiasticus records
The original returns of the Valor are held in the National Archives at Kew Gardens in
London and consist of 22 volumes and 3 folios.38 The Record Commission published a
transcription of the records titled Valor ecclesiasticus temp. Henr. VIII. : Auctoritate
regia institutus, consisting of six volumes that were published, respectively, in 1810, 1814,
1817, 1821, 1825 and somewhere between 1831 and 1834 (Caley and Hunter, 1810, 1814,
1817, 1821, 1825, 1831). One of the editors, Joseph Hunter, wrote a historical introduction
to the survey (Hunter, 1834). He reports that some parts of the survey are lost. The most
important ones are:
• The diocese of Ely.
• A substantial part the diocese of London.
• The counties Berkshire, Rutland, Northumberland.
• A substantial part of the diocese of York, including the whole of the deaneries of
Rydal and Craven.39
Smaller parts that were lost (such as an individual rectory, or some manors) were taken
from third sources and printed in the Record Commission edition. The most important
third source is the Liber Valorum (Ecton, 1711) which is a compilation of abstracts of
the original records that were made for Henry VIII. These abstracts are usually referred
38The dedicated website is at http://www.nationalarchives.gov.uk/records/research-guides/dissolution-of-the-monasteries.htm.
39A deanery is an ecclesiastical administrative division, comparable to the hundred.
81
to as the King’s Book (or Liber Regis). These compilations, however, record the total
(net) taxable income for an ecclesiastical unit and don’t specify the geographical source
where the components of the income was generated which precludes us from getting a clean
measure of the income of a unit, see below. When recording the data, we have tagged the
observations that are taken from third sources. Excluding them from the analysis does not
change the results (not reported).
The organization of the Valor
The Valor is recorded in a very systematic way. The main geographical unit by which the
survey can be broken down is the diocese. Within every diocese there is a clear order in
which the lower level units are coded, with the monasteries featuring most prominently.
The exact order is given below. Next to this ordering of units, there is an ordering of
the income data within each unit. All income is first of all divided into temporalities and
spiritualities. Temporalities are all incomes that the monks/benefice holders receive from
activities, like farming, that are not theirs by virtue of holding the specific benefice.40 The
most important parts of the temporal income are the incomes from demesnes in manu
(farmed by the benefice holder) and from payments of tenants on Church lands (Savine,
1909, p. 85). Spiritualities are those incomes to which benefice holders are entitled by
virtue of holding the benefice. It also includes income from glebe lands (lands designated
to support the benefice holders) and from oblations (another church tax). The second
distinction in the returns for individual ecclesiastical units is between gross and net income.
Gross income represent total income, and net income represents income (valet clare or Et
remanclare (clear value remaining) in the returns) over which sums payable to the king
would be determined. The following deductions from gross income were allowed (Hunter,
1834):
40A benefice is a position within the Church.
82

1. Rents resolute to the Chief Lords, and all other annual and perpetual rents and
charges.
2. The alms which were due to the poor, according to any foundation or ordinance.
3. Fees to stewards, receivers, bailiffs and auditors.
4. Synodals and procurations,41 with which most abbeys and benefices were charged.
Monetary values in the Valor are are recorded in l.s.d. or £.s.d notation. This refers to
pounds (librae), shillings (solidi) and pennies (denarii). There are 12 pennies in a shilling
and 20 shillings in a pound. Particular details regarding the notation of income are in
Lindley (1957).
Within the Valor, there is a fixed order in which ecclesiastical units appear (taken
directly from Hunter, 1834): per diocese we have
1. The See of the bishop or archbishop.
2. The endowments on the various offices in the cathedral church.
3. Archdeaconries/Deaneries with their claims, and per entry the following:
(a) Monasteries and colleges.
(b) Parsonage, vicarages, chantries and free chapels.
If a deanery is home to a monastery, this monastery is listed before the other benefices
in the deanery and has a specific ordering, namely:
1. Income of the precincts (i.e. any land immediately surrounding the monastery).
2. Income from lands in the county in which the house stood.
41Synodals and procurations are ecclesiastical fees.
83

3. Income from lands in other counties.
4. Income from impropriate rectories (rectories for which the proceeds went to a layman).
An example: the manor of Helton, Lolbroke and Bell
The manor of Helton, Lolbroke and Bell was a possession of Abbotsbury abbey and was
located in Bridport deanery (in the Valor it is called Byrport) in Dorset. Figure A-1 is
a photograph of the entry as it appears in the Record Commission edition of the Valor.
Note that we omitted any deductions from this picture, it just lists temporal and spiritual
income.42
The first entry is an assize rent (reddit assis’, a fixed rent) in Helton, which gives an
annual income of £: xl s: xvii d: vii. The next entry is a part of the demesne (tr’daicaliu)
that is not farmed by the rector (firma dimiss’ ) for which he receives a rent. The next entry
is another assize rent in Lolbroke & Bell. Then we have an entry that records proceeds
from the manor court (pficuis cur’ ) and several other incomes (al’ pquisit’ ) taken for an
average year (coibs annis).
The next two entries are two rents (reddit’resolut) that are owed to an abbott and
payable to his manor (abbti & conventui de Miltonad maniu suu). The second figure is
payable to the vicar of archdeaconry of Dorset (vic’Dors’ ). The third entry is payable to
the master of the hundred Richard de Whitway (hundr dni R de Whitway). The last entry
is payable due to the local bailiff of the manor Gilbert Kaynell (Gilbti Kaynell balli).
We are interested in the income from assets, or temporal income. For this manor, these
are the assize rents from lands held by the manor, or the first three entries in Figure A-1.
We therefore coded three entries into our database for this manor, two in Helton and one
42In order to distinguish these sources of income in the text knowledge of the scribal Latin in which theValor is recorded is required. A valuable introduction to this as well as a glossary of terms and scribalabbreviations can be found in Martin (1949).
84

Figure A-1: The manor of Helton, Lolbroke and Bell in the Valor Ecclesiasticus
in Lolbroke and Bell. The next step is to assign Ordnance Survey grid references to each
of the three places. To find these we followed the method outlined below. Going through
every entry in the six volumes of the Valor this way created the database we used for the
analysis in this paper.
85

3: Construction of our dataset
This section discusses the unit of observation in our study, a historical parish, as well as
our methods for matching data from different sources to individual parishes.
Unit of observation
Our unit of observation is an area from the GIS of the Ancient Parishes of England and
Wales, which is based on the work of Roger Kain and Richard Oliver (Southall and Burton,
2004; Kain and Oliver, 2001). The GIS consists of an ArcGIS shapefile with an underlying
database.43 Since areas may consist of several disjoint shapes, we collapse the shapefile to
collect these into one shape.44 The resulting database has 17,898 unique shapes. Having
created our unit of observation this way, we then merge each data source to this database
using either one of two methods:
1. We directly match an observation in a data source based on its name to a correspond-
ing area in the database underlying the shapefile of the GIS of Ancient Parishes.
2. We record Ordnance Survey grid references45 for each unit we want to match, map
these units in ArcGIS and spatially join them to the shapefile in the GIS of Ancient
Parishes database. Grid references are found using third sources such as Vision of
Britain through time project at http://www.visionofbritain.org.uk/, the gazetteer of
43Each area in the underlying database has a type, which corresponds to an administrative unit that wasused in the nineteenth century. The most common type is the ecclesiastical parish. Other types of unitsare townships, hamlets, boroughs, chapelries or divisions. Around fifty percent of areas are parishes, outof a total of 22,729 areas. Townships and parishes together make up eighty percent of the areas. For subparish units, there is a parish identifier as well.
44For instance, a parish can consist of a main portion where the parish church is and a smaller detachedportion.
45The Ordnance Survey, a government mapping agency, has divided England, Wales and Scotland upinto hundred by hundred kilometer squares (the ’grid’) and assigned a two letter identifier to each gridsquare. A grid reference then records a place within each square by adding an even number of digits,measuring east and north distance within the grid square, measured from the bottom left corner. Forinstance, the Tower of London is located at TQ3350080599 which means that it is in square TQ and then33 kilometers and 500 meters to the North and 80 kilometers and 599 meters to the East, measured fromthe bottom left corner of the square.
86

British places names maintained by the association of British Counties at
http://www.gazetteer.org.uk/map.php and the gazetteer of British placenames main-
tained by the Genuki project at http://www.genuki.org.uk/big/Gazetteer/. We only
use this method if method 1 is unavailable.
Using either method, we assign a parish to the observations in each data source. For
our main variables the exact assignment method is described below. If it was impossible
to assign an area number to an observations using either of the above methods, we have
not used it in our analysis.
The GIS of Ancient Parishes database uses the administrative structure of England
around 1850 whereas we use data that is from before 1850. This creates a problem since in
1844 Parliament passed the Counties (Detached Parts) Act that reassigned several detached
parts of counties (exclaves) to formally be under their ‘mother’ county instead of the county
they were physically in. Since we matched names within counties to minimize confusion
resulting from repetition of names, this could create a problem. However, the GIS of ancient
parishes database records in the commentary category whether a part was transferred.
Using this information we matched within county/parish composition as it was before
1844.
We match each variable to our GIS of parishes to arrive at the dataset used in this
paper.
4: Additional Results
Table A-1 provides summary statistics for all variables used in this paper.
Table A-2 studies gifts of manors to monasteries after the Norman conquest of 1066.
The Domesday book, the return compiled of the income of the country in 1066 and 1086,
lists who owns each manor. For about 8,200 parishes we can recover who owned the
87

manor before the Conquest and after. We code an indicator equal to one if a manor was
not owned by a monastery before the Conquest and was gifted to a monastery after the
conquest, before 1086. We argued in the background section of our paper that monastic
patrons gave land from their own landholdings, but that these were scattered by William
the Conqueror to prevent magnates from rising up against him. This would imply that pre-
existing development differences do not meaningfully matter for which manors get gifted
to a monastery. We test this idea by regressing our indicator for monastic gift on the value
or income generated by the manor or the manors in the parish before the Conquest in
1066. We find that these two variables are uncorrelated, either in a bivariate regression in
column (1) or when controlling for our baseline covariates in column (2). This evidence is
consisted with the idea that lay landownership was scattered, and that therefore monastic
landownership was scattered.
Table A-3 is the first of several robustness tables. Each robustness table studies each
main outcome. In columns (1)-(2), we study the impact of the Dissolution on markets and
copyhold. In columns (3)-(4) we study the intermediate social consequences of the Dissolu-
tion using the presence of Gentry and Catholics. In columns (5)-(8) we study the ‘ultimate’
impact of the Dissolution on economic outcomes, studying employment and industrial-
ization. In columns (5) and (6) we use employment in agriculture and trade/handicraft
whereas in columns (7) and (8) we use either our indicator for the presence of a textile mill
or the number of textile mills as the dependent variable. Subsequent tables repeat this ba-
sic structure. We first present a number of robustness checks for our cross-sectional results.
Later we present a number of robustness checks that pertain both to our cross-sectional
results as well as our ‘long-diff’ results.
Table A-3 repeats our main OLS results, omitting all covariates. We find that all effects
go through essentially unchanged, both in sign as well as in magnitude.
In Table A-4 we vary fixed effects. Across our five panels, we use fixed effects at the level
88

of the hundred, an intermediate administrative unit between counties and parishes. There
are about 900 hundreds in our full sample. In the second panel, we add 10 by 10 kilometer
grid cell fixed effects, and in panel three we add 5 by 5 kilometer fixed effects. For the 5
by 5 kilometer grid, we get about three parishes per fixed effect, so we make essentially
next-neighbor comparisons. Throughout, we find stable treatment effects even in the most
restrictive specifications, except for the effect of the presence of a market which loses pre-
cision. In the fourth and fifth panels, we add north-south and east-west fixed effects. We
define the North as the following counties: Cheshire, Cumberland, Derbyshire, Durham,
Lancashire, Lincolnshire, Northumberland, Nottinghamshire, Staffordshire, Westmorland,
Yorkshire: East Riding, Yorkshire: North Riding, and Yorkshire: West Riding. We define
the East as the following counties: Bedfordshire, Buckinghamshire, Cambridgeshire, Es-
sex, Hertfordshire, Huntingdonshire, Leicestershire, Kent, Lincolnshire, Middlesex, Norfolk,
Northamptonshire, Nottinghamshire, Rutland, Suffolk, Surrey, Sussex, Yorkshire: North
Riding, and Yorkshire: West Riding. For these fixed effects, too. results are by and large
stable, with the exception of the number of mills. Note that the location of the industry,
measured by the mill indicator is stable.
In Table A-5 we add geographical covariates. We include several measures of the pro-
ductivity of the soil. These measure capture any latent productivity differences, and allow
us to ascertain that our results are not driven by geographical differences. We then add
several distance measures, to capture the idea that monastic parishes may simply have been
located advantageously. We include distance to the nearest river, which were important
sources of inanimate power. We include distance to the nearest market town (from Adams,
1700), distance to the border and distance to London, to capture proximity to economic
activity. Finally, we use distance to the nearest coal field, which Pomeranz (2000) argued
was crucial for why the Industrial Revolution happened in England. We find that our esti-
mated effect of the Dissolution is robust to inclusion of all these measures. Some estimated
89

effect are of independent interest. We find, for example, that parishes further away from
coalfields are more agricultural and less industrialized.
In Table A-6 we use the natural log of the total income generated by monastic assets in
a parish as the independent variable of interest. In the paper we focused on the extensive
margin, motivated by the hypothesis that the Dissolution brought a discrete change in the
commercialization of a parish. The continuous measure we use here combines both the
extensive margin, we retain parishes without monastic assets, and the intensive margin. In
this table, as in the following tables, we now report two panels, one for our OLS model and
one for our ‘long-diff’ model. We see that all results go through, but that the long-diff results
become somewhat more noisy for the employment outcomes. These result suggest that our
main results are largely driven by the extensive margin of the effect of the Dissolution.
In Tables A-7 we remove from the sample parishes whose monastic assets were owned
by the Cistercians. Andersen et al. (2017) hypothesize that the Cistercians were prolific
teachers, transmitting skills to the population. We believe that the effects of the Cister-
cians are likely to be muted in our study because our variation comes by and large from
manors that were owned by the monasteries and not from the location of the monasteries
themselves. Nevertheless, Table A-7 reports results removing the Cistercian parishes from
the sample. Cistercian parishes comprise about 9% of parishes from the sample, or about
30% of monastic parishes. We observe that treatment effects are by and large unchanged,
although, due to the removal of about a third of treated parishes, some estimated effects
become more noisy.
90

Table A-1: Summary statistics for all variables
N Mean Standard Deviation Min Max
Monastic (yes/no) 16290 0.32 0.47 0.00 1.00Market (yes/no) 1600 2146 0.31 0.46 0.00 1.00Copyhold count 1842-1883 2399 7.01 16.76 0.00 228.00Number of Gentry in 1700 16290 0.67 1.00 0.00 12.00Share Catholic 1767 12546 0.03 0.11 0.00 0.99Share in agriculture 1831 12859 0.62 0.25 0.00 1.00Share in trade/handicraft 1831 12859 0.21 0.17 0.00 1.00Mill (yes/no) 1838 16290 0.04 0.20 0.00 1.00Nr. of Mills 1838 16290 0.16 2.28 0.00 141.00Nr. of Agricultural Patents 1672-1850 16290 0.02 0.28 0.00 14.00Parliamentary Enclosure 1750-1840 16290 0.37 0.48 0.00 1.00Nr. Threshing machines 1800-1830 16290 0.03 0.19 0.00 5.00Wheat Yield (bushels/acre) 1840 4028 21.71 4.51 4.00 48.00Copyhold count 1520 155 0.41 0.88 0.00 8.00Number of Gentry 1399-1477 9321 0.74 0.45 0.00 2.00Share in agriculture 1381 1035 0.35 0.34 0.00 1.00Share in trade/handicraft 1381 1035 0.12 0.18 0.00 1.00Mill (yes/no) 1399-1477 9321 0.06 0.24 0.00 1.00Nr. of Mills 1399-1477 9321 0.07 0.29 0.00 4.00ln(Lay Subsidy income per capita) 16290 1.65 1.84 0.00 8.80Parish area 16246 7.94 8.14 0.00 198.19Terrain elevation 16290 88.41 75.54 -2.61 588.24Terrain slope 16290 2.63 1.96 0.00 22.39Wheat suitability 16274 37.68 15.45 0.00 96.01Distance to nearest river 16290 2.47 2.12 0.00 30.62Distance to nearest market town 16290 6.12 3.41 0.01 25.84Distance to the border 16290 26.26 21.44 0.00 89.54Distance to London 16290 199.18 107.16 0.60 495.03Distance to nearest coalfield 16290 42.51 41.06 0.00 194.28Domesday value/income per capita 1066 7533 0.32 1.83 0.00 50.67Domesday value/income per capita 1086 7533 0.23 0.31 0.00 11.94Lay Subsidy income per capita 1332 6808 0.15 0.08 0.00 2.25Gift of manor to monastery (yes/no) 8252 0.02 0.13 0.00 1.00Income 1066 8252 11.33 36.35 0.00 1210.00
91

Table A-2: Monastic endowment after the Conquest
Dependent variable: Gift of manor to monastery
(1) (2)
Income 1066 0.00 0.00(0.000) (0.000)
Control for parish area N YCounty fixed effects N Y
Mean dep. var. 0.016 0.017Observations 8252 8230Nr. fixed effects 0 42R2 0.00 0.02
Notes: All regressions are estimated using OLS. The unit of ob-servation is a parish. Gift of manor to monastery is an indicatorequal to one if a manor in the Domesday book was owned bya lay landlord before the Conquest, and by a monastic land-lord after. Income 1066 is the total income of a parish in 1066 inpounds. Parish area is the geographical area of a parish. Countyfixed effects are indicators for ancient counties. Standard errorscorrecting for heteroskedasticity at the parish level are in paren-theses. * indicates significance at the 10 percent level, ** at the5 percent level, *** at the 1 percent level.
92

Table A-3: Main results without covariates
(1) (2) (3) (4) (5) (6) (7) (8)Market 1600 Copyhold 1850 Gentry 1700 Cath. 1767 Agr. 1831 TrH. 1831 Mill 1838 Mills 1838
Monastic (yes/no) 0.08*** 0.23 0.29*** -0.01*** -0.01* 0.01*** 0.01** 0.05(0.020) (0.735) (0.018) (0.002) (0.004) (0.003) (0.003) (0.044)
Control for Lay Subsidy Revenue N N N N N N N NControl for Parish area N N N N N N N NCounty fixed effects N N N N N N N N
Mean dep. var. 0.31 7.01 0.67 0.03 0.62 0.21 0.04 0.16Observations 2146 2399 16290 12546 12859 12859 16290 16290R2 0.01 0.00 0.02 0.00 0.00 0.00 0.00 0.00
Notes: All regressions are estimated using OLS. The unit of observation is a parish. Market (yes/no)is an indicator if a parish had a market. Copyhold count is the number of copyhold contracts recordedin a parish. Gentry 1700 is the number of members of the Gentry that live in a parish in 1700. Cath1767 is the number of Catholics that live in a parish normalized by population. Agr. 1831 is the share ofthe population (male, over 20 years old) employed in agriculture in 1831. TrH. 1831 is the share of thepopulation (male, over 20 years old) employed in trade or handicraft in 1831. Mill (yes/no) 1838 is anindicator equal to one if a parish had a textile mill in 1838. Mills 1838 is the number of textile mills aparish had in 1838. Standard errors correcting for heteroskedasticity at the parish level are in parentheses.* indicates significance at the 10 percent level, ** at the 5 percent level, *** at the 1 percent level.
93

Table A-4: Varying fixed effects
(1) (2) (3) (4) (5) (6) (7) (8)Market 1600 Copyhold 1850 Gentry 1700 Cath. 1767 Agr. 1831 TrH. 1831 Mill 1838 Mills 1838
Hundred fixed effects
Monastic (yes/no) 0.09*** -0.49 0.23*** -0.01*** -0.04*** 0.03*** 0.02*** 0.15**(0.028) (0.977) (0.018) (0.002) (0.004) (0.003) (0.004) (0.060)
Mean dep. var. 0.31 7.00 0.67 0.03 0.62 0.21 0.04 0.16Observations 2144 2394 16243 12522 12831 12831 16243 16243Nr. fixed effects 815 453 965 946 946 946 965 965R2 0.45 0.23 0.23 0.28 0.43 0.39 0.33 0.10
10 x 10 KM grid cell fixed effects
Monastic (yes/no) 0.08** -0.03 0.24*** -0.01*** -0.04*** 0.03*** 0.03*** 0.16***(0.035) (0.908) (0.019) (0.002) (0.005) (0.003) (0.004) (0.051)
Mean dep. var. 0.31 6.99 0.67 0.03 0.62 0.21 0.04 0.16Observations 2144 2395 16246 12523 12832 12832 16246 16246Nr. fixed effects 1071 637 1421 1406 1408 1408 1421 1421R2 0.51 0.26 0.23 0.39 0.39 0.36 0.29 0.13
5 x 5 KM grid cell fixed effects
Monastic (yes/no) 0.10 0.44 0.21*** -0.00* -0.04*** 0.03*** 0.03*** 0.15***(0.104) (1.213) (0.023) (0.002) (0.005) (0.004) (0.005) (0.057)
Mean dep. var. 0.31 6.99 0.67 0.03 0.62 0.21 0.04 0.16Observations 2144 2395 16246 12523 12832 12832 16246 16246Nr. fixed effects 1838 1375 5110 4849 4884 4884 5110 5110R2 0.86 0.59 0.45 0.61 0.63 0.59 0.55 0.36
North-South fixed effects
Monastic (yes/no) 0.07*** -1.02 0.20*** -0.01*** -0.01*** 0.01*** 0.01*** 0.06(0.020) (0.725) (0.018) (0.002) (0.005) (0.003) (0.003) (0.043)
Mean dep. var. 0.31 6.99 0.67 0.03 0.62 0.21 0.04 0.16Observations 2144 2395 16246 12523 12832 12832 16246 16246Nr. fixed effects 2 2 2 2 2 2 2 2R2 0.01 0.03 0.08 0.08 0.01 0.01 0.01 0.00
East-West fixed effects
Monastic (yes/no) 0.08*** -0.97 0.20*** -0.01*** -0.02*** 0.01*** 0.01*** 0.07(0.020) (0.725) (0.018) (0.002) (0.005) (0.003) (0.004) (0.045)
Mean dep. var. 0.31 6.99 0.67 0.03 0.62 0.21 0.04 0.16Observations 2144 2395 16246 12523 12832 12832 16246 16246Nr. fixed effects 2 2 2 2 2 2 2 2R2 0.02 0.03 0.07 0.03 0.02 0.01 0.01 0.00
Covariates for all regressionsControl for Lay Subsidy Revenue Y Y Y Y Y Y Y YControl for Parish area Y Y Y Y Y Y Y YFixed effects Y Y Y Y Y Y Y Y
Notes: All regressions are estimated using OLS. The unit of observation is a parish. Market (yes/no)is an indicator if a parish had a market. Copyhold count is the number of copyhold contracts recordedin a parish. Gentry 1700 is the number of members of the Gentry that live in a parish in 1700. Cath1767 is the number of Catholics that live in a parish normalized by population. Agr. 1831 is the share ofthe population (male, over 20 years old) employed in agriculture in 1831. TrH. 1831 is the share of thepopulation (male, over 20 years old) employed in trade or handicraft in 1831. Mill (yes/no) 1838 is anindicator equal to one if a parish had a textile mill in 1838. Mills 1838 is the number of textile mills aparish had in 1838. Lay Subsidy revenue is the natural log of total tax revenue divided by total populationin the 1525 Lay Subsidy returns. Parish area is the geographical area of a parish. Fixed effects as indicatedin the table. Standard errors correcting for heteroskedasticity at the parish level are in parentheses. *indicates significance at the 10 percent level, ** at the 5 percent level, *** at the 1 percent level.
94

Table A-5: Geographical covariates
(1) (2) (3) (4) (5) (6) (7) (8)Market 1600 Copyhold 1850 Gentry 1700 Cath. 1767 Agr. 1831 TrH. 1831 Mill 1838 Mills 1838
Monastic (yes/no) 0.057*** -0.270 0.220*** -0.005*** -0.027*** 0.018*** 0.017*** 0.137***(0.018) (0.774) (0.018) (0.002) (0.004) (0.003) (0.004) (0.053)
Terrain elevation -0.000 -0.008 -0.001*** 0.000* 0.000*** -0.000 -0.000*** 0.001*(0.000) (0.007) (0.000) (0.000) (0.000) (0.000) (0.000) (0.001)
Terrain slope 0.025** -0.077 0.004 -0.001 -0.022*** 0.011*** 0.009*** 0.032**(0.010) (0.172) (0.006) (0.001) (0.002) (0.001) (0.002) (0.016)
Pasture attainable yield -1.420** 25.711 1.628*** 0.042 -0.554*** 0.665*** 0.014 4.286***(0.642) (20.740) (0.420) (0.049) (0.158) (0.086) (0.102) (1.223)
Wheat suitability -0.001* -0.041 0.001* 0.000** 0.001*** -0.000*** -0.001*** 0.001(0.001) (0.033) (0.001) (0.000) (0.000) (0.000) (0.000) (0.001)
Distance to nearest river -0.005 -0.071 -0.007* -0.002*** 0.009*** -0.007*** -0.008*** -0.024***(0.004) (0.151) (0.004) (0.000) (0.001) (0.001) (0.001) (0.006)
Distance to nearest market town -0.062*** -0.155 -0.024*** 0.001** 0.017*** -0.009*** -0.005*** -0.023***(0.003) (0.146) (0.003) (0.000) (0.001) (0.000) (0.001) (0.006)
Distance to the border 0.002** 0.035 -0.000 -0.000*** -0.000 0.001*** 0.000*** 0.008***(0.001) (0.037) (0.001) (0.000) (0.000) (0.000) (0.000) (0.002)
Distance to London 0.002*** -0.001 -0.002*** 0.000** 0.000 -0.000** 0.000* -0.002**(0.000) (0.019) (0.000) (0.000) (0.000) (0.000) (0.000) (0.001)
Distance to nearest coalfield -0.001 0.002 0.000 -0.000*** 0.001*** -0.001*** -0.000 -0.004***(0.001) (0.020) (0.001) (0.000) (0.000) (0.000) (0.000) (0.001)
Control for Lay Subsidy Revenue Y Y Y Y Y Y Y YControl for Parish area Y Y Y Y Y Y Y YCounty fixed effects Y Y Y Y Y Y Y YSoil type fixed effects Y Y Y Y Y Y Y Y
Mean dep. var. 0.31 7.00 0.67 0.03 0.62 0.21 0.04 0.16Observations 2141 2394 16228 12510 12819 12819 16228 16228Nr. county fixed effects 43 42 43 42 42 42 43 43R2 0.31 0.10 0.14 0.17 0.23 0.20 0.10 0.03
Notes: All regressions are estimated using OLS. The unit of observation is a parish. Market (yes/no)is an indicator if a parish had a market. Copyhold count is the number of copyhold contracts recordedin a parish. Gentry 1700 is the number of members of the Gentry that live in a parish in 1700. Cath1767 is the number of Catholics that live in a parish normalized by population. Agr. 1831 is the share ofthe population (male, over 20 years old) employed in agriculture in 1831. TrH. 1831 is the share of thepopulation (male, over 20 years old) employed in trade or handicraft in 1831. Mill (yes/no) 1838 is anindicator equal to one if a parish had a textile mill in 1838. Mills 1838 is the number of textile mills a parishhad in 1838. Elevation is the average elevation in meters in parish. Slope is the average slope of the land ina parish, measured in degrees. Pasture attainable yield is the attainable yield of pasture in parish. WheatSuitability is the suitability of the soil for growing wheat. Distance to nearest river is the distance to thenearest river, in meters. Distance to nearest market town is the distance between the centroid of parishand the nearest market town recorded in Adams (1700), in meters. Distance to border is the distancebetween the centroid of parish and the sea or Scotland, whichever is closer, in meters. Distance to Londonis the distance between the centroid of parish and London, in meters. Distance to nearest coalfieldis thedistance between the centroid of parish and the nearest coalfield, in meters. Lay Subsidy revenue is thenatural log of total tax revenue divided by total population in the 1525 Lay Subsidy returns. Parish area isthe geographical area of a parish. County fixed effects are indicators for ancient counties. Standard errorscorrecting for heteroskedasticity at the parish level are in parentheses. * indicates significance at the 10percent level, ** at the 5 percent level, *** at the 1 percent level.
95

Table A-6: Use monastic income rather than an indicator
(1) (2) (3) (4) (5) (6) (7) (8)Market 1600 Copyhold 1850 Gentry 1700 Cath. 1767 Agr. 1831 TrH. 1831 Mill 1838 Mills 1838
OLS
ln(1 + Monastic Income) 0.03*** 0.55 0.09*** -0.00*** -0.01*** 0.01*** 0.01*** 0.05**(0.007) (0.392) (0.007) (0.001) (0.002) (0.001) (0.002) (0.020)
Control for Lay Subsidy Revenue Y Y Y Y Y Y Y YControl for Parish area Y Y Y Y Y Y Y YCounty fixed effects Y Y Y Y Y Y Y Y
Mean dep. var. 0.31 7.00 0.67 0.03 0.62 0.21 0.04 0.16Observations 2144 2394 16243 12522 12831 12831 16243 16243Nr. fixed effects 43 42 43 42 42 42 43 43R2 0.06 0.07 0.12 0.17 0.11 0.11 0.05 0.02
Long-diff
Monastic (yes/no) * ln(1 + Monastic income) 0.03*** -0.42** 0.08*** -0.01*** -0.01 0.01 0.01*** 0.04*(0.006) (0.192) (0.010) (0.001) (0.009) (0.005) (0.002) (0.020)
Parish fixed effects Y Y Y Y Y Y Y YPost-Dissolution fixed effect Y Y Y Y Y Y Y Y
Mean dep. var. 0.66 0.84 0.77 0.51 0.47 0.16 0.05 0.09Observations 4292 310 18642 25092 1754 1754 18642 18642Nr. fixed effects 2146 155 9321 12546 877 877 9321 9321R2 0.77 0.51 0.52 0.99 0.63 0.71 0.53 0.50
Notes: All regressions are estimated using OLS. The unit of observation is a parish. For our long-diffmodels, in the second panel, we observe parishes twice, before and after the Dissolution. Market (yes/no)is an indicator if a parish had a market. Copyhold count is the number of copyhold contracts recordedin a parish. Gentry 1700 is the number of members of the Gentry that live in a parish in 1700. Cath1767 is the number of Catholics that live in a parish normalized by population. Agr. 1831 is the share ofthe population (male, over 20 years old) employed in agriculture in 1831. TrH. 1831 is the share of thepopulation (male, over 20 years old) employed in trade or handicraft in 1831. Mill (yes/no) 1838 is anindicator equal to one if a parish had a textile mill in 1838. Mills 1838 is the number of textile mills a parishhad in 1838. n(1 + Monastic income) is the natural log of the total income generated by monastic assets ina parish in pounds in 1535. Post-Dissolution is an indicator equal to one for observations measured afterthe Dissolution. Lay Subsidy revenue is the natural log of total tax revenue divided by total populationin the 1525 Lay Subsidy returns. Parish area is the geographical area of a parish. County fixed effectsare indicators for ancient counties. Parish fixed effects are indicators for ancient parishes. Standard errorscorrecting for heteroskedasticity at the parish level are in parentheses. In the Long-diff panel, standarderrors are clustered at the parish level. * indicates significance at the 10 percent level, ** at the 5 percentlevel, *** at the 1 percent level.
96

Table A-7: Omit parishes owned by Cistercians
(1) (2) (3) (4) (5) (6) (7) (8)Market 1600 Copyhold 1850 Gentry 1700 Cath. 1767 Agr. 1831 TrH. 1831 Mill 1838 Mills 1838
OLS
Monastic (yes/no) 0.08*** -0.20 0.23*** -0.00*** -0.03*** 0.02*** 0.01** 0.00(0.022) (0.845) (0.020) (0.002) (0.005) (0.003) (0.004) (0.017)
Control for Lay Subsidy Revenue Y Y Y Y Y Y Y YControl for Parish area Y Y Y Y Y Y Y YCounty fixed effects Y Y Y Y Y Y Y Y
Mean dep. var. 0.30 7.07 0.66 0.03 0.62 0.21 0.04 0.13Observations 1943 2282 15155 11609 11897 11897 15155 15155Nr. fixed effects 43 42 43 42 42 42 43 43R2 0.06 0.07 0.12 0.17 0.10 0.11 0.05 0.02
Long-diff
Monastic (yes/no) * Post-Dissolution 0.07*** -1.64** 0.22*** -0.02*** -0.09*** 0.02 0.01 0.01(0.021) (0.690) (0.027) (0.002) (0.028) (0.013) (0.007) (0.016)
Parish fixed effects Y Y Y Y Y Y Y YPost-Dissolution fixed effect Y Y Y Y Y Y Y Y
Mean dep. var. 0.65 0.87 0.77 0.51 0.47 0.16 0.05 0.07Observations 3890 296 17144 23266 1642 1642 17144 17144Nr. fixed effects 1945 148 8572 11633 821 821 8572 8572R2 0.77 0.51 0.52 0.99 0.63 0.72 0.53 0.51
Notes: All regressions are estimated using OLS. The unit of observation is a parish. For our long-diffmodels, in the second panel, we observe parishes twice, before and after the Dissolution. Market (yes/no)is an indicator if a parish had a market. Copyhold count is the number of copyhold contracts recordedin a parish. Gentry 1700 is the number of members of the Gentry that live in a parish in 1700. Cath1767 is the number of Catholics that live in a parish normalized by population. Agr. 1831 is the share ofthe population (male, over 20 years old) employed in agriculture in 1831. TrH. 1831 is the share of thepopulation (male, over 20 years old) employed in trade or handicraft in 1831. Mill (yes/no) 1838 is anindicator equal to one if a parish had a textile mill in 1838. Mills 1838 is the number of textile mills a parishhad in 1838. Monastic (yes/no) is an indicator equal to one if a parish contained at least one manor ownedby a monastery in 1535. Post-Dissolution is an indicator equal to one for observations measured after theDissolution. Lay Subsidy revenue is the natural log of total tax revenue divided by total population inthe 1525 Lay Subsidy returns. Parish area is the geographical area of a parish. County fixed effects areindicators for ancient counties. Parish fixed effects are indicators for ancient parishes. Standard errorscorrecting for heteroskedasticity at the parish level are in parentheses. In the Long-diff panel, standarderrors are clustered at the parish level. * indicates significance at the 10 percent level, ** at the 5 percentlevel, *** at the 1 percent level.
97

5: Occupation conversion table for the 1381 poll tax
List occupation Translation Category
Agricultor, ag’, agric’, agricol, agricola, agricole, agricult, au-
grecol
cultivator Agriculture
Arator, arat’, ar’, carucar ploughman Agriculture
Bercar, barker, pastor, pastelere shepherd Agriculture
Cornayser grain merchant Agriculture
Cornloder grain seller Agriculture
Cottar, cotag, coterel cottage tenant Agriculture
Cultor, cult’ terre, cultor, cultores cultivator Agriculture
Darier, daye dairying person Agriculture
Falcator, messor mower Agriculture
Famul, famulus farm laborer Agriculture
Fanner, vannator grain winnower Agriculture
Farmer, fermar, firmar Agriculture
Flaxman flaxer Agriculture
Fogheler fowler Agriculture
Frankleyn freeman, landowner Agriculture
Fruytor fruit grower Agriculture
Fugat sheep or cattle drover Agriculture
Grasier cattleherd Agriculture
Herdman, hirdeman tender of livestock Agriculture
Kembere wool comber Agriculture
Kerner small farmer Agriculture
Lib’ ten free tenant Agriculture
Miller, meller, miln, milner, molend, molendinar, mulleward, mul-
ner, grinder
grain miller Agriculture
Nat’ ten’, nat’ terr’ tenant, natis villein tenant Agriculture
Tenant (ten’ ad volent, ten’ terr) free tenant Agriculture
Tenant in bondage Agriculture
Thresher, triturator, drescher, takker thresher of grain Agriculture
Swon, swynerd, swinherd swineherd Agriculture
Vaccar cowherd Agriculture
Allutar, tawyer leather handler (https Trade and handicraft
Apprentice Trade and handicraft
Armerer, armourer Trade and handicraft
Arrowsmith, arwesmyth Trade and handicraft
Artisan, artifice, art’, artif’ Trade and handicraft
Aurifaber goldsmith Trade and handicraft
Baker, bakst’, bakest’, bakster, pistat, pist’ baker Trade and handicraft
Barber, barbitosour Trade and handicraft
Bladsmith, bladesmith Trade and handicraft
Bookbinder Trade and handicraft
Bowyer maker and seller of bows Trade and handicraft
Braciatrix, brewer, brewstere, bruer, pandoxatore brewer Trade and handicraft
Butcher, bocher, carnifex, meter Trade and handicraft
Callemaker, callere headdress maker Trade and handicraft
Capmaker Trade and handicraft
Cardmaker maker of instruments for carding wool Trade and handicraft
Carpenter, carpent’ Trade and handicraft
Continued on next page
98

Continued from previous page
List occupation Translation Category
Cartwright maker of carts Trade and handicraft
Chaloner blanket maker Trade and handicraft
Chaundeler, candel, candeler candlemaker Trade and handicraft
Chinchere ivory worker Trade and handicraft
Cirotecar, cirot, wheeler wheeler Trade and handicraft
Cissor, sissor, schapst, schappist, schippester, tailor, taylour tailor Trade and handicraft
Cobbler, cobeler shoemaker Trade and handicraft
Combar combsmith Trade and handicraft
Cooper, couper, coup a maker or repairer of casks and barrels Trade and handicraft
Cordewaner, corveyser, sutor, soutere, sothur, sutrix shoemaker Trade and handicraft
Coriour, courreour leather processor Trade and handicraft
Cutler, cotler, cotiller knife seller or sharpener Trade and handicraft
Draper, lyndrap’, pannar, panermaker maker and dealer of fabric and sewing materials Trade and handicraft
Dubber cloth maker Trade and handicraft
Dyer, degher, litst, list, lest, lyster, tinctor, heust dyer of fabric Trade and handicraft
Faber, fabri, fabro, ferour smith Trade and handicraft
Fiddler a person who used a knife to remove casting from
clay
Trade and handicraft
Filat’, filatrix, netrix, spinster, spynner, spynnester spinner of thread Trade and handicraft
Fletcher arrowsmith Trade and handicraft
Fuller, toucar, touker, walker a person who fulls cloth Trade and handicraft
Furnor baker Trade and handicraft
Girdler belt-maker Trade and handicraft
Glasenwright, glasswright glass maker Trade and handicraft
Glover glove maker Trade and handicraft
Goldsmith Trade and handicraft
Harpmaker Trade and handicraft
Hatter maker and seller of hats Trade and handicraft
Hooper, houper hoop maker Trade and handicraft
Hoper, hopman maker and seller of hops Trade and handicraft
Horner horn maker Trade and handicraft
Hosier maker and seller of stockings, gloves, and nightcaps Trade and handicraft
Lardyner metal worker Trade and handicraft
Limenour, luminati glasier manuscript illuminator Trade and handicraft
Lokyer, lokiar, lokear locksmith Trade and handicraft
Lorymer, spurrior, sporier maker of spurs Trade and handicraft
Lymbernere lime maker Trade and handicraft
Maker presumably a generic artisan/manufacturere Trade and handicraft
Malteman, maltmakestre, maltmonger malt maker/seller Trade and handicraft
Mason, cementar, camentar, sementar Trade and handicraft
Mustarder mustard maker Trade and handicraft
Nedler, needler maker of needles Trade and handicraft
Netherd, nethird netmaker Trade and handicraft
Neyler iron nail maker Trade and handicraft
Oliman, olim, olyman oil maker Trade and handicraft
Orfreys embroider Trade and handicraft
Orlogemaker clockmaker Trade and handicraft
Parchemener parchment maker and seller Trade and handicraft
Pattenmaker clog maker Trade and handicraft
Payntour, pictat, pictor painter Trade and handicraft
Pellipar, pelter, pelliper, skinner one who prepares and sells animal skins Trade and handicraft
Continued on next page
99

Continued from previous page
List occupation Translation Category
Pincerna pinner, pin manufacturer Trade and handicraft
Potter, crokkar, figul, dauber, dober maker or seller of pottery Trade and handicraft
Pouchmaker Trade and handicraft
Quyltemaker quiltmaker Trade and handicraft
Reveter clothier Trade and handicraft
Roper rope manufacturer Trade and handicraft
Rotar wheelwright Trade and handicraft
Saddler, sadler, sadeler, sadelar, sellar maker or seller of saddles Trade and handicraft
Salter maker or seller of salt Trade and handicraft
Saucemaker maker or seller of sauce (could also be medicine) Trade and handicraft
Sawyer, saghiar, sachour, sarriator, sarrar, sarrator wood-cutter Trade and handicraft
Sayumaker maker of ? Trade and handicraft
Scharman, scherman, schermon shearman, shearer of cloth Trade and handicraft
Scheder, shether, vaginator sheath maker Trade and handicraft
Sealer seal presser Trade and handicraft
Seustere, sewster seamstress Trade and handicraft
Shipwright repairer and maker of ships Trade and handicraft
Slaymaker sleigh maker Trade and handicraft
Sopere maker or seller of soaps Trade and handicraft
String’, stryng’ bowstring maker Trade and handicraft
Tanner, tannator, wodour leather tanner Trade and handicraft
Tapister maker and seller of tapestries Trade and handicraft
Tiler, cooperator, helder, helier, tegulator, teghelar, teyler, teyl-
maker
maker and installer of tiles Trade and handicraft
Tornour woodworker Trade and handicraft
Weaver, tector, textor, webbe, webster, webere weaver of cloth Trade and handicraft
Wexmaker waxmaker Trade and handicraft
Wright, wryth, wrythys builder or repairer Trade and handicraft
Wyredragher wire maker Trade and handicraft
Botman boatman Mercantile
Broker, broggour Mercantile
Carter, carect’, carior, driver, dryere, thriver transporter of goods Mercantile
Chapman trader, peddler Mercantile
Charrett chariot Mercantile
Corsour horse merchant Mercantile
Dragger, mariner, nauta sailor Mercantile
Ferryman Mercantile
Fisscher, fyscher, fisher, piscat, piscator, piscenar fisher Mercantile
Garlekmong garlic seller Mercantile
Grocer fruit and vegetable seller Mercantile
Habirdassher cloth seller Mercantile
Hackneyman renter of horses and carriages Mercantile
Huckster, hokkestere, hockester, huxster Mercantile
Import’, impot importer Mercantile
Irenmong, irmongere dealer of iron products Mercantile
M’c’ textile merchant Mercantile
Mancip, marchaunt, mercat, mercer merchant Mercantile
Mango equorum horse merchant Mercantile
Peddler, qwaxillarius Mercantile
Poulterer seller of poultry Mercantile
Continued on next page
100
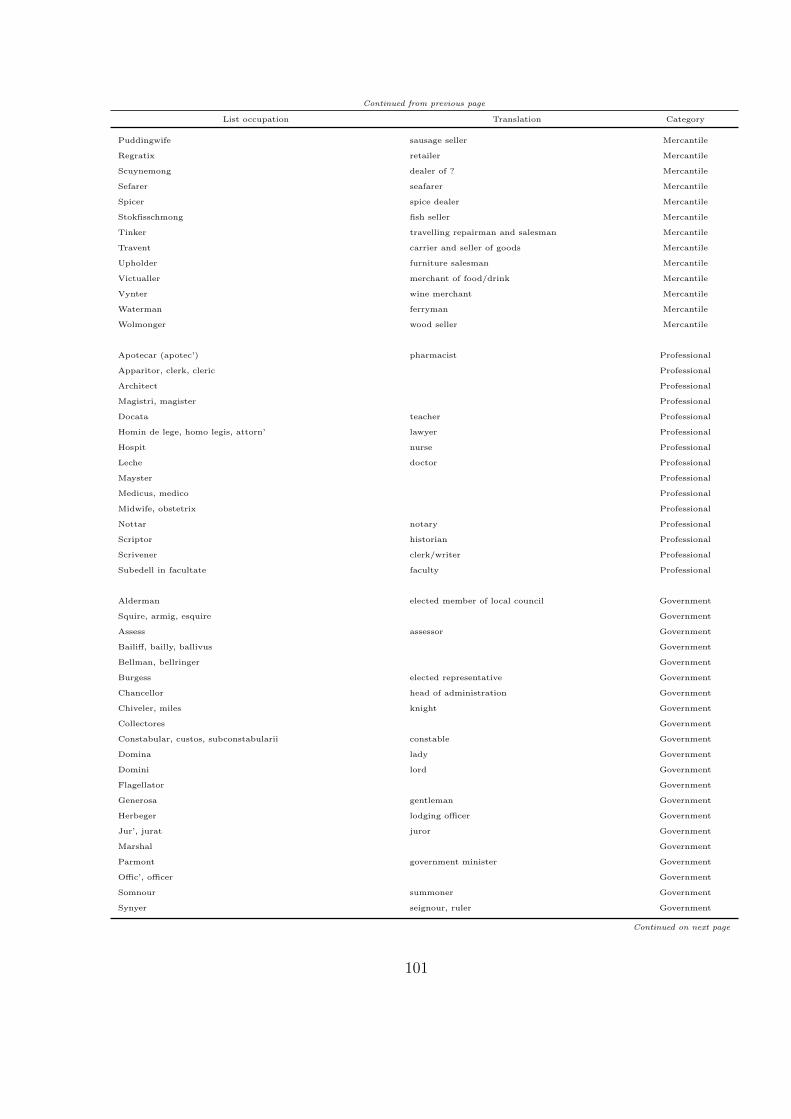
Continued from previous page
List occupation Translation Category
Puddingwife sausage seller Mercantile
Regratix retailer Mercantile
Scuynemong dealer of ? Mercantile
Sefarer seafarer Mercantile
Spicer spice dealer Mercantile
Stokfisschmong fish seller Mercantile
Tinker travelling repairman and salesman Mercantile
Travent carrier and seller of goods Mercantile
Upholder furniture salesman Mercantile
Victualler merchant of food/drink Mercantile
Vynter wine merchant Mercantile
Waterman ferryman Mercantile
Wolmonger wood seller Mercantile
Apotecar (apotec’) pharmacist Professional
Apparitor, clerk, cleric Professional
Architect Professional
Magistri, magister Professional
Docata teacher Professional
Homin de lege, homo legis, attorn’ lawyer Professional
Hospit nurse Professional
Leche doctor Professional
Mayster Professional
Medicus, medico Professional
Midwife, obstetrix Professional
Nottar notary Professional
Scriptor historian Professional
Scrivener clerk/writer Professional
Subedell in facultate faculty Professional
Alderman elected member of local council Government
Squire, armig, esquire Government
Assess assessor Government
Bailiff, bailly, ballivus Government
Bellman, bellringer Government
Burgess elected representative Government
Chancellor head of administration Government
Chiveler, miles knight Government
Collectores Government
Constabular, custos, subconstabularii constable Government
Domina lady Government
Domini lord Government
Flagellator Government
Generosa gentleman Government
Herbeger lodging officer Government
Jur’, jurat juror Government
Marshal Government
Parmont government minister Government
Offic’, officer Government
Somnour summoner Government
Synyer seignour, ruler Government
Continued on next page
101

Continued from previous page
List occupation Translation Category
Waite guard/lookout Government
Ashburner dustman Laborer
Axeburner woodsman Laborer
Carbonar’ charcoal burner Laborer
Colermaker, coal maker Laborer
Forester Laborer
Fract’ lapid, lapidist, latan, latoner, latonius stone cutter Laborer
Forbour metal polisher Laborer
Gardener Laborer
Hayward garden warden Laborer
Heyrer hedger, hedge trimmer Laborer
Labour, laborer, labourer Laborer
Loder, loader, onerantur Laborer
Operatrix workman Laborer
Ostler, palfreyman horse groomsman Laborer
Packer packer of goods Laborer
Parker park caretaker Laborer
Paver Laborer
Plumber, plumbar Laborer
Reeder, tachere, thacher, thakkere, thashere thatcher Laborer
Sclater, sclattere, slater roofer Laborer
Wolpacker wood handler Laborer
Woodward keeper of forests Laborer
Waller builder of walls Laborer
Harper musician Services
Histri actor Services
Hostel, hosteler, hostil, hostilar innkeeper Services
Wyntavernor wine taverner Services
Minstral, menstral musician Services
Piper musician Services
Tabernario, tavener tavern keeper Services
Tapst, tappestere barman Services
Ancilla maid Servant
Bondman Servant
Celer cellarman Servant
Cook Servant
Cunarius nanny Servant
Dryst workwoman (drying) Servant
Garcio servant or mercenary Servant
Lavender washerwoman Servant
Lotrix launderer Servant
Manuciple steward Servant
Nativus bondman Servant
Nutrix wet nurse Servant
Porter Servant
S’, servient, seriaunt, servant Servant
Servient de rector, priorisse, vicar, abbatis, parson servant of the church Servant
Seriant de payes paid servant Servant
Continued on next page
102

Continued from previous page
List occupation Translation Category
Servient sui artifex servant who served as a personal artisan Servant
Scald’ scalder of meat, usually in a royal household Servant
Spenser butler/steward Servant
Valet Servant
Bedellus, beadle parish officer Church
Canon cleric Church
Capell chaplin Church
Coadjutorii bishop Church
Ecclessiam Church
Feretarius monk Church
Rector clergy Church
Pardoner, questore Church
Parmont Church
Parson(e) cleric Church
Priorisse giver of papal pardons and indulgences Church
Vicar chapel head Church
Sacristan parish head Church
Sextayn church officer Church
Verger church attendant Church
Begger, pauper
Bulker thief? Other
Chullour traitor Other
Claudus cripple Other
Commongere, commoner Other
Confrater brother Other
Dicer gambler Other
Dicon impoverished person Other
Leper Other
Secus otherwise Other
Socius kindred Other
Soiournant visitor Other
103

6: Data sources
Variable Source Comment
Main Variables
The Valor Ecclesiasticus Caley and Hunter (1810, 1814, 1817, 1821,1825, 1831)
For coding method, see above.
Additional information on loca-tion of monastic houses
The National Archives Education Service(2019)
Markets Letters et al. (2003)
Copyhold 1520 Davenport and Leadam (1898)
Copyhold 1842-1883 Parliament Records of Copyhold Commis-sion, available through Parlia-mentary papers online
Number of Gentry in 1399-1477 Inquisitions post Mortem http://www.inquisitionspostmortem.ac.uk/,accessed Nov. 2020
Number of Gentry in 1700 Adams (1700)
Number of Catholics 1767 Worrall (1980, 1989)
Occupations - 1381 poll tax Fenwick (1998, 2001) See also Gibbs (2015). Datapartially made available bySamuel Gibbs
Occupations - 1831 census Gatley (2005)
Water mills 1399-1477 Inquisitions post Mortem http://www.inquisitionspostmortem.ac.uk/,accessed Nov. 2020
Textile mill variables Parliament (1839)
Mechanisms
Patents Woodcroft (1854) The data were transcribed andmade available to use by JamesDowey, see Dowey (2013)
Enclosure dummy Tate and Turner (1978)
Agricultural yield Kain (1986)
Threshing machines Caprettini and Voth (2020)
Covariates
The Tudor Lay Subsidies Sheail (1968)
Coal deposits Strahan (1912) Digital copy available throughwww.davidrumsey.com
104

Variable Source Comment
Covariates continued
Elevation CGIAR consortium athttp://srtm.csi.cgiar.org/
Slope Earth Resources Observation andScience Center of the USGS athttp://eros.usgs.gov
Inland rivers and water bodies Digital Chart of the World availablethrough www.diva-gis.org
Distances computed in ArcGIS
Distance to London Computed in ArcGIS
Distance to national border Computed in ArcGIS
Distance to market town List of Market towns from Adams (1700).Distances computed in ArcGIS
Suitability for wheat and barley FAO at http://webarchive.iiasa.ac.at/Research/LUC/GAEZv3.0/
We used the rain-fed, low inten-sity, baseline period settings
Soil type FAO at http://webarchive.iiasa.ac.at/Research/LUC/GAEZv3.0/
Other variables
1332 Lay Subsidy Glasscock (1975) Data made available by BruceCampbell
Domesday Book Hull (2018)
105

Additional References for the Appendix
Banerjee, Abhijit V. and Andrew F. Newman (1993) “Occupational Choice and the
Process of Development,” Journal of Political Economy, 101, 2, 274-98.
Becker, Gary (1973) “A theory of marriage: Part I,” Journal of Political Economy,
81, 4, 813-846.
Carter, P. R. N. (2004) “Rich, Richard, first Baron Rich (1496/7 –1567),” in the
Oxford Dictionary of National Biography, Oxford: Oxford University Press.
Ecton, John (1711). Liber Valorum & Decimarum: Being an Account of the Valua-
tions and Yearly Tenths of All Such Ecclesiastical Benefices in England and Wales, as Now
Stand Chargeable with the Payment of First-fruits and Tenths, printed for R. Gosling, W.
Mears, J. Innys and T. Woodward.
Galor, Oded and Joseph Zeira (1993) “Income Distribution and Macroeconomics,”
Review of Economic Studies, 60, 1, 35-52.
Hoyle, Richard W. (1995) “The Origins of the Dissolution of the Monasteries,” The
Historical Journal, 38(2), 275-305.
Hunter, John (1834) An Introduction to the Valor Ecclesiasticus of King Henry VIII:
With a Map of England and Wales, Showing the Distribution in Dioceses.
Jack, Sybil M. (1965) “Monastic lands in Leicestershire and their administration on
the eve of the Dissolution,” Transactions of the Leicestershire Archaeological and Historical
Society, 1965-6.
Jack, Sybil M. (1970) “Dissolution Dates for the Monasteries Dissolved under the
Act of 1536,” Historical Research, 43(108), 161-181.
Levett, Ada E. (1927) “The financial organization of the manor,” The Economic
History Review, 1(1), 65–86.
Lindley, E. (1957) “A short study in the Valor Ecclesiasticus,” Transaction of the
Bristol and Gloucester Record Society, 76, 98-117.
106

Martin, Charles T. (1949) The Record Interpreter: A Collection of Abbreviations,
Latin words and names used in English historical manuscripts and records, London: Stevens
and sons, limited.
The National Archives Education Service (2019) “Map of the locations of each
monastery closed by Henry VIII.” Discover the Dissolution, The National Archives,
https://storymaps.arcgis.com/stories/eabbb11e62b941c1bf1474a83b5ce8a1
Southall, Humphrey and Nicholas Burton (2004) GIS of the Ancient Parishes of
England and Wales, 1500-1850 [computer file]. SN: 4828, http://dx.doi.org/10.5255/UKDA-
SN-4828-1.
107