the logistics and supply chain - tma.or.th 2018 - nov 5 - the... · pak nam pho lopburi ... surat...
TRANSCRIPT

The Logistics and Supply Chain
5 November 2018
by Mr. Chalat Wongsanguan
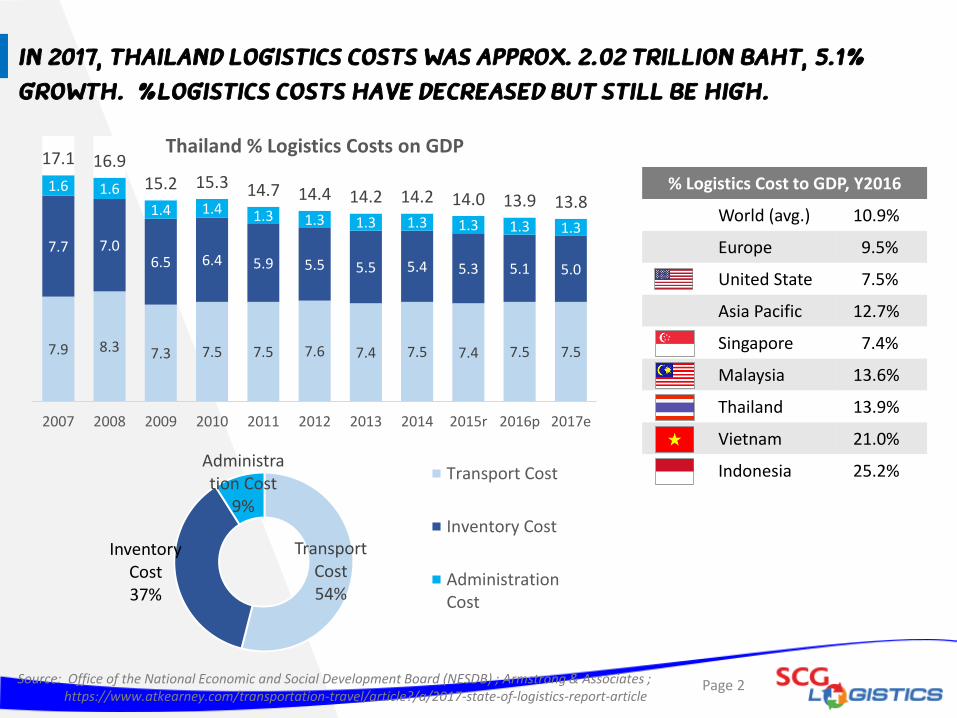
7.9 8.3 7.3 7.5 7.5 7.6 7.4 7.5 7.4 7.5 7.5
7.7 7.0 6.5 6.4 5.9 5.5 5.5 5.4 5.3 5.1 5.0
1.6 1.6
1.4 1.4 1.3 1.3 1.3 1.3 1.3 1.3 1.3
17.1 16.9 15.2 15.3 14.7 14.4 14.2 14.2 14.0 13.9 13.8
2007 2008 2009 2010 2011 2012 2013 2014 2015r 2016p 2017e
Thailand % Logistics Costs on GDP
Transport Cost 54%
Inventory Cost 37%
Administration Cost
9%
Transport Cost
Inventory Cost
AdministrationCost
Source: Office of the National Economic and Social Development Board (NESDB) ; Armstrong & Associates ; https://www.atkearney.com/transportation-travel/article?/a/2017-state-of-logistics-report-article
% Logistics Cost to GDP, Y2016
World (avg.) 10.9%
Europe 9.5%
United State 7.5%
Asia Pacific 12.7%
Singapore 7.4%
Malaysia 13.6%
Thailand 13.9%
Vietnam 21.0%
Indonesia 25.2%
GDP (B $) Logistic
309.8 24.8
296.5 40.3
411.8 64.9
205.3 43.2
932.3 234.7
In 2017, Thailand logistics costs was approx. 2.02 trillion baht, 5.1%
growth. %Logistics costs have decreased but still be high.
Page 2

81% of domestic cargo freight is road mode which costs relatively high
compared to water and rail mode
Page 3
Thailand’s infrastructure Cargo Traffic (‘000 tons)
Domestic Import/Export
Remark: Data as of 2016 except data of Aircrafts, Scheduled airlines, and Average Transport Cost
Source: Ministry of Transport ; Office of the National Economic and Social Development Board (NESDB) ;
Road National Highway Motorway & Expressway Rural & Local road
99,774 km. 225 km.
357,223 km. 486,743 32,293
1.72- 2.02 THB per ton-km
Water International Deep Sea Ports - Containers Waterways
6 10M TEUs 3,999 km.
101,221 222 0.64-0.65 THB
per ton-km
Rail Inter-city
In Bangkok and vicinities
5,652 km.
123 km. 11,970 209,226
0.93-0.95 THB per ton-km
Air
Airports - Aircrafts (2014) - Scheduled airlines (2014) - Scheduled inter’l routes
36 624,169
137 266
122
736 (excl. 3 of postal
& courier
10 THB per ton-km
Transport cost, avg.

To lower logistics cost, more of rail and water mode should be utilized
Page 4
Source: Office of the National Economic and Social Development Board (NESDB) ; https://ec.europa.eu/eurostat/statistics-explained/index.php/Freight_transport_statistics#Modal_split ; https://www.bts.gov/bts-publications/freight-facts-and-figures/freight-facts-figures-2017-chapter-2-freight-moved
Road, 81%
Road, 66%
Road, 76%
Water, 17%
Water, 3%
Water, 6%
Rail, 2%
Rail, 9%
Rail, 17%
21%
0% 10% 20% 30% 40% 50% 60% 70% 80% 90% 100%
Thailand
United State
Europe
Portion of Inland Freight by Mode, Y2016
Road Water Rail Air Others
% Logistics Cost to GDP
9.5%
7.5%
13.9%

Page 5
Single track
Double track
Source: Office of Transport and Traffic Policy and Planning
BKK
Nakhon pathom
Hua Hin
Jira
Prachuap Khiri Khan
Chumphon
Pak Nam Pho
Lopburi
Den Chai
Ubon Ratchathani
Nong Khai
Surat Thani
Songkla
Padang Besar
Chiang Mai
Khon Khan
KangKoi
Bua Yhai
Double track Phase II
Immediate Phase 7 Sections
Chiang Kong
Nakorn Panom
New track
Immediate Phase Completion date
Chachoengsao - Kaeng Khoi, Saraburi Feb 2019
Jira, Korat - Khon Khan Feb 2019
Hua Hin – Prachuap Jul 2020
Nakhon Patom - Hua Hin Jan 2021
Prachuap - Chumphon Jan 2021
Lopburi-Paknampho Nakon Sawan Apr 2022
Map Kabao, Saraburi - Jira, Korat May 2023
Railway track development plan
Chachoengsao
More use of rail freight would be possible according to railway
development plan

Rail mode would be an alternative mode linking Thailand to CLMV and
China
Page 6
Planned Completion Year
2021
Planned Completion Year
2022
Kunming
Hekou
Hanoi
Danang
Ho Chi Minh City
Phnom Penh
Nong Khai
Mandalay
Yangon
Kuala Lumpur
Ruili
Dali
Yuxi
Missing link
Missing link
2018
Kunming
Yangon
Ruili
Dali
Bangkok Bangkok
Mandalay
Yuxi
Mohan
Luang Phrabang
Vientiane
Nong Khai
Western Route
Eastern Route
Central Route

In view of logistics business, postal & courier segment has grown the
most. The growth driver is e-commerce.
Page 7 Source: K SME Analysis ; https://www.bangkokpost.com/tech/local-news/1332643/e-commerce-value-gauged-at-b2-8tn
Logistics Business 2016 2017 2018e
%Growth %Growth %Growth Value (MB)
Road transport 3.5% 6.2% 5.3% - 7.0% 145,100 – 147,300
Warehouse 3.7% 6.2% 5.3% - 7.0% 75,500 – 76,700
Freight forwarder -3.2% 1.6% 0.5% - 2.1% 58,000 – 59,900
Postal & Courier 5.2% 8.7% 9.6% - 11.3% 30,800 – 31,300

In 2016, Thailand's B2C market became the largest in ASEAN
Page 8 Source: ETDA
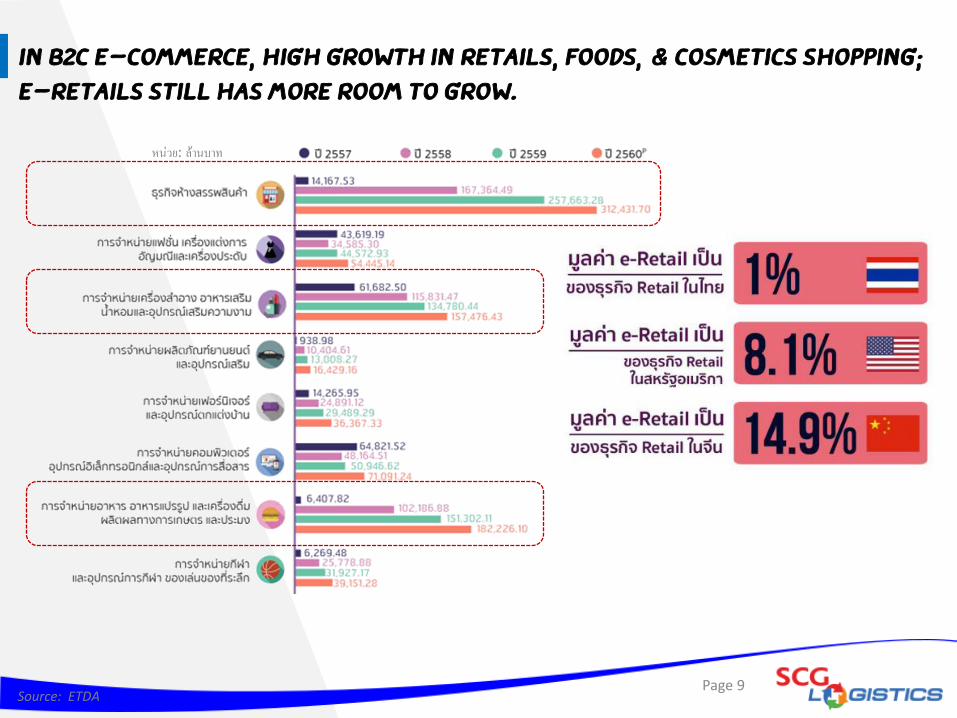
In B2C e-commerce, high growth in retails, foods, & cosmetics shopping;
e-retails still has more room to grow.
Page 9 Source: ETDA
หน่วย: ล้านบาท
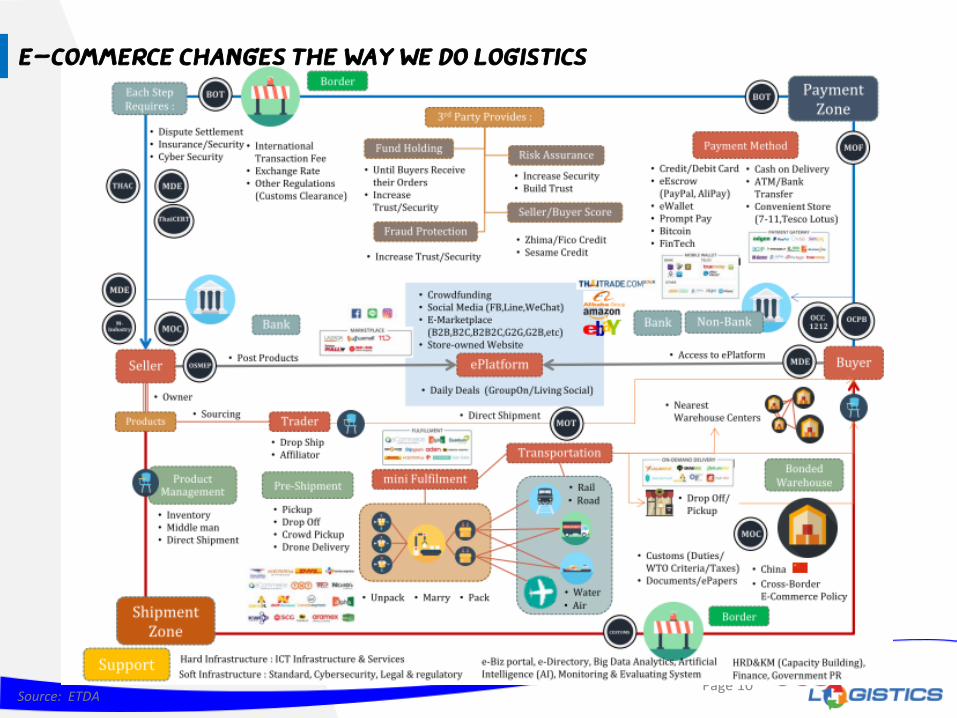
Page 10 Source: ETDA
E-commerce changes the way we do logistics
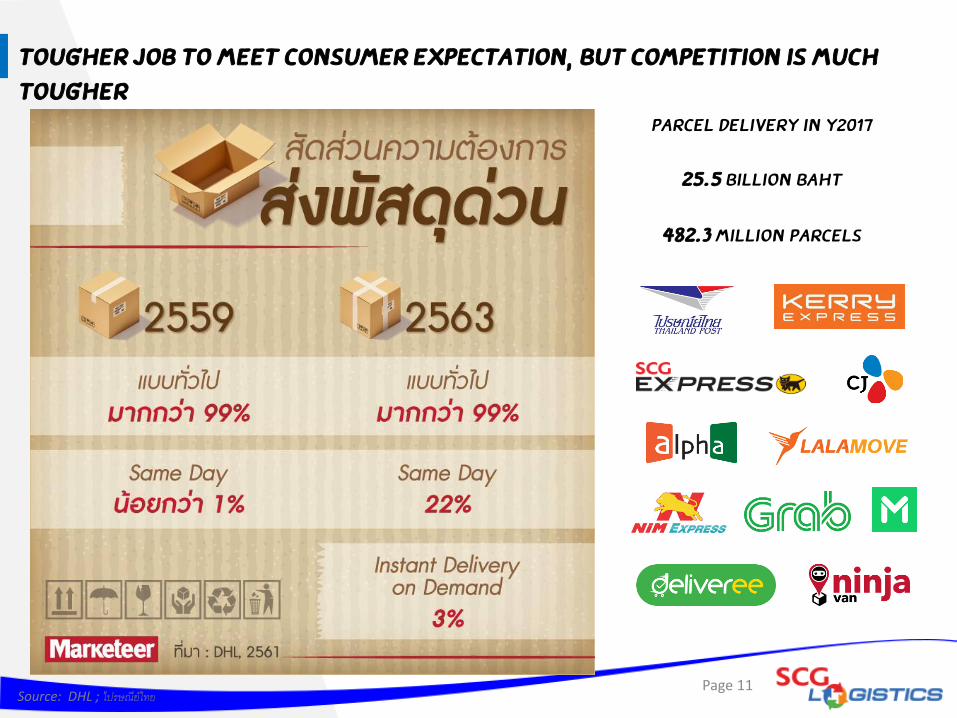
Tougher job to meet consumer expectation, but competition is much
tougher
Page 11 Source: DHL ; ไปรษณีย์ไทย
Parcel delivery in Y2017
25.5 billion baht
482.3 million parcels

Fulfillment emerges to facilitate online sellers
Page 12 Source: https://www.shipninja.io/ship-ninja-blog/2018/4/4/how-to-evaluate-a-fulfilment-centre-to-help-your-ecommerce-store ;
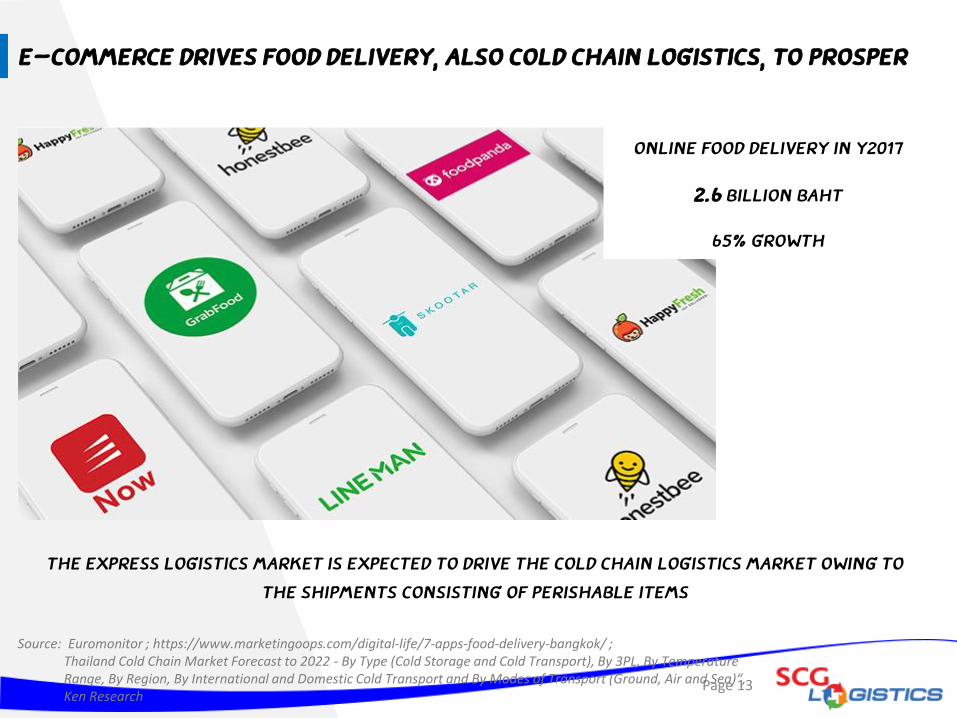
E-Commerce drives food delivery, also cold chain logistics, to prosper
Page 13
Source: Euromonitor ; https://www.marketingoops.com/digital-life/7-apps-food-delivery-bangkok/ ; Thailand Cold Chain Market Forecast to 2022 - By Type (Cold Storage and Cold Transport), By 3PL, By Temperature Range, By Region, By International and Domestic Cold Transport and By Modes of Transport (Ground, Air and Sea)“, Ken Research
Online food delivery in Y2017
2.6 billion baht
65% growth
The express logistics market is expected to drive the cold chain logistics market owing to
the shipments consisting of perishable items
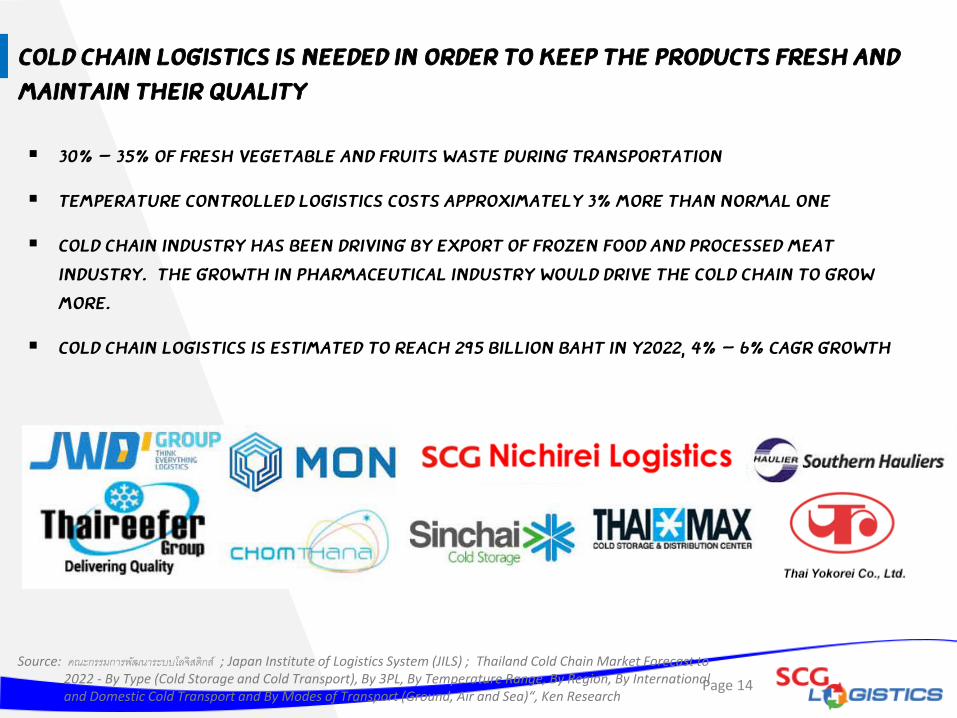
Cold Chain logistics is needed in order to keep the products fresh and
maintain their quality
Page 14
Source: คณะกรรมการพฒันาระบบโลจิสติกส์ ; Japan Institute of Logistics System (JILS) ; Thailand Cold Chain Market Forecast to 2022 - By Type (Cold Storage and Cold Transport), By 3PL, By Temperature Range, By Region, By International and Domestic Cold Transport and By Modes of Transport (Ground, Air and Sea)“, Ken Research
30% - 35% of fresh vegetable and fruits waste during transportation
Temperature controlled logistics costs approximately 3% more than normal one
Cold chain industry has been driving by export of frozen food and processed meat
industry. The growth in pharmaceutical industry would drive the cold chain to grow
more.
Cold Chain logistics is estimated to reach 295 billion baht in Y2022, 4% - 6% CAGR growth