the local group on fire: dwarf galaxy populations across a
TRANSCRIPT

MNRAS 000, 1–19 (2018) Preprint 13 June 2018 Compiled using MNRAS LATEX style file v3.0
The Local Group on FIRE: Dwarf galaxy populations across a suiteof hydrodynamic simulationsShea Garrison-Kimmel?†1, Philip F. Hopkins1, Andrew Wetzel‡1,2,3, James S. Bullock4,Michael Boylan-Kolchin5, Dušan Kereš6, Claude-André Faucher-Giguère7, Kareem El-Badry8, Astrid Lamberts1, Eliot Quataert8, Robyn Sanderson1
1TAPIR, Mailcode 350-17, California Institute of Technology, Pasadena, CA 91125, USA2The Observatories of the Carnegie Institution for Science, Pasadena, CA 91101, USA3Department of Physics, University of California, Davis, CA 95616, USA4Center for Cosmology, Department of Physics and Astronomy, University of California, Irvine, CA 92697, USA5Department of Astronomy, The University of Texas at Austin, 2515 Speedway, Stop C1400, Austin, TX 78712, USA6Department of Physics, Center for Astrophysics and Space Science, University of California at San Diego, 9500 Gilman Drive, La Jolla, CA 920937Department of Physics and Astronomy and CIERA, Northwestern University, 2145 Sheridan Road, Evanston, IL 60208, USA8Department of Astronomy and Theoretical Astrophysics Center, University of California Berkeley, Berkeley, CA 94720
Accepted XXX. Received YYY; in original form ZZZ
ABSTRACT
We present a new set of high-resolution hydrodynamic cosmological zoom-in simulationsthat apply the Feedback In Realistic Environments (FIRE) physics to both Local Group (LG)-like and isolated Milky Way (MW)-like volumes (ten host systems in total with baryonic par-ticle mass' 3,500−7,000M). We study the stellar mass functions, circular velocity or massprofiles, and velocity dispersions of the dwarf galaxy populations. The simulations reproducethe stellar mass function and central densities of MW satellite dwarfs for M∗ ≥ 105.5 M andpredict the existence of ∼ 3 unidentified galaxies with M∗ ∼ 105 M within 300 kpc of theMW. Overall, we find no evidence for the classical missing satellites or too-big-to-fail (TBTF)problems for satellite galaxies in our sample. Among the satellites, TBTF is resolved primar-ily by subhalo disruption and overall mass loss; central density profiles of subhalos are ofsecondary importance. For non-satellite galaxies, our LG-like simulations predict as many as∼ 10 as-of-yet unseen galaxies at distances 0.3 − 1Mpc from both hosts, with M∗ ' 105−6 M(in halos with Vmax ∼ 20 km s−1), albeit with large halo-to-halo variance. None of our simula-tions produces a compact, baryon-dominated, high-density dwarf elliptical-type galaxy (withVcirc & 35 km s−1 at r < 1kpc), of which six may appear in the LG (but none in the MW).It may therefore remain a challenge to reproduce the full diversity of the dwarf population,including both the highest and lowest density systems.
Key words: galaxies: dwarf – galaxies: Local Group – galaxies: formation – cosmology:theory
1 INTRODUCTION
Our location within the Local Group (LG) affords it a uniqueimportance in astronomy. It remains the only part of the Uni-verse where we can detect tiny dwarf galaxies (stellar massM∗ . 106M), let alone use resolved stellar observations to studytheir internal properties and kinematics. As the most dark matter-dominated galaxies in the Universe (e.g. McConnachie 2012), thesedwarf galaxies provide crucial tests of the standard structure for-mation paradigm, cold dark matter with a cosmological constant
? [email protected]† Einstein Fellow‡ Caltech-Carnegie Fellow
(ΛCDM), and may ultimately indirectly reveal the nature of DMitself (e.g. Ackermann et al. 2015).
While ΛCDM reproduces large-scale observations extraordi-narily well (e.g. Springel et al. 2005), explaining the dwarf galaxypopulation within the ΛCDM framework has historically provendifficult (see Bullock & Boylan-Kolchin 2017 for a recent review).Perhaps most famously, the “missing satellites” problem (MSP;Moore et al. 1999; Klypin et al. 1999) points out that dark matter-only (DMO) simulations of MW-mass hosts in ΛCDM predict or-ders of magnitude more bound subhalos within ∼ 300 kpc thanknown luminous satellites of the MW. While the MSP is usuallyaccounted for by a combination of photoionization during reion-ization (Bullock et al. 2000; Somerville 2002), observational biasand incompleteness (e.g. Tollerud et al. 2008), and subhalo de-
c© 2018 The Authors
arX
iv:1
806.
0414
3v1
[as
tro-
ph.G
A]
11
Jun
2018

2 S. Garrison-Kimmel et al.
struction due to the MW disk (D’Onghia et al. 2010; Sawala et al.2017; Garrison-Kimmel et al. 2017b), these solutions typically re-solve the disparity by placing the known MW satellites in thelargest subhalos predicted around MW-mass hosts and leaving thesmallest clumps undetected or entirely dark. This picture is furthersupported by the success of applying extrapolations of the abun-dance matching paradigm, which successfully reproduces large-scale clustering statistics by assuming a relatively tight relationshipbetween halo mass Mhalo and M∗, to the LG environment (Garrison-Kimmel et al. 2014a).
However, the too-big-to-fail (TBTF) problem notes that thecircular velocity profiles of the largest subhalos in DMO simu-lations of MW-mass galaxies (i.e. the subhalos assumed to hostthe luminous satellites) are incompatible with observational con-straints on the MW dwarf satellites (Boylan-Kolchin et al. 2011,2012). A similar discrepancy exists when comparing with the satel-lite galaxies of M31 (Tollerud et al. 2014) or the dwarf galaxiesin the Local Field (defined here as within 1 Mpc of the MW orM31, but more than 300 kpc from both; Garrison-Kimmel et al.2014b), and TBTF even appears to exist beyond the LG entirely(Papastergis et al. 2015; Papastergis & Shankar 2016): dwarf galax-ies (M∗ ∼ 105−7M) have less mass within ∼ 250 pc − 1 kpc thanDMO simulations of the halos expected to host those galaxies pre-dict.
Recent simulations have begun to jointly resolve the MSP1
and TBTF by more realistically modeling gas cooling, star for-mation, and stellar/supernovae feedback. For example, Brooks &Zolotov (2014), using simulations from Zolotov et al. (2012),demonstrated a reduction in the peak circular velocity of the halosassociated with TBTF due to a combination of supernovae feedback(modeled via the “blastwave” scheme of Stinson et al. 2006) andtidal disruption, such that their simulations were free of both TBTFand the MSP. More recently, Dutton et al. (2016) and Buck et al.(2018) showed that the NIHAO simulation suite, which also adoptsthe blastwave scheme, is similarly free of the MSP and TBTF.
The conclusion that TBTF and the MSP can be explained viabaryonic physics, even using non-blastwave feedback implementa-tions, is growing increasingly robust. The APOSTLE simulations(Fattahi et al. 2016; Sawala et al. 2016b), for example, apply theEAGLE models for galaxy formation, which are tuned to reproducethe stellar mass function and sizes of galaxies at z = 0.1 (Crain et al.2015; Schaye et al. 2015), to 12 LG-like volumes,2 demonstrat-ing that extrapolations of models that match the statistics of largergalaxies can also duplicate the LG. The APOSTLE dwarf galaxypopulations generally do not exhibit the MSP: the simulated vol-umes contain a similar number of galaxies with M∗ ≥ 105M asthe actual MW, M31, and LG. Moreover, the mass function of sub-halos that host the luminous dwarf galaxies in APOSTLE (quanti-fied by Vmax, the peak of the circular velocity curve) agree with themass function implied by the Peñarrubia et al. (2008) estimates for
1 The Auriga simulations (Grand et al. 2017), high-resolution magneto-hydrodynamic zoom-ins focusing on isolated MW-mass galaxies, also re-produce the MW/M31 satellite luminosity functions down to 5× 10⁵M(Simpson et al. 2017), though to date there have been no analyses of theinternal structure of those satellites.2 The APOSTLE simulations follow in the spiritual footsteps of theCLUES (Constrained Local UniversE Simulations) project (e.g. Gottloe-ber et al. 2010) in targeting LG-like pairs in hydrodynamic, cosmologi-cal zoom-in simulations. The CLUES simulations, however, constrain the∼ 5 h−1 Mpc environment around the targeted hosts to match that of theactual LG.
the MW dwarf spheroidals (dSphs), implying that the APOSTLEhosts are also free of the TBTF problem.
In an alternative approach, Wetzel et al. (2016) used the Feed-back In Realistic Environments (FIRE; Hopkins et al. 2014, 2017)3
physics to simulate an isolated MW-mass galaxy with high enoughresolution to capture the internal dynamics of the classical satel-lites. FIRE includes explicit models for star formation and stel-lar/supernovae feedback that self-consistently yield bursty star for-mation in dwarf galaxies (Muratov et al. 2015; Sparre et al. 2017;Faucher-Giguère 2018; El-Badry et al. 2016) and overall agreementwith a variety of galaxy-scale observables, including the star forma-tion histories of dwarf galaxies (Oñorbe et al. 2015; Wetzel et al.2016; Fitts et al. 2017); the mass–metallicity (Ma et al. 2016), stel-lar mass–halo mass (Hopkins et al. 2014, 2017), and stellar mass–star formation rate (Sparre et al. 2017) relationships; and the frac-tion of the stellar mass in the halos of MW-mass galaxies (Sander-son et al. 2017). Wetzel et al. (2016) showed that FIRE also yieldsa reasonable MW satellite population: the set of simulated dwarfgalaxies falls roughly midway between that of the MW and M31when counting galaxies either by M∗ or by the line-of-sight stellarvelocity dispersion σ∗, the observable relevant to TBTF.
These works, however, have suffered from limitations. Whilethe hosts in the APOSTLE simulations are carefully selected tomatch the LG environment, the majority of the APOSTLE re-sults are drawn from their ‘L2’ simulations with baryonic particlemasses ∼ 105M, approaching the total mass of the smaller clas-sical dwarf galaxies. In addition, the effective equation of state andthe spatial/density resolution used in the APOSTLE simulations issuch that the smallest resolvable Jeans/Toomre mass is > 108M;therefore, clouds in lower mass galaxies cannot be self-consistentlyresolved. The simulations in Zolotov et al. (2012) and Buck et al.(2018) similarly have baryonic particle masses > 20,000 M, withthe highest resolutions reached at lower halo masses∼ 8×10¹¹M.Wetzel et al. (2016) reached higher resolutions and used a morephysical subgrid model for star formation and feedback, but theirresults are based on a single simulation of an isolated host, ratherthan an LG-like environment.
Here we introduce the first in a set of simulations that applythe FIRE physics to LG-like volumes at state-of-the-art resolution.We present two simulated LG-like pairs (containing 4 MW-massanalogues), along with six isolated MW-mass galaxies for compar-ison. Our simulations generally reproduce the observed propertiesof dwarf galaxies in the LG: they do not suffer from either the miss-ing satellites problem or TBTF when including baryonic physics.
This paper is organized as follows. In § 2, we describe the sim-ulations and briefly review the star formation and feedback models.§ 3 details our methods for compiling our observed and simulatedgalaxy catalogs. § 4 presents the stellar mass functions of our simu-lated hosts, counting both satellites and non-satellites. § 5 then ex-amines the internal structure of our simulated dwarfs by comparingtheir central masses to those implied by observations via circularvelocity curves. § 6 presents the relationships between stellar kine-matics, stellar mass, and halo mass. We summarize our results andconclusions in § 7.
MNRAS 000, 1–19 (2018)

The Local Group on FIRE 3
Figure 1. Visualizations of our simulated hosts and their environments. The face-on pseudo-color images are 40 kpc across; the edge-on images span 30 kpcwith a height of 15 kpc. The density maps show the highest 3D density along a given line-of-sight through a cube 2 Mpc on a side, centered on the mid-pointof the pair. All of the maps adopt logarithmic color scales; the stellar maps range from 10−9–3× 10⁻² M pc−3, the dark matter from 10−8–1 M pc−3, andthe gas from 10−8–100 M pc−3. Circles around the hosts indicate a radius of 300 kpc; the more massive host halo is on the right and is indicated by a dashedcircle. The massive galaxy on the outskirts of Thelma & Louise (with Mvir = 4.5×10¹¹M, M∗(< 20 kpc) = 1.58×10¹⁰M) is > 1 Mpc from both hosts,excluding it from the analyses that follow.
MNRAS 000, 1–19 (2018)

4 S. Garrison-Kimmel et al.
Host Mvir M∗(< 20 kpc) rcontam Ncontam NMF, MW[1012M] [1010M] [kpc] (< 1 Mpc) (DMO)
Paired hostsM31 1.7±0.3a 10.3+2.3 b
−1.7 — — —Milky Way 1.3±0.3c 5±1c — — —Romeo 1.24 7.37 514 4 10 (7)Juliet 1.01 4.22 1196 0 15 (8)Thelma 1.32 7.92 1215 0 10 (6)Louise 1.03 2.86 894 0 8 (4)
Isolated hostsm12b 1.31 9.42 728 0 9 (6)m12c 1.26 6.44 1247 0 14 (2)m12f 1.54 8.79 1110 0 8 (5)m12i 1.07 7.00 542 6 13 (9)m12m 1.45 12.62 671 3 15 (9)m12z 0.80 2.24 445 4 7 (5)
a Diaz et al. (2014) b Sick et al. (2015) c Bland-Hawthorn & Gerhard (2016)
Table 1. Basic properties of our host halos: virial mass (Mvir, using theBryan & Norman 1998 definition), stellar mass of the central galaxy (M∗(<20 kpc)), distance to the nearest low resolution particle (rcontam), the num-ber of halos within 1 Mpc with Vmax ≥ 10 km s−1 that are excluded dueto contamination from low resolution particles (Ncontam), and the numberof massive failures identified when comparing subhalos in the correspond-ing DMO simulations with the MW dSphs (unaccounted for subhalos withVmax = 25 − 40 km s−1; see § 5 for details); “strong” massive failures aregiven in parentheses. We caution that estimates for the virial masses ofthe MW and M31 frequently vary at the factor of & 2 level (e.g. Kafleet al. 2018; Patel et al. 2018). Though we do not list it, the total fractionalmass contamination within 1 Mpc by low resolution particles is, at worst,3.6× 10−4 around m12i. Initial baryonic particle masses are 3,523 Min Romeo & Juliet, 3,990 M in Thelma & Louise, 4,174 M inm12z, and 7,067 M in the remaining simulations.
2 SIMULATIONS
We analyze hydrodynamic, cosmological zoom-in (Katz & White1993; Oñorbe et al. 2014) simulations, initialized with MUSIC(Hahn & Abel 2011), from the FIRE project (Hopkins et al. 2014),run using the improved “FIRE-2” version of the code from Hopkinset al. (2017). All of the simulations were run using GIZMO (Hop-kins 2015),4 a multi-method gravity plus hydrodynamics code,in meshless finite-mass (“MFM”) mode. This is a mesh-free La-grangian finite-volume Godunov method which automatically pro-vides adaptive spatial resolution while maintaining conservationof mass, energy, and momentum (for extensive tests, see Hopkins2015). Gravity is solved with an improved version of the Tree-PM solver from GADGET-3 (Springel 2005), with fully-adaptive(and fully-conservative) gravitational force softenings for gas (sohydrodynamic and force softenings are always self-consistentlymatched), following Price & Monaghan (2007).
The FIRE physics and source code are nearly identical to thosein previous FIRE-2 simulations, with the lone exception that all ofour simulations additionally include subgrid turbulent metal dif-fusion, which produces more realistic metallicity distributions indwarf galaxies (Escala et al. 2018) but does not alter other galaxy-wide properties (Hopkins 2017; Su et al. 2017). The FIRE physicsmodules are described in detail in the papers above, but in brief,
3 http://fire.northwestern.edu4 http://www.tapir.caltech.edu/~phopkins/Site/GIZMO.html
we treat radiative heating and cooling from 10 − 1010 K, allow forstar formation only in gas that is dense (n > 1000 cm−3), Jeans un-stable, molecular and self-shielding (Krumholz & Gnedin 2011),and self-gravitating (Hopkins et al. 2013). We then include stellarfeedback via radiation pressure, Types Ia and II supernovae, metalmass loss, and photo-ionization and photo-electric heating, assum-ing every star particle represents a single stellar population with aKroupa (2001) IMF.
We focus on two pairs of LG-like hosts, Romeo & Julietand Thelma & Louise, which are visualized at z = 0 in Figure 1.We refer to these simulations (and additional ongoing work) asthe “ELVIS on FIRE” set. The Thelma & Louise volume wasfirst presented as a DMO simulation as part of the original Ex-ploring the Local Volume In Simulations (ELVIS) suite (Garrison-Kimmel et al. 2014a). Both Thelma & Louise and Romeo &Juliet were also presented at lower resolution and without sub-grid metal diffusion in Garrison-Kimmel et al. (2017a). We alsoinclude the results of six simulations targeting isolated MW-masshalos; all of these galaxies were also analyzed in Garrison-Kimmelet al. (2017a), but here we present higher resolution resimula-tions of m12b, m12c, and m12z that additionally include subgridmetal diffusion. m12b–m12m are part of the “Latte Suite,” a setof hosts homogeneously selected to be isolated and roughly thesame mass as the MW: M200m = 1 − 2×10¹²M. m12i, in particu-lar, uses the same initial conditions as the halo presented in Wetzelet al. (2016), originally taken from the AGORA project (Kim et al.2014). The hosts in the Latte Suite were all simulated with iden-tical resolutions: initial baryonic particle masses mb = 7,067M.Because the LG-like pairs were drawn from different box sizes andslightly different cosmologies,5 they feature ∼ 2× better resolu-tions (Romeo & Juliet has mb = 3,523M; Thelma & Louisehas mb = 3,990M). Finally, m12z was also chosen from a sepa-rate parent box to be slightly lower mass, and is also at slightlyhigher resolution than the remainder of the isolated sample withmb = 4,174M. All simulations were run with gas softening lengthsthat are fully adaptive down to εgas
min ' 0.5−1 pc and DM force soft-enings ' 50 pc.
The two central galaxies in Romeo & Juliet are separatedby 839 kpc, are approaching one another with vrad = −93 km s−1,and have a tangential velocity of vtan = 23 km s−1. Thelma andLouise are separated by 920 kpc, have vrad = −107 km s−1, andvtan = 14 km s−1. For comparison, the MW and M31 are separatedby 787 kpc (McConnachie et al. 2005) and are approaching oneanother with vrad = −109 km s−1 and vtan = 17±17 km s−1 (van derMarel et al. 2012, though see Salomon et al. 2016 and Carlesi et al.2016). Both pairs were selected for these high resolution simula-tions on the basis of their low tangential velocities and relative lackof (partial) overlap in their Lagrange volumes with other massivehalos outside the LG. We do not constrain or restrict the larger-scaledensity fields around the LG hosts; i.e. we do not necessarily ex-pect to reproduce the∼ 5 Mpc-scale “Local Sheet” (McCall 2014).Table 1 presents additional information about the individual hosts,including the distance to the nearest low-resolution particle rcontam
and the number of halos within 1 Mpc excluded from our analysisdue to contamination from these particles.
5 All of our simulations assume flat ΛCDM cosmologies with h = 0.68 −
0.71, Ωm = 0.266 − 0.31, Ωb = 0.0455 − 0.048, and σ8 = 0.801 − 0.82 (e.g.Larson et al. 2011; Planck Collaboration et al. 2016). These slight differ-ences in cosmology should have a negligible impact on the scale of the LG(e.g. Garrison-Kimmel et al. 2014c).
MNRAS 000, 1–19 (2018)

The Local Group on FIRE 5
3 GALAXY CATALOGS
In this section, we briefly discuss the observational sources weuse for the properties of dwarf galaxies in the LG, along with ourmethod for extracting the equivalent properties for dwarf galaxiesfrom the simulations.
3.1 Observations
We build our observational sample primarily off the data compiledin an updated version of the McConnachie (2012) catalog of lo-cal dwarf galaxies. We exclude all “starred” systems in the cata-log, for which debate remains about their true nature (i.e. galaxyvs. globular cluster); the majority of these are much less massivethan our resolution. We take stellar mass-to-light ratios from Wooet al. (2008) where available, and otherwise assume M∗/LV = 1.6(consistent with Martin et al. 2008b and extrapolations of Bell &de Jong 2001). We calculate V1/2 = Vcirc(R1/2), the implied circularvelocity at the 3D (deprojected) half-light radius, for the majorityof our galaxies with the Wolf et al. (2010) formula, i.e. based onthe velocity dispersion of the stars. For the MW dSphs, we use thevelocity dispersions presented in Wolf et al. (2010). For the satel-lites of M31, we take R1/2 and V1/2 from Tollerud et al. (2014). Themajority of these are based on stellar velocity dispersions, but thereare a few exceptions. Most notably, the constraint on M33 onlyrepresents the mass of the dark matter halo, taken from a fit to COand HI observations (Simon et al. 2006, using data from Corbelli& Salucci 2000 and Corbelli 2003); including the baryonic com-ponent roughly doubles V1/2. We adopt the total mass estimates(i.e. including baryons) for the remaining M31 satellites, includ-ing those that are baryon dominated within R1/2. For NGC 185 andNGC 147, these are based upon the dynamical modeling of Gehaet al. (2010), while the constraint on IC 10 is derived from HI ob-servations (Wilcots & Miller 1998). Finally, for the Local Field,we adopt the values (R1/2, V1/2, and σ∗) calculated or compiledin Kirby et al. (2014) where possible, though we adopt the mod-ified V1/2 values presented in Garrison-Kimmel et al. (2014b) forthe three galaxies that display evidence of rotation: for the dwarfgalaxy WLM, we use the result calculated in detail by Leaman et al.(2012), while we use the method of Weiner et al. (2006, and alsosee Kirby et al. 2014) to incorporate rotational support into our es-timates for Pegasus and Tucana. For all other systems, we fall backon the measurements in McConnachie (2012). We list the proper-ties of the full sample in Appendix A.
3.2 Simulations
Because publicly-available halo finders are typically tuned to cap-ture DM (sub)halos, we find unsatisfactory performance when at-tempting to capture the much more compact stellar clumps (par-ticularly when those clumps are embedded within the stellar haloof a larger host; see Figure 1). We therefore compile our simulatedgalaxy catalogs via a multi-step process. We first identify boundDM halos by running AHF (Knollmann & Knebe 2011) only onthe DM particles. We then assign star particles in a first pass toDM clumps via a generous cut on stellar positions and velocitiesalong the direction of motion of the (sub)halo. In a second pass,stars are iteratively removed based on their velocities relative tothe velocity dispersion of the system until the latter stabilizes. Wethen examine each galaxy by hand and repeat the final step witha small maximum radius if necessary. Finally, we iteratively com-pute stellar velocity dispersions independently along the x, y, and z
axes, eliminating stars offset by more than 5σ from the mean untilthe dispersion along each axis changes by less than 2.5%; this steptypically alters particle counts at the percent level. However, thisstep is important for velocity dispersions because contaminationby even a single background halo star, with high relative velocityto the satellite, can significantly bias properties such as the radiusor velocity dispersion of the satellites. We define M∗ as the sumof the masses of all the star particles that remain assigned to eachgalaxy in this way and σ∗ as the RMS average of the x, y, and z,velocity dispersions of those particles (calculated via the interquar-tile spacing). Finally, we recompute Vmax and Rmax, the radius atwhich Vmax occurs, using all particles around each host; this step isunimportant for low mass galaxies, but matters in the higher stellarmass dwarfs where the star particles are a non-negligible fractionof the mass within Rmax.6 We compute all properties and profilesrelative to a halo/galaxy center defined using a “shrinking spheres”approach on the stars (Power et al. 2003). Though there is no ex-plicit requirement at any step that star particles assigned to a givengalaxy be bound to the associated halo, our final velocity distribu-tions suggest this is typically the case.
Our approach is similar to Wetzel et al. (2016), but we baseour galaxy catalogs on AHF halo catalogs (rather than rockstar;Behroozi et al. 2013) and the cuts placed on stellar particles varyslightly; most notably, Wetzel et al. (2016) did not include eitherour initial cut based on the motion along the direction of the sub-halo or our final cut while computing velocity dispersions. More-over, we quote total line-of-sight velocity dispersions, whereasWetzel et al. (2016) computed total velocity dispersions at the half-mass radius. Our results are similar: for example, we find an iden-tical number of galaxies with M∗ ≥ 105M when applying ourmethod to m12i as Wetzel et al. (2016) identify in the same halo(simulated without metal diffusion).
In the figures that follow, we plot stellar mass functions downto M∗ = 7×10⁴M, corresponding to approximately 10 star parti-cles in the lower resolution Latte simulations. While the existenceand stellar masses of galaxies above this cut is robust, the internalproperties, such as density or velocity dispersion, are more sensi-tive to resolution and may change with higher resolution simula-tions (Hopkins et al. 2017). We therefore adopt a slightly highercut, M∗ = 105M, corresponding to 14 − 29 star particles, whenquoting galaxy counts or investigating internal structure.
4 STELLAR MASS FUNCTIONS
Figure 2 presents the stellar mass functions (SMFs) of dwarf galax-ies throughout the Local Volume. As expected from Garrison-Kimmel et al. (2014a), the satellite SMFs (host distance rhost <300 kpc) of the isolated and paired halos overlap well. Our ten hostscontain between 12 and 20 satellites with M∗≥ 105M, with a 66%scatter of 6.1 galaxies. For comparison, the scatter in the numberof subhalos around the DMO ELVIS hosts (Garrison-Kimmel et al.2014a) above an equivalent peak halo mass (using the zero-scatterstellar mass vs. peak halo mass relationship from that work) is 20.5.However, the host masses from ELVIS also vary more widely thanthe sample presented here: the DMO ELVIS host masses have a66% scatter of 1.25× 10¹²M, while that of our sample is only
6 In cases where the circular velocity curve has no peak/turnover, we in-stead adopt the inflection point of the curve, i.e. the radius/circular velocitywhere the curve becomes convex due to the contribution from a backgroundhost halo, as Rmax and Vmax.
MNRAS 000, 1–19 (2018)

6 S. Garrison-Kimmel et al.
105 106 107 108 109
M [M ]
1
2
3
5
10
20
35
N(>
M)
Satellites: r < 300 kpc
AndromedaMilky Way
105 106 107 108 109
M [M ]
1
2
3
5
10
15
25
N(>
M)
Non-satellites:r = 300 kpc 1 Mpc,
rother > 300 kpc
105 106 107 108
M [M ]
1
2
3
5
10
20
35
N(>
M)
Local Field:reither < 1 Mpcrboth > 300 kpc
&&
Local Group
Figure 2. Galaxy stellar mass functions. The panels indicate the satellite population (left; host distance rhost < 300 kpc), the non-satellite population aroundeach host (center; rhost = 300 − 1000 kpc, and distance to the paired host rother > 300 kpc where applicable), and (right) the Local Field (distance from eitherhost reither < 1 Mpc but distance from both hosts rboth > 300 kpc). Thin lines indicate the isolated m12 sample, which are sorted in the legend by hostvirial mass. The satellite stellar mass functions are broadly consistent with that of the MW and M31, though even our richest satellite populations slightly(by a factor of ∼ 1.2 at 105M) under-produces that of M31, possibly because our highest mass host is only 1.45× 10¹²M. Similarly, the non-satellitepopulations around each host are in reasonable agreement with that of the MW and M31, with considerable scatter. The simulated Local Field populationsare also generally consistent with observations, particularly for M∗ & 5× 10⁵M; below that, Romeo & Juliet displays a steep upturn relative the LG.Thelma & Louise, meanwhile, slightly overproduces the Local Field SMF at all masses. We predict a median of 2.5 additional (i.e. undetected) non-satellitegalaxies with M∗ ≥ 105M and rMW = 300 − 1000 kpc, along with 4 additional MW satellites with M∗ = 105 − 3×10⁵M.
0.37×10¹²M. Naively scaling the two values by one another (i.e.scatter in Nsats(M ≥ 105M)/ scatter in host Mvir) yields nearlyidentical values, such that our results are consistent with the FIREsimulations predicting the same degree of scatter in the number ofluminous satellites as DMO simulations.
The FIRE satellite populations also provide a good matchto the MW satellite SMF, particularly below the masses of theLMC and SMC,7 though the agreement is not perfect: the simu-lated galaxies host a median of 15.5 satellites with M∗ ≥ 105M,compared with the 12 such known MW satellites, and we typicallypredict a SMF that continues to rise between the relatively brightclassical dSphs (M∗ & 3× 10⁵M) and the ultra-faints dwarfs(M∗ . 3×10⁴M) identified in deep surveys such as SEGUE (Be-lokurov et al. 2009) and DES (Drlica-Wagner et al. 2015). The dif-ference is small relative to the order-of-magnitude difference re-ferred to by the missing satellites problem – we predict a median of4 satellites with M∗ = 105
− 3× 10⁵M – but it may suggest addi-tional, relatively luminous, undetected satellites (also see Tollerudet al. 2008). Rather than a sign of observational incompleteness, theflattening of the MW SMF may instead reflect a feature from reion-ization (see Bose et al. 2018); if so, our simulations do not capturesuch a feature overall.
In contrast to the relative agreement with the MW SMF, allof the simulated satellite SMFs lie slightly below that of M31. Ourhosts have, on average, 54% as many satellites with M∗ ≥ 105Mas are already known around M31. The offset in the mean countsrelative to M31 is roughly constant for M∗ . 107M (at whichpoint the mean difference becomes even larger), indicating thatM31 contains systematically more satellites at fixed stellar massthan our simulated hosts. For comparison, the mean offset between
7 The worse agreement at the high-mass end is not particularly unexpected:none of our hosts were selected to contain an LMC-mass satellite, and a ran-domly selected MW/M31-mass halo is statistically unlikely to have LMCor M33-mass satellites (Busha et al. 2011; Tollerud et al. 2011).
the simulated satellite populations and that of the MW is ∼ 2% atthe mass of CVnI (3× 10⁵M) and remains under 20% over twoorders of magnitude (up to the mass of Fornax, 2.4×10⁷M). Thedifference in satellite counts is clear, but not extreme: our host withthe largest number of satellites (m12m, with Mvir = 1.45×10¹²M)contains 73% as many galaxies above 105M with an average of74% from 105 – 3× 10⁷. As we show in Appendix B, this resultis only marginally sensitive to the radial cut used to separate satel-lites from non-satellites. It is also qualitatively independent of theassumed mass-to-light ratio for the observed dwarf galaxies: evenadopting a stellar mass-to-light ratio of unity for the galaxies not in-cluded in Woo et al. (2008) yields a mean of 61% as many satellitesas M31 with M∗ = 105M.
The abundance of dwarf galaxies around M31 (relative bothto the MW and to our simulated hosts) may point towards a higherM31 halo mass. Large-scale estimates for the mass of M31 typ-ically suggest Mvir,M31 & 1.5× 10¹²M; for example, Diaz et al.2014 used the net momentum of the LG to estimate Mvir,M31 =1.7± 0.3× 10¹²M. However, Kafle et al. (2018) recently arguedfor Mvir,M31 = 0.8± 0.1× 10¹²M by applying a Bayesian frame-work to high-velocity planetary nebulae. Figure 3 shows the num-ber of dwarf galaxies near each host, as a function of host virialmass. Though the trends with mass are weak (e.g. our lowest masshost contains the fifth most satellites), our results suggest that it isdifficult to match both the SMF of the MW and of M31 without ahigher virial mass for M31.
Broadly speaking, the non-satellite SMFs in Figure 2 (rhost =300 − 1000 kpc, and excluding satellites of the paired host if ap-plicable) generally agree with counts in the fields around theMW/M31. However, there are again hints of undetected galaxieswith M∗ & 105M: we predict a median of 14.5 galaxies withM∗ ≥ 105M, compared to the 12 known around the MW. Fur-thermore, increasing the mass of our M31 analogue may resultin even more predicted dwarfs; our predictions in the Local Fieldmay be a lower limit. If ultra-diffuse galaxies (UDGs) are preva-lent in the field (as predicted by Di Cintio et al. 2017 and Chan
MNRAS 000, 1–19 (2018)

The Local Group on FIRE 7
0.8 1 1.2 1.4 1.6 1.8 2Mvir [1012M ]
10
15
20
25
30
35
Num
bero
fsate
llites
with
M10
5 M
MW
M31
Figure 3. The number of dwarf galaxies with M∗ ≥ 105M within 300 kpc(lower points) and 400 kpc (upper points) of each host, as a function of hostvirial mass. Colors are identical to Figure 2, with the lower mass host in theLG-like pairs plotted as open points. Counts around M31 and the MW arealso plotted, with mass estimates taken from Diaz et al. (2014) and Bland-Hawthorn & Gerhard (2016), respectively. Both the MW and Louise havezero satellites with M∗ ≥ 105M between 300 − 400 kpc (Samuel et al., inpreparation), and therefore have only a single value plotted.
et al. 2017), with central surface brightnesses 24 − 26 magarcsec−2
(van Dokkum et al. 2015), then some of this incompleteness mayeven arise at M∗∼ 107M. Surprisingly (as Garrison-Kimmel et al.2014a predict 75% more halos above fixed Vmax in DMO halocounts), there is no clear offset in the Local Field SMFs between theisolated and paired hosts, though all of the latter except Louiseare on the upper edge of the distribution. However, our statistics re-main relatively small, and we require a larger, mass-selected sampleto make strong statements regarding the efficiency of galaxy for-mation in dwarfs within∼ 1 Mpc of an LG-like pair vs. an isolatedMW-mass galaxy. We caution that the lines representing Romeoand Juliet (Thelma and Louise) are not completely indepen-dent, with the volumes probed overlapping by 42% (37%).
Finally, the right panel of Figure 2 plots the SMF of the “Lo-cal Field” (all non-satellite galaxies within 1 Mpc of either of thehosts). The observed Local Field SMF lies roughly in between ourtwo simulated LGs for M∗ & 5×10⁵M. Consistent with the cen-ter panel, some amount of observational incompleteness is possi-ble, and perhaps even likely, but more simulations are required:both the real Local Field and Thelma & Louise contain 5 non-satellite galaxies with M∗ = 105
−106M, while Romeo & Julietcontains 19. Thelma & Louise, however, does overproduce theobserved SMF at all masses, predicting a total of 18 galaxies withM∗ > 105M compared to the only 13 known in the LG. Howeverthe comparison with the field around our larger sample of isolatedhosts clearly demonstrates very large systematic halo-to-halo vari-ations in this prediction.
In Appendix B we consider the effects of a slightly larger (∼400kpc) radial cut used to assign satellites their hosts, and show
this does not qualitatively alter our conclusions above. However, itsomewhat decreases the tension with both M31 and the Local Fieldby re-assigning a few galaxies from the field to the M31-analogue.
5 TOO-BIG-TO-FAIL (TBTF)
Due to the resolution required to study the inner ∼ 500 pc of sim-ulated dwarf subhalos, TBTF was originally defined using DMOsimulations. Boylan-Kolchin et al. (2011) therefore focused on thedSph satellites of the MW. Because dSphs are dispersion supported,a measurement of σ∗ provides a robust estimate of V1/2. Moreover,the high dynamical mass-to-light ratios implied by σ∗ suggest thatdSphs are strongly DM-dominated, indicating that the estimates onV1/2 may be fairly compared to the subhalo masses provided byDMO simulations. Later work on TBTF that expanded beyond theMW satellites (e.g. Garrison-Kimmel et al. 2014b; Tollerud et al.2014) typically sought to recast observational measurements fornon-dispersion supported systems into similar constraints on V1/2,and either excluded or treated separately galaxies with significantbaryonic mass within R1/2 (for which V1/2 is not fairly comparableto the results of DMO simulations).
Approaches to TBTF using baryonic simulations have varied.For example, Sawala et al. (2016b) showed that the number of lu-minous subhalos in the APOSTLE simulations above a given Vmax
agree with estimates for the MW satellite population from Peñar-rubia et al. (2008). They then obtain separate Vmax estimates forthe MW satellites by matching them with dwarf galaxies in theirsimulations based on M∗, V1/2, and R1/2; the Vmax − M∗ relationshipimplied by these estimates is in good agreement with the simulatedrelationship. Wetzel et al. (2016), conversely, sought to comparedirectly with the data: they showed good agreement between thedwarf satellites of m12i and those of the MW/M31 when countinggalaxies by stellar velocity dispersion and when viewed in velocitydispersion – stellar mass space.
Here, we adopt a hybrid approach. We first demonstrate thatthe DMO simulations of our host halos suffer from TBTF by repro-ducing the Garrison-Kimmel et al. (2014b) analysis on the DMOsimulations, then show that the same analysis applied to the lumi-nous dwarf galaxies in the FIRE simulations yields no such dis-crepancy. Because direct comparisons with data are ideal, we willdemonstrate in § 6 that the simulated dwarfs also broadly repro-duce the observed relationship between stellar mass and stellar ve-locity dispersion. However, because we will compare our simulateddwarfs to non-satellite galaxies and to more massive systems, forwhich the assumption of dispersion-dominated kinematics is notwell-motivated, we begin by inspecting the central masses of oursimulated systems and their observational counterparts.
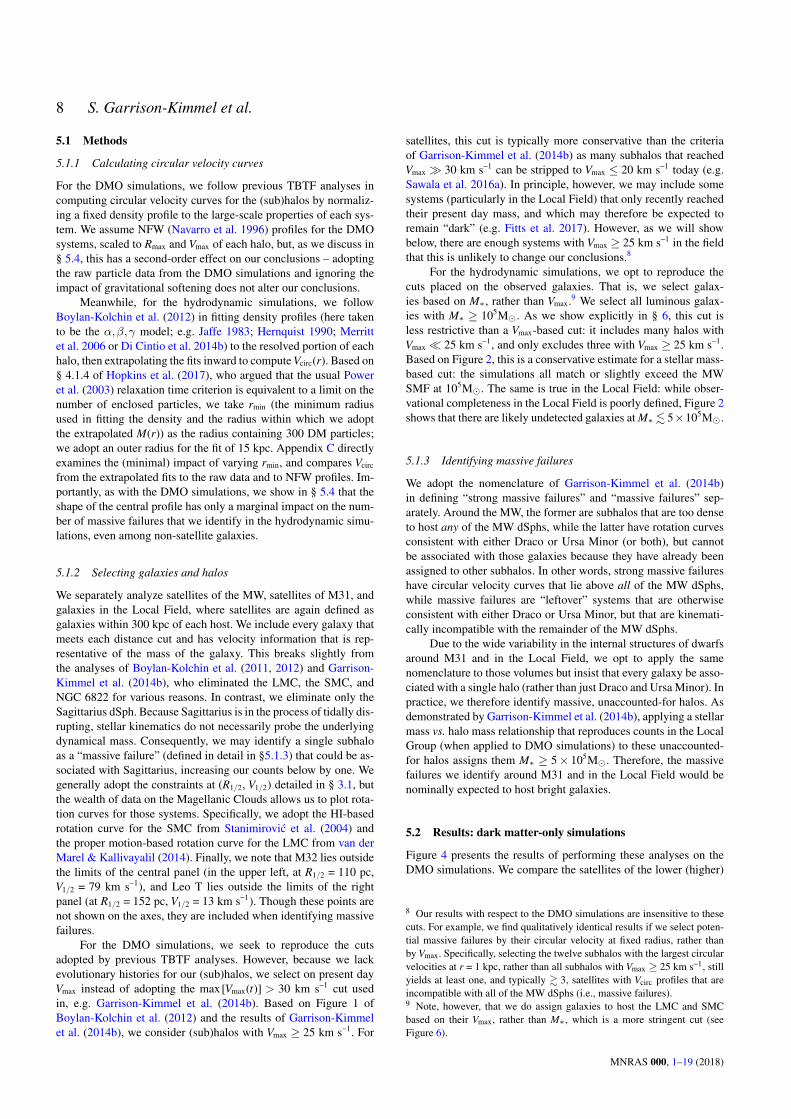
We therefore begin by generally replicating the analyses ofBoylan-Kolchin et al. (2012); Tollerud et al. (2012), and Garrison-Kimmel et al. (2014b), who identified problematic (sub)halos bycomparing the circular velocity curves of simulated systems withconstraints on observed dwarf galaxies. Before presenting the re-sults of this analysis, we first describe our methods for calculat-ing the rotation curves in the DMO and hydrodynamic simula-tions, then briefly review the galaxies included on each plot, andfinally summarize our nomenclature and methods for identifyingand counting the problematic (sub)halos.
MNRAS 000, 1–19 (2018)
8 S. Garrison-Kimmel et al.
5.1 Methods
5.1.1 Calculating circular velocity curves
For the DMO simulations, we follow previous TBTF analyses incomputing circular velocity curves for the (sub)halos by normaliz-ing a fixed density profile to the large-scale properties of each sys-tem. We assume NFW (Navarro et al. 1996) profiles for the DMOsystems, scaled to Rmax and Vmax of each halo, but, as we discuss in§ 5.4, this has a second-order effect on our conclusions – adoptingthe raw particle data from the DMO simulations and ignoring theimpact of gravitational softening does not alter our conclusions.
Meanwhile, for the hydrodynamic simulations, we followBoylan-Kolchin et al. (2012) in fitting density profiles (here takento be the α,β,γ model; e.g. Jaffe 1983; Hernquist 1990; Merrittet al. 2006 or Di Cintio et al. 2014b) to the resolved portion of eachhalo, then extrapolating the fits inward to compute Vcirc(r). Based on§ 4.1.4 of Hopkins et al. (2017), who argued that the usual Poweret al. (2003) relaxation time criterion is equivalent to a limit on thenumber of enclosed particles, we take rmin (the minimum radiusused in fitting the density and the radius within which we adoptthe extrapolated M(r)) as the radius containing 300 DM particles;we adopt an outer radius for the fit of 15 kpc. Appendix C directlyexamines the (minimal) impact of varying rmin, and compares Vcirc
from the extrapolated fits to the raw data and to NFW profiles. Im-portantly, as with the DMO simulations, we show in § 5.4 that theshape of the central profile has only a marginal impact on the num-ber of massive failures that we identify in the hydrodynamic simu-lations, even among non-satellite galaxies.
5.1.2 Selecting galaxies and halos
We separately analyze satellites of the MW, satellites of M31, andgalaxies in the Local Field, where satellites are again defined asgalaxies within 300 kpc of each host. We include every galaxy thatmeets each distance cut and has velocity information that is rep-resentative of the mass of the galaxy. This breaks slightly fromthe analyses of Boylan-Kolchin et al. (2011, 2012) and Garrison-Kimmel et al. (2014b), who eliminated the LMC, the SMC, andNGC 6822 for various reasons. In contrast, we eliminate only theSagittarius dSph. Because Sagittarius is in the process of tidally dis-rupting, stellar kinematics do not necessarily probe the underlyingdynamical mass. Consequently, we may identify a single subhaloas a “massive failure” (defined in detail in §5.1.3) that could be as-sociated with Sagittarius, increasing our counts below by one. Wegenerally adopt the constraints at (R1/2, V1/2) detailed in § 3.1, butthe wealth of data on the Magellanic Clouds allows us to plot rota-tion curves for those systems. Specifically, we adopt the HI-basedrotation curve for the SMC from Stanimirovic et al. (2004) andthe proper motion-based rotation curve for the LMC from van derMarel & Kallivayalil (2014). Finally, we note that M32 lies outsidethe limits of the central panel (in the upper left, at R1/2 = 110 pc,V1/2 = 79 km s−1), and Leo T lies outside the limits of the rightpanel (at R1/2 = 152 pc, V1/2 = 13 km s−1). Though these points arenot shown on the axes, they are included when identifying massivefailures.
For the DMO simulations, we seek to reproduce the cutsadopted by previous TBTF analyses. However, because we lackevolutionary histories for our (sub)halos, we select on present dayVmax instead of adopting the max[Vmax(t)] > 30 km s−1 cut usedin, e.g. Garrison-Kimmel et al. (2014b). Based on Figure 1 ofBoylan-Kolchin et al. (2012) and the results of Garrison-Kimmelet al. (2014b), we consider (sub)halos with Vmax ≥ 25 km s−1. For
satellites, this cut is typically more conservative than the criteriaof Garrison-Kimmel et al. (2014b) as many subhalos that reachedVmax 30 km s−1 can be stripped to Vmax ≤ 20 km s−1 today (e.g.Sawala et al. 2016a). In principle, however, we may include somesystems (particularly in the Local Field) that only recently reachedtheir present day mass, and which may therefore be expected toremain “dark” (e.g. Fitts et al. 2017). However, as we will showbelow, there are enough systems with Vmax ≥ 25 km s−1 in the fieldthat this is unlikely to change our conclusions.8
For the hydrodynamic simulations, we opt to reproduce thecuts placed on the observed galaxies. That is, we select galax-ies based on M∗, rather than Vmax.9 We select all luminous galax-ies with M∗ ≥ 105M. As we show explicitly in § 6, this cut isless restrictive than a Vmax-based cut: it includes many halos withVmax 25 km s−1, and only excludes three with Vmax ≥ 25 km s−1.Based on Figure 2, this is a conservative estimate for a stellar mass-based cut: the simulations all match or slightly exceed the MWSMF at 105M. The same is true in the Local Field: while obser-vational completeness in the Local Field is poorly defined, Figure 2shows that there are likely undetected galaxies at M∗ . 5×10⁵M.
5.1.3 Identifying massive failures
We adopt the nomenclature of Garrison-Kimmel et al. (2014b)in defining “strong massive failures” and “massive failures” sep-arately. Around the MW, the former are subhalos that are too denseto host any of the MW dSphs, while the latter have rotation curvesconsistent with either Draco or Ursa Minor (or both), but cannotbe associated with those galaxies because they have already beenassigned to other subhalos. In other words, strong massive failureshave circular velocity curves that lie above all of the MW dSphs,while massive failures are “leftover” systems that are otherwiseconsistent with either Draco or Ursa Minor, but that are kinemati-cally incompatible with the remainder of the MW dSphs.
Due to the wide variability in the internal structures of dwarfsaround M31 and in the Local Field, we opt to apply the samenomenclature to those volumes but insist that every galaxy be asso-ciated with a single halo (rather than just Draco and Ursa Minor). Inpractice, we therefore identify massive, unaccounted-for halos. Asdemonstrated by Garrison-Kimmel et al. (2014b), applying a stellarmass vs. halo mass relationship that reproduces counts in the LocalGroup (when applied to DMO simulations) to these unaccounted-for halos assigns them M∗ ≥ 5× 10⁵M. Therefore, the massivefailures we identify around M31 and in the Local Field would benominally expected to host bright galaxies.
5.2 Results: dark matter-only simulations
Figure 4 presents the results of performing these analyses on theDMO simulations. We compare the satellites of the lower (higher)
8 Our results with respect to the DMO simulations are insensitive to thesecuts. For example, we find qualitatively identical results if we select poten-tial massive failures by their circular velocity at fixed radius, rather thanby Vmax. Specifically, selecting the twelve subhalos with the largest circularvelocities at r = 1 kpc, rather than all subhalos with Vmax ≥ 25 km s−1, stillyields at least one, and typically & 3, satellites with Vcirc profiles that areincompatible with all of the MW dSphs (i.e., massive failures).9 Note, however, that we do assign galaxies to host the LMC and SMCbased on their Vmax, rather than M∗, which is a more stringent cut (seeFigure 6).
MNRAS 000, 1–19 (2018)
The Local Group on FIRE 9
0.2 0.3 0.5 0.75 1 1.5 2.5r [kpc]
5
7
10
15
20
30
4050
65
V circ
[km
s1 ]
Milky Way
rMW 300kpcVmax 25km s 1
Leo II
DracoCarinaSculptorLeo I
Ursa Minor
CVnI
FornaxSextans
0.3 0.5 0.75 1 1.5 2.5r [kpc]
M31
And IAnd IIIAnd V
And VIIAnd IX
And XIV
And XV
And XXIAnd XXIX
NGC 147
NGC 185NGC 205
IC 10
LGS 3
M33
And XXIII
And VI
And XXV
And XIXAnd XVII
And XXX
And XXVII
And X
rM31 300kpcVmax 25km s 1
0.3 0.5 0.75 1 1.5 2.5r [kpc]
Local Field
rboth 300kpcreither 1Mpc
Vmax 25km s 1
TucanaAnd XXVIII
Leo A
CetusPegasus
IC 1613
WLM
And XVIII
NGC 6822
105
106
107
108
M[M
]
0.2 0.3 0.5 0.75 1 1.5 2.5r [kpc]
5
7
10
15
20
30
4050
65
V circ
[km
s1 ]
rMW 300kpcVmax 25km s 1
Leo II
DracoCarinaSculptorLeo I
Ursa Minor
CVnI
FornaxSextans
0.3 0.5 0.75 1 1.5 2.5r [kpc]
And IAnd IIIAnd V
And VIIAnd IX
And XIV
And XV
And XXIAnd XXIX
NGC 147
NGC 185NGC 205
IC 10
LGS 3
M33
And XXIII
And VI
And XXV
And XIXAnd XVII
And XXX
And XXVII
And X
rM31 300kpcVmax 25km s 1
0.3 0.5 0.75 1 1.5 2.5r [kpc]
rboth 300kpcreither 1Mpc
Vmax 25km s 1
TucanaAnd XXVIII
Leo A
CetusPegasus
IC 1613
WLM
And XVIII
NGC 6822
105
106
107
108
M[M
]
Figure 4. Circular velocity curves of dwarf (sub)halos in the DMO simulations, selected according to Vmax, throughout Romeo & Juliet (top) and Thelma& Louise (bottom). From left to right, the panels plot MW satellites, M31 satellites, and galaxies in the Local Field. Circles, squares, and diamonds representdSphs, dEs, and dIrrs, respectively, with galaxy classifications taken from the literature; the star indicates M33, and the lines marked with diamonds indicaterotation curves for the SMC (small diamonds) and the LMC (large diamonds). “Strong” massive failures, which are halos too dense to host any of the galaxiesin the comparison sample other than the LMC and SMC, are plotted as solid black lines. The less stringently defined massive failures, which are halos expectedto host relatively bright galaxies but that lack an observational counterpart, are plotted as dashed grey lines. Halos assigned to host a galaxy are plotted inmagenta. The subhalos assigned to host the LMC and SMC (defined to be the two most massive, if they have Vmax ≥ 65 and 60 km s−1 respectively) areplotted as short and long dashed magenta lines around Juliet. Both the M31 and the Local Field contain dwarfs that are dense enough to eliminate allstrong massive failures and, when the dEs and M32 (outside the plot axes) are accounted for, typically only a few subhalos with Vmax ≥ 25 km s−1 remainunaccounted for around M31. However, the TBTF problem, as identified by Boylan-Kolchin et al. (2011, 2012) around the MW and by Garrison-Kimmelet al. (2014b) in the Local Field, exists in the DMO simulations of all of our systems. Every host has several subhalos that are too dense to host any of the MWdSphs, along with many more that are only consistent with Draco and Ursa Minor, and every Local Field analogue contains a plethora of massive subhalos,many of which can only be associated with either Tucana or the baryon dominated NGC 6822.
mass host in each pair to those of the MW (M31) in the left (cen-tral) panel, and show the Local Field population in the right panel.Strong massive failures (which only exist in comparison with theMW satellites) are plotted as black lines, while massive failuresare indicated by the dashed grey lines. These latter set are mas-sive, dense (sub)halos that we nominally expect to form stars, yetwhich lack an observational counterpart. Halos assigned to host agalaxy (which are not counted as massive failures) are indicatedby magenta lines. Juliet contains analogues for both the LMCand SMC; these subhalos are indicated in the long and short dashedmagenta lines, respectively.
As expected, we identify several (strong) massive failuresin the left panel. However, our analysis identifies only one mas-sive failure when comparing Romeo to the M31 satellite popula-tion, and none among the satellites of Thelma, though our anal-ysis places several galaxies in subhalos that are likely not massive
enough to host them. As a glaring example, none of the satellites ofThelma have Vmax ≥ 50 km s−1, but four are assigned to host M33,M32, NGC 205, and NGC 147, all of which have M∗ & 108M.Moreover, our criteria identifies massive failures (relative to theM31 satellites) in Juliet (7) and in several of the isolated hosts:m12c contains 6, m12i contains 3, and m12m contains 7. We alsoremind the reader that the hydrodynamic versions of these halosunderproduce the SMFs; if this is due to the masses of our hosts,then we would expect to also underproduce the halo mass function,which scales closely with host mass (e.g. Boylan-Kolchin et al.2010). Finally, both pairs contain a glut of unaccounted for, mas-sive halos in their Local Field populations. Moreover, in both pairs,at least two of those leftover halos are too dense to be associatedwith any of the known galaxies other than Tucana or NGC 6822.
We emphasize that all of our DMO hosts suffer from TBTF(as formulated by Garrison-Kimmel et al. 2014b) when comparing
MNRAS 000, 1–19 (2018)
10 S. Garrison-Kimmel et al.
0.2 0.3 0.5 0.75 1 1.5 2.5r [kpc]
5
7
10
15
20
30
4050
65
V circ
[km
s1 ]
Milky Way
rMW 300kpcM 105
Leo II
DracoCarinaSculptorLeo I
Ursa Minor
CVnI
FornaxSextans
0.3 0.5 0.75 1 1.5 2.5r [kpc]
M31
And IAnd IIIAnd V
And VIIAnd IX
And XIV
And XV
And XXIAnd XXIX
NGC 147
NGC 185NGC 205
IC 10
LGS 3
M33
And XXIII
And VI
And XXV
And XIXAnd XVII
And XXX
And XXVII
And X
rM31 300kpcM 105M
0.3 0.5 0.75 1 1.5 2.5r [kpc]
Local Field
rboth 300kpcreither 1MpcM 105M
TucanaAnd XXVIII
Leo A
CetusPegasus
IC 1613
WLM
And XVIII
NGC 6822
105
106
107
108
M[M
]
0.2 0.3 0.5 0.75 1 1.5 2.5r [kpc]
5
7
10
15
20
30
4050
65
V circ
[km
s1 ]
rMW 300kpcM 105
Leo II
DracoCarinaSculptorLeo I
Ursa Minor
CVnI
FornaxSextans
0.3 0.5 0.75 1 1.5 2.5r [kpc]
And IAnd IIIAnd V
And VIIAnd IX
And XIV
And XV
And XXIAnd XXIX
NGC 147
NGC 185NGC 205
IC 10
LGS 3
M33
And XXIII
And VI
And XXV
And XIXAnd XVII
And XXX
And XXVII
And X
rM31 300kpcM 105M
0.3 0.5 0.75 1 1.5 2.5r [kpc]
rboth 300kpcreither 1MpcM 105M
TucanaAnd XXVIII
Leo A
CetusPegasus
IC 1613
WLM
And XVIII
NGC 6822
105
106
107
108
M[M
]
Figure 5. Identical to Figure 4, but here plotting Vcirc curves from the hydrodynamic simulations. Including baryonic physics using the FIRE models eliminatesTBTF around the MW and M31. The dotted lines in the Local Field panel show the persistence of several “failures” unaccounted for by current data, but theseare quite different from the massive failures in the DMO runs: they have rotation curves similar to the typical observed LG and Local Field systems (there aresimply ∼ 10 more of them). The mis-match may therefore be a result of observational incompleteness at M∗ . 106M. The simulations here do not produceany galaxies with densities as high as those of the baryon-dominated compact dEs around M31 (or Tucana/NGC 6822), with Vcirc & 35km s−1 at r < 1kpc.
their satellite populations with the satellites of the MW. Though weonly directly plot Juliet and Louise against the MW satellites,we list the number of massive failures (and, in parentheses, strongmassive failures) in the final column of Table 1: in the DMO simu-lations, all of our hosts contain at least two strong massive failures.
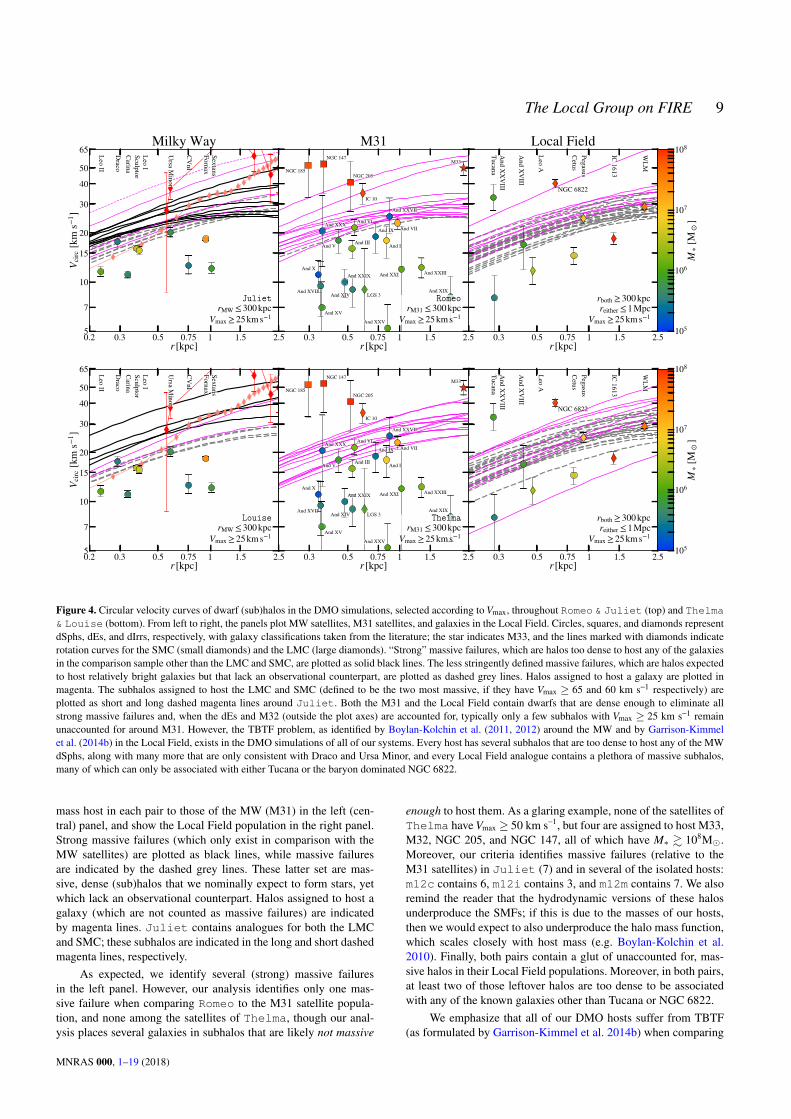
5.3 Results: FIRE simulations
Figure 5 is analogous to Figure 4, but it plots Vcirc curves of theluminous galaxies in the FIRE simulations (i.e. including baryons).Because we color the lines by stellar mass, we separate massivefailures and halos that are matched with observed dwarfs via line-style: massive failures are plotted with dashed lines and the halosassigned to host galaxies with solid lines. The addition of baryonicphysics to the simulations eliminates the TBTF problem aroundthe MW and M31. In particular there are neither ‘strong massivefailures’ nor ‘massive failures’ within the virial radius of either hostaccording to the definitions applied to the DMO simulations above.While the M31 population looks good in comparison to the TBTFproblem, our hosts do not contain quite as many satellites as M31overall: matching the stellar mass function may result in additionalgalaxies that cannot be matched one-to-one with observed systems.
There do remain a number of “failures,” according to our for-
mal definition in the Local Field population (dotted lines), all withstellar masses < 106M. However, we emphasize their circular ve-locities are still much lower than in the DMO simulations; in fact,they have profiles quite similar to the typical observed systems inboth the MW, M31, and Local Field. Given that the completenessof the Local Field out to ∼Mpc at these masses is rather uncer-tain, one possibility is that there is a population of∼ 10 undetecteddwarf galaxies in this region, with stellar masses M∗ = 105−6Mand dark matter densities similar to those of known dwarf galax-ies (e.g. And XVIII).10 However, we also note that this tension,like that in the Local Field stellar mass function, can be reduced(decreasing the number of discrepant halos by a few), without in-troducing significant tension in the comparison with TBTF aroundM31, if we use a larger radial cut as in Appendix B to associategalaxies with M31 and the MW.
Note that the relative impact of supernovae feedback is suchthat more massive dwarfs (M∗ ∼ 108M) almost universally havelower central masses than their less luminous counterparts (M∗ .106M), particularly in the Local Field. Measuring dynamical
10 Specifically, there are 17 (7) of these missing systems in the Local Fieldof Romeo & Juliet (Thelma & Louise) with M∗ > 105M and 7 (6)with M∗ > 3×10⁵M.
MNRAS 000, 1–19 (2018)

The Local Group on FIRE 11
masses within ∼ 500 pc across a range of stellar masses (e.g. withthirty meter-class telescopes) will test this prediction.
Aside from the the Local Field, our hydrodynamic simulationsare free of TBTF: all of the simulated dwarf satellites are consistentwith even the lower density MW dSphs and the satellites of M31.As we will show more quantitatively in § 6, the stellar kinemat-ics of the simulated galaxies are also in line with those of dwarfsthroughout the LG.
The agreement between the central masses of the simulatedand observed galaxies is not perfect, however: the satellite popula-tions do not contain any systems quite as dense as NGC 205, NGC147, NGC 185, or IC 10.11 This result holds across our entire sam-ple: none of our hosts have satellites (or field galaxies) that reacheven the lower 1σ error on NGC 205, the least dense of the dEs.Though this may be due to a lack of high mass dwarf galaxies, thetrend is typically in the opposite direction, such that our high massdwarf galaxies have relatively low Vcirc at ∼ 300 pc. An examina-tion of Figure 6 of Sawala et al. (2016b) and Figure 3 of Duttonet al. (2016) suggests that the APOSTLE and NIHAO simulations,respectively, may also lack analogues of the high density M31 satel-lites (halos with Vcirc ∼ 50 km s−1 at ∼ 500 pc). These high densitygalaxies may represent a manifestation of the “diversity problem”(Oman et al. 2015; Creasey et al. 2017) in the LG.
Producing such high density galaxies, with M∗ ∼ 108M,may prove to be an important test of galaxy formation physics.In particular, while abundance matching arguments suggest thatthese galaxies are at the centers of halos that reached ∼ 1010.5M(Garrison-Kimmel et al. 2014a), previous work has shown thatmass scale to be the most susceptible to core formation and stel-lar migration due to supernovae feedback (Di Cintio et al. 2014b;Chan et al. 2015; El-Badry et al. 2016). Some of these could be thestripped cores of previously more massive galaxies: for example,McConnachie et al. (2004) identified a stream that is likely orig-inating from NGC 205. However, they estimate the total mass inthat stream to be only ∼ 2.5% of the mass of NGC 205. More-over, this option is unlikely for at least IC 10, which is gas richand star forming today. Furthermore, the galaxies in the LG thatare more massive than this sample, the LMC and M33, lack thesehigh density central clumps. An additional, constant source of feed-back (e.g. cosmic rays; Jubelgas et al. 2008) that acts to smooth outthe burstiness in the star formation, leading to less-violent feedbackepisodes, may be required to explain these objects. For a more de-tailed discussion of the structure of isolated galaxies at this massscale in the FIRE-2 simulations, we refer the reader to Chan et al.(2017), who studied the evolution of the stellar effective radius; El-Badry et al. (2017a), who explored the gas morphologies as a func-tion of galaxy mass; and El-Badry et al. (2018), who showed thatM∗ ∼ 108M galaxies are, on average, overly dispersion supportedrelative to spatially unresolved HI gas kinematics.
However, more detailed comparison of our existing simu-lations to these observations is also warranted, particularly toforward-model the actual observed rotation curves and velocity dis-persions. Some of the observed systems with high apparent veloci-ties are clearly tidally disturbed or strongly interacting (e.g. IC 10,Ashley et al. 2014, and NGC 205, above), and Teyssier et al. (2012)argue NGC 147, 185, 6822, and Tucana, have all had a previous
11 They also do not contain any as dense as M32, but the high density ofM32 may be at least partially explained by a nuclear supermassive blackhole (van der Marel & van den Bosch 1998), which we do not model inthese simulations.
passage through the MW or M31 disk. Some of these also featurerecent starbursts, in which case El-Badry et al. (2017b) argue thatfeedback-driven perturbations to the potential (the same which flat-ten the DM profile) can lead to the observationally-inferred Jeansmasses (hence Vcirc) being over-estimated by up to a factor∼ 2 (suf-ficient to explain most of the discrepancy). We will show below, forexample, that the actual line-of-sight stellar velocity dispersions inthe simulations reach values similar to those observed even in thehigh-density systems.
5.4 The impact of the shape of the density profile
In summary, Figures 4 and 5 demonstrate that, while the DMO ana-logues to the ELVIS on FIRE simulations all suffer from TBTF, theproblem is strongly alleviated or entirely eliminated in the fully hy-drodynamic runs. Specifically, we find no TBTF problem aroundthe MW analogues, a result consistent with observational incom-pleteness in the Local Field, and a set of dwarf galaxies consistentwith the dSphs around M31 (though we find no analogues to thehigher density satellites of M31).
However, the analysis above was performed with two caveats:first, we assume NFW profiles for the DMO (sub)halos but calcu-late Vcirc for the FIRE simulations by joining fitted density profilesto the raw particle data, and second, we compare only the lowermass host in each pair to the MW dSphs. The second choice hasno effect on our results: by the metrics defined above, none of ourhosts, paired or isolated, have any massive failures in their lumi-nous satellites when compared with the MW dSphs.
The first choice is similarly irrelevant to our conclusions, but itdoes have relatively large consequences for the number of ‘strong’massive failures identified in the satellite populations of the DMOsimulations: without correcting for the numerical impact of gravita-tional softening, we identify only 11 strong massive failures acrossthe ten DMO hosts, compared with 61 when we assume NFW pro-files. The number of massive failures in the DMO runs, however,is much more stable to this assumption and only decreases by 1–4 in all but two of our hosts, with the total count decreasing byonly 31% from 114 to 79. That is, by the Garrison-Kimmel et al.(2014b) metrics, we would still have identified a TBTF problem,even drawing directly from the particle data. We also emphasizethat the assumption of NFW (or NFW-like) profiles for the DMOsubhalos is theoretically well-motivated. Nevertheless, we plot theraw DMO Vcirc curves for Romeo & Juliet in Appendix B forillustrative purposes.
More importantly, the results for the FIRE simulations are alsoonly weakly sensitive shape of the central density profile. Specifi-cally, adopting a cuspy NFW profile vs. using the corrected (or raw)mass profile has a relatively minor influence on the number of mas-sive failures identified in the FIRE simulations, particularly whencompared with the MW satellites. Assuming NFW profiles for theluminous satellites in the hydrodynamic runs (similarly normalizedto Rmax and Vmax of each subhalo) yields a total of only 13 massivefailures across our ten hosts when compared with the MW dSphsample, only three of which are ‘strong.’
Therefore, even though there is now substantial evidence thatsupernovae feedback can flatten the central density profiles ofM∗ ' 106.5
− 109M galaxies (e.g. Pontzen & Governato 2012;Di Cintio et al. 2014a; Chan et al. 2015) we find that this effectis typically of second-order importance for solving TBTF amongthe satellite populations in these simulations (in agreement withSawala et al. 2016b). Instead, the problem is primarily alleviatedby removing mass from the subhalos overall (lowering Vmax) and
MNRAS 000, 1–19 (2018)

12 S. Garrison-Kimmel et al.
105 106 107 108 109
M [M ]2
3
45
7
10
15
20
30
40
v [km
/s]
SatellitesFieldMW satellitesM31 satellitesLocal Field
dSphdIrrdE
10 12 15 20 25 30 40 50 60 80Vmax [km/s]
105
106
107
108
109
M[M
]
SatellitesField
10 12 15 20 25 30 40 50 60 80Vmax [km/s]
5
7
10
15
20
30
40
50
v [km
/s]
SatellitesField
Figure 6. Relationships between stellar mass, 1D (line-of-sight) stellar velocity dispersion, and halo Vmax including satellites and Local Field galaxies fromall the simulations. The simulations generally reproduce the observed M∗ −σ∗ relationship, particularly for the satellites of the MW, but they fail to create anydwarfs with σ∗ as low as some observed near M31, possibly because of either artificial destruction (specifically, an inability to track strongly tidally strippedobjects) or N-body dynamical heating in the simulations. Vmax is reasonably predictive of M∗ for non-satellite galaxies, but tidal interactions decrease Vmaxfaster than M∗, generally scattering galaxies to the left. Vmax and σ∗ remain remarkably correlated, however. The open points in the left two panels indicatethe medians for each population. The downward arrows in the central panel indicate halos that fall off the plot (i.e. M∗ < 105M), which first appear forVmax . 25 km s−1 and become common at Vmax . 20 km s−1. We do not claim that these halos are necessarily “dark,” merely that they are at lower stellarmass. For the purposes of calculating the medians in each population, these points are treated as having a stellar mass of zero.
destroying otherwise luminous satellites through enhanced tidal in-teractions with the disk (D’Onghia et al. 2010; Sawala et al. 2017;Garrison-Kimmel et al. 2017b). However, we cannot completelydismiss the importance of feedback induced core formation; for ex-ample, subhalos cored by internal processes are then more suscep-tible to further mass loss from external interactions (e.g. Peñarrubiaet al. 2010; Brooks & Zolotov 2014, but also see Garrison-Kimmelet al. 2017b, who showed that much of the differences in subhalocounts between DMO and FIRE simulations can be accounted forpurely by the gravitational potential of the central galaxy with onlya weak dependence on subhalo mass or Vmax).
Changes to the internal profile are also relatively unimportantin the Local Field, even though tidal effects are minimal in that vol-ume: assuming NFW profiles for the non-satellite sample within1 Mpc of each host increases the total number of massive fail-ures (defined in this volume as galaxies with M∗ ≥ 105M withoutobservational kinematic counterparts) across the entire simulatedsample from 34 to 40. However, this difference is still small com-pared to the overall impact of baryonic physics: the same volumescontain ' 75 halos identified as massive failures when simulatedwithout baryons (nearly independent of whether we assume NFWprofiles or use the raw particle data). Therefore, even in the LocalField, feedback induced cores are only a small piece of resolvingTBTF: overall baryonic mass loss, enhanced disruption (both fromother field galaxies and in the sample of “backsplash” halos), andchanges to the halo sample due to selecting on M∗ rather than Vmax
all play a significant role, even for non-satellite galaxies.
6 STELLAR VELOCITY DISPERSIONS
We have shown separately that the distributions of stellar massesand rotation curves of our simulated dwarf populations broadlyagree with that of the LG. One can additionally ask whether oursimulations predict the correct joint relation between these; thatis, whether our individual dwarf galaxies are indeed realistic. Fig-
ure 6 directly compares the stellar velocity dispersions (defined asthe RMS line-of-sight dispersion of all the stars associated with agalaxy) as a function of stellar mass for all of the satellite galax-ies (defined as r < 300 kpc) and non-satellite galaxies in the sim-ulations, together with dwarf galaxies from throughout the LG.Though σ∗ is not necessarily representative of the underlying DMhalo (e.g. in the case of significant rotation, such as for the LMC,the right-most point in the plot), the overall agreement betweenthe simulated and observed relationships support our assertion thatour dwarf galaxy populations display similar kinematics as the ob-served LG dwarf galaxies.
However, the simulations fail to reproduce the six LG galaxieswith M∗ > 3× 10⁵M and σ∗ ≤ 5 km s−1, all of which are within400 kpc of M31. This disagreement may indicate that our resolu-tion (for the stars, gravitational softening lengths . 5 pc and par-ticle masses . 103.5) remains insufficient for resolving the coldest,and potentially most disrupted, dwarf galaxies in the LG – thesesystems have . 100 star particles in the simulations. The worst-case velocity kick (i.e. the maximal possible deflection) due to N-body interactions between stellar particles is of order 3 km s−1 inour simulations. Therefore, it may not be possible to maintain sys-tems as dynamically cold as these six galaxies. There is also evi-dence for a partial separation between the satellite and non-satellitepopulations, such that satellite galaxies lose dynamical mass andscatter to lower σ∗ at fixed M∗. If, as suggested by Brooks & Zolo-tov (2014) and Zolotov et al. (2012), this is due to tidal effects,then the simulated analogues of the outlying galaxies in Figure 6may be (spuriously) destroyed due to finite mass resolution (vanden Bosch & Ogiya 2018). However, those authors demonstratedartificial numerical disruption could be minimized with aggressivegravitational force softenings, and we remind the reader that oursimulations adopt physical DM force softenings of ' 50 pc.
We also note that, while we do not plot it, our simulations typ-ically agree reasonably well with the R1/2 distribution of the LGpopulation at fixed M∗ or σ∗, but they do not reproduce the spa-tially smallest/most compact systems at a given M∗. The results of
MNRAS 000, 1–19 (2018)

The Local Group on FIRE 13
even higher resolution FIRE simulations of isolated dwarf galax-ies suggest that our smallest simulated dwarfs (M∗ . 106M) willlikely become more compact with increased resolution (Fitts et al.2017), but higher mass dwarf galaxies simulated with FIRE main-tain large effective radii even for gas particle masses 260 M (Chanet al. 2017) as their sizes are set by feedback “puffing up” the sys-tem. Given the insensitivity of our results to the internal profiles ofthe simulated satellites, we do not expect that increasing the reso-lution will significantly alter our conclusions with respect to TBTF.Moreover, in lower resolution FIRE simulations, the higher mass(i.e. resolved) dwarf galaxies also yield a reasonable M∗ −σ∗ rela-tionship.
The right two panels in Figure 6 plot the stellar mass and stel-lar velocity dispersion as a function of Vmax. The relationship be-tween M∗ and Vmax is relatively tight for isolated galaxies, whereVmax is more likely to represent the largest mass the halo everreached, but it is clear that tidal interactions shift galaxies to theleft on the plot by removing dark matter from the outer portions ofthe subhalos, decreasing Vmax faster than M∗.12 Both results are ingood agreement with Sawala et al. (2016b). Meanwhile, the rela-tionship between Vmax and σ∗ remains remarkably tight even aftertidal interactions with a larger halo.
The downward arrows at the bottom of the center panel indi-cate halos with M∗ < 105M, i.e. that fall below the y-limit of theplot. Our analysis assigns the vast majority of these halos no stars,though a few contain a small number of star particles. These sys-tems begin to appear for Vmax . 25 km s−1 and become frequent forVmax . 20 km s−1 (in rough agreement with Sawala et al. 2016a). Ifthese halos host ultra-faint dwarf galaxies below our resolution lim-its, then such galaxies should appear to be fairly dense, with centralmasses similar to And XVIII. Because our definition of “massivefailure” includes only halos with Vmax ≥ 25 km s−1, these dark ha-los contribute only marginally towards resolving TBTF, particu-larly within the virial radius of the MW. However, the values plot-ted in Figure 6 are taken from the hydrodynamic simulations; it istherefore possible that DMO halos with Vmax & 25 km s−1 accretedless overall mass in the hydrodynamic simulations and appear asdark halos with Vmax . 20 km s−1.
7 CONCLUSIONS
The Local Group provides an unparalleled window into the pop-ulation of dwarf galaxies in the Universe, but it is not a typicalenvironment: the presence of two massive halos (& 1012M) hasimportant implications for, e.g., the predicted halo mass functionin the nearby volume (Garrison-Kimmel et al. 2014a). Here, wepresent the first two simulations from the ELVIS on FIRE suite,which apply the FIRE models for star formation and feedback toLG-like environments at . 4000M resolution. We also includeresults from FIRE simulations targeting isolated MW-mass halos atsimilar resolutions. We present the satellite and non-satellite stellarmass functions predicted by these simulations, and compare themto an analogous set of isolated MW-mass halos also simulated with
12 The relationship between M∗ and Vmax for non-satellite galaxies is instark contrast to the findings of Garrison-Kimmel et al. (2014b), who foundno trend between M∗ and the implied Vmax for galaxies in the Local Field.However, that analysis assumed fixed density profiles across all halos, andassigned Vmax by extrapolating from V1/2. An updated analysis that accountsfor variance in the density profiles as a function of M∗ and Mvir is requiredto properly assign Vmax values to the Local Field systems.
FIRE. We then compare the internal structure of our resolved galax-ies to that of the dwarf galaxies in the LG, both via their implieddynamical masses within the half-light radius (the too-big-to-failproblem) and through the relationships between σ∗ and M∗.
The simulations accurately reproduce the dwarf galaxy popu-lation of the MW for M∗ & 105M. They roughly bracket the stellarmass function of the MW satellites at nearly all masses, particularlybelow the masses of the LMC and SMC. However, the MW SMF isunique in exhibiting a “gap” between CVnI (M∗ = 3×10⁵M) andthe ultra-faint dwarfs with M∗ . 3× 10⁴M, suggesting observa-tional incompleteness around the MW even for M∗ > 105M (typ-ically≈ 4 such galaxies). The simulated satellite galaxies also havecentral masses consistent with those of the real MW satellites: theydo not suffer from too-big-to-fail. This result is relatively insensi-tive to the shape of the central density profile, particularly com-pared to the total impact of baryonic physics: even if we (falsely)assume a cuspy, NFW profile for the hydrodynamic simulations, weidentify less than two “massive failures” per host on average, whilethe DMO simulations contain more than 11. Therefore, supernovainduced core formation is less important in resolving TBTF amongthe MW satellites: subhalo disruption and overall mass loss appearto be the dominant processes.
Our simulated satellites are somewhat less successful at repro-ducing the population of dwarf galaxies around M31. They (usu-ally) underproduce the total count at most stellar masses: M31contains, on average, roughly twice as many satellites with M∗ ≥105M as the median simulated host. Given that the highest masshost in our sample has Mvir = 1.54× 10¹²M, this may suggest ahigher virial mass for M31. Moreover, while our simulated satel-lites have central masses consistent with the dSphs around M31,none of our dwarf galaxies appears to have enough mass within∼ 300 pc to host the highest-density dwarf galaxies inferred aroundM31 (the three dEs and IC 10) – the opposite problem as TBTF.Our simulations may also lack the resolution to reproduce the sixdwarf galaxies within 400 kpc of M31 with σ∗ < 5 km s−1 andM∗ ≥ 3×10⁵M. More detailed modeling to predict the kinemat-ics that would actually be measured in both these cases is clearlywarranted.
The simulated non-satellite (rhost > 300 kpc) populations agreereasonably well with the observations: they again roughly bracketthe observed SMFs, now for M∗≥ 106M, and have central massesthat are consistent with observations of the majority of the dwarfgalaxies in the Local Field. However, while the TBTF problem isresolved for satellite systems around the MW and M31, the simula-tions predict the existence of ∼ 10 low-mass dwarf galaxies within∼ 1Mpc of each host that are currently unaccounted for in the data.These all have M∗ = 105
− 106M, and circular velocities broadlysimilar to those observed in other LG and Local Field dwarfs of thesame mass, and thus may represent an as-of-yet undetected popu-lation of low-mass dwarf galaxies in the Local Field. This predic-tion should be testable with a combination of LSST, WFIRST, andthirty-meter class telescopes. However, we note that both this dis-crepancy and that with the M31 stellar mass function may be quan-titatively reduced if some of our “Local Field” population shouldreally be associated with M31 (in observations), and our non-pairedhalos demonstrate large systematic scatter in their field stellar massfunctions.
Other than the very low σ∗ dwarf galaxies near M31, our sim-ulated dwarfs broadly overlap the observations in M∗ vs. σ∗. Wefind a tight relationship between σ∗ and Vmax for both satellites andnon-satellites. The relationship between Vmax and M∗ is also rela-
MNRAS 000, 1–19 (2018)

14 S. Garrison-Kimmel et al.
tively tight for non-satellites, but tidal interactions introduce sub-stantial scatter among the satellite populations.
In short, neither the isolated, MW-mass FIRE simulations northe ELVIS on FIRE simulations suffer from the traditional small-scale problems identified for satellites within the virial radius ofthe MW or M31. Further, the ELVIS on FIRE simulations alleviatethe TBTF problem in the Local Field, though there remains sometension that needs to be tested with future observations.
Our simulations are not free of flaws. They ignore some phys-ical processes that may be important at these scales (e.g. super-massive black holes and cosmic rays), they include a reionizationhistory that on the early edge of constraints from Planck (Oñorbeet al. 2017), they appear to lack the necessary resolution to capturethe half-mass radii of the smallest galaxies (M∗ . 106M), andthey may fail to reproduce the highest density dwarf galaxies in theLG. Given that supernovae feedback appears to be most effectiveat these mass scales, their existence may point towards physics thatreduces the burstiness in star formation (lessening the violent feed-back episodes associated with strong bursts). Altogether, however,our results indicate that a meta-galactic ionizing background, stel-lar/supernovae feedback, and interactions with the disks of the MWand M31 are able to transform the overly abundant, overly denseLG (sub)halo populations predicted by DMO simulations into asample of dwarf galaxies that is largely consistent with observa-tions of the LG within the vanilla ΛCDM paradigm, though ourwork does not rule out non-standard DM physics. Future work isrequired to fully understand the relative contributions of internalfeedback, LG-scale interactions, and the cosmological backgroundto dwarf galaxy formation in the Local Group, to test the impact ofhost mass on the satellite populations, and to understand the forma-tion of the high density dEs in the Local Group.
ACKNOWLEDGMENTS
The authors thank Evan Kirby, Coral Wheeler, Lina Necib, Alejan-dro Benitez-Llambay, and Cameron Hummels for valuable discus-sions, and Alexander Knebe and Oliver Hahn for making AHF andMUSIC, respectively, publicly available.
Support for SGK was provided by NASA through EinsteinPostdoctoral Fellowship grant number PF5-160136 awarded by theChandra X-ray Center, which is operated by the Smithsonian As-trophysical Observatory for NASA under contract NAS8-03060.Support for PFH was provided by an Alfred P. Sloan ResearchFellowship, NSF Collaborative Research Grant #1715847 and CA-REER grant #1455342. AW was supported by a Caltech-CarnegieFellowship, in part through the Moore Center for Theoretical Cos-mology and Physics at Caltech, and by NASA through grants HST-GO-14734 and HST-AR-15057 from STScI. JSB was supportedby NSF grant AST-1518291 and by NASA through HST the-ory grants (programs AR-13921, AR-13888, and AR-14282.001)awarded by STScI, which is operated by the Association of Univer-sities for Research in Astronomy (AURA), Inc., under NASA con-tract NAS5-26555. MBK acknowledges support from NSF grantAST-1517226 and CAREER grant AST-1752913 and from NASAgrants NNX17AG29G and HST-AR-13888, HST-AR-13896, HST-AR-14282, HST-AR-14554, HST-AR-15006, HST-GO-12914, andHST-GO-14191 from STScI. DK was supported by NSF grantAST-1715101 and the Cottrell Scholar Award from the ResearchCorporation for Science Advancement. CAFG was supported byNSF through grants AST-1412836, AST-1517491, AST-1715216,and CAREER award AST-1652522, by NASA through grant
NNX15AB22G, and by a Cottrell Scholar Award from the Re-search Corporation for Science Advancement. KEB was supportedby a Berkeley graduate fellowship, a Hellman award for graduatestudy, and an NSF Graduate Research Fellowship. EQ was sup-ported in part by NSF grant AST-1715070 and a Simons Inves-tigator Award from the Simons Foundation. RES is supported byan NSF Astronomy & Astrophysics Postdoctoral Fellowship undergrant AST-1400989.
Numerical calculations were run on the Caltech computecluster “Wheeler,” allocations from XSEDE TG-AST130039 andPRAC NSF.1713353 supported by the NSF, NASA HEC SMD-16-7223 and SMD-16-7592, and High Performance Computing at LosAlamos National Labs. This work also made use of Astropy, acommunity-developed core Python package for Astronomy (As-tropy Collaboration et al. 2013), matplotlib (Hunter 2007),numpy (van der Walt et al. 2011), scipy (Jones et al. 01 ),ipython (Perez & Granger 2007), yt (Turk et al. 2011), andNASA’s Astrophysics Data System. This research was supportedin part by the National Science Foundation under Grant No. NSFPHY-1748958.
REFERENCES
Ackermann M., et al., 2015, Physical Review Letters, 115, 231301Ashley T., Elmegreen B. G., Johnson M., Nidever D. L., Simpson C. E.,
Pokhrel N. R., 2014, AJ, 148, 130Astropy Collaboration et al., 2013, A&A, 558, A33Behroozi P. S., Wechsler R. H., Wu H.-Y., 2013, ApJ, 762, 109Bell E. F., de Jong R. S., 2001, ApJ, 550, 212Bell E. F., Slater C. T., Martin N. F., 2011, ApJ, 742, L15Bellazzini M., Gennari N., Ferraro F. R., Sollima A., 2004, MNRAS, 354,
708Bellazzini M., Gennari N., Ferraro F. R., 2005, MNRAS, 360, 185Belokurov V., et al., 2009, MNRAS, 397, 1748Bernard E. J., et al., 2009, ApJ, 699, 1742Bernard E. J., et al., 2010, ApJ, 712, 1259Bland-Hawthorn J., Gerhard O., 2016, ARA&A, 54, 529Bonanos A. Z., Stanek K. Z., Szentgyorgyi A. H., Sasselov D. D., Bakos
G. Á., 2004, AJ, 127, 861Bose S., Deason A. J., Frenk C. S., 2018, preprint,
(arXiv:1802.10096)Boylan-Kolchin M., Springel V., White S. D. M., Jenkins A., 2010, MN-
RAS, 406, 896Boylan-Kolchin M., Bullock J. S., Kaplinghat M., 2011, MNRAS, 415, L40Boylan-Kolchin M., Bullock J. S., Kaplinghat M., 2012, MNRAS, 422,
1203Brasseur C. M., Martin N. F., Rix H.-W., Irwin M., Ferguson A. M. N.,
McConnachie A. W., de Jong J., 2011, ApJ, 729, 23Brooks A. M., Zolotov A., 2014, ApJ, 786, 87Bryan G. L., Norman M. L., 1998, ApJ, 495, 80Buck T., Macciò A. V., Dutton A. A., Obreja A., Frings J., 2018, preprint,
(arXiv:1804.04667)Bullock J. S., Boylan-Kolchin M., 2017, ARA&A, 55, 343Bullock J. S., Kravtsov A. V., Weinberg D. H., 2000, ApJ, 539, 517Busha M. T., Wechsler R. H., Behroozi P. S., Gerke B. F., Klypin A. A.,
Primack J. R., 2011, ApJ, 743, 117Carlesi E., Hoffman Y., Sorce J. G., Gottlöber S., Yepes G., Courtois H.,
Tully R. B., 2016, MNRAS, 460, L5Carrera R., Aparicio A., Martínez-Delgado D., Alonso-García J., 2002, AJ,
123, 3199Chan T. K., Kereš D., Oñorbe J., Hopkins P. F., Muratov A. L., Faucher-
Giguère C.-A., Quataert E., 2015, MNRAS, 454, 2981Chan T. K., Kereš D., Wetzel A., Hopkins P. F., Faucher-Giguère C.-A.,
El-Badry K., Garrison-Kimmel S., Boylan-Kolchin M., 2017, preprint,(arXiv:1711.04788)
MNRAS 000, 1–19 (2018)

The Local Group on FIRE 15
Chapman S. C., et al., 2013, MNRAS, 430, 37Clementini G., Gratton R., Bragaglia A., Carretta E., Di Fabrizio L., Maio
M., 2003, AJ, 125, 1309Collins M. L. M., et al., 2010, MNRAS, 407, 2411Collins M. L. M., et al., 2013, ApJ, 768, 172Conn A. R., et al., 2012, ApJ, 758, 11Cook K. H., Mateo M., Olszewski E. W., Vogt S. S., Stubbs C., Diercks A.,
1999, PASP, 111, 306Corbelli E., 2003, MNRAS, 342, 199Corbelli E., Salucci P., 2000, MNRAS, 311, 441Crain R. A., et al., 2015, MNRAS, 450, 1937Creasey P., Sameie O., Sales L. V., Yu H.-B., Vogelsberger M., Zavala J.,
2017, MNRAS, 468, 2283D’Onghia E., Springel V., Hernquist L., Keres D., 2010, ApJ, 709, 1138Dale D. A., et al., 2007, ApJ, 655, 863Di Cintio A., Brook C. B., Macciò A. V., Stinson G. S., Knebe A., Dutton
A. A., Wadsley J., 2014a, MNRAS, 437, 415Di Cintio A., Brook C. B., Dutton A. A., Macciò A. V., Stinson G. S., Knebe
A., 2014b, MNRAS, 441, 2986Di Cintio A., Brook C. B., Dutton A. A., Macciò A. V., Obreja A., Dekel
A., 2017, MNRAS, 466, L1Diaz J. D., Koposov S. E., Irwin M., Belokurov V., Evans N. W., 2014,
MNRAS, 443, 1688Drlica-Wagner A., et al., 2015, ApJ, 813, 109Dutton A. A., Macciò A. V., Frings J., Wang L., Stinson G. S., Penzo C.,
Kang X., 2016, MNRAS, 457, L74El-Badry K., Wetzel A., Geha M., Hopkins P. F., Kereš D., Chan T. K.,
Faucher-Giguère C.-A., 2016, ApJ, 820, 131El-Badry K., et al., 2017a, preprint, (arXiv:1705.10321)El-Badry K., Wetzel A. R., Geha M., Quataert E., Hopkins P. F., Kereš D.,
Chan T. K., Faucher-Giguère C.-A., 2017b, ApJ, 835, 193El-Badry K., et al., 2018, preprint, (arXiv:1801.03933)Escala I., et al., 2018, MNRAS, 474, 2194Fattahi A., et al., 2016, MNRAS, 457, 844Faucher-Giguère C.-A., 2018, MNRAS, 473, 3717Fiorentino G., et al., 2010, ApJ, 708, 817Fitts A., et al., 2017, MNRAS, 471, 3547Fraternali F., Tolstoy E., Irwin M. J., Cole A. A., 2009, A&A, 499, 121Frinchaboy P. M., Majewski S. R., Muñoz R. R., Law D. R., Łokas E. L.,
Kunkel W. E., Patterson R. J., Johnston K. V., 2012, ApJ, 756, 74Garrison-Kimmel S., Boylan-Kolchin M., Bullock J. S., Lee K., 2014a,
MNRAS, 438, 2578Garrison-Kimmel S., Boylan-Kolchin M., Bullock J. S., Kirby E. N., 2014b,
MNRAS, 444, 222Garrison-Kimmel S., Horiuchi S., Abazajian K. N., Bullock J. S., Kapling-
hat M., 2014c, MNRAS, 444, 961Garrison-Kimmel S., et al., 2017a, preprint, (arXiv:1712.03966)Garrison-Kimmel S., et al., 2017b, MNRAS, 471, 1709Geha M., Guhathakurta P., Rich R. M., Cooper M. C., 2006, AJ, 131, 332Geha M., van der Marel R. P., Guhathakurta P., Gilbert K. M., Kalirai J.,
Kirby E. N., 2010, ApJ, 711, 361Gieren W., Pietrzynski G., Nalewajko K., Soszynski I., Bresolin F., Ku-
dritzki R.-P., Minniti D., Romanowsky A., 2006, ApJ, 647, 1056Gottloeber S., Hoffman Y., Yepes G., 2010, preprint,
(arXiv:1005.2687)Grand R. J. J., et al., 2017, MNRAS, 467, 179Hahn O., Abel T., 2011, MNRAS, 415, 2101Harris J., Zaritsky D., 2006, AJ, 131, 2514Hernquist L., 1990, ApJ, 356, 359Ho N., et al., 2012, ApJ, 758, 124Hopkins P. F., 2015, MNRAS, 450, 53Hopkins P. F., 2017, MNRAS, 466, 3387Hopkins P. F., Narayanan D., Murray N., 2013, MNRAS, 432, 2647Hopkins P. F., Kereš D., Oñorbe J., Faucher-Giguère C.-A., Quataert E.,
Murray N., Bullock J. S., 2014, MNRAS, 445, 581Hopkins P. F., et al., 2017, preprint, (arXiv:1702.06148)Howley K., et al., 2012, preprint, (arXiv:1202.2897)Hunter J. D., 2007, Computing In Science & Engineering, 9, 90
Hunter D. A., Elmegreen B. G., 2006, ApJS, 162, 49Ibata R., Martin N. F., Irwin M., Chapman S., Ferguson A. M. N., Lewis
G. F., McConnachie A. W., 2007, ApJ, 671, 1591Jaffe W., 1983, MNRAS, 202, 995Jones E., Oliphant T., Peterson P., et al., 2001–, SciPy: Open source scien-
tific tools for Python, http://www.scipy.org/Jubelgas M., Springel V., Enßlin T., Pfrommer C., 2008, A&A, 481, 33Kafle P. R., Sharma S., Lewis G. F., Robotham A. S. G., Driver S. P., 2018,
MNRAS,Katz N., White S. D. M., 1993, ApJ, 412, 455Kim J.-h., et al., 2014, ApJS, 210, 14Kirby E. N., Bullock J. S., Boylan-Kolchin M., Kaplinghat M., Cohen J. G.,
2014, arXiv:1401.1208 [astro-ph],Klypin A., Kravtsov A. V., Valenzuela O., Prada F., 1999, ApJ, 522, 82Knollmann S. R., Knebe A., 2011, AHF: Amiga’s Halo Finder, Astro-
physics Source Code Library (ascl:1102.009)Koch A., Kleyna J. T., Wilkinson M. I., Grebel E. K., Gilmore G. F., Evans
N. W., Wyse R. F. G., Harbeck D. R., 2007, AJ, 134, 566Kroupa P., 2001, MNRAS, 322, 231Krumholz M. R., Gnedin N. Y., 2011, ApJ, 729, 36Larson D., et al., 2011, ApJS, 192, 16Leaman R., et al., 2012, ApJ, 750, 33Lee M. G., Yuk I.-S., Park H. S., Harris J., Zaritsky D., 2009, ApJ, 703, 692Ma X., Hopkins P. F., Faucher-Giguère C.-A., Zolman N., Muratov A. L.,
Kereš D., Quataert E., 2016, MNRAS, 456, 2140Martin N. F., et al., 2008a, ApJ, 672, L13Martin N. F., de Jong J. T. A., Rix H.-W., 2008b, ApJ, 684, 1075Martin N. F., et al., 2009, ApJ, 705, 758Martin N. F., et al., 2013a, ApJ, 772, 15Martin N. F., et al., 2013b, ApJ, 779, L10Martínez-Delgado D., Gallart C., Aparicio A., 1999, AJ, 118, 862Mateo M., Olszewski E. W., Morrison H. L., 1998, ApJ, 508, L55Mateo M., Olszewski E. W., Walker M. G., 2008, ApJ, 675, 201McCall M. L., 2014, Monthly Notices of the Royal Astronomical Society,
440, 405McConnachie A. W., 2012, AJ, 144, 4McConnachie A. W., Irwin M. J., 2006, MNRAS, 365, 1263McConnachie A. W., Irwin M. J., Lewis G. F., Ibata R. A., Chapman S. C.,
Ferguson A. M. N., Tanvir N. R., 2004, MNRAS, 351, L94McConnachie A. W., Irwin M. J., Ferguson A. M. N., Ibata R. A., Lewis
G. F., Tanvir N., 2005, MNRAS, 356, 979McConnachie A. W., et al., 2008, ApJ, 688, 1009Merritt D., Graham A. W., Moore B., Diemand J., Terzic B., 2006, AJ, 132,
2685Monaco L., Bellazzini M., Ferraro F. R., Pancino E., 2004, MNRAS, 353,
874Moore B., Ghigna S., Governato F., Lake G., Quinn T., Stadel J., Tozzi P.,
1999, ApJ, 524, L19More S., Diemer B., Kravtsov A. V., 2015, ApJ, 810, 36Muñoz R. R., et al., 2005, ApJ, 631, L137Muratov A. L., Kereš D., Faucher-Giguère C.-A., Hopkins P. F., Quataert
E., Murray N., 2015, MNRAS, 454, 2691Navarro J. F., Frenk C. S., White S. D. M., 1996, ApJ, 462, 563Oñorbe J., Garrison-Kimmel S., Maller A. H., Bullock J. S., Rocha M.,
Hahn O., 2014, MNRAS, 437, 1894Oñorbe J., Boylan-Kolchin M., Bullock J. S., Hopkins P. F., Kereš D.,
Faucher-Giguère C.-A., Quataert E., Murray N., 2015, MNRAS, 454,2092
Oñorbe J., Hennawi J. F., Lukic Z., 2017, ApJ, 837, 106Oman K. A., et al., 2015, MNRAS, 452, 3650Papastergis E., Shankar F., 2016, A&A, 591, A58Papastergis E., Giovanelli R., Haynes M. P., Shankar F., 2015, A&A, 574,
A113Patel E., Besla G., Mandel K., Sohn S. T., 2018, preprint,
(arXiv:1803.01878)Peñarrubia J., McConnachie A. W., Navarro J. F., 2008, ApJ, 672, 904Peñarrubia J., Benson A. J., Walker M. G., Gilmore G., McConnachie
A. W., Mayer L., 2010, MNRAS, 406, 1290
MNRAS 000, 1–19 (2018)

16 S. Garrison-Kimmel et al.
Perez F., Granger B. E., 2007, Computing in Science Engineering, 9, 21Pietrzynski G., et al., 2008, AJ, 135, 1993Pietrzynski G., Górski M., Gieren W., Ivanov V. D., Bresolin F., Kudritzki
R.-P., 2009, AJ, 138, 459Planck Collaboration et al., 2016, A&A, 594, A13Pontzen A., Governato F., 2012, MNRAS, 421, 3464Power C., Navarro J. F., Jenkins A., Frenk C. S., White S. D. M., Springel
V., Stadel J., Quinn T., 2003, MNRAS, 338, 14Price D. J., Monaghan J. J., 2007, MNRAS, 374, 1347Richardson J. C., et al., 2011, ApJ, 732, 76Salomon J.-B., Ibata R. A., Famaey B., Martin N. F., Lewis G. F., 2016,
MNRAS, 456, 4432Sanderson R. E., et al., 2017, preprint, (arXiv:1712.05808)Saviane I., Held E. V., Piotto G., 1996, VizieR Online Data Catalog, 331Sawala T., et al., 2016a, MNRAS, 456, 85Sawala T., et al., 2016b, MNRAS, 457, 1931Sawala T., Pihajoki P., Johansson P. H., Frenk C. S., Navarro J. F., Oman
K. A., White S. D. M., 2017, MNRAS, 467, 4383Schaye J., et al., 2015, MNRAS, 446, 521Sick J., Courteau S., Cuillandre J.-C., Dalcanton J., de Jong R., Mc-
Donald M., Simard D., Tully R. B., 2015, in Cappellari M.,Courteau S., eds, IAU Symposium Vol. 311, Galaxy Masses asConstraints of Formation Models. pp 82–85 (arXiv:1410.0017),doi:10.1017/S1743921315003440
Simon J. D., Geha M., 2007, ApJ, 670, 313Simon J. D., Prada F., Vílchez J. M., Blitz L., Robertson B., 2006, ApJ, 649,
709Simpson C. M., Grand R. J. J., Gómez F. A., Marinacci F., Pakmor
R., Springel V., Campbell D. J. R., Frenk C. S., 2017, preprint,(arXiv:1705.03018)
Somerville R. S., 2002, ApJ, 572, L23Sparre M., Hayward C. C., Feldmann R., Faucher-Giguère C.-A., Muratov
A. L., Kereš D., Hopkins P. F., 2017, MNRAS, 466, 88Springel V., 2005, MNRAS, 364, 1105Springel V., et al., 2005, Nature, 435, 629Stanimirovic S., Staveley-Smith L., Jones P. A., 2004, ApJ, 604, 176Stinson G., Seth A., Katz N., Wadsley J., Governato F., Quinn T., 2006,
MNRAS, 373, 1074Su K.-Y., Hopkins P. F., Hayward C. C., Faucher-Giguère C.-A., Kereš D.,
Ma X., Robles V. H., 2017, MNRAS, 471, 144Teyssier M., Johnston K. V., Kuhlen M., 2012, MNRAS, 426, 1808Tikhonov N. A., Galazutdinova O. A., 2009, Astronomy Letters, 35, 748Tollerud E. J., Bullock J. S., Strigari L. E., Willman B., 2008, ApJ, 688, 277Tollerud E. J., Boylan-Kolchin M., Barton E. J., Bullock J. S., Trinh C. Q.,
2011, ApJ, 738, 102Tollerud E. J., et al., 2012, ApJ, 752, 45Tollerud E. J., Geha M. C., Vargas L. C., Bullock J. S., 2013, ApJ, 768, 50Tollerud E. J., Boylan-Kolchin M., Bullock J. S., 2014, MNRAS, 440, 3511Turk M. J., Smith B. D., Oishi J. S., Skory S., Skillman S. W., Abel T.,
Norman M. L., 2011, The Astrophysical Journal Supplement Series,192, 9
Udalski A., Szymanski M., Kubiak M., Pietrzynski G., Soszynski I., Woz-niak P., Zebrun K., 1999, Acta Astron., 49, 201
Walker M. G., Mateo M., Olszewski E. W., 2009, AJ, 137, 3100Weiner B. J., et al., 2006, ApJ, 653, 1027Wetzel A. R., Hopkins P. F., Kim J.-h., Faucher-Giguère C.-A., Kereš D.,
Quataert E., 2016, ApJ, 827, L23Wilcots E. M., Miller B. W., 1998, AJ, 116, 2363Wolf J., Martinez G. D., Bullock J. S., Kaplinghat M., Geha M., Muñoz
R. R., Simon J. D., Avedo F. F., 2010, MNRAS, 406, 1220Woo J., Courteau S., Dekel A., 2008, MNRAS, 390, 1453Yang S.-C., Sarajedini A., 2012, MNRAS, 419, 1362Zolotov A., et al., 2012, ApJ, 761, 71de Jong J. T. A., et al., 2008, ApJ, 680, 1112de Vaucouleurs G., de Vaucouleurs A., Corwin Jr. H. G., Buta R. J., Paturel
G., Fouqué P., 1991, Third Reference Catalogue of Bright Galaxies.Volume I: Explanations and references. Volume II: Data for galaxies
between 0h and 12h. Volume III: Data for galaxies between 12h and24h.
van Dokkum P. G., Abraham R., Merritt A., Zhang J., Geha M., Conroy C.,2015, ApJ, 798, L45
van den Bosch F. C., Ogiya G., 2018, MNRAS, 475, 4066van der Marel R. P., Kallivayalil N., 2014, ApJ, 781, 121van der Marel R. P., van den Bosch F. C., 1998, AJ, 116, 2220van der Marel R. P., Alves D. R., Hardy E., Suntzeff N. B., 2002, AJ, 124,
2639van der Marel R. P., Fardal M., Besla G., Beaton R. L., Sohn S. T., Anderson
J., Brown T., Guhathakurta P., 2012, ApJ, 753, 8van der Walt S., Colbert S. C., Varoquaux G., 2011, Computing in Science
Engineering, 13, 22
APPENDIX A: OBSERVATIONAL CATALOG
Table A1 lists the properties of the galaxies plotted in Fig-ures 2, 4, 5, and 6, separated in the MW, M31, and Local Field sub-samples. Columns list the distance from the MW and M31, adoptedstellar mass, 3D half-light radius, line-of-sight velocity dispersion,the implied circular velocity at R1/2, and references. Galaxies with-out an entry for (R1/2, V1/2) are not included in Figures 4 and 5, andgalaxies without an entry for σ∗ are not included in Figure 6. Whilewe include the properties of M32 as listed in Tollerud et al. (2014),we remind the reader that it falls outside the bounds of our plots inFigures 4, 5, and 6. Dynamical values (R1/2 and V1/2) adopted fromWolf et al. (2010) were calculated using data from Walker et al.(2009) along with Muñoz et al. (2005); Koch et al. (2007); Simon& Geha (2007) and Mateo et al. (2008).
The references in the last column are as follows: (1) de Vau-couleurs et al. (1991); (2) Clementini et al. (2003); (3) van derMarel et al. (2002); (4) Udalski et al. (1999); (5) Harris & Zarit-sky (2006); (6) Monaco et al. (2004); (7) Mateo et al. (1998); (8)Frinchaboy et al. (2012); (9) Pietrzynski et al. (2009); (10) Wolfet al. (2010); (11) Bellazzini et al. (2004); (12) Pietrzynski et al.(2008); (13) Bellazzini et al. (2005); (14) Lee et al. (2009); (15)Carrera et al. (2002); (16) Bonanos et al. (2004); (17) Martin et al.(2008a); (18) McConnachie et al. (2005); (19) Simon et al. (2006);(20) Geha et al. (2006); (21) Fiorentino et al. (2010); (22) Howleyet al. (2012); (23) Geha et al. (2010); (24) Tikhonov & Galazutdi-nova (2009); (25) Wilcots & Miller (1998); (26) McConnachie &Irwin (2006); (27) Tollerud et al. (2012); (28) Martin et al. (2013a);(29) Conn et al. (2012); (30) Ho et al. (2012); (31) Richardsonet al. (2011); (32) Collins et al. (2013); (33) Martin et al. (2009);(34) Cook et al. (1999); (35) Ibata et al. (2007); (36) McConnachieet al. (2008); (37) Brasseur et al. (2011); (38) Bell et al. (2011);(39) Tollerud et al. (2013); (40) Collins et al. (2010); (41) Yang &Sarajedini (2012); (42) Chapman et al. (2013); (43) Bernard et al.(2010); (44) Kirby et al. (2014); (45) Hunter & Elmegreen (2006);(46) Gieren et al. (2006) (47) Dale et al. (2007); (48) Leaman et al.(2012); (49) Bernard et al. (2009); (50) Martin et al. (2013b); (51)Martínez-Delgado et al. (1999); (52) Saviane et al. (1996); (53)Fraternali et al. (2009); (54) de Jong et al. (2008); (55) Simon &Geha (2007).
APPENDIX B: SATELLITE GALAXIES WITHIN 400 KPC
In the main text, we select r = 300 kpc as the dividing radius be-tween satellites and non-satellite galaxies. However, this is moti-vated primarily by historical reasons, and is somewhat arbitrary –while the virial radius of these hosts range from ' 240 − 300 kpc,
MNRAS 000, 1–19 (2018)

The Local Group on FIRE 17
Name Type rMW rM31 M∗ (R1/2,V1/2) σ∗ References[kpc] [kpc] [M] [pc, km s−1] [km s−1]
MW SatellitesLMC dIrr 50 811 1.1×10⁹ – 20.2 1, 2, 3SMC dIrr 61 812 3.7×10⁸ – 27.6 1, 4, 5Sagittarius dSph 19 792 3.4×10⁷ – 9.9 6, 7, 8Fornax dSph 149 773 2.4×10⁷ (944, 18.3) 10.7 9, 10Leo I dSph 257 922 4.9×10⁶ (388, 15.7) 9.0 10, 11Sculptor dSph 86 766 3.9×10⁶ (375, 16.1) 9.0 10, 12Leo II dSph 236 902 1.2×10⁶ (233, 11.6) 6.6 10, 13Sextans dSph 89 839 7×10⁵ (1019, 12.1) 7.1 10, 14Ursa Minor dSph 78 758 5.4×10⁵ (588, 20.2) 11.5 10, 15Carina dSph 107 842 3.8×10⁵ (334, 11.1) 6.4 9, 10Draco dSph 76 755 3.2×10⁵ (291, 17.7) 10.1 10, 16CVnI dSph 218 864 3×10⁵ (750, 12.6) 7.6 10, 17
M31 SatellitesM33 Spiral 814 206 4.7×10⁹ (2344, 50) – 1, 18, 19NGC 205 dE 828 42 4.7×10⁸ (520, 41) 35.0 1, 18, 20M32 cE 809 23 4.1×10⁸ (110, 79) 92.0 1, 21, 22NGC 147 dE 680 143 9.9×10⁷ (364, 53) 16.0 1, 18, 23IC 10 dIrr 798 252 7.7×10⁷ (612, 35) – 1, 24, 25NGC 185 dE 621 188 6.8×10⁷ (295, 52) 24.0 1, 18, 23And VII dSph 765 218 1.5×10⁷ (972, 23) 13.0 18, 26, 27And XXXII dSph 780 141 1.1×10⁷ – – 28And II dSph 656 184 9.1×10⁶ (1369, 18.6) 7.8 26, 29, 30And I dSph 749 58 7.6×10⁶ (839, 18) 10.2 18, 26, 27And XXXI dSph 760 263 6.5×10⁶ – – 28And III dSph 752 75 1.8×10⁶ (530, 16) 9.3 18, 26, 27And XXIII dSph 774 126 1.7×10⁶ (1335, 12.3) 7.1 29, 31, 32And VI dSph 785 269 1.7×10⁶ (547, 21.5) 12.4 18, 26, 32And XXI dSph 831 134 1.1×10⁶ (1023, 12) 7.2 27, 29, 33And XXV dSph 817 89 1.1×10⁶ (853, 5.2) 3.0 29, 31, 32LGS 3 dE 773 269 9.6×10⁵ (626, 9) 7.9 18, 34And XV dSph 630 179 7.7×10⁵ (355, 7) 4.0 27, 29, 35And V dSph 777 109 6.2×10⁵ (442, 18) 10.5 18, 26, 27And XIX dSph 823 114 5.3×10⁵ (1972, 8.1) 4.7 29, 32, 36And XIV dSph 798 161 3.8×10⁵ (534, 9) 5.3 27, 29And XVII dSph 732 70 3.5×10⁵ (349, 9.5) 2.9 29, 32, 37And XXIX dSph 734 188 2.9×10⁵ (482, 10) 5.7 38, 39And IX dSph 770 40 2.4×10⁵ (726, 19) 10.9 18, 27And XXX dSph 686 148 2.1×10⁵ (356, 20.6) 11.8 29, 32And XXVII dSph 832 74 2×10⁵ (875, 25.3) 14.8 29, 31, 32And XXIV dSph 605 208 1.5×10⁵ – – 31And X dSph 674 134 1.4×10⁵ (338, 11.1) 6.4 29, 32, 37And XXVI dSph 766 103 9.6×10⁴ (296, 14.9) 8.6 32, 37And XI dSph 738 111 7.4×10⁴ (202, 8) 4.6 40, 41And XXII dSph 925 274 7.3×10⁴ (336, 4.8) 2.8 29, 33, 42
Local FieldIC 1613 dIrr 758 520 108 (1387, 18.5) 10.8 1, 43, 44, 45NGC 6822 dIrr 452 898 8.3×10⁷ (637, 40.2) 23.2 44, 45, 46, 47WLM dIrr 933 836 3.9×10⁷ (2092, 28.9) 17.0 1, 18, 48Pegasus dIrr 921 474 6.6×10⁶ (927, 24.6) 12.3 1, 18, 44, 45Cetus dSph 756 680 4.5×10⁶ (816, 14.5) 8.3 26, 44, 49Leo A dIrr 803 1200 3×10⁶ (472, 11.7) 6.7 1, 44, 45And XXXIII dSph 779 349 1.9×10⁶ – – 50Phoenix dIrr 415 868 1.4×10⁶ – – 51Tucana dSph 883 1356 9×10⁵ (279, 33) 15.8 49, 52, 53And XVIII dSph 1217 453 8×10⁵ (417, 17) 9.7 27, 29, 36And XVI dSph 480 323 5.4×10⁵ (179, 7) 3.8 27, 29, 35And XXVIII dSph 661 368 3.4×10⁵ (282, 8) 4.9 29, 35, 39Leo T dIrr 422 991 1.4×10⁵ (152, 13) 7.5 54, 55
Table A1. Observational properties of the galaxies included in our sample: distance from the MW and M31, adopted stellar mass, position in Vcirc(r) space,and line-of-sight stellar velocity dispersion. References are listed in Appendix A.
MNRAS 000, 1–19 (2018)
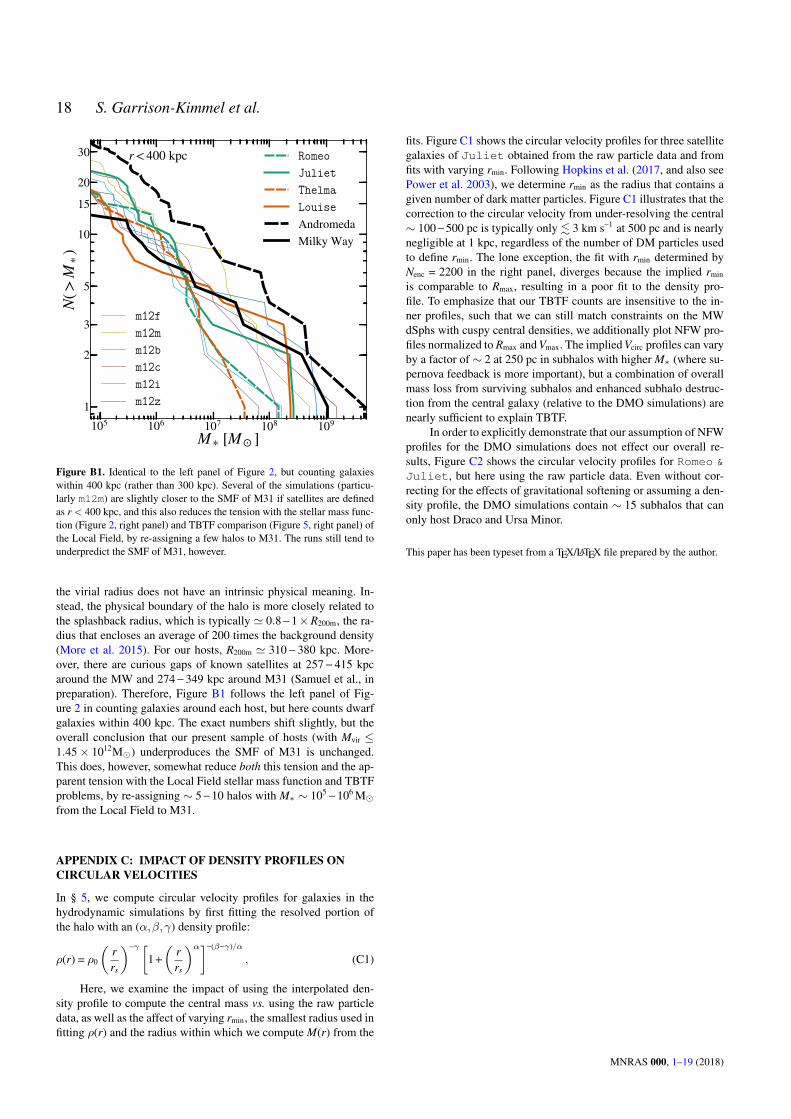
18 S. Garrison-Kimmel et al.
105 106 107 108 109
M [M ]
1
2
3
5
10
1520
30
N(>
M)
r < 400 kpc
AndromedaMilky Way
Figure B1. Identical to the left panel of Figure 2, but counting galaxieswithin 400 kpc (rather than 300 kpc). Several of the simulations (particu-larly m12m) are slightly closer to the SMF of M31 if satellites are definedas r < 400 kpc, and this also reduces the tension with the stellar mass func-tion (Figure 2, right panel) and TBTF comparison (Figure 5, right panel) ofthe Local Field, by re-assigning a few halos to M31. The runs still tend tounderpredict the SMF of M31, however.
the virial radius does not have an intrinsic physical meaning. In-stead, the physical boundary of the halo is more closely related tothe splashback radius, which is typically ' 0.8 − 1×R200m, the ra-dius that encloses an average of 200 times the background density(More et al. 2015). For our hosts, R200m ' 310 − 380 kpc. More-over, there are curious gaps of known satellites at 257 − 415 kpcaround the MW and 274 − 349 kpc around M31 (Samuel et al., inpreparation). Therefore, Figure B1 follows the left panel of Fig-ure 2 in counting galaxies around each host, but here counts dwarfgalaxies within 400 kpc. The exact numbers shift slightly, but theoverall conclusion that our present sample of hosts (with Mvir ≤1.45× 10¹²M) underproduces the SMF of M31 is unchanged.This does, however, somewhat reduce both this tension and the ap-parent tension with the Local Field stellar mass function and TBTFproblems, by re-assigning ∼ 5 − 10 halos with M∗ ∼ 105
− 106 Mfrom the Local Field to M31.
APPENDIX C: IMPACT OF DENSITY PROFILES ONCIRCULAR VELOCITIES
In § 5, we compute circular velocity profiles for galaxies in thehydrodynamic simulations by first fitting the resolved portion ofthe halo with an (α,β,γ) density profile:
ρ(r) = ρ0
(rrs
)−γ [1 +
(rrs
)α]−(β−γ)/α
, (C1)
Here, we examine the impact of using the interpolated den-sity profile to compute the central mass vs. using the raw particledata, as well as the affect of varying rmin, the smallest radius used infitting ρ(r) and the radius within which we compute M(r) from the
fits. Figure C1 shows the circular velocity profiles for three satellitegalaxies of Juliet obtained from the raw particle data and fromfits with varying rmin. Following Hopkins et al. (2017, and also seePower et al. 2003), we determine rmin as the radius that contains agiven number of dark matter particles. Figure C1 illustrates that thecorrection to the circular velocity from under-resolving the central∼ 100 − 500 pc is typically only . 3 km s−1 at 500 pc and is nearlynegligible at 1 kpc, regardless of the number of DM particles usedto define rmin. The lone exception, the fit with rmin determined byNenc = 2200 in the right panel, diverges because the implied rmin
is comparable to Rmax, resulting in a poor fit to the density pro-file. To emphasize that our TBTF counts are insensitive to the in-ner profiles, such that we can still match constraints on the MWdSphs with cuspy central densities, we additionally plot NFW pro-files normalized to Rmax and Vmax. The implied Vcirc profiles can varyby a factor of ∼ 2 at 250 pc in subhalos with higher M∗ (where su-pernova feedback is more important), but a combination of overallmass loss from surviving subhalos and enhanced subhalo destruc-tion from the central galaxy (relative to the DMO simulations) arenearly sufficient to explain TBTF.
In order to explicitly demonstrate that our assumption of NFWprofiles for the DMO simulations does not effect our overall re-sults, Figure C2 shows the circular velocity profiles for Romeo &Juliet, but here using the raw particle data. Even without cor-recting for the effects of gravitational softening or assuming a den-sity profile, the DMO simulations contain ∼ 15 subhalos that canonly host Draco and Ursa Minor.
This paper has been typeset from a TEX/LATEX file prepared by the author.
MNRAS 000, 1–19 (2018)

The Local Group on FIRE 19
8
10
12
15
20
25
30
35
V circ
[km
s1 ]
Vmax = 35km s 1
M = 3.9 × 10⁶M
0.2 0.3 0.6 1 2r [kpc]
107
108
tot [
M k
pc3 ]
Raw dataNenc = 220Nenc = 300Nenc = 500Nenc = 700Nenc = 2200Scaled NFW
Vmax = 23.4km s 1
M = 4.7 × 10⁵M
0.3 0.6 1 2r [kpc]
Vmax = 18.3km s 1
M = 2.2 × 10⁶M
0.3 0.6 1 2r [kpc]
Figure C1. Circular velocity curves (top) and density profiles (bottom) of three satellites around Juliet from the raw particle data, from extrapolating fitteddensity profiles inside the radius enclosing Nenc dark matter particles, and from assuming an NFW profile based on Rmax and Vmax, together with the usualconstraints on the MW dSphs. The colored lines become dashed at r < rmin, i.e. where Vcirc is entirely determined by the fits. The affects of varying Nenc arenegligible, particularly in the context of TBTF, provided that the implied minimum radius is small enough to capture the curvature of the density profile.
0.2 0.3 0.5 0.75 1 1.5 2.5r [kpc]
5
7
10
15
20
30
4050
65
V circ
[km
s1 ]
Milky Way
rMW 300kpcVmax 25km s 1
Leo II
DracoCarinaSculptorLeo I
Ursa Minor
CVnI
FornaxSextans
0.3 0.5 0.75 1 1.5 2.5r [kpc]
M31
And IAnd IIIAnd V
And VIIAnd IX
And XIV
And XV
And XXIAnd XXIX
NGC 147
NGC 185NGC 205
IC 10
LGS 3
M33
And XXIII
And VI
And XXV
And XIXAnd XVII
And XXX
And XXVII
And X
rM31 300kpcVmax 25km s 1
0.3 0.5 0.75 1 1.5 2.5r [kpc]
Local Field
rboth 300kpcreither 1Mpc
Vmax 25km s 1
TucanaAnd XXVIII
Leo A
CetusPegasus
IC 1613
WLM
And XVIII
NGC 6822
105
106
107
108
M[M
]
Figure C2. Identical to the top panels of Figure 4, but here using the raw particle data for the DMO simulations. The conclusions are unchanged: the DMOsimulations contain a wealth of subhalos with circular velocities at r ∼ 300 − 1500 pc that are incompatible with the MW dSphs and the majority of the M31satellites.
MNRAS 000, 1–19 (2018)