the livestock geo-wiki: manure management module
TRANSCRIPT
The Livestock Geo-Wiki:Manure management module
Global Agenda for Sustainable Livestock, 5TH Multi-stakeholder Platform Meeting Cali, Colombia, 7-10 October 2014
Timothy Robinson
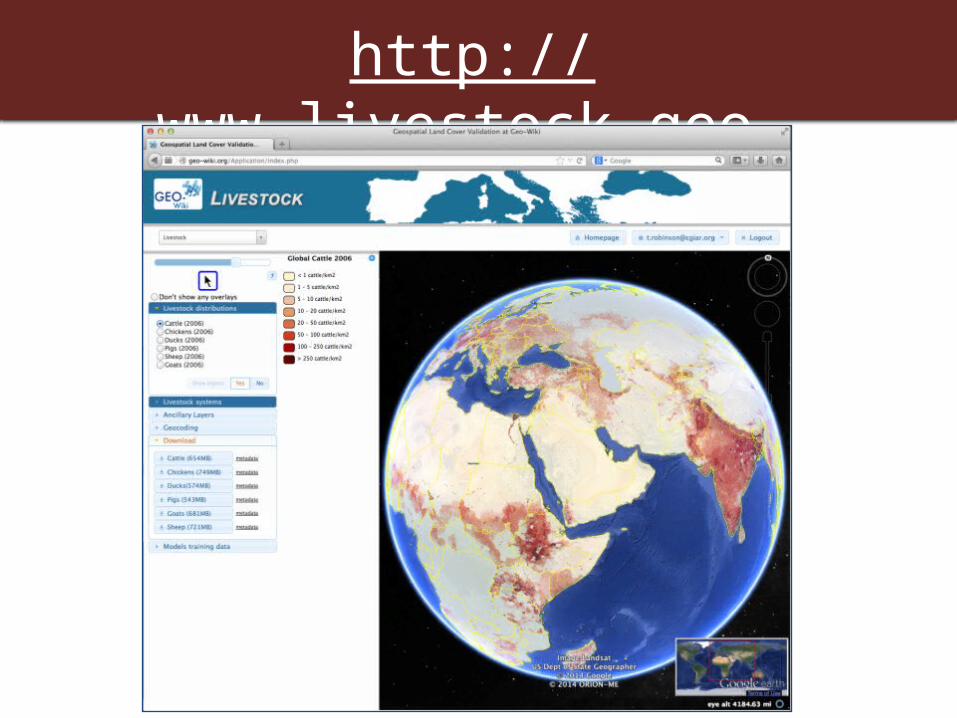
http://www.livestock.geo-wiki.org

Acknowledgements
• Jeroen Dijkman• Pierre Gerber• Giulia Conchedda• Giuseppina • Steffen Fritz• Martina Duerauer• Philip Thornton• Theun Vellinger• Eddy Teenstra• Catherine Pfeifer• Marius Gilbert• Gaëlle Nicolas • Thomas van Boeckel• William Wint• Simon Hay

Overview
• The global livestock sector
• Livestock Geo-Wiki
• Livestock distributions and production systems
• Some examples of thematic maps
• Manure management and mapping
• Developments to date and future plans

The global livestock sector
• Livestock numbers (FAOSTAT 2012)• 1.8 billion cattle and buffalo• 2.5 billion sheep and goats• 1.5 billion pigs• 30.6 billion poultry
• Sector accounts for 30% of the land surface
• 70% of all agricultural land• 8% of human water use

The global livestock sector
Health and nutrition
Poverty and
growth
Climate and natural
resource use
Livestock production

The global livestock sector
Health and nutrition
Poverty and
growth
Climate and natural
resource use
Livestock productionPopulation
growth
Policie
s a
nd
in
sti
tuti
on
al
ch
an
ge
Economic
growth
Urb
anis
atio
n
Trade &
marke
ting
Changing diets
Globalisatio
n Climate
change
Feed prices
Energy prices
Transport

Surface temperature projections
Source: IPCC's Fifth Assessment Report

World population projection (UN 2012)
Source: Gerland et al. 2014Year
Tota
l pop
ulati
on (b
illio
ns)
7 Billion
9.5 Billion
11 Billion
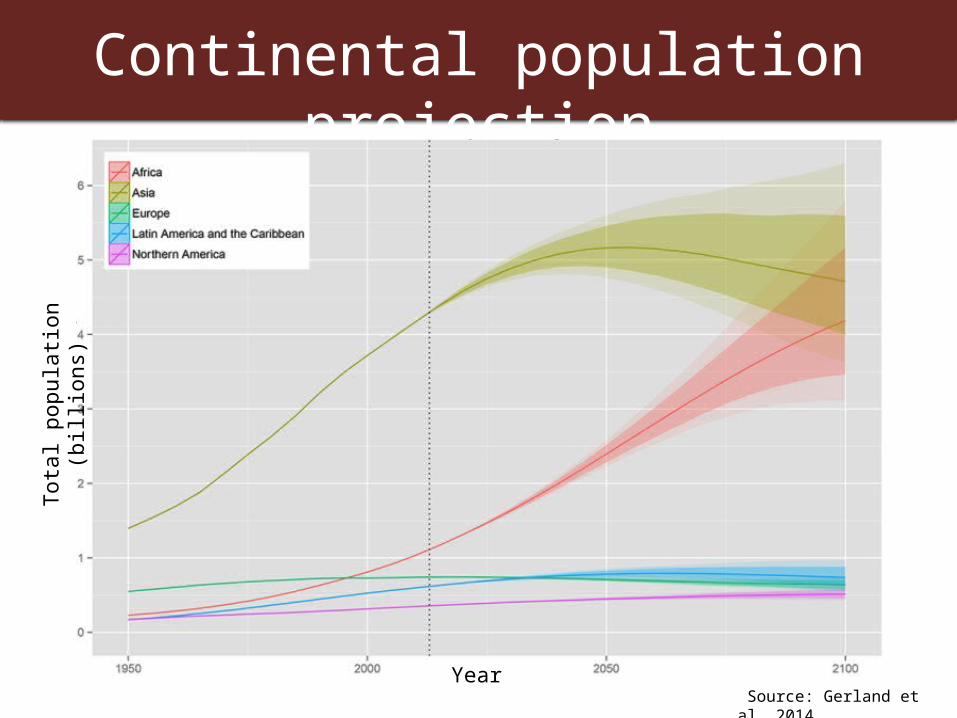
Continental population projection
Source: Gerland et al. 2014Year
Tota
l pop
ulati
on (b
illio
ns)

Urbanisation
Projections
1950
1960
1970
1980
1990
2000
2010
2020
2030
2040
2050
-
10,000
20,000
30,000
40,000
50,000
60,000
70,000
80,000
90,000
Urban
Rural
Hu
ma
n p
op
ula
tio
n in
th
ou
sa
nd
s

GDP projections
Year
Gro
ss D
omes
tic P
rodu
ct (U
S$ B
n)

Livestock to 2030 – demand growth
Meat consumption is increasing faster in developing countries than in developed countries
Mill
ions
of t
onne
s
Year
Developed
Developing

• Demographic and social drivers• Population: + 32% or 9.6 billion people by 2050• Income growth: + 2% per year by 2050• Urbanization: 70% will live in cities by 2050
➜ Growth in demand for animal source foods• + 70% by 2050• + 200 million tonnes of meat
➜ Structural changes in the livestock sector• Shift from ruminant to monogastric• Intensification of production
➜ Impinges on global public goods• Poverty and growth• Climate and natural resources• Health and nutrition
• Integrated approach to socially desirable livestock sector development
• Need reliable data and information to guide policy
The changing livestock sector
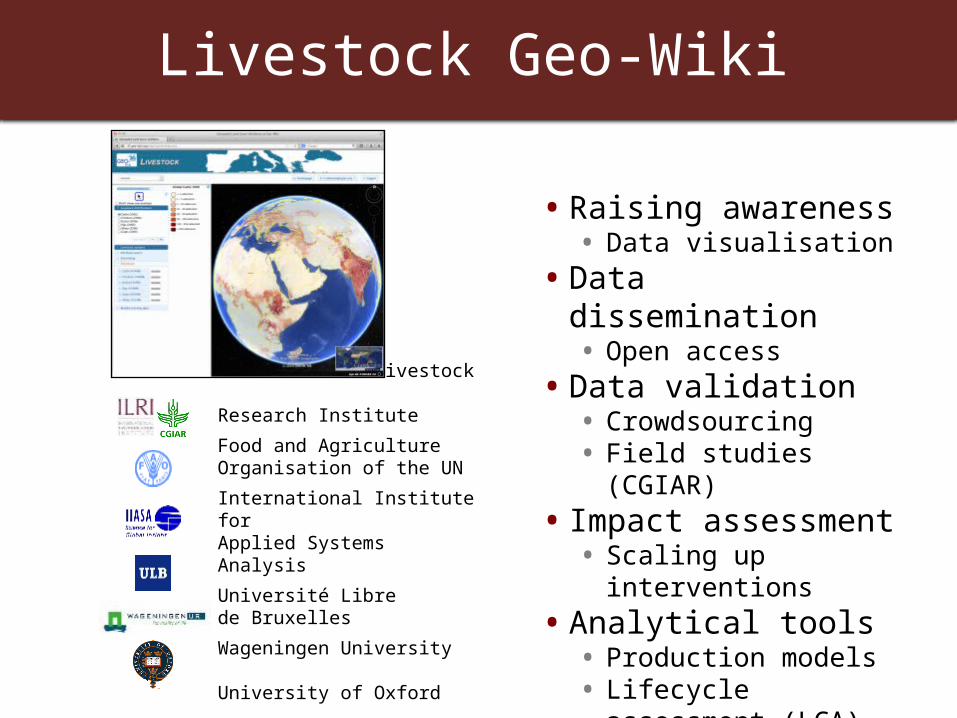
Livestock Geo-Wiki
International Livestock Research Institute
Food and AgricultureOrganisation of the UN
International Institute forApplied Systems Analysis
Université Libre de Bruxelles
Wageningen University
University of Oxford
• Raising awareness• Data visualisation
• Data dissemination• Open access
• Data validation• Crowdsourcing• Field studies (CGIAR)
• Impact assessment• Scaling up interventions
• Analytical tools• Production models• Lifecycle assessment (LCA)• Risk models

• Livestock densities• Livestock production systems• Feed resources and rations• Livestock production
• Poverty and livestock ownership• Food security• Marketing and trade
• Land degradation• Carbon sequestration• Manure management• Greenhouse gas emissions
• Consumption of ASF• Antimicrobial use• Aflatoxins• Disease distribution• Disease risk maps
Livestock Geo-Wiki

Livestock distribution and production
Livestock distribution modelling
Livestock maps by production system
Livestock productionestimates
Global livestockmaps
Production systemsmodelling
Sub-national Livestock data
Herd / production modelling
Data collection, cleaning and geo-registration

Source: Robinson et al (2014)
Livestock distributions
Pigs
Chickens
Ducks
• Updated sub-national statistics• 1km MODIS data (2001-2008)• Standardised to FAOSTAT 2006• New, improved modelling approach• Accuracy estimates (internal)• Cluster computing (SIB)

Cattle distribution (2006)
Source: Robinson et al. (2014)

Livestock production systems
Ruminant systems:• Based on land use and agro-ecological
potential• No actual livestock data
Monogastric systems: • Based on scale and intensification• Use livestock densities
Robinson et al. (2011)

Ruminant production systems
RangelandCropland
Tree cover Artificial surfaces
Rain-fed Irrigated
Arid & Semi-arid LGA MRA MIA
Other UrbanHumid and Sub-humid LGH MRH MIH
Temperate or Tropical highland LGT MRH MIH
Land cover (GLC 2000, Africover)
Agro
-eco
logy
(LG
P, te
mpe
ratu
re, e
leva
tion)

Ruminant production systems (v5)

Mapped based on rural population
Difference(total – extensive)
% backyard
% intensive
Monogastric production systems
Livestock distribution
Extensive production
Intensive production

Chicken systemsO
utpu
t / in
put r
atio
(log
kg-1 s
tock
-1 y
ear-1
)
Log per-capita GDP (US$/person/year)From World Bank data

Chicken systems
Log per-capita GDP (US$/person/year)From World Bank data
Prop
ortio
n of
ext
ensi
vely
rais
ed c
hick
ens

Chicken systems
Extensive chickenproduction
Intensive chickenproduction

Predicting future livestock systems
Log per-capita GDP (US$/person/year)From World Bank data
Prop
ortio
n of
ext
ensi
vely
rais
ed c
hick
ens
2000log GDP per capita c. $ 2.9% extensive c. 83 %
2000
2030
2030log GDP per capita c. $ 3.8% extensive c. 18 %
Chicken production in China

Antimicrobial resistance
Source: Van Boeckel et al. (under submission)
Global antimicrobial use in food animals (mg per 10km pixel)

H7N9 riskGilbert et al. (2014) Predicting the risk of avian influenza A H7N9 infection in live-poultry markets across Asia. Nature Communications DOI: 10.1038/ncomms5116
infection risk (market level)
infection risk (pixel level) infection risk (pixel level)
• 8,943 live-poultry markets• Boosted regression tree models• Local density of live-poultry markets is the
most important predictor of H7N9 infection risk in markets
• This underscores their key role in the spatial epidemiology of H7N9
Observed cases

Poor farmers
AfriPop
Population
Rural Population
Agricultural population
Poor farmers

Poor livestck keepers
Robinson et al. (2011)

Source: Gerber et al. 2013
GHG emission intensity

Available N (all livestock species)
Available N (kg/yr/ha)
200
0
Available N = total N produced - losses

Available N (all livestock species)
Asia Latin America

Herd modelHerd parametersFeed rationsBreeds
Estimating manure production
Production systems
Livestock densities
GLEAMLifecycle Assessment
Production amount
GHG emissions
Outputs
Excreted nutrients
Manure management

Manure management (pigs)
• Lagoon• Slurry (no digestion)• Solid storage• Digester• Pasture• Burned

Manure management (int. pigs)
Dry lot
Lagoon
Liquid/slurry
Pit Solid storage
Proportion of manure managed in the five main systems
100%
0%

Livestock Geo-Wiki

Looking forward
• Build the Livestock Geo-Wiki infrastructure (completed)
• Incorporate new livestock and systems maps (completed)
• Design and implement the manure management module for the pig sector (by end of 2014)
• Expand to cover all livestock species (by end of 2015)
• Establish links to CCAC regional networks for ground-truthing (by end of 2015)
• Search for funding to continue development of the manure management module