the litigation environment of a firm and its impact on ... litigation environment of a firm and its...
TRANSCRIPT

The Litigation Environment of a Firm and its Impacton Financial Policy∗
Alan D. Crane†
April 6, 2009
∗I would like to thank seminar participants at the University of Texas Austin. I would also liketo acknowledge financial support from the Dora Bonham Memorial Fund. All errors are my own.
†Graduate Student, Department of Finance, McCombs School of Business, The Uni-versity of Texas at Austin, 1 University Station B6600, Austin, TX, 78712; email:[email protected]

Abstract
Several studies have documented the impact of litigation on shareholders. Lawsuits can havesignificant explicit costs and have been shown to cause negative stock price reactions whenfiled. However, little is known about how firm managers respond to this costly reality. Anec-dotal evidence suggests firms may adjust financial policy to build a war chest in anticipationof litigation. Alternatively, firms may increase the probability of bankruptcy to reduce thepayoffs to potential litigants and protect shareholder assets. By looking at changes to afirm’s litigation environment, I test whether and how a firm’s risk of litigation impacts itsoverall financial policy. I find that higher litigation exposure leads firms to choose higherleverage. I show that this leverage increase is brought on by an active decision to repurchaseshares. These repurchases appear to be financed with a combination of excess cash andshort term debt as they coincide with a significant decrease in cash holdings and an increasein short term liabilities. Furthermore, these results appear to be stronger in firms that arefinancially distressed and face a higher chance of bankruptcy due to litigation. I show thatthese findings are not the result of changes in an industry equilibrium brought about bythe financial distress of other sued firms, but rather a strategic response to an increase inlitigation risk. These results are consistent with the idea that firms strategically take actionin the face of increased litigation risk to shield their assets from potential fees, judgements,and settlements due to litigation.

1 Introduction
Litigation exposure is an undeniable reality for firms in today’s marketplace. Blockbuster
product liability suits against large corporations frequently make headlines in the news media
and tort reform is a common political talking point. A firm exposed to major civil litigation
can find itself spending millions in legal fees, settlements, and/or judgements. In extreme
cases, large judgments have the potential to force firms into bankruptcy. It is reasonable to
assume that, in equilibrium, a firm’s management takes this risk of litigation into account
in developing operational and financial strategies. In this paper, I examine how firms react
when the legal environment changes. Specifically, I examine whether managers alter financial
policy to shield assets in the face of increased litigation risk.
There are several ways in which firms could use financial policy when considering litigation
exposure. Anecdotal evidence suggests that some firms may increase their cash holdings
(potentially through a reduction in dividends and/or investment) in order to build a “war
chest” to defend against civil litigation.1 Alternatively, firms may choose to increase the use
of debt. As Spier and Sykes (1998) point out, a firm’s capital structure can play an important
role in the bargaining process related to civil litigation if there is a positive probability
that a civil judgment will force the firm into bankruptcy. They show that a firm can use
both secured and unsecured debt to reduce the value of civil claims against the firm. This
finding is due generally to the fact that the civil litigants have a junior claim in bankruptcy.
Strategic financial policy can therefore reduce the cost of litigation borne ultimately by the
shareholders by reducing settlement amounts (which may, ex-ante, reduce the probability of
litigation by reducing the potential payoff to litigants.)
The difficulty in determining whether (or how) firms use financial policy to mitigate exposure
1See for example “Merck & Co Inc - Merck Finally to Answer for VIOXX Injuries”, Market News Pub-lishing, November 9, 2006.
1

to the costs associated with litigation is that the probability that a firm is sued may be related
to the overall financial policy decisions of the firm. There are several reasons why this may be
true. Poor firm performance generally may increase the probability of a lawsuit (for example
if product quality suffers due to cost cutting measures). This same poor performance may
also have a significant impact on the financial policy decisions of the firm. In other cases, the
financial policy decisions of the firm may actually be the cause of the litigation (securities
class-action for example). In either case, this endogeneity with respect to financial policy and
the risk of litigation makes it difficult to study how firms respond specifically to litigation
risk.
In order to mitigate this problem, I take advantage of exogenous variation in the probability
of litigation by proxying for litigation exposure using the number of litigation events within
that firm’s industry over time. Put simply, industry trends in litigation may tell us about the
risk of a lawsuit that a given firm faces even though those industry trends are unrelated to the
specific financial policy decisions of a particular firm. For example, a product liability suit
against firm A may signal a shift in the litigation environment. Due to legal trends, judicial
precedent, or even the success of plaintiffs attorneys, this lawsuit may increase the probability
that firm B is ultimately sued, even though the lawsuit against firm A is independent of firm
B’s financial policy or performance. Using this basic idea and data on actual litigation, I
construct a proxy for exogenous changes in the probability of a lawsuit for each firm through
time and use this measure to test whether (and how) firms respond to changes in their
litigation environment. I validate this proxy by showing that it is significantly related to the
probability that a firm is actually sued.
Using this measure, I test if and how financial policy is impacted by the litigation envi-
ronment. My results indicate that, in periods with a higher risk of litigation, firms choose
higher leverage. I show that this is not a passive result due to firm performance, but rather
an active decision by managers. These firms buy back significantly more shares of common
2

stock when the risk of litigation is high. I show that these share repurchases appear to
be financed with cash holdings and an increase in short-term liabilities. These findings are
consistent with firms increasing the use of debt in order increase bargaining power in the
settlement process and to shield assets from litigants. Finally, I show that these results are
stronger for those firms that are likely to be financially distressed - a result consistent with
the idea that this strategy is effective only when there is a non zero probability that a given
lawsuit will force the firm into bankruptcy. I find no support for the idea that firms may
actually reduce leverage and/or hoard cash in order to build a “war chest” to defend against
litigation.
This paper contributes to the literature in two primary ways. First, it adds to our under-
standing of the litigation process. Prior research has demonstrated the negative impact of
litigation on common shareholders, who ultimately bear the cost of litigation settlements and
judgments.2 This work has established that litigation is costly and that it has a significant
negative impact on shareholders (for example, see the case study of Cutler and Summers
(1987) who examine the costs related to the Texaco-Pennzoil litigation). Several other pa-
pers have established the negative impact of litigation filings on firm stock price as well as
the negative price reaction to firm settlements.3 Because lawsuits are an undeniable and
costly reality to all firms, it is important that we understand if and how management uses
financial policy to best manage the risk and costs associated with litigation. To the best of
my knowledge, this is the first paper that attempts to empirically examine this.4
2Debt holders are largely insulated from litigation concerns provided that a the strict priority rule isfollowed in the case of bankruptcy
3Specifically, Bhagat et al. (1994) examine the wealth effects of inter-firm litigation and show that defen-dant stock price drops and total wealth between firms falls. Bhagat et al. (1998) continue this research byexamining the effect of the type of litigation and by looking at the market reaction upon conclusion of thecase. Karpoff and Lott (1999) show that share price drops after legal settlements.
4The possible exception to this is Haslem (2005), who goes beyond stock price responses by looking atagency conflicts in the settlement process. He looks at litigation and settlements, but focuses on the impactof corporate governance on the settlement process, documenting the fact that the market reacts negatively tosettlements when compared to judgments (even losing judgments) because of the potential agency conflictsassociated with the settlement process. While he provides evidence that certain firm characteristics impactsettlement behavior and market responses, he does not look explicitly at management behavior or financialpolicy
3
Secondly, this paper adds to the literature on the strategic use of financial policy. Several
theoretical works have explored the bargaining aspects of capital structure. These papers
include those on contract bargaining generally (Perotti and Spier (1993)), bargaining with
suppliers and employees (Dasgupta and Sengupta (1993)), bargaining with unions (Bronars
and Deere (1991), and the strategic use of debt in the face of takeovers (Israel (1991)).
Many empirical papers find support for these ideas generally, but this paper provides the
first empirical test demonstrating the strategic use of capital structure when dealing with
litigants - a class of stakeholder that has not been explicitly considered in the prior research.
The rest of the paper is organized as follows: Section 2 describes the data used in the
empirical tests and the construction of the main proxy variable. Section 3 describes the
empirical methodology and results and section 4 concludes.
2 Data and Proxy Construction
2.1 Data
In order to examine the impact of the litigation on a firm’s financial policy, it is necessary
to develop a proxy for the firm’s litigation environment. To do so, I examine those litigation
events that are likely to signal change in the litigation environment of the industry as a
whole. Those industry lawsuits that are most likely to signal this change are likely to be the
large, well publicized cases. To find of a sample of such cases, I use actual litigation events
as reported by the Audit Analytics Litigation database. These data report information on
litigation for the Russell 1000 firms from 1.) legal disclosures filed with the SEC, 2.) litigation
details related to class-action and other civil litigation from disclosures and newswires, and
3.) registrations and legal opinions filed with the SEC. The data cover the period from
4

2000-2007. From this sample of litigation, Audit Analytics collects details related to the
specific litigation, including original date of filing, and if available, the original claim and
settlement amounts.5 While this is in no way an exhaustive list of all litigation faced by the
Russell 1000 firms, it is likely to capture all materially large cases, which for the purposes of
this study are the cases most likely to cause variation in the litigation environment.6
These litigation data are then matched to quarterly financial data over the same period
(January 2000 through December 2007). Cases are matched systematically by CIK code and
firm name to those firms in the CRSP/Compustat merged database. They are then merged
with quarterly financial and return data (calculated from monthly returns) in the quarter in
which the case began. It is important to note that many of the cases may involve multiple
public firms and as such will be matched more than once. Securities class action litigation is
dropped from the sample to avoid endogeneity concerns induced by litigation directly related
to firm financial policy. Table 1 presents the number of cases in the merged sample as well as
summary statistics on the size of the claims and settlements as reported by Audit Analytics.
While there is a relatively large sample of litigation events (7781 cases), the number of cases
with detailed information on the size of the claim or the settlement is relatively small (8.7%
and 10.3% of the overall sample respectively). The second row of table 1 illustrates that for
those cases in which claim data is available, the median claim is quite small at $0.71 million.
However, a number of very large suits skew the results considerably, resulting in a mean
claim value of $31 billion. Because juries are allowed to award no more than the maximum
sought by the plaintiff in the original claim, these numbers are likely to be upwardly biased
relative to the true expected loss the firm faces from the litigation. The settlement numbers,
while also skewed, are more likely to represent the expected value of the litigation. As can
be seen from table 1, the median settlement amount is $7.4 million while the mean of $88.1
million is skewed by a number of very large suits. The standard deviation of the settlement
5Claim and settlement information is available for only a small percentage of the overall cases.6It is unlikely that the omission of certain cases (specifically the small, immaterial ones) will bias the
results discussed below.
5

amounts in the data is $434 million.
The final sample of litigation events covers a wide range of industries. Table 2 shows the
average number of new cases by industry (defined at the 2-digit SIC level) each quarter. The
industry with the largest average number of new lawsuits each quarter is the BUSINESS
SERVICES industry (134 new cases per quarter) which is a broad industry that includes
everything from data processing and security services to advertising and pest control. The
second most sued industry is the CHEMICALS & ALLIED PRODUCTS MFRS which, not
surprisingly, includes the oft-sued pharmaceutical firms and has 118 new lawsuits per quarter.
The industry with the least number of cases in the Audit Analytics data is the Social Services
industry which has approx. .08 new cases per quarter. Table 2 demonstrates that Audit
Analytics provides broad industry coverage with respect to the litigation data. These data
are shown at the 2-digit SIC level for the sake of brevity. As is clear from the BUSINESS
SERVICES category, these industry classifications may be too broad to successfully measure
the litigation environment (it is unlikely that the litigation with respect to pest control will
have a significant impact on the litigation environment of data processing firms). As such,
most of the tests described below will relay on industry classifications defined at the 3 or
4-digit SIC code level.
Table 3 displays summary statistics for the final merged sample used in the analysis. The
variables presented are consistent with the financial policy literature in general (including
work on cash holdings, payout and capital structure) and are used throughout the remainder
of the empirical analysis. Debt/Assets is defined as total debt divided by total assets. Asset
Tangibility is total property, plant, and equipment divided by total assets. Mkt. to Book is
defined as the book value of debt plus the market value of assets divided by the book value
of assets. ROA is earnings before interest, taxes, depreciation, and amortization divided by
total assets. Cash Holdings is cash and short-term investments divided by total assets. Cash
Flow is defined as operating income minus interest, taxes, and dividends divided by assets.
6
2.2 Proxy Construction
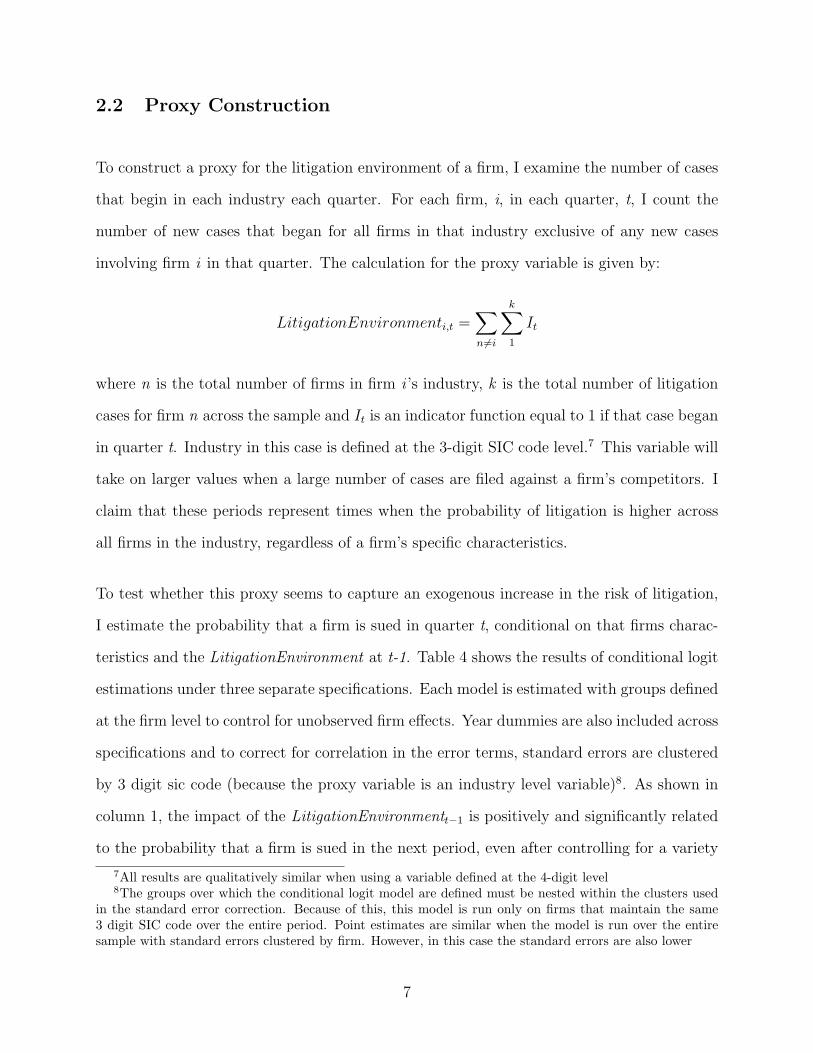
To construct a proxy for the litigation environment of a firm, I examine the number of cases
that begin in each industry each quarter. For each firm, i, in each quarter, t, I count the
number of new cases that began for all firms in that industry exclusive of any new cases
involving firm i in that quarter. The calculation for the proxy variable is given by:
LitigationEnvironmenti,t =∑n6=i
k∑1
It
where n is the total number of firms in firm i ’s industry, k is the total number of litigation
cases for firm n across the sample and It is an indicator function equal to 1 if that case began
in quarter t. Industry in this case is defined at the 3-digit SIC code level.7 This variable will
take on larger values when a large number of cases are filed against a firm’s competitors. I
claim that these periods represent times when the probability of litigation is higher across
all firms in the industry, regardless of a firm’s specific characteristics.
To test whether this proxy seems to capture an exogenous increase in the risk of litigation,
I estimate the probability that a firm is sued in quarter t, conditional on that firms charac-
teristics and the LitigationEnvironment at t-1. Table 4 shows the results of conditional logit
estimations under three separate specifications. Each model is estimated with groups defined
at the firm level to control for unobserved firm effects. Year dummies are also included across
specifications and to correct for correlation in the error terms, standard errors are clustered
by 3 digit sic code (because the proxy variable is an industry level variable)8. As shown in
column 1, the impact of the LitigationEnvironmentt−1 is positively and significantly related
to the probability that a firm is sued in the next period, even after controlling for a variety
7All results are qualitatively similar when using a variable defined at the 4-digit level8The groups over which the conditional logit model are defined must be nested within the clusters used
in the standard error correction. Because of this, this model is run only on firms that maintain the same3 digit SIC code over the entire period. Point estimates are similar when the model is run over the entiresample with standard errors clustered by firm. However, in this case the standard errors are also lower
7

of firm specific variables. This result indicates that an increase of 1 lawsuit among other
firms in that industry in the prior quarter increases the odds that a firm will be sued in the
current quarter by 1.017 times, or approximately 1.7%. This result is significant at the 1%
level. The table also shows firms with lower market to book ratios have an economically
and statistically higher probability of being sued. The odds ratios of this variable is approx-
imately 0.60 across all specifications and is significant at the 5% level. In column 3, ROA
and Industry Returnt−1 are added to the model. Neither impact the point estimates or the
standard errors from the previous specifications in any meaningful way. These results across
the three models are consistent with firms that are performing poorly or are in industries
in which there are recent lawsuits being targets for litigation. It is important to note that
even after controlling for a variety of firm characteristics across the three specifications, the
odds ratio on the LitigationEnvironmentt−1 is always economically and statistically signif-
icant, suggesting that this is a reasonable proxy for an exogenous change in the litigation
environment.
Finally, in columns 2 and 3 of table 4, the firm’s debt to assets ratio is included. It is of note
that this does not appear to be an important determinant of the probability of litigation.
Because the debt to assets ratio is relatively time invariant, these estimates may be impacted
by the firm level conditioning in the logit model; nonetheless, it may suggest that if firms are
adjusting their capital structure in response to litigation they may be doing so not to prevent
lawsuits, but instead to increase bargaining power in the settlement of those lawsuits.
3 Results
Having developed a proxy for a firm’s litigation environment, I examine firm financial policy
decisions to determine if the litigation environment plays a role in those decisions. Specifi-
cally, I look at firm cash holdings, payout policy (specifically stock repurchases), and capital
8

structure. Examining the firms’ capital structure allows us to better understand if firms are
acting strategically to increase their bargaining power in the face of litigation. Cash holdings
will tell us if firms that face a higher probability of litigation maintain higher cash reserves
in support of the ”war chest” theory. Alternatively, firms may reduce their cash holdings,
either through irreversible investment or increased payout, in an effort to reduce the amount
of liquid assets available to potential litigants. Finally, looking at a firm’s payout policy will
help to determine whether managers are taking active steps in the face of this litigation,
or whether capital structure and/or cash holdings are changing passively as a result of firm
performance.
Each of these particular areas of financial policy has extensive literature related to the cross
sectional determinants. I utilize this previous literature and supplement those previously
identified cross-sectional determinants with my proxy for a change in litigation environment.
Harris and Raviv (1991) provide a very extensive summary of capital structure literature as
of 1991. Titman and Wessels (1988) and Hovakimian et al. (2001) provide evidence of the
cross-sectional determinants of debt levels that I rely on in the tests of capital structure.
Rajan and Zingales (1995) look at capital structure internationally but also distill the list of
cross-sectional control variables into a smaller, more manageable set in the face of limited
data. Opler et al. (1999) provide a good summary of literature related to cash holdings.
This work establishes a set of important cross-sectional determinants of the cash holdings of
firms. Finally, Fenn and Liang (2001) provide a review of the literature related to payout
policy as well as a set of control variables for payout policy analysis.
3.1 Capital Structure
If firms are in fact acting strategically to increase their litigation bargaining power, then
those firms facing a higher probability of litigation should utilize more debt in their capital
9

structure. Using the panel of firm specific data described above, I am able to test this
hypothesis. Using the 7 year sample of quarterly data, I run a pooled OLS regression which
includes my proxy variable for the litigation environment. The specification for these tests
generally is:
Debt/Assetsi,t = β0 + β1Xi,t + γLitigationEnvironmentt−1 + εi,t
where Xi,t represents a vector of control variables for firm i at time t. The vector of control
variables includes those shown to be important in the cross-sectional tests of capital structure
(see Titman and Wessels (1988), Hovakimian et al. (2001), Rajan and Zingales (1995), and
Harris and Raviv (1991).) These include Ln Size, Mkt. to Book, Asset Tangibility, Ln Sales,
ROA, and Returnt−1.
Table 5 shows the results of these regressions. Column 1 of the table shows a basic regression
specification using the firm’s litigation environment as an explanatory variable along with
basic firm characteristics and firm fixed effects. This regression shows that as the risk of
litigation increases, leverage actually increases as well. Columns 2-5 of table 5 add various
combinations of control variables and indicator dummies and show that generally, when the
risk of litigation is high, so is firm leverage. These results show that an increase of 1 lawsuit
over a firm’s industry mean is associated with an increase in firm leverage between 0.00012
and 0.00017. These results are robust to using firm-year dummies (Columns 2-4), as well
as to using firm and firm plus year dummies (Column 1 and 5 respectively.) This result is
statistically significant across all of these specifications at the 1% level. In terms of economic
significance, a coefficient of 0.00017 represents an increase of roughly 0.06% of the overall
mean leverage and 0.11% of the median leverage for each additional lawsuit.
As expected, Ln Size, Asset Tangibility, Ln Sales, ROA, and the lagged return are all signifi-
10
cant across the specifications in columns 1-5 and are generally consistent with prior literature.
The coefficient on Ln Size ranges from -0.025 to -0.046 and is statistically significant at the
5% level or better. This result is consistent with prior evidence that smaller firms have lower
leverage. The coefficients on Asset Tangibility range from 0.23 to 0.28 and are statistically
significant at the 1% level across all specifications. Ln Sales is marginally significant in all
specifications, with the largest effect having a coefficient generally around 0.009.
One potential concern regarding the use of the industry lawsuits as a proxy is that this
variable may merely be capturing firm and industry performance. If firms are more likely to
be sued when performance is poor and firms in the same industry suffer poor performance
at similar times, then this variable may only be capturing this effect. In order to control for
this, I include both firm and industry performance variables including ROA, lagged industry
and firm returns, and Mkt. to Book. Even after controlling for this issue, the litigation
environment variable is still positive and significant. ROA and Quarterly Returny−1 are
negative and significant across specifications, consistent with the idea that better performing
firms have less debt. For these specifications, Mkt. to Book is not statistically significant;
this result is inconsistent with much of the prior literature. This is largely attributable to the
specific sample used in this case as well as the firm-year fixed effects. It is worth noting that
the R2 value across the specifications in Columns 1-5 is greater than 70%, indicating that
the variables included explain a great deal of the within firm and within firm-year variation.
Finally, in Column 6 of table 5, I present a simple changes model. This model calculates
the changes of all variables from their value 4 quarters before. This has the same effect as
the fixed effects regression in terms of removing unobserved heterogeneity, but it may be
easier to interpret. Under this specification, the coefficient on LitigationEnvironmentt−1 is
still positive and significant, albeit slightly smaller. Nonetheless, under this simple change-
on-change framework, the overall results still hold.
11

In unreported results, I also conducted this analysis in a Tobit framework to account for
the truncation of leverage at 0 (Hovakimian et al. (2001)). These results are qualitatively
similar, although the interpretation of firm dummies is difficult in the non-linear setting. The
results are also robust to using longer lags to proxy for the litigation environment, including
LitigationEnvironmentt−2 and LitigationEnvironmentt−4.
3.2 The Mechanism for Increased Leverage
The above results support the idea that firms may be using their capital structure strategi-
cally as the risk of litigation arises. In the following section I investigate how this increase
in leverage occurs. On one hand, it is possible that as the litigation environment changes,
firms suffer in terms of performance. If this poor performance leads to write-downs of assets
then the increase in leverage may be largely mechanical, and not in fact attributable to some
strategic decision made by firm management. On the other hand, firms may be taking active
measures that increase leverage, either through a reduction in assets via dividends or share
repurchases, or by raising additional debt capital.
I examine this issue by looking first at the payout policy of firms using a pooled OLS
regression similar to the analysis for capital structure above. The specification is:
Payouti,t = β0 + β1Xi,t + γLitigationEnvironmentt−1 + εi,t
where Xi,t represents a vector of control variables for firm i at time t. Payout is defined as
either Payout/Assets,calculated as total dividends plus total repurchases divided by assets
or Common Share Repurchase/Assets depending on the specification. I again use control
variables based on prior literature on the determinants of payout policy. As in Fenn and
12

Liang (2001), I include Ln Size, Mkt. to Book, Debt/Assets, and ROA as control variables.
These regressions also includes firm-year dummies, so estimates are based on variation within
firm-years.
Table 6 shows the results from these regressions. Column 1 presents the results of the
regression specification using total payout as the dependent variable. Due to the lack of
variation in dividends generally, this model has relatively little explanatory power overall.
As expected, these results show that Payout/Assets is increasing in firm performance (as
measured by Mkt. to Book and ROA). The coefficients (t-stats) are 0.00031 (1.86) and
0.0037 (2.33) respectively. In this specification, the coefficient on Litigation Environmentt−1
is statistically significant but with a coefficient of zero at four decimal places. As the risk of
litigation increases, total payout appears to be relatively unaffected.
Given the steady nature of dividends, this is not surprising. In Columns 2-4 I estimate
models excluding dividends and preferred share repurchases. In these models, Litigation
Environmentt−1 is statistically significant at the 5% level (10% in specification 2). The
coefficients range from 0.00055 to 0.00067. Economically, these coefficients represent between
14% and 18% increase over the mean Common Share Repurchase/Assets over the entire
sample. In these specifications Mkt. to Book is positive and significant at the 5% level with
a coefficient of between 0.84 and 0.85. The coefficients on ROA range from -0.76 to -0.81
and are significant at the 1% level.
3.3 Funding Share Repurchase
Overall, the results suggest that managers are in fact taking active measures to increase
leverage when the risk of litigation is high. While dividends do not appear to be effected,
share repurchases are significantly higher when a firm’s peers face a greater number lawsuits.
13

In unreported tests, I find no evidence that firms are raising more debt capital. It appears
that the effect on leverage is exclusively through share repurchase. However, the question
still remains as to where the funds for the repurchase of these shares comes from.
To answer this question, I look first at cash holdings using a pooled OLS regression repre-
sented by the following equation:
CashHoldingsi,t = β0 + β1Xi,t + δi + γ∆LegalEnvironmentt−1 + εi,t
where Xi,t represents a vector of control variables for firm i at time t and δi represents
firm-year fixed effects. This regression is run on quarterly data where the control vari-
ables included are based on those variables determined by Opler et al. (1999) to have a
significant impact on firm cash holdings. These include Ln Size, Cash Flow, Net Working
Capital/Assets, Mkt. to Book, Debt/Assets, R&D/Sales, and lagged returns. The regression
also includes firm-year fixed effects.
Table 7, column 1, shows the results of this regression. We see that cash holdings are lower
for firms facing a higher risk of litigation. The coefficient is -0.00006 and is significant
at the 5% level. Mkt. to Book, Cash Flow, and both lagged firm and industry returns
are positively and significantly related to cash holdings. The coefficients on Net Working
Capital/Assets and Debt/Assets are both negative and significant. While the coefficient
on Litigation Environmentt−1 is small, it still represents approximately 0.03% of the overall
mean cash holdings, suggesting that, on the margin, an increase in litigation exposure does
reduce the cash holdings of firms on average. Column 2 of table 7 shows no significant effect
of the litigation environment on total current assets.
The last two columns of table 7 examine another potential source of funds for the share repur-
chases shown above. Firms, in addition to reducing cash, may increase short term liabilities.
14

By using this short term leverage, firms may be provided with an additional source of capital
that they can use to fund share repurchases. We see from columns 3 and 4 that the litigation
environment has a positive and significant effect on both accounts payable and total current
liabilities. In column 3, the coefficient on Litigation Environmentt−1 is 0.00004 (or roughly
0.02% of the overall average accounts payable. The coefficient of Litigation Environmentt−1
on total current liabilities is 0.00018, an increase of 0.08% for each additional lawsuit. Taken
in conjunction with the results on cash holdings, these results suggests that firms are increas-
ing their short term liabilities, and at the same time reducing their cash holdings when faced
with an increased risk of litigation. These two results suggest a potential source of funds
for these firms to increase leverage through share repurchase. Additionally, these results
suggests that, on average, firms are not hoarding cash in preparation for litigation but are
using cash to increase their overall leverage
3.4 Litigation and Industry Equilibrium
A potential alternative explanation for why firms’ capital structure may change in response
to a litigation event within the industry is that the litigation event may have triggered a
shift in the industry leverage equilibrium. Shleifer and Visny (1992) suggest that the leverage
within an industry is determined in part by the competitive nature of that industry. Certain
firms position themselves to take advantage of growth opportunities in market up-swings
(high leverage firms) while other firms in that industry may choose low leverage, leaving
debt capacity so that they can acquire assets of highly levered firms during downturns in
the business cycle. Significant firm litigation may lead to financial distress on the part of
one firm within the industry, resulting in a shift in the equilibrium leverage across firms
within that industry. Empirically, if what we are observing in capturing industry litigation
is competition, we would expect those firms with lower leverage in an industry to be in
a position to take advantage of distressed assets. These low leverage, low financial distress
15

firms should be the ones increasing their leverage and at the same time increasing investment.
Alternatively, as Spier and Sykes (1998) point out, the use of leverage to strategically impact
the litigation process is only a valid strategy when the risk of bankruptcy is real. If the
behavior we observe with respect to capital structure and litigation is strategic, we would
expect those firms with a higher probability of bankruptcy to increase their leverage more
than those firms who are unlikely to default. This empirical prediction is counter to what
we would expect if our leverage effect was do to industry competition and a change in the
industry equilibrium leverage.
To test between these alternatives, I utilize the regression framework presented in table 5 and
proxy for the probability of financial distress. I use three proxies for financial distress:firm
size, above median leverage within the industry, and below investment grade or unrated
debt. Each of these proxies is interacted with Litigation Environmentt−1. Results for these
regressions are given in table 8. Column 1 presents results of the standard specification
from table 5. Also included in this specification is an interaction term of firm size with
my proxy of the litigation environment. If smaller firms are more likely to be bankrupt
by litigation, then we would expect that those firms are more likely to adjust their capital
structure strategically. As shown in Column 1, the results are consistent with this hypothesis.
Larger firms are significantly less likely to increase leverage compared to smaller firms during
periods when the litigation risk is high.
In column 2 of table 8 I look at the effect of a firm’s relative leverage. I let High Debt
Dummyt−1 equal 1 if the firm has higher than its industry median leverage in the prior
quarter and zero otherwise. This term is then interacted with Litigation Environmentt−1.
The results suggest that firms that are most likely to be financially distressed (those with
the highest leverage) will increase their leverage significantly more than those firms with low
leverage. This result is significant at the 10% level and is consistent with the results on firm
16

size.
Finally, column 3 of table 8 examines the interaction of Litigation Environmentt−1 with
Investment Grade Dummyt−1, which is set to 1 if the firm has an investment grade debt
rating and is zero if the firm is either not investment grade or is unrated. The results are
consistent with those from columns 1 and 2 and show that more credit worthy firms adjust
their debt/assets ratios less than those low credit quality firms when the litigation exposure
is high. Taken together, these results suggest that the actions firms take when faced with an
increased risk of litigation are a strategic response to the litigation risk and not a response
to a shift the industry leverage equilibrium. Additionally, I find no evidence of an increase
in investment when litigation risk is higher, suggesting that I am not capturing those firms
that have positioned themselves to take advantage of distressed assets.
A second related alternative explanation is that litigation against another firm in the industry
may result in the undervaluation of peer firms. If the market believes that peer firms have
similar liabilities as the sued firm, these firms may find their market values falling. If the
management of these firms knows the firm does not in fact have such a liability, they may
repurchase shares in an effort to time the market (Baker and Wurgler (2002)) or signal
firm value (Vermaelen (1981)). In such a case, controlling for firm and industry returns in
the regression may not adequately control for the effect. However, if this is the case, we
would expect those firms who find themselves in industries that are being sued but are not
sued themselves to subsequently outperform. In untabulated results, I find no evidence that
these firms’ returns are higher in the following quarters or year, suggesting that this observed
behavior is not a response to undervaluation but a strategic response to the risk of litigation.
17
3.5 Litigation Reform
Thus far, I have proxied for changes in the litigation environment by examining the number
of lawsuits in a given industry. However, the litigation environment for a firm can also be
altered by legislation and court decisions that make it harder or easier to sue a given firm
or an industry. To provide further support for the results above without the noise induced
by the litigation proxy variable, I turn to federal tort reform acts that reduced the expected
litigation claims against firms within particular industries at some point in time.
While there have been 29 federal tort reforms according the American Tort Reform Asso-
ciation, many of these reforms apply to individuals or government agencies. However, two
specific tort reforms relate to reducing the liability of particular industries.9 These include
the Black Lung Benefits Act of 1972 and the The General Aviation Revitalization Act of
1994.10 The former set up a federal fund to pay coal miners suffering from pneumoconiosis,
reducing the incentive to litigate against mining companies. The later placed limitations on
the ability of litigants to sue aircraft manufacturers in the event of an airline crash.
I examine the firms of both the coal mining and aircraft manufacturing industries, before
and after the tort reforms described above to see if behavior changes are consistent with the
results described in the previous sections. To do this, I split each industry into constrained
firms (closer to financial distress) and unconstrained firms. I then look at these firms both
before and after the tort reforms were enacted. This difference-in-differences approach will
show whether the litigation reform appears to have changed the financial policy decisions of
those firms. Based on the results above, prior to the tort reform (when the risk of litigation
was higher) we would expect those constrained firms to hold less cash, have more short term
debt (in terms of accounts payable) and repurchase more shares. We would then expect this
9There are many more state level tort reforms, however, because most public companies do business inmultiple states, it is difficult to determine which reforms affected which firms
10The Private Securities Litigation Reform Act of 1995 was specifically excluded from this analysis becauseof the endogeneity associated with financial policy and securities litigation
18

difference to be smaller after the litigation reform as the risk to those firms decreases.
Table 9 shows the results of this analysis. Each column represents one of the three financial
policy variables (cash holdings, accounts payable, and share repurchases). Constrained firms
(those more likely to be placed in financial distress by litigation) are defined as those firms
smaller than the median firm within their industry in a given year.11 Column 1 shows that
the constrained firms hold less cash in general. We see that after litigation reform, this
difference is smaller, consistent with the idea that these firms no longer have to shield as
many of their assets. We see that with respect to accounts payable, the point estimates are
consistent with the constrained firms using more short term debt and that this difference is
smaller after the reduction in litigation exposure. However, these results are not statistically
significant due to the low power of this test (with only two industries). Finally, column
3 shows the results for the share repurchase behavior of the firms. Again the results are
insignificant but the point estimates are consistent with the results in the previous section.
Overall, while not overwhelmingly conclusive, these results suggest provide support for the
large sample evidence without the need of a noisy proxy variable.
4 Conclusion
Litigation is an undeniable and costly realty for all firms in today’s market place. While a
great deal is known about the costs associated with litigation12, very little is known about
the role that financial policy plays in dealing with this costly reality. Taking advantage of
exogenous variation in the probability of litigation I use actual litigation events to construct
a proxy for each firms litigation environment and test whether that environment impacts
firm financial policy. My results indicate that, in periods with a higher risk of litigation,
11The results using debt levels to proxy constraint are qualitatively similar12See Haslem (2005) for a summary of these findings
19

firms choose higher leverage. I show that this is not a passive result due to firm performance,
but rather an active decision by managers. These firms buy back significantly more shares
of common stock when the risk of litigation is high and finance these repurchases using
cash holdings and an increase in short-term liabilities. These findings are consistent with
firms increasing the use of debt in order increase bargaining power in the settlement process.
Finally, I show that these results are stronger for those firms that face a greater risk of
default due to litigation. After legislative reform, differences in financial policy between the
firms most at risk of litigation and other firms in the industry decrease. These results are
consistent with the idea that firms use financial policy strategically to increase bargaining
power and ultimately limit the payoffs to potential litigants. Furthermore, I find no evidence
that firms on average are hording cash in preparation for legal battles.
Overall, these results suggest that there may be a role for financial policy in dealing with
civil litigation. They suggest that additional work in the area would be valuable in helping
to determine to what extent managers are successful in mitigating litigation exposure and
minimizing costs.
20
References
Baker, Malcolm and Wurgler, Jeffrey. Market timing and capital structure. The Journal of
Finance, 57(1):1–32, 2002.
Bhagat, Sanjai, Bizjak, John, and Coles, Jeffrey. The shareholder wealth implications of
corporate lawsuits. Financial Management, 27:5–27, 1998.
Bhagat, Sanjai, Brickley, James, and Coles, Jeffrey. The wealth effects of interfirm lawsuits.
Journal of Financial Economics, 35:221–247, 1994.
Bronars, Stephen and Deere, Donald. The threat of unionization, the use of debt, and the
preservation of shareholder wealth. Quarterly Journal of Economics, 106(1):231–254, 1991.
Cutler, David M. and Summers, Lawrence H. The costs of conflict resolution and finan-
cial distress: Evidence from the Texaco-Pennzoil litigation. Rand Journal of Economics,
19:157–172, 1987.
Dasgupta, Supdipto and Sengupta, Kunal. Sunk investment, bargaining and choice of capital
structure. International Economic Review, 34(1):203–220, 1993.
Fenn, George and Liang, Nellie. Corporate payout policy and managerial stock incentives.
Journal of Financial Economics, 60:45–72, 2001.
Harris, Milton and Raviv, Artur. The theory of capital strucutre. The Journal of Finance,
46(1):297–355, 1991.
Haslem, Bruce. Managerial opportunism during corporate litigation. The Journal of Finance,
60(4):2013–2041, 2005.
Hovakimian, Armen, Opler, Tim, and Titman, Sheridan. The debt-equity choice. The
Journal of Financial and Quantitative Analysis, 36(1):1–24, 2001.
21

Israel, Ronen. Capital structure and the market for corporate control: The defensive role of
debt financing. The Journal of Finance, 46(4):1391–1409, 1991.
Karpoff, Jonathan and Lott, John. On the determinants and importance of punitive damage
awards. Journal of Law and Economics, 42:527–573, 1999.
Opler, Tim, Pinkowitz, Lee, Stulz, Rene, and Williams, Rohan. The determinants and
implications of corporate cash holdings. Journal of Fiancial Economics, 52:3–46, 1999.
Perotti, Enrico and Spier, Kathryn. Capital structure as a bargaining tool: The role of
leverage in contract renegotiation. The American Economic Review, 83(5):1131–1141,
1993.
Rajan, Raghuram and Zingales, Luigi. What do we know about capital structure? some
evidence from international data. The Journal of Finance, 50(5):1421–1460, 1995.
Shleifer, Andrei and Visny, Robert. Liquidation value and debt capacity: A market equilib-
rium approach. The Journal of Finance, 47(4):1343–1366, 1992.
Spier, Kathryn and Sykes, Alan. Capital strucutre, priority rules, and the settlement of civil
claims. International Review of Law and Economics, 18(2):187–200, 1998.
Titman, Sheridan and Wessels, Roberto. The determinants of capital structure. The Journal
of Finance, 43(1):1–19, 1988.
Vermaelen, Theo. Common stock repurchases and market signalling *1: An empirical study.
Journal of Financial Economics, 9(2):139–183, 1981.
22

Table 1: Summary Statistics: Litigation FilingsThis table presents summary statistics related to the cases in the Audit Analytics databasethat were successfully matched with the CRSP/Compustat merged database. Claim andsettlement means and medians are calculated conditional on being reported
Variable Observations Mean($MM) Median($MM) Std.Dev($MM)
Cases 7781
Claim 681 31,000 0.71 783,000
Settlement 806 88.1 7.4 434
23
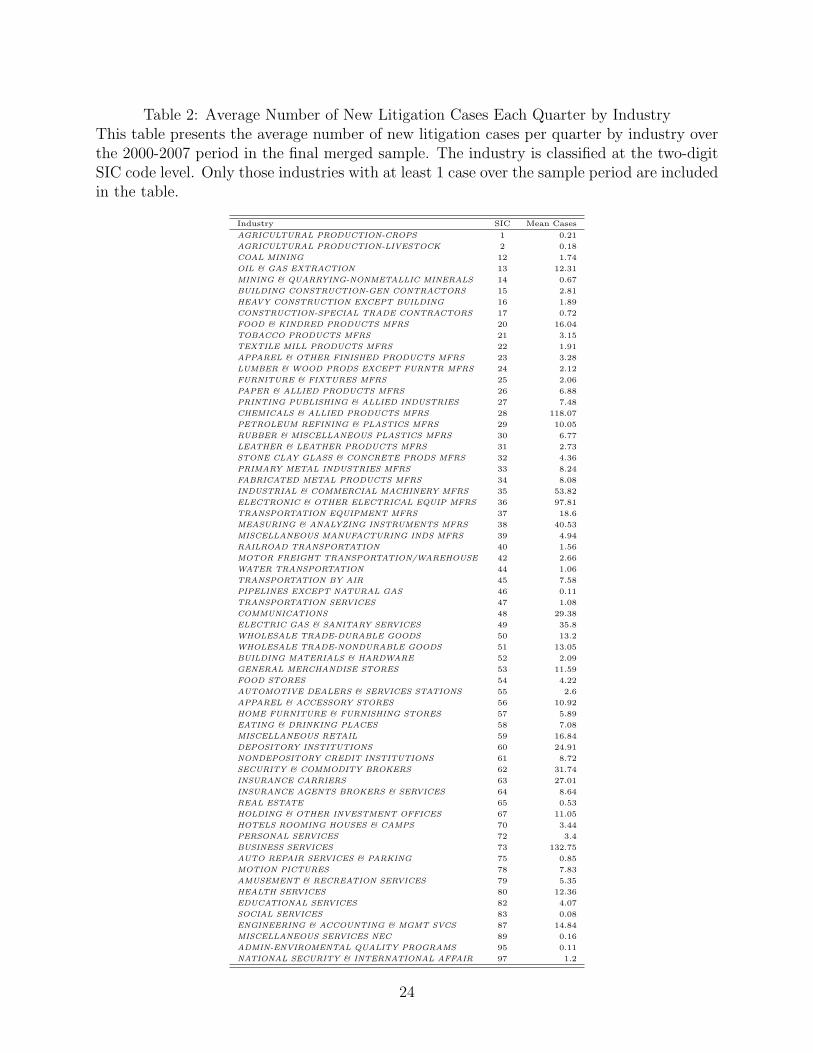
Table 2: Average Number of New Litigation Cases Each Quarter by IndustryThis table presents the average number of new litigation cases per quarter by industry overthe 2000-2007 period in the final merged sample. The industry is classified at the two-digitSIC code level. Only those industries with at least 1 case over the sample period are includedin the table.
Industry SIC Mean Cases
AGRICULTURAL PRODUCTION-CROPS 1 0.21
AGRICULTURAL PRODUCTION-LIVESTOCK 2 0.18
COAL MINING 12 1.74
OIL & GAS EXTRACTION 13 12.31
MINING & QUARRYING-NONMETALLIC MINERALS 14 0.67
BUILDING CONSTRUCTION-GEN CONTRACTORS 15 2.81
HEAVY CONSTRUCTION EXCEPT BUILDING 16 1.89
CONSTRUCTION-SPECIAL TRADE CONTRACTORS 17 0.72
FOOD & KINDRED PRODUCTS MFRS 20 16.04
TOBACCO PRODUCTS MFRS 21 3.15
TEXTILE MILL PRODUCTS MFRS 22 1.91
APPAREL & OTHER FINISHED PRODUCTS MFRS 23 3.28
LUMBER & WOOD PRODS EXCEPT FURNTR MFRS 24 2.12
FURNITURE & FIXTURES MFRS 25 2.06
PAPER & ALLIED PRODUCTS MFRS 26 6.88
PRINTING PUBLISHING & ALLIED INDUSTRIES 27 7.48
CHEMICALS & ALLIED PRODUCTS MFRS 28 118.07
PETROLEUM REFINING & PLASTICS MFRS 29 10.05
RUBBER & MISCELLANEOUS PLASTICS MFRS 30 6.77
LEATHER & LEATHER PRODUCTS MFRS 31 2.73
STONE CLAY GLASS & CONCRETE PRODS MFRS 32 4.36
PRIMARY METAL INDUSTRIES MFRS 33 8.24
FABRICATED METAL PRODUCTS MFRS 34 8.08
INDUSTRIAL & COMMERCIAL MACHINERY MFRS 35 53.82
ELECTRONIC & OTHER ELECTRICAL EQUIP MFRS 36 97.81
TRANSPORTATION EQUIPMENT MFRS 37 18.6
MEASURING & ANALYZING INSTRUMENTS MFRS 38 40.53
MISCELLANEOUS MANUFACTURING INDS MFRS 39 4.94
RAILROAD TRANSPORTATION 40 1.56
MOTOR FREIGHT TRANSPORTATION/WAREHOUSE 42 2.66
WATER TRANSPORTATION 44 1.06
TRANSPORTATION BY AIR 45 7.58
PIPELINES EXCEPT NATURAL GAS 46 0.11
TRANSPORTATION SERVICES 47 1.08
COMMUNICATIONS 48 29.38
ELECTRIC GAS & SANITARY SERVICES 49 35.8
WHOLESALE TRADE-DURABLE GOODS 50 13.2
WHOLESALE TRADE-NONDURABLE GOODS 51 13.05
BUILDING MATERIALS & HARDWARE 52 2.09
GENERAL MERCHANDISE STORES 53 11.59
FOOD STORES 54 4.22
AUTOMOTIVE DEALERS & SERVICES STATIONS 55 2.6
APPAREL & ACCESSORY STORES 56 10.92
HOME FURNITURE & FURNISHING STORES 57 5.89
EATING & DRINKING PLACES 58 7.08
MISCELLANEOUS RETAIL 59 16.84
DEPOSITORY INSTITUTIONS 60 24.91
NONDEPOSITORY CREDIT INSTITUTIONS 61 8.72
SECURITY & COMMODITY BROKERS 62 31.74
INSURANCE CARRIERS 63 27.01
INSURANCE AGENTS BROKERS & SERVICES 64 8.64
REAL ESTATE 65 0.53
HOLDING & OTHER INVESTMENT OFFICES 67 11.05
HOTELS ROOMING HOUSES & CAMPS 70 3.44
PERSONAL SERVICES 72 3.4
BUSINESS SERVICES 73 132.75
AUTO REPAIR SERVICES & PARKING 75 0.85
MOTION PICTURES 78 7.83
AMUSEMENT & RECREATION SERVICES 79 5.35
HEALTH SERVICES 80 12.36
EDUCATIONAL SERVICES 82 4.07
SOCIAL SERVICES 83 0.08
ENGINEERING & ACCOUNTING & MGMT SVCS 87 14.84
MISCELLANEOUS SERVICES NEC 89 0.16
ADMIN-ENVIROMENTAL QUALITY PROGRAMS 95 0.11
NATIONAL SECURITY & INTERNATIONAL AFFAIR 97 1.2
24

Table 3: Summary StatisticsThis table presents firm level summary statistics for the main variables used in the empiricalanalysis. Debt/Assets is defined as total debt divided by total assets. Asset Tangibility istotal property, plant, and equipment divided by total assets. Mkt. to Book is defined as thebook value of debt plus the market value of assets divided by the book value of assets. ROAis earnings before interest, taxes, depreciation, and amortization divided by total assets.Cash Holdings is cash and short-term investments divided by total assets. Cash Flow isdefined as operating income minus interest, taxes, and dividends divided by assets.
Variable Mean Median Std. Deviation Min Max
Debt/Assets 0.20 0.16 0.20 0 1.01
Asset Tangibility 0.26 0.18 0.23 0.00 0.99
Mkt. to Book 1.87 1.23 2.24 0.01 101.42
Ln Sales 3.96 4.02 2.33 -6.91 11.50
ROA 0.002 0.024 0.060 -0.318 0.125
Ln Size 5.96 5.46 2.06 -6.91 12.58
Cash Holdings 0.22 0.11 0.25 0.00 1.00
Cash Flow 0.002 0.015 0.065 -6.001 5.813
Net Work. Cap/Assets 0.05 0.03 0.18 -0.76 0.53
R&D/Sales 0.03 0.02 0.04 0.00 1.92
25

Table 4: Conditional Logit Model: Estimating the Probability of a LawsuitThis table presents a conditional logit model estimating the probability of a lawsuit in agiven quarter for a given firm. The dependent variable is equal to 1 if the firm is sued inthat quarter and zero otherwise. The groups for the conditional model are defined at thefirm level to control for firm specific omitted variables. Control variables include Ln Size,Mkt. to Book, defined as the book value of debt plus the market value of assets divided bythe book value of assets, and Asset Tangibility which is calculated as property, plant andequipment divided by total assets. All specifications include firm-year fixed effects. OddsRatios are presented in lieu of coefficients. Standard errors are clustered at the 3 digit siccode.
Variable 1 2 3
Litigation Environmenti,t−1 1.017 1.017 1.017
[4.13]∗∗∗ [4.21]∗∗∗ [4.40]∗∗∗
Payout 1.10 1.09 0.99
[0.15] [0.14] [0.02]
Cash Holdings 0.54 0.38 0.24
[0.37] [0.50] [0.62]
Ln Size 1.30 1.33 1.57
[0.65] [0.73] [0.92]
Mkt. to Book 0.60 0.60 0.61
[2.44]∗∗ [2.52]∗∗ [2.53]∗∗
Asset Tangibility 0.29 0.59 0.20
[0.34] [0.16] [0.44]
Debt/Assets 0.19 0.22
[0.78] [0.77]
ROA 0.001
[1.04]
Industry Returnt−1 1.12
[0.38]
Year Dummies Y Y Y
Groups defined at the firm levelRobust z statistics clustered by 3-digit SIC code in brackets.∗ significant at 10%; ∗∗ significant at 5%; ∗∗∗ significant at 1%
26

Tab
le5:
Pool
edO
LS
Reg
ress
ion:
The
Effec
tof
the
Litig
atio
nE
nvir
onm
ent
onFirm
Cap
ital
Str
uct
ure
Thi
sta
ble
pres
ents
the
resu
lts
ofa
pool
edO
LS
regr
essi
onex
amin
ing
the
effec
tof
the
litig
atio
nen
viro
nmen
tpr
oxy,
Litig
atio
nEnv
iron
men
t t−
1on
firm
capi
tal
stru
ctur
e.T
hede
pend
ant
vari
able
isD
ebt/
Ass
ets,
defin
edas
tota
lde
btdi
vide
dby
tota
las
sets
.T
here
gres
sion
isgi
ven
byth
efo
rmD
ebt/
Ass
ets i
,t=
β0
+β
1X
i,t+
γL
itig
ati
onE
nvir
onm
ent t−
1+
ε i,t.
Con
trol
vari
able
sin
clud
eLn
Size
,M
kt.
toBoo
k,de
fined
asth
ebo
okva
lue
ofde
btpl
usth
em
arke
tva
lue
ofas
sets
divi
ded
byth
ebo
okva
lue
ofas
sets
,RO
A,de
fined
asop
erat
ing
inco
me
divi
ded
byas
sets
,an
dA
sset
Tan
gibi
lity
whi
chis
calc
ulat
edas
prop
erty
,pl
ant
and
equi
pmen
tdi
vide
dby
tota
las
sets
.A
lso
incl
uded
are
the
lagg
edre
turn
and
Ln
Sale
s.Sp
ecifi
cati
ons
inco
lum
ns1-
6in
clud
ea
vari
ety
ofin
dica
tor
vari
able
sto
cont
rolf
orfir
man
dye
areff
ects
.C
olum
n7
pres
ents
asi
mpl
ech
ange
regr
essi
onw
here
allva
riab
les
are
calc
ulat
edas
diffe
renc
esfr
om4
quar
ters
befo
re.
All
spec
ifica
tion
sha
vest
anda
rder
rors
clus
tere
dat
the
firm
leve
l.
Var
iabl
e1
23
45
Cha
nges
Litig
atio
nEnv
iron
men
t i,t−
10.
0001
70.
0001
30.
0001
20.
0001
20.
0001
70.
0000
4[3
.63]
***
[2.7
4]**
*[2
.71]
***
[2.7
5]**
*[3
.88]
***
[2.2
1]**
Ln
Size
-0.0
2502
-0.0
4238
-0.0
4555
-0.0
4554
-0.0
2503
-0.0
4431
[2.4
4]**
[2.2
9]**
[2.6
0]**
*[2
.60]
***
[2.3
6]**
[0.8
9]M
kt.
toBoo
k0.
0018
50.
0024
70.
0030
20.
0030
20.
0022
30.
0077
9[0
.73]
[0.7
8][1
.00]
[1.0
0][0
.85]
[1.5
0]A
sset
Tan
gibi
lity
0.28
626
0.23
132
0.27
465
0.27
463
0.27
913
0.01
755
[7.7
9]**
*[3
.17]
***
[4.8
1]**
*[4
.81]
***
[7.7
1]**
*[0
.09]
Ln
Sale
s0.
0092
30.
0206
0.00
944
0.00
945
0.00
918
0.00
991
[2.1
4]**
[2.5
1]**
[1.8
6]*
[1.8
7]*
[2.2
4]**
[1.1
0]RO
A-0
.324
83-0
.210
1[2
.76]
***
[1.9
7]**
Qua
rter
lyRet
urn t−
1-0
.004
01-0
.004
42-0
.006
01-0
.003
19[2
.24]
**[2
.67]
***
[3.7
2]**
*[2
.77]
***
Indu
stry
Ret
urn t−
10.
0024
50.
0044
-0.0
0051
[1.0
0][1
.99]
**[0
.28]
Con
stan
t0.
2523
20.
3230
20.
3725
0.37
235
0.26
201
0.00
272
[5.3
1]**
*[3
.59]
***
[4.1
1]**
*[4
.11]
***
[5.0
1]**
*[2
.66]
***
R2
0.7
0.77
0.77
0.77
0.7
0.03
Fir
m-Y
ear
Dum
mie
sN
YY
YN
NFir
mD
umm
ies
YN
NN
YN
Yea
rD
umm
ies
NN
NN
YN
Cha
nge
Reg
ress
ion
NN
NN
NY
Sta
ndard
Err
ors
Clu
ster
edby
Fir
m.
Abso
lute
valu
et-
stats
pre
sente
d.
∗si
gnifi
cant
at
10%
,∗∗
signifi
cant
at
5%
,∗∗∗si
gnifi
cant
at
1%
.
27

Table 6: Pooled OLS Regression: The Effect of the Litigation Environment on Total Payoutand Share RepurchasesThis table presents the results of a pooled OLS regression examining the effect of the litiga-tion environment proxy, Litigation Environmentt−1 on firm payout. The dependent variablesare Payout/Assets, calculated as total dividends plus total repurchases divided by assets andShare Repurchase/Assets. The regression is given by the form Payouti,t = β0 + β1Xi,t +γLitigationEnvironmentt−1 + εi,t. Control variables include Ln Size, Mkt. to Book, defined asthe book value of debt plus the market value of assets divided by the book value of assets, ROA,defined as operating income divided by assets, and Debt/Assets, defined as total debt divided bytotal assets. Also included are the lagged returns at the firm and industry level. All specificationsinclude firm-year fixed effects.
Total Payout Common Share RepurchasesVariable 1 2 3 4Litigation Environmentt−1 0.00000 0.00055 0.00067 0.00067
[2.74]*** [1.83]* [1.97]** [1.98]**Ln Size -0.00413 -0.0395 -0.03664 -0.03659
[2.07]** [0.68] [0.63] [0.62]Mkt. to Book 0.00031 0.83664 0.84695 0.84697
[1.86]* [2.05]** [2.08]** [2.08]**ROA 0.00373 -0.81413 -0.76221 -0.76197
[2.33]** [3.00]*** [3.08]*** [3.08]***Debt/Assets 0.00606 0.06533 0.08425 0.08437
[1.55] [0.35] [0.45] [0.45]Quarterly Returnt−1 -0.00012 -0.09573 -0.09633
[0.35] [2.12]** [2.09]**Industry Returnt−1 -0.00115 0.00186
[1.53] [0.10]Constant 0.02827 -0.42422 -0.46267 -0.46362
[2.44]** [0.60] [0.65] [0.65]R2 0.15 0.57 0.58 0.58Firm-Year Dummies Y Y Y Y
Standard Errors Clustered by Firm. Absolute value t-stats presented.
∗significant at 10%, ∗∗significant at 5%, ∗∗∗significant at 1%.
28

Table 7: Pooled OLS Regression: The Effect of the Litigation Environment on Cash Holdings,Current Assets, and Current LiabilitiesThis table presents the results of a pooled OLS regression examining the effect of the litigation envi-ronment proxy, Litigation Environmentt−1 on firm cash holdings, current assets, accounts payable,and current liabilities. The dependant variables are Cash Holdings, defined as cash and short-terminvestments divided by total assets, Current Assets, defined as total current assets scaled by totalassets, Accounts Payable defined as accounts payable scaled by total assets, and Current Liabilitiesdefined as total current liabilities divided by total assets. The regression is given by the formyi,t = β0 + β1Xi,t + γLitigationEnvironmentt−1 + εi,t. Control variables include Ln Size, Mkt. toBook, defined as the book value of debt plus the market value of assets divided by the book valueof assets, Cash Flow, defined as operating income minus interest, taxes, and dividends divided byassets, and Debt/Assets, defined as total debt divided by total assets. All specifications includefirm-year fixed effects.
Variable Cash Current Accounts CurrentVariable Holdings Assets Payable LiabilitiesLitigation Environmenti,t−1 -0.00006 -0.00002 0.00004 0.00018
[1.99]** [1.01] [2.99]*** [4.58]***Ln Size 0.00266 -0.07249 -0.05321 -0.14638
[0.70] [19.83]*** [7.17]*** [8.81]***Mkt. to Book 0.00268 0.00395 0.00214 0.00212
[2.76]*** [6.61]*** [2.84]*** [1.27]Cashflow 0.11598
[7.70]***Net Working Capital/Assets -0.0359
[6.08]***Debt/Assets -0.04439
[2.32]**Asset Tangibility -0.70272 0.03677 0.04587
[42.34]*** [1.92]* [1.51]Ln Sales 0.00327 0.01145 0.02817
[1.86]* [6.38]*** [10.70]***Quarterly Returnt−1 0.00516 -0.00002 0.00004 0.00018
[5.68]*** [1.01] [2.99]*** [4.58]***Industry Returnt−1 0.00307 -0.00262 -0.00245 -0.00402
[1.97]** [2.06]** [1.08] [1.40]Constant 0.18499 1.07293 0.42969 0.88844
[8.19]*** [56.13]*** [9.90]*** [9.68]***R2 0.92 0.94 0.95 0.62Firm-Year Dummies Y Y Y Y
Standard Errors Clustered by Firm. Absolute value t-stats presented.
∗significant at 10%, ∗∗significant at 5%, ∗∗∗significant at 1%.
29

Table 8: Pooled OLS Regression: The Effect of the Litigation Environment and FinancialDistress on Firm Capital StructureThis table presents the results of a pooled OLS regression examining the effect of the litigationenvironment proxy, Litigation Environmenti,t on firm capital structure. The dependant vari-able is Debt/Assets, defined as total debt divided by total assets. The regression is given bythe form Debt/Assetsi,t = β0 + β1Xi,t + γ1LitigationEnvironmentt−1 + γ2FinancialDistress ∗LitigationEnvironment + εi,t. Control variables include Ln Size, Mkt. to Book, defined as thebook value of debt plus the market value of assets divided by the book value of assets, ROA, de-fined as operating income divided by assets, and Asset Tangibility which is calculated as property,plant and equipment divided by total assets. Also included are the lagged return and Ln Sales.Financial distress is defined for columns 1-3 respectively as Ln Size, High Debt Dummyt−1 which isan indicator equal to 1 if the firm has higher leverage than its industry median and zero otherwise,and Investment Grade Dummyt−1 which is an indicator equal to 1 if the firm has investment gradedebt ratings and equal to zero if the debt is unrated or below investment grade.
Variable 1 2 3Litigation Environmentt−1 0.00038 0.00471 0.00491
[2.53]** [3.21]*** [2.50]**Ln Size -0.0432 -0.05001 -0.0456
[2.39]** [2.81]*** [2.56]**Mkt. to Book 0.00303 0.00425 0.00379
[1.01] [1.20] [1.07]Asset Tangibility 0.27414 0.22313 0.27348
[4.80]*** [3.83]*** [4.67]***Ln Sales 0.00929 0.00763 0.00902
[1.82]* [1.53] [1.77]*Quarterly Returnt−1 -0.00437 -0.00483 -0.00396
[2.63]*** [2.93]*** [2.34]**Industry Returnt−1 0.00243 0.00188 0.00258
[1.00] [0.85] [1.13]Size*Litigation Environmentt−1 -0.00005
[1.87]*High Debt Dummyt−1 0.10369
[34.67]***High Debtt−1*Lit.Env.t−1 0.00353
[1.65]*Investment Grade Dummyt−1 -0.00952
[2.24]**Investment Gradet−1*Lit.Env.t−1 -0.00714
[3.14]***Constant 0.35991 0.36191 0.37733
[3.84]*** [3.95]*** [4.07]***R2 0.77 0.78 0.77Firm-Year Dummies Y Y Y
Standard Errors Clustered by Firm. Absolute value t-stats presented.
∗significant at 10%, ∗∗significant at 5%, ∗∗∗significant at 1%.
30

Table 9: Difference in Difference Estimation: Constrained vs. Unconstrained Firms Beforeand After Litigation Reform LegislationThis table presents the results of an OLS regression examining the effect of litigation reformon the financial policy decisions of unconstrained and constrained firms. Unconstrained takesa value of one if the firm is above median size for its industry in a particular year and zerootherwise. Post Reform takes a value of 1 if the observation occurred after the tort reformlegislation for that industry and zero otherwise. This table includes firms from the airlinemanufacturing industry and the coal mining industry. Tort reform occurred in the coalindustry in 1972 (Black Lung Benefits Act of 1972) and the airline manufacturing industryin 1994 (General Aviation Revitalization Act of 1994). Cash Holdings is defined as cashdivided by total assets, Accounts Payable is defined as accounts payable divided by totalassets, and Share Repurchases are defined as share repurchases divided by total assets.
Variable Cash Holdings Accounts Payable Share RepurchasesUnconstrained 0.04318 −0.08471 −242
[3.30]∗∗∗ [3.47]∗∗∗ [1.13]Post Reform 0.0727 −0.00876 −274
[3.01]∗∗∗ [0.22] [1.26]Unconstrained*Post Reform −0.11133 −0.0548 −245
[4.06]∗∗∗ [1.00] [1.13]Constant 0.0342 0.20754 238
[3.27]∗∗∗ [2.69]∗∗∗ [1.11]R2 0.06 0.03 0.02
Standard Errors Clustered by Firm. Absolute value t-stats presented.
∗significant at 10%, ∗∗significant at 5%, ∗∗∗significant at 1%.
31