the liquidation of government debt - imf · expense savings for a 12—country sample range from...
TRANSCRIPT

WP/15/7
The Liquidation of Government Debt
Carmen M. Reinhart and M. Belen Sbrancia
© 2015 International Monetary Fund WP/15/7
IMF Working Paper
Research Department
The Liquidation of Government Debt1
Prepared by Carmen M. Reinhart and M. Belen Sbrancia
Authorized for distribution by Atish R. Ghosh
January 2015
Abstract
High public debt often produces the drama of default and restructuring. But debt is also reduced through financial repression, a tax on bondholders and savers via negative or below-market real interest rates. After WWII, capital controls and regulatory restrictions created a captive audience for government debt, limiting tax-base erosion. Financial repression is most successful in liquidating debt when accompanied by inflation. For the advanced economies, real interest rates were negative ½ of the time during 1945–1980. Average annual interest expense savings for a 12—country sample range from about 1 to 5 percent of GDP for the full 1945–1980 period. We suggest that, once again, financial repression may be part of the toolkit deployed to cope with the most recent surge in public debt in advanced economies.
JEL Classification Numbers: E2, E3, E6, F3, F4, H6, N10
Keywords: deleveraging, inflation, financial repression, public debt
Author’s E-Mail Address: [email protected] ; [email protected]
1 A slightly revised version of the paper is forthcoming at Economic Policy
This Working Paper should not be reported as representing the views of the IMF. The views expressed in this Working Paper are those of the author(s) and do not necessarily represent those of the IMF or IMF policy. Working Papers describe research in progress by the author(s) and are published to elicit comments and to further debate.

Contents Page
I. Introduction …………………….. ........................................................................................4 II. Alternative Approaches to Debt Reduction .........................................................................8III. Real Interest Rates ...........................................................................................................15
A. General real interest rate trends ......................................................................................15 B. The Contractual Interest Rate (CIR) ...............................................................................18 C. Data and Sample .............................................................................................................19 D. Real CIR in the 12-country sample .................................................................................20
IV. The Liquidation of Government Debt: Conceptual Framework ........................................24A. Conceptual Framework ...................................................................................................24 B. Measurement Challenges: Putting the concepts to the data ...........................................26
V. Empirical Estimates ...........................................................................................................28 A. Savings on interest payments and the financial repression tax .......................................29 B. Incidence and magnitude of the “liquidation tax” ...........................................................30
VI. Estimates of the Liquidation Effect ...................................................................................32VII. Financial Repression or Unanticipated Inflation? ............................................................36VIII. Regulation and Captive Audiences: Past and Present .....................................................37IX. Concluding Remarks .........................................................................................................39References ................................................................................................................................42
Tables 1. United States, Selected Financial Regulations, 1930s–1980s ............................................102. Incidence and Magnitude of Liquidation of Public Debt via Negative Real Interest Rates, 1945–1980 ..........................................................................................30 3. Incidence of Liquidation Effect via Negative Real Interest Rates ......................................314. Inflation Surprises and Liquidation Years ..........................................................................375. The Re-emergence of Financial Repression, 2008–2013 ...................................................38
Figures 1. Surges in Central Government Public Debts and their Resolution: Advanced Economies and Emerging Markets, 1900–2012 .................................................................12 2. Central Government Debt: Domestic Debt as a Share of Total Debt, Advanced and Emerging Economies, 1930–1970 ......................................................................................14 3. Average Ex-post Real Rate on Treasury Bills: Advanced Economies and Emerging Markets, 1945–2012 (3-year moving averages, in percent) ...............................................17 4. Real Interest Rates Frequency Distributions: Advanced Economies, 1945–2012, Treasury bill rates ...............................................................................................................18 5a. Real Ex-post Contractual Interest Rates on Central Government Debt, 1945–1980 .........21 5b. Real Ex-post Contractual Interest Rates on Central Government Debt, 1945–1980 .........22 6. Incidence of Negative-to-Moderate Real Interest Rates, 1945–1980, Seven Countries with WWII Debt Buildup ...................................................................................................24

3 7. Estimates of savings in interest costs (as a percent of GDP) under the assumptions that market ex- post real interest rates are 1 Percent (lower bound) and 3Percent (upper bound), 1945–1980 .................................................................................................29 8. The Liquidation of Public Debt (Financial Repression Tax), 1945–1980 as shares of total revenues (top panel) and GDP (bottom panel) ......................................33 9. The “Liquidation Effect” revenues per liquidation year: As a Percent of Tax Revenues and GDP .................................................................................................35
4
I. INTRODUCTION
“Some people will think the 2¾ nonmarketable bond is a trick issue. We want to meet that head on. It is. It is an attempt to lock up as much as possible of these longer-term issues.” Assistant Secretary of the Treasury William McChesney Martin Jr.2
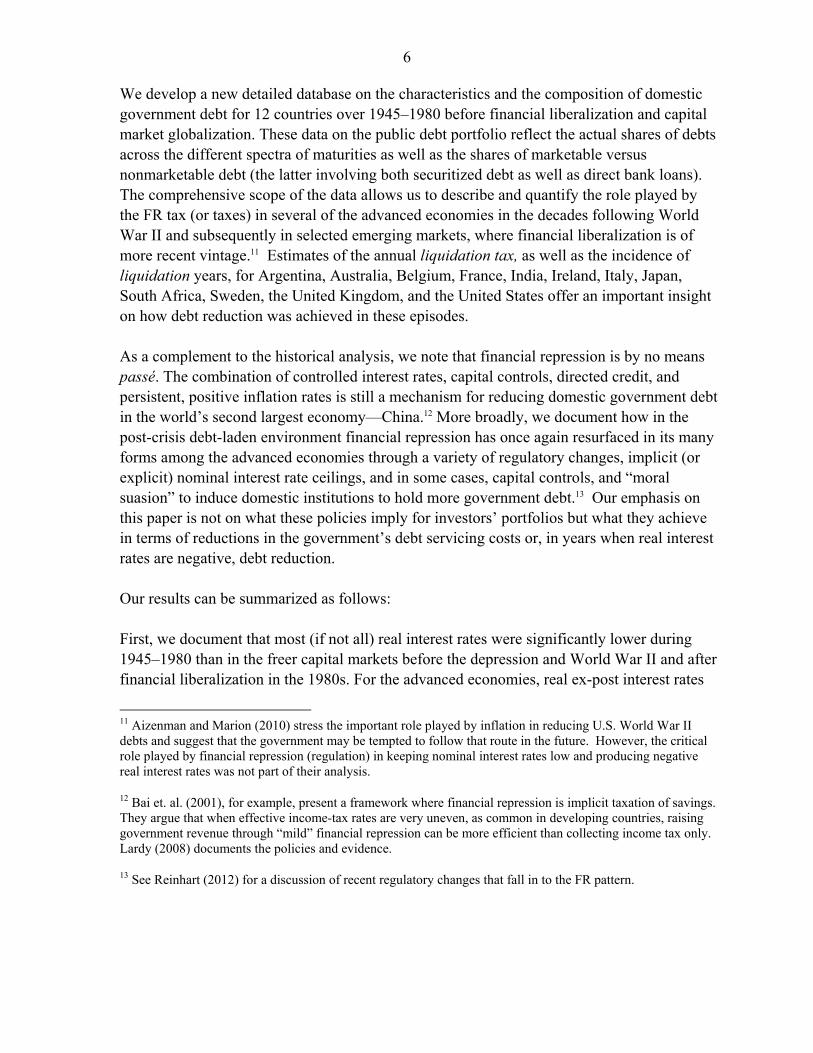
The years that preceded the outbreak of the subprime crisis in the summer of 2007 witnessed an unparalleled surge in private debt in many advanced economies, including the United States. At the onset of the crisis, the debt of the financial industry had reached unprecedented heights. 3 The decade following the crisis will mark a record rise in public debt during peacetime that may well surpass wartime episodes. It is not surprising then that debt reduction, of one form or another, is a topic that is receiving substantial attention. Throughout history, debt/GDP ratios have been reduced by (i) economic growth; (ii) substantive fiscal adjustment/austerity plans; (iii) explicit default or restructuring of private and/or public debt; (iv) a surprise burst in inflation; and (v) a steady dosage of financial repression accompanied by an equally steady dosage of inflation. Options (iv) and (v) are viable only for domestic—currency debts. Since these debt-reduction channels are not mutually exclusive, historical episodes of debt—reduction have owed to a combination of more than one of these channels. Hoping that substantial public and private debt overhangs are resolved by growth may be uplifting, but it is not particularly practical. The evidence, at any rate, is not particularly encouraging, as high levels of public debt appear to be associated with lower growth4. The effectiveness of fiscal adjustment/austerity in reducing debt and their growth consequences is beyond the scope of this paper.5 Other studies have analyzed the role of explicit default, debt
2 FOMC minutes, March 1–2, 1951, remarks on the 1951 conversion of short-term marketable US Treasury debts for 29-year nonmarketable bonds. Martin subsequently became chairman of the Board of Governors, 1951–70.
3 The pre-crisis surge in private debt is manifest in both the gross external debt figures and in domestic credit. See Lane (2012) and Reinhart, Reinhart, and Rogoff, (2012) for an overview of both domestic and external debt; Lane and Milesi-Ferretti (2010), for a careful and extensive historical reconstruction of external debt since 1970; and Schularick and Taylor (2012) for a panoramic view of domestic credit over 1870–2009.
4 See Reinhart, Reinhart and Rogoff (2012) for a brief literature review.

5 restructuring (or forcible debt conversions) as well as hyperinflation as debt reduction mechanisms6. Prior to the 2007 crisis, it was deemed unlikely that advanced economies could ever experience financial meltdowns as severe as those of the Pre-World War II era; the prospect of a sovereign default in wealthy economies was similarly unthinkable.7 Repeating that pattern, the ongoing discussion on debt reduction has focused almost exclusively on the role played by fiscal austerity or adjustment. It apparently has been collectively forgotten that the widespread system of financial repression that prevailed worldwide from 1945 to the early 1980s played an instrumental role in reducing or liquidating the massive stocks of debt accumulated during World War II in many of the advanced countries, United States inclusive.8 This is the phenomenon we study.9 10 Financial repression (FR) is defined in Box 1, while Table 1 describes a selection of policies that defined the FR era in the United States but are representative for other countries, advanced and emerging alike. There is considerable cross-country variation in the extent of financial repression and the magnitude of the financial repression tax. When controlled nominal interest rates coupled with inflation produce negative real interest rates, it liquidates (reduces) the stock of outstanding debt; we refer to this as the liquidation effect. However, even in years when real interest rates are positive, to the extent that these are kept lower than they otherwise would be via interest rate ceilings, large scale official intervention, or other regulations and policies, there is a saving in interest expense to the government. These savings are sometimes referred to as the financial repression tax.
6 Recent Studies on debt reduction via default and restructuring include Sturzenegger and Zettlemeyer (2006) and Reinhart and Rogoff (2009).
7 The academic literature and public discussion surrounding “the great moderation” attests to this benign view of the state of the economy in the advanced countries. See, for example, McConnell and Perez-Quiros (2000).
8 For the political economy of this point see the analysis presented in Alesina, Grilli, and Milesi Ferretti (1993). They present a framework and stylized evidence to support that strong governments coupled with weak central banks may impose capital controls so as to enable them to raise more seigniorage and keep interest rates artificially low—facilitating domestic debt reduction. See Battilossi (2005) for a historical perspective of financial repression in Europe.
9The first version of this paper is Reinhart and Sbrancia, March (2011).
10 Subsequent to Reinhart and Sbrancia (2011) there are some studies that have analyzed the role played by negative real interest rates in reducing debt burdens (see for instance, WEO 2012) confirming the results of this paper.
6 We develop a new detailed database on the characteristics and the composition of domestic government debt for 12 countries over 1945–1980 before financial liberalization and capital market globalization. These data on the public debt portfolio reflect the actual shares of debts across the different spectra of maturities as well as the shares of marketable versus nonmarketable debt (the latter involving both securitized debt as well as direct bank loans). The comprehensive scope of the data allows us to describe and quantify the role played by the FR tax (or taxes) in several of the advanced economies in the decades following World War II and subsequently in selected emerging markets, where financial liberalization is of more recent vintage.11 Estimates of the annual liquidation tax, as well as the incidence of liquidation years, for Argentina, Australia, Belgium, France, India, Ireland, Italy, Japan, South Africa, Sweden, the United Kingdom, and the United States offer an important insight on how debt reduction was achieved in these episodes. As a complement to the historical analysis, we note that financial repression is by no means passé. The combination of controlled interest rates, capital controls, directed credit, and persistent, positive inflation rates is still a mechanism for reducing domestic government debt in the world’s second largest economy—China.12 More broadly, we document how in the post-crisis debt-laden environment financial repression has once again resurfaced in its many forms among the advanced economies through a variety of regulatory changes, implicit (or explicit) nominal interest rate ceilings, and in some cases, capital controls, and “moral suasion” to induce domestic institutions to hold more government debt.13 Our emphasis on this paper is not on what these policies imply for investors’ portfolios but what they achieve in terms of reductions in the government’s debt servicing costs or, in years when real interest rates are negative, debt reduction. Our results can be summarized as follows: First, we document that most (if not all) real interest rates were significantly lower during 1945–1980 than in the freer capital markets before the depression and World War II and after financial liberalization in the 1980s. For the advanced economies, real ex-post interest rates
11 Aizenman and Marion (2010) stress the important role played by inflation in reducing U.S. World War II debts and suggest that the government may be tempted to follow that route in the future. However, the critical role played by financial repression (regulation) in keeping nominal interest rates low and producing negative real interest rates was not part of their analysis.
12 Bai et. al. (2001), for example, present a framework where financial repression is implicit taxation of savings. They argue that when effective income-tax rates are very uneven, as common in developing countries, raising government revenue through “mild” financial repression can be more efficient than collecting income tax only. Lardy (2008) documents the policies and evidence.
13 See Reinhart (2012) for a discussion of recent regulatory changes that fall in to the FR pattern.

7 were negative in about half of the years of the financial repression era compared to less than 10 percent of the time since the early 1980s. As to the incidence of liquidation years, Argentina sets the record with negative real rates recorded in all years but two from 1945 to 1980. These exercises focus on the incidence and magnitude of the financial repression “tax rate” as well as years of debt liquidation. First, financial repression in combination with inflation played a quantitatively important role in limiting interest payments and reducing debts. Average annual interest expense savings for the 12-country sample range from about 1 to 5 percent of GDP for the full 1945–1980 period. The most significant savings materialize in the decade after WWII when debt levels are highest and in the 1970s when inflation accelerated. The average annual liquidation effect (debt reduction during years of negative interest rates) ranges from 0.3 to 4 percent of GDP for the full sample. Such annual deficit reduction quickly accumulates (even without any compounding) in the course of a decade. We also report these measures as a percent of total government revenues. The size of the FR tax base (the stock of domestic debt outstanding) varies considerably through time and countries across the sample—as does the magnitude of the financial repression tax. We document both the level and composition of the domestic debt stock. Through extensive documentation of the regulations covering the financial and external sectors we also trace out the evolution of “captive domestic audiences” where these debts are placed, which are an integral part of limiting tax base erosion. Finding high-yield alternatives (to government debt) saving vehicles in the era of financial repression was no easy task. Capital controls kept many potential high yield investment possibilities off limits while available domestic alternatives offered even more unattractive yields than government debt. We review the “stages of financial repression.” Finally, a supplementary exercise provides estimates of inflation expectations for each country over the sample with the intent of developing a rough approximation of how much of the total ex-post FR tax can be attributed to unanticipated inflation. We suggest that financial repression was relatively more important than unanticipated inflation for the sample as a whole, although the latter played a more prominent role in the later stages of FR in the 1970s. Since FR ensures that interest rates have a substantial regulated or predetermined component, inflation need not take market participants entirely by surprise and, in effect, it need not be very high (by historic standards). Of course, this part of the analysis is subject to the usual caveats and limitations associated with non-survey estimates of inflation expectations. The paper proceeds as follows: The next section discusses how previous “debt-overhang” episodes have been resolved since 1900. This narrative primarily serves to highlight the substantially different routes taken

8 before and after World War II. The 1930s and 1940s are littered with default and debt conversions, while the post WWII era tilted toward a heavier reliance on financial repression to deal with the legacy of high war debts. In Section III, we describe through various metrics the evolution of real interest rates at both the individual country level as well as for a broader sample of countries beyond the 12 that are the focus of our study. A simple conceptual framework for calculating the financial repression tax as well as the rate at which government debt is liquidated or reduced is sketched in Section IV. This framework also provides a metric to distinguish between the effects of unanticipated inflation from that of financial repression. Section V presents the central empirical findings of the paper on the magnitude and incidence of the FR tax across countries and time. We estimate inflation expectations and focus on separating how much of the total liquidation of debt (the tax) can be attributed to financial repression or unanticipated inflation. Finally, we discuss how post crisis some of the individual features of FR have re-emerged, some of the implications of our analysis for the current debt overhang, and highlight areas for further research.
II. ALTERNATIVE APPROACHES TO DEBT REDUCTION
Peaks and troughs in public debt/GDP are seldom synchronized across many countries’ historical paths. There are, however, a few exceptions. Sometimes global (or nearly global) developments, be it a war or a severe financial and economic crisis, produce a synchronized surge in public debt, such as the one recorded for advanced economies since 2008. Using the Reinhart and Rogoff (2009) database14, Figure 1 provides central government debt/GDP for the advanced and emerging economies subgroups since 1900. This line plots a simple arithmetic average that does not assign weight according to country size. An examination of these two series identifies a total of four peaks in world indebtedness. Three episodes (World War I, World War II, and the Second Great Contraction, 2008-present) are almost exclusively advanced economy debt peaks; one is unique to emerging markets (1980s debt crisis followed by the transition economies’ collapses);
14 The underlying data is available at www.reinhartandrogoff.com.
9
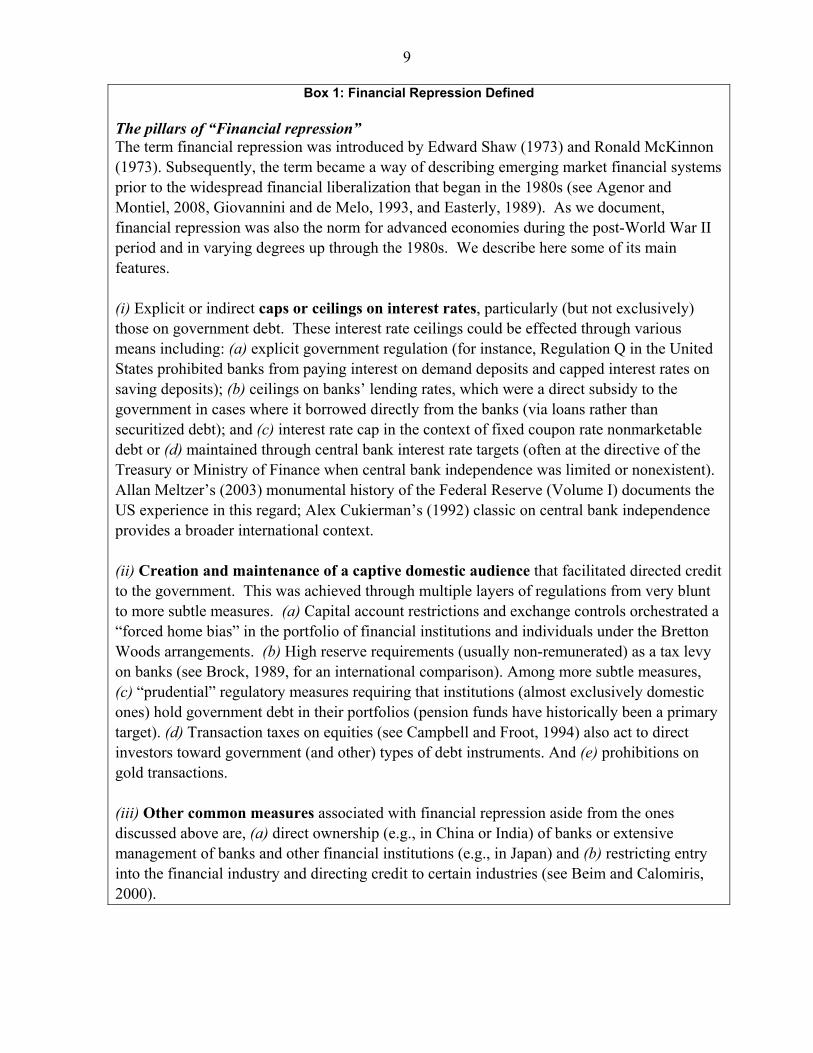
Box 1: Financial Repression Defined
The pillars of “Financial repression” The term financial repression was introduced by Edward Shaw (1973) and Ronald McKinnon (1973). Subsequently, the term became a way of describing emerging market financial systems prior to the widespread financial liberalization that began in the 1980s (see Agenor and Montiel, 2008, Giovannini and de Melo, 1993, and Easterly, 1989). As we document, financial repression was also the norm for advanced economies during the post-World War II period and in varying degrees up through the 1980s. We describe here some of its main features. (i) Explicit or indirect caps or ceilings on interest rates, particularly (but not exclusively) those on government debt. These interest rate ceilings could be effected through various means including: (a) explicit government regulation (for instance, Regulation Q in the United States prohibited banks from paying interest on demand deposits and capped interest rates on saving deposits); (b) ceilings on banks’ lending rates, which were a direct subsidy to the government in cases where it borrowed directly from the banks (via loans rather than securitized debt); and (c) interest rate cap in the context of fixed coupon rate nonmarketable debt or (d) maintained through central bank interest rate targets (often at the directive of the Treasury or Ministry of Finance when central bank independence was limited or nonexistent). Allan Meltzer’s (2003) monumental history of the Federal Reserve (Volume I) documents the US experience in this regard; Alex Cukierman’s (1992) classic on central bank independence provides a broader international context.
(ii) Creation and maintenance of a captive domestic audience that facilitated directed credit to the government. This was achieved through multiple layers of regulations from very blunt to more subtle measures. (a) Capital account restrictions and exchange controls orchestrated a “forced home bias” in the portfolio of financial institutions and individuals under the Bretton Woods arrangements. (b) High reserve requirements (usually non-remunerated) as a tax levy on banks (see Brock, 1989, for an international comparison). Among more subtle measures, (c) “prudential” regulatory measures requiring that institutions (almost exclusively domestic ones) hold government debt in their portfolios (pension funds have historically been a primary target). (d) Transaction taxes on equities (see Campbell and Froot, 1994) also act to direct investors toward government (and other) types of debt instruments. And (e) prohibitions on gold transactions.
(iii) Other common measures associated with financial repression aside from the ones discussed above are, (a) direct ownership (e.g., in China or India) of banks or extensive management of banks and other financial institutions (e.g., in Japan) and (b) restricting entry into the financial industry and directing credit to certain industries (see Beim and Calomiris, 2000).

10 Table 1. United States, Selected Financial Regulations, 1930s–1980s
Government Securities Price Support: During World War II there was an agreement between the Federal Reserve and the Treasury to support the price of government securities in the market. The Treasury had set a structure of returns for securities of different maturities: 3/8 Percent on 90-day T-Bills, 7/8 Percent on 12-month certificates, and higher rates on long-term issues up to a maximum of 2.5 Percent on the longest term taxable bond. The Fed announced that it would buy and sell securities in the market in order to maintain the prices of bonds at par. As a result, long term securities were liquid and investors were protected from capital losses. With the war over, the policy of low interest rates was continued. As Studenski and Krooss (1952) point out, the Treasury’s debt-management program had three principal objectives: (i) to reduce the amount of the debt, (ii) to maintain government credit and keep debt costs low, and to (iii) widen the distribution of Federal securities. Keeping interest rates low was particularly important to the Treasury, in order to prevent debt servicing expenses from increasing even more. At the end of the 1940s, some members of the Fed started to push to eliminate the price support and to allow interest rates to rise. After several negotiations, the Fed and the Treasury reached an "accord" in March of 1951.
Exchange of Marketable for Nonmarketable Debt: There are several cases of exchanges in which marketable securities were exchanged for non-marketable securities.15 As an example, in 1951, marketable bonds with a coupon of 2.5 Percent and 16–21 years to maturity were exchange for nonmarketable bonds at 2.75 Percent with 29.5 years to maturity. (See quote at the beginning of Introduction)
15 There is no secondary market for non-marketable securities, which means that the coupon rate is also the nominal return.

11 Interest Rate Ceilings: After the Great Depression, interest payments on time and saving deposits were prohibited. The argument for imposing this restriction was that excessive competition for deposits generated instability in the financial system (Taggart, 1981). The ceilings remained mostly unchanged until early 1960s when non-bank thrift institutions were paying higher interest rates than commercial banks, as a result of their rates being non-regulated. In 1966, Regulation Q was extended to non-thrift institutions. During the following years several changes were made to the ceilings for different types of accounts and institutions. In 1980, the Depository Institutions Deregulation and Monetary Control Act passed, with effective date in 1986. Margin Requirements: Regulation T allowed the Fed to set margin requirements on loans by brokers to customers. The Fed used changes in margin requirements to control the amount of credit in the stock market. The objective of imposing higher margin requirements was to guarantee the stability of the stock market and avoid large increases in the prices of stocks driven by speculation or excessive use of credit. In January of 1946 the margin requirement was set to 100 Percent. It subsequently fluctuated between 50–90 Percent between 1947 and 1974. Gold restrictions-capital controls: In 1933, President Roosevelt prohibited private holdings of gold coins, bullion, and certificates. More than 40 years later, the restriction was lifted at the end of 1974. Moral Suasion: A situation in which the Central Bank attempts to persuade commercial banks of following certain policy. Even if there is no legal obligation to act accordingly, there is a view among bankers that it is better to remain cooperative with the Fed. One the examples that Horvitz and Ward (1987) provide is related to the voluntary foreign-credit-restrain program launched by the Fed during the 1960s to limit the outflow of dollars from the US. There were several calls to cooperate, but also implicit and explicit threats to those banks who decided not to cooperate. “In September 1966, for example, the Federal Reserve Board sent a letter to all member banks calling for restraint in granting business loans, ... The letter indicated that banks that failed to cooperate could not expect the increase in their loan portfolios to be considered adequate reason for the extension of Federal Reserve credit through the discount window."16 Sources: Chandler (1949), Green, Pentecost and Weyman-Jones (2011), Horvitz and Ward (1987), Metzler (2003), Studenski and Krooss (1952).
16 Horvitz and Ward, 1987, p.348–349

12 and the Great Depression of the 1930s is common to both groups. World War I and Depression debts were importantly resolved by widespread default and explicit restructurings or predominantly forcible conversions of domestic and external debts in both the now-advanced economies, and the emerging markets. Notorious hyperinflation in Germany, Hungary and other parts of Europe violently liquidated domestic-currency debts. Figure 1: Surges in Central Government Public Debts and their Resolution: Advanced Economies and Emerging Markets, 1900–2012
Sources: Reinhart and Rogoff (2009 and updates), sources cited therein and the authors. Notes: Listed below each debt-surge episode are the main mechanisms for debt resolution besides fiscal austerity programs which were not implemented in any discernible synchronous pattern across countries in any given episode. The typical forms of financial repression measures are discussed in Box 1. Advanced economies include: Australia, Austria, Belgium, Canada, Denmark, Finland, France, Germany, Greece, Iceland, Ireland, Italy, Japan, Netherlands, New Zealand, Norway, Portugal, Spain, Sweden, Switzerland, United Kingdom and United States. Emerging economies include: Algeria, Angola, Argentina, Bolivia, Brazil, Central African Republic, Chile, China, Colombia, Costa Rica, Cote D’Ivoire, Dominican Republic, Ecuador, Egypt, El Salvador, Ghana, Guatemala, Honduras, Hungary, India, Indonesia, Kenya, Korea, Malaysia, Mauritius, Mexico, Morocco, Myanmar, Nicaragua, Nigeria, Panama, Paraguay, Peru, Philippines, Poland, Romania, Russia, Singapore, South Africa, Taiwan, Thailand, Tunisia, Turkey, Uruguay, Venezuela, and Zimbabwe.
0
10
20
30
40
50
60
70
80
90
100
1901 1911 1921 1931 1941 1951 1961 1971 1981 1991 2001 2011
WWI and Depression Debtsadvanced and emerging
economies: default, restructuring
and conversions--a few hyperinflations
Advanced economies
WWII debts:Axis countries: default and
financial repression/inflationAllies: financial
repression/inflation
Emerging markets
1980s Debt Crisisemerging marketsDefault, restructuring,financial repression,inflation, andseveral hyperinflations

13 The World War II debt overhang was importantly liquidated via the combination of financial repression and inflation, as we shall document. This was possible because debts were predominantly domestic and denominated in domestic currencies. The robust post-war growth also contributed importantly to debt reduction in a way that was a marked contrast to the 1930s, when the combined effects of deflation and output collapses worked to worsen the debt/GDP balance in the way stressed by Irving Fisher (1933). Our interpretation is that the role played by the combination of some inflation and negative ex-post real interest rates in debt reduction was well understood ex-ante. The policy thrust of the 1940s is evident in the public discourse. As an example, Keynes’ (1940) How to Pay for the War is filled with discussion of inflation “as a mighty tax gatherer,” (page 68). Ceilings on interest rates on treasuries were in place at the time, so the implication for real rates were clear. An alternative to financial repression/inflation to reduce the debt after the war favored by Keynes was a once and for all capital levy or tax (which could be argued has its equivalent in a haircut)—but he did not attach a high probability to its adoption. Facilitating the FR/inflation debt reduction mechanism was the fact that between the depression of the 1930s and the war of the 1940s, financial globalization had been dramatically scaled back (see Obstfeld and Taylor, 1998 and 2004). With capital market access lost (voluntarily or otherwise) governments in both advanced and emerging market economies had increasingly shifted toward domestic funding, as shown in Figure 2. External debt all but disappeared until the 1970s. Importantly, nearly all new borrowing is domestic during that period; capital controls are pervasive. The external debt that shows up in the books for the advanced economies is predominantly official (largely WWII or reconstruction debts among governments). Some amounts are outstanding long term bonds from the 1920s or earlier. For the emerging markets, external government debt during this period largely consists of the leftover outstanding stock issued at very long maturities during the 1920s (and even earlier), as at that time a significant share of bonded debt was long term. There was also some component of official debt.
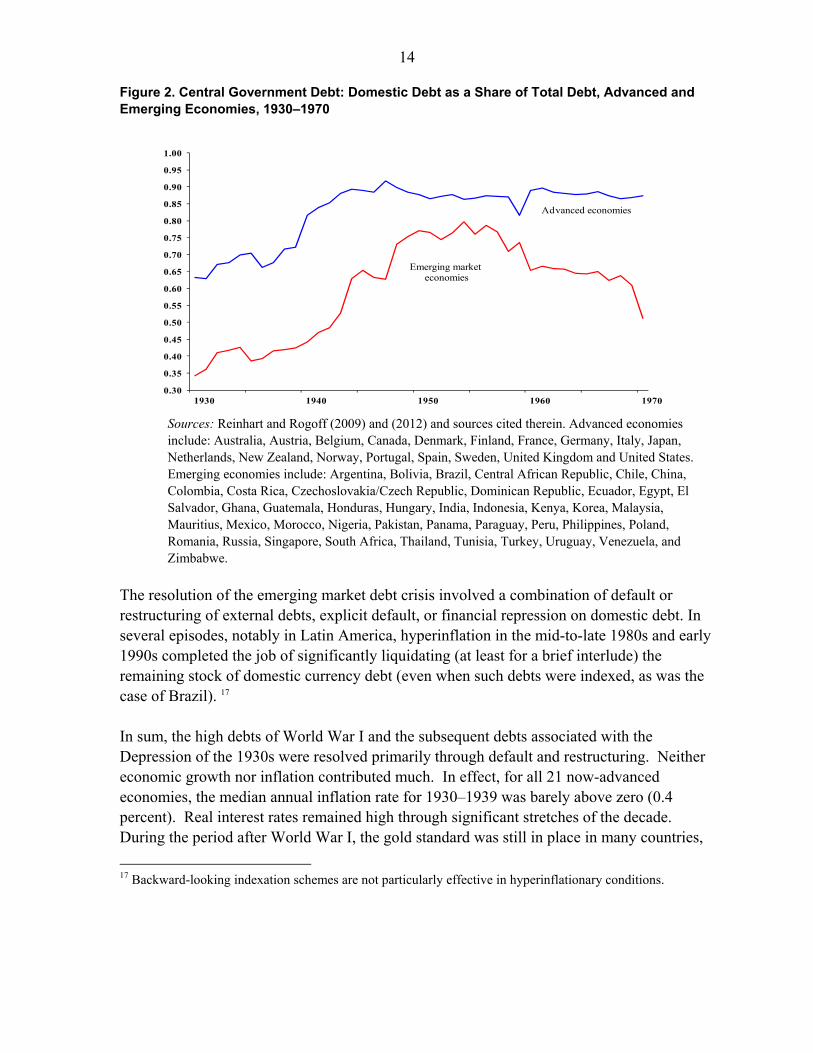
14 Figure 2. Central Government Debt: Domestic Debt as a Share of Total Debt, Advanced and Emerging Economies, 1930–1970
Sources: Reinhart and Rogoff (2009) and (2012) and sources cited therein. Advanced economies
include: Australia, Austria, Belgium, Canada, Denmark, Finland, France, Germany, Italy, Japan, Netherlands, New Zealand, Norway, Portugal, Spain, Sweden, United Kingdom and United States. Emerging economies include: Argentina, Bolivia, Brazil, Central African Republic, Chile, China, Colombia, Costa Rica, Czechoslovakia/Czech Republic, Dominican Republic, Ecuador, Egypt, El Salvador, Ghana, Guatemala, Honduras, Hungary, India, Indonesia, Kenya, Korea, Malaysia, Mauritius, Mexico, Morocco, Nigeria, Pakistan, Panama, Paraguay, Peru, Philippines, Poland, Romania, Russia, Singapore, South Africa, Thailand, Tunisia, Turkey, Uruguay, Venezuela, and Zimbabwe.
The resolution of the emerging market debt crisis involved a combination of default or restructuring of external debts, explicit default, or financial repression on domestic debt. In several episodes, notably in Latin America, hyperinflation in the mid-to-late 1980s and early 1990s completed the job of significantly liquidating (at least for a brief interlude) the remaining stock of domestic currency debt (even when such debts were indexed, as was the case of Brazil). 17 In sum, the high debts of World War I and the subsequent debts associated with the Depression of the 1930s were resolved primarily through default and restructuring. Neither economic growth nor inflation contributed much. In effect, for all 21 now-advanced economies, the median annual inflation rate for 1930–1939 was barely above zero (0.4 percent). Real interest rates remained high through significant stretches of the decade. During the period after World War I, the gold standard was still in place in many countries,
17 Backward-looking indexation schemes are not particularly effective in hyperinflationary conditions.
0.30
0.35
0.40
0.45
0.50
0.55
0.60
0.65
0.70
0.75
0.80
0.85
0.90
0.95
1.00
Advanced economies
Emerging marketeconomies

15 which meant that monetary policy was subordinated to keep a given gold parity. In those cases, inflation was not a policy variable available to policymakers in the same way that it was after the adoption of fiat currencies. As we shall sketch in the following sections, the post WWII approach to debt reduction took on a different shape.
III. REAL INTEREST RATES
One of the main goals of financial repression is to keep nominal interest rates lower than would otherwise prevail. This effect, other things equal, reduces the governments’ interest expenses for a given stock of debt and contributes to deficit reduction. However, when financial repression combined with inflation produces negative real interest rates, this also reduces or liquidates existing debts. It is a transfer from creditors to borrowers. The financial repression tax has some interesting political-economy properties. Unlike income, consumption, or sales taxes, the repression tax rate is determined by financial regulations and inflation performance that is opaque to most voters. Given that deficit reduction usually involves highly unpopular expenditure reductions and (or) tax increases of one form or another, the relatively “stealthier” financial repression tax may be a more politically palatable alternative to authorities faced with the need to reduce outstanding debts. A. General real interest rate trends
As discussed in Obstfeld and Taylor (2004) and others, liberal capital- market regulations (the accompanying market-determined interest rates) and international capital mobility reached their heyday prior to World War I under the umbrella of the gold standard. World War I and the suspension of convertibility and international gold shipments it brought, and, more generally, a variety of restrictions on cross-border transactions were the first blows to the globalization of capital. Global capital markets recovered partially during the roaring twenties, but the Great Depression, followed by World War II, put the final nails in the coffin of laissez faire banking. It was in this environment that the Bretton Woods arrangement of fixed exchange rates and tightly controlled domestic and international capital markets was conceived. 18 In that context, and taking into account the economic dislocations, scarcities, etc. which prevailed at the closure of the WWII, we witness a combination of very low nominal interest rates and inflationary spurts of varying degrees across the advanced economies. The obvious result were real interest rates--whether on treasury bills and deposit, central bank discount rates or loans (see Reinhart and Sbrancia, 2011),—that were markedly negative over 1945–1946 and often beyond.
18 In a framework where there are both tax collection costs and a large stock of domestic government, Aizenman and Guidotti (1994) show how a government can resort to capital controls (which lower domestic interest rates relative to foreign interest rates) to reduce the costs of servicing the domestic debt.

16 For the next 35 years or so, real interest rates in both advanced and emerging economies would remain consistently lower than the eras of freer capital mobility before and after the financial repression era. In effect, real interest rates (Figures 3 and 4) were on average negative. 19 In these figures we go beyond the core 12-country sample and extend the coverage to a sample of 13 advanced and 10 emerging market economies—so as to make the point that the patterns and conclusions drawn here have an even broader global resonance. Binding interest rate ceilings on deposits (which kept real ex post deposit rates even more negative than real ex-post rates on treasury bills) “induced” domestic savers to hold government bonds. What delayed the emergence of leakages in the search for higher yields (apart from prevailing capital controls) was that the incidence of negative returns on government bonds and on deposits was (more or less) a universal phenomenon at this time. The frequency distributions of real rates for the period of financial repression (1945–1980) and the years following financial liberalization (roughly 1981–2007 for the advanced economies) shown in Figure 3, highlight the universality of lower real interest rates prior to the 1980s and the high incidence of negative real interest rates. Such negative (or low) real interest rates were and substantially below the real rate of growth of GDP, this is consistent with the observation of Elmendorf and Mankiw (1999) when they state “An important factor behind the dramatic drop (in US public debt) between 1945 and 1975 is that the growth rate of GNP exceeded the interest rate on government debt for most of that period.” They fail to explain why this configuration should persist over three decades in so many countries. Real interest rates on deposits were negative in about 60 percent of the observations. In effect, real ex-post deposit rates were below one percent about 83 percent of the time.
19 Note that real interest rates were lower in a high-economic-growth period of 1945 to 1980 than in the lower growth period 1981–2009; this is exactly the opposite of the prediction of a basic growth model and therefore indicative of significant impediments to financial trade.

17 Figure 3: Average Ex-post Real Rate on Treasury Bills: Advanced Economies and Emerging Markets, 1945–2012 (3-year moving averages, in percent)
Sources: International Financial Statistics, International Monetary Fund, various sources listed in the Data Appendix, and authors’ calculations. Notes: The advanced economy aggregate comprises: Australia, Belgium, Canada, France, Germany, Greece, Ireland, Italy, Japan, New Zealand, Sweden, the United States, and the United Kingdom. The emerging market group consists of: Brazil, Egypt, India, Korea, Malaysia, Mexico, Philippines, South Africa, Turkey and Venezuela. The average is unweighted and the country coverage is somewhat spotty prior for emerging markets to 1960. A striking feature of Figure 4, however, is that real ex-post interest rates (shown for treasury bills) for the advanced economies have, once again, turned increasingly negative since the outbreak of the crisis and this trend has been intensifying over time. Real rates have been negative for more than half of the observations and below one percent for about 87 percent of the observations. This turn to lower real interest rates has materialized despite the fact that several sovereigns have been teetering on the verge of default or restructuring (with the attendant higher risk premia). Real ex-post central bank discount rates and bank deposit rates (not shown here) have also become markedly lower since 2007.
-15.0
-10.0
-5.0
0.0
5.0
10.01945 1950 1955 1960 1965 1970 1975 1980 1985 1990 1995 2000 2005 2010
`
Advanced economies (3-year moving average)
Emerging Markets(3-year moving average)
Financial Repression Era
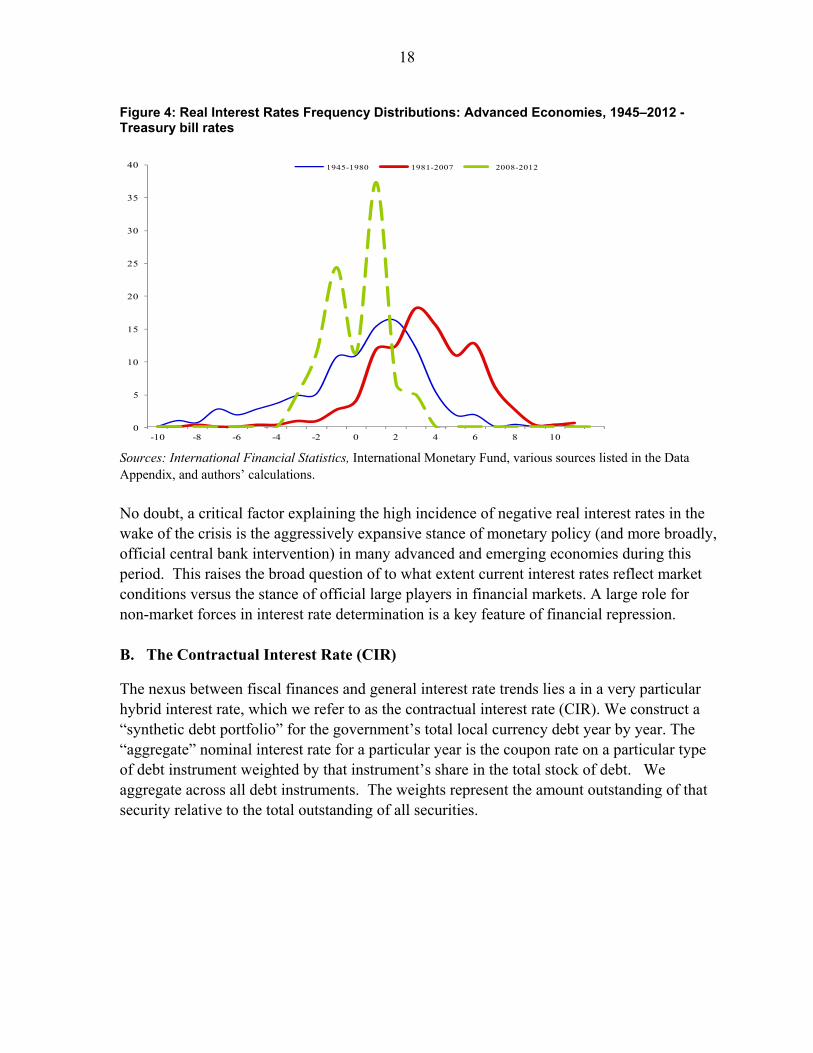
18 Figure 4: Real Interest Rates Frequency Distributions: Advanced Economies, 1945–2012 - Treasury bill rates
Sources: International Financial Statistics, International Monetary Fund, various sources listed in the Data Appendix, and authors’ calculations. No doubt, a critical factor explaining the high incidence of negative real interest rates in the wake of the crisis is the aggressively expansive stance of monetary policy (and more broadly, official central bank intervention) in many advanced and emerging economies during this period. This raises the broad question of to what extent current interest rates reflect market conditions versus the stance of official large players in financial markets. A large role for non-market forces in interest rate determination is a key feature of financial repression. B. The Contractual Interest Rate (CIR)
The nexus between fiscal finances and general interest rate trends lies a in a very particular hybrid interest rate, which we refer to as the contractual interest rate (CIR). We construct a “synthetic debt portfolio” for the government’s total local currency debt year by year. The “aggregate” nominal interest rate for a particular year is the coupon rate on a particular type of debt instrument weighted by that instrument’s share in the total stock of debt. We aggregate across all debt instruments. The weights represent the amount outstanding of that security relative to the total outstanding of all securities.
0
5
10
15
20
25
30
35
40
-10 -8 -6 -4 -2 0 2 4 6 8 10
1945-1980 1981-2007 2008-2012
19
Portfolio Real Return
Where N equals the total amount of securities at each point in time.
This face value measure is the CIR, which is the coupon rate at which the bond was issued. From the perspective of the government it represents the annual interest cost of each security; it is consistent with the accounting method used by the government. The real CIR is the constructed nominal rate adjusted by consumer price inflation. We also refer to this composite interest rate as the interest rate on government debt. C. Data and Sample
Reliable estimates of the interest rate on government debt require a considerable range of data, most of which are not readily available from even the most comprehensive government accounts and sophisticated financial databases. Indeed, most of the data used in these exercises come from a broad variety of historical government publications, many which are quite obscure, as detailed in the Data Appendix. The calculation of the CIR is a clear illustration of a case where the devil lies in the details, as the structure of government debt varies enormously both across countries and within countries over time. Differences in coupon rates, maturity, distribution of marketable and nonmarketable debt, and securitized debt versus loans from financial institutions importantly shape the overall cost of debt financing for the government. There is no “single” government interest rate that is appropriate to apply to a hybrid debt stock. The starting point to come up with a measure that reflects the true cost of debt financing is a reconstruction of the government’s debt profile over time. We employ government’s debt profiles for 12 countries (Argentina, Australia, Belgium, France, India, Ireland, Italy, Japan, South Africa, Sweden, the United Kingdom, and the United States). These were constructed from primary sources over the period 1942–2008 where possible or over shorter intervals (determined by data availability) for a subset of the sample. For the benchmark or basic calculations (CIR), this involves data on a detailed composition of debt, including maturity, coupon rate, and outstanding amounts by instrument. For the alternative measure (HPR) 20, which takes into account capital gains or losses of holding government debt, bond price data are also required. In all cases, we also
20 Estimates for this alternative measure are not presented in the current version of the paper and can be found in previous working paper versions or upon request from the authors.

20 use official estimates of consumer price inflation, which at various points in history may significantly understate the true inflation rates. 21 Data on nominal GDP and government revenues are used to express the estimates of the liquidation effect as ratios that are comparable across time and countries. It is important that the database covers all of a country’s outstanding securities, as the composition of debt varies over time. For example, in the United States, Treasury Bills constituted 6.5 percent of the total domestic debt in 1946 and 25.1 percent of the total in 1976, whereas non-marketable securities accounted for 22.7 percent in 1946, 16.7 percent in 1966 and 35.4 percent in 1976. As another example, the share of marketable rupee loans in India went from 59 percent in 1950 to 39 percent in 1970.
D. Real CIR in the 12-country sample
Figures 5a–5b plot the real ex-post interest rate on government debt (CIR) for the countries in our sample over the financial repression era, 1945–1980. In line with the preceding discussion, the figures reveal a high incidence of negative interest rates, particularly in the post-war decade for countries that accumulated war debts and in the 1970s, as inflation climbed. However, even in the interim decade of the 1960s real interest rates were, by historical standards (see Homer and Sylla, 2005) comparatively low.
21 This is primarily due to the existence of price controls which were mainly imposed during WWII and remained for several years after the end of the conflict. See Friedman and Schwartz (1982) for estimates of the actual price level in the US and UK, and Wiles (1952) for post-World War II United Kingdom.

21 Figure 5a. Real Ex-post Contractual Interest Rates on Central Government Debt, 1945–1980
Countries with significant WWII debt: Australia, United Kingdom and United States
Countries with significant WWII debt and major post-war inflation: France, Italy, and Japan
Sources: Individual country details are provided in the Data Appendix.
-20.00
-15.00
-10.00
-5.00
0.00
5.00
10.00
1945 1950 1955 1960 1965 1970 1975 1980
UKUS Australia
-70.00
-60.00
-50.00
-40.00
-30.00
-20.00
-10.00
0.00
10.00
20.00
1945 1950 1955 1960 1965 1970 1975 1980
France
Japan
Italy
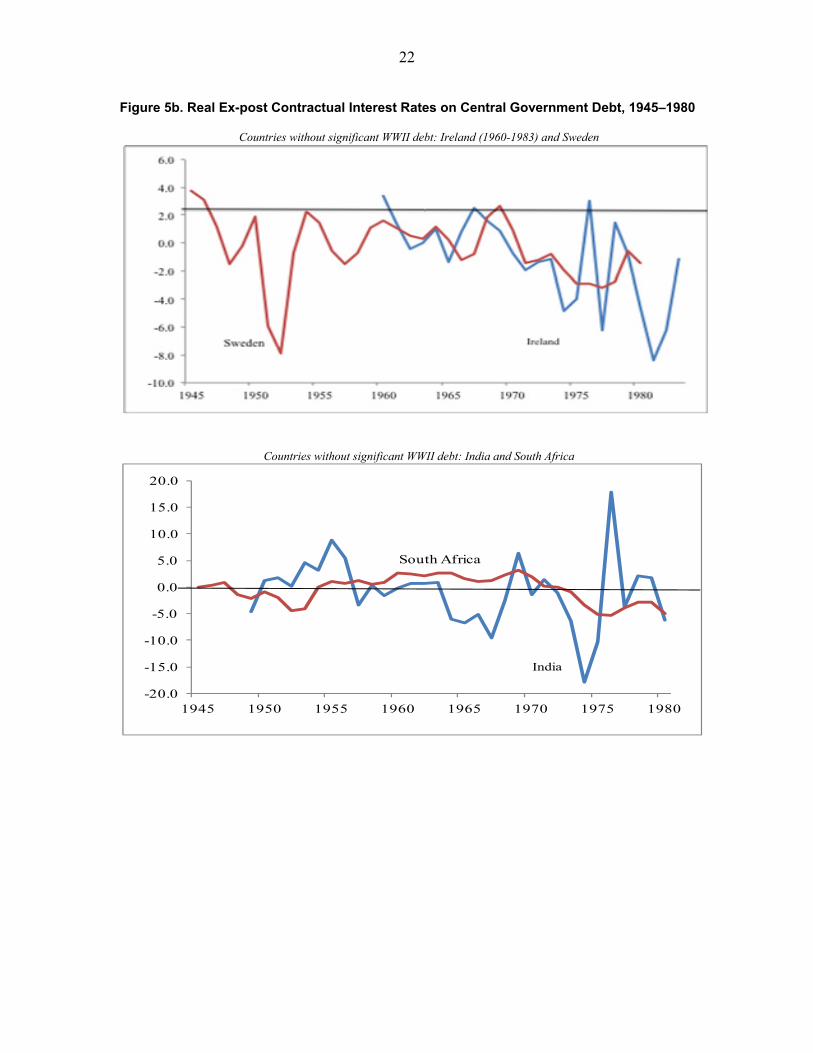
22 Figure 5b. Real Ex-post Contractual Interest Rates on Central Government Debt, 1945–1980
Countries without significant WWII debt: Ireland (1960-1983) and Sweden
Countries without significant WWII debt: India and South Africa
-20.0
-15.0
-10.0
-5.0
0.0
5.0
10.0
15.0
20.0
1945 1950 1955 1960 1965 1970 1975 1980
India
South Africa

23
Countries without significant WWII debt: Argentina
Sources: Individual country details are provided in the Data Appendix.
To assess the incidence of more broadly defined low-to-moderate real interest rates, Figure 6 presents for seven of the 12 countries the share of years where real returns on a portfolio of government debt (CIR, as defined earlier) were below zero, one, two, and three percent. We show the group that had the war-time debt overhang, but the picture is very similar for the remaining five countries. The vertical axis is already telling as it highlights that for all the countries shown real ex post interest rates were negative more than 30 percent of the time. In the era of financial repression that we examine here, real ex post interest rates on government debt reached three percent in only two years in the United States; in effect in nearly 60 percent of the years real interest rates were below one percent. The incidence of abnormally low real interest rates is comparable for the United Kingdom and Australia—both countries had sharp and relatively rapid declines in public debt to GDP following World War II.22 Even in countries with substantial economic and financial volatility during this period (such as Italy), real interest rates on government debt above three percent were relatively rare (accounting for no more than 20 percent of the observations).
22 “Abnormally low” by the historical standards which include periods of liberalized financial markets before and after 1945–1980; see Homer and Sylla’s (2005) classic book for a comprehensive and insightful history of interest rates.
-80.00
-70.00
-60.00
-50.00
-40.00
-30.00
-20.00
-10.00
0.00
10.00
1945 1950 1955 1960 1965 1970 1975 1980
Argentina

24 Figure 6. Incidence of Negative-to-Moderate Real Interest Rates, 1945–1980, Seven Countries with WWII Debt Buildup
Notes: The real interest rate is calculated as defined in equation (1). The countries without a WWII debt build up are: Argentina, India, Ireland, South Africa, and Sweden.
IV. THE LIQUIDATION OF GOVERNMENT DEBT: CONCEPTUAL FRAMEWORK
A. Conceptual Framework
The objective of this section is to show financial repression works to reduce the burden of debt and how one could separate–at least conceptually—the effect of unanticipated inflation from that of financial repression. The point of departure is the consolidated budget for the government, which is obtained by combining the budget constraints of the fiscal and monetary authorities. This budget constraint makes explicit the link between monetary and fiscal policy. In real terms it is given by:
11 1
(1)
On the left side of (1) are outlays in a given year: real government spending (g ) and the real interest payments on the real stock of debt, which depends on the nominal interest rate set in the previous period (i ), the inflation rate in the current period (π ), and the real debt stock from the previous period (b ).23 The real interest rate paid on the stock of debt issued in the
23 Expressing the budget in terms of a one-period bond simplifies the notation without changing the implications that would be derived from explicitly considering a richer maturity structure.
20
30
40
50
60
70
80
90
100
Australia Belgium France Italy Japan United Kingdom United States
Below 0 Below 1 percent Below 2 percent Below 3 percent

25 previous period is an ex post real interest rate, since it is determined by the realized rate of inflation. The right hand side shows the sources of income: tax revenues (τ ), newly issued real debt (b ), and the seigniorage revenues from printing money, where h is high-powered money (real monetary base).24 While inflation affects seigniorage revenues as well as other items of the budget constraint, we ignore those effects to focus on the government’s real debt payments.25 The budget constraint can be re-written in terms of the ex post real interest rate (r ) as follows: To summarize, the three relevant interest rates are:
111
Expost real interest rate (3)
111
Ex ante real interest rate (4)
111
Ex ante free market real interest rate (5)
These terms can be incorporated into the government budget constraint. After some manipulations, we have the desired breakdown26
1 11
1
τ1
((6)
The "unanticipated inflation effect" is the difference between realized and expected inflation multiplied by the real cost of previous period stock of debt, while the "financial repression effect" is the difference between the free market and actual nominal interest rate multiplied
24 Seigniorage is the change in the nominal monetary base relative to the previous period, and divided by the
current price level. It arises from two sources as shown below: h h h The first
component of seigniorage comes from changes in the real stock of monetary base. The second comes from a depreciation in the outstanding stock of real balances, and is sometimes referred to as inflation tax. In steady state, only the second component will be positive.
25 See Persson and Svensson (1996) for a study on the overall fiscal gains from an increase in the inflation rate in Sweden.
26 The term, where i i , is added and subtracted from the left-hand side of equation
(1).

26 by the real stock of debt from the previous period. In the absence of regulatory restrictions and official interventions that would cause i to be different from i , and if actual inflation was equal to expected inflation, then the last two terms on the left side would be equal to zero. In this case, 1 r would be both the ex ante and ex post real interest rate, and there would be no savings in interest payments for the government from either source. Whenever the actual inflation rate is above the expected inflation rate, the unanticipated inflation effect will be positive and the government will save on interest payments by the amount given by this term27. The opposite is true when expected inflation is higher than the actual inflation rate. The financial repression effect will be positive and represent savings for the government when the nominal interest rate does not reflect the true cost of borrowing for the government, so that the actual nominal interest rate is below the free market interest rate. Here it is clear that we can distinguish between two scenarios: first is the general case where the observed interest rate is below the free or market rate—this is “saving” to the government; the second scenario is a special case of the first, when the real interest rate is not only below the market or free rate but it is actually negative—so it becomes a tax on the bond holder. This is what we dub the liquidation case where the real value of government debt is actually reduced. Both effects can be present at the same time. In this case, financial repression has an indirect effect on the size of the unanticipated inflation effect. This indirect effect comes from the fact that the ex-ante real interest rate (r ) will be lower than what it would be in the absence of
financial repression induced “frictions”. In other words, for a given π π
π, the savings from
unanticipated inflation will be lower in the presence of financial repression. This interaction is potentially important when modeling inflation expectations and inflation surprises, although it will not be separately estimated in this paper. B. Measurement Challenges: Putting the concepts to the data
Equation (6) identifies the different elements required to estimate the sources of interest payment savings for the government at face value. A central challenge is that it is (most often) not possible to directly observe inflation expectations and free market interest rates. Giovanini and de Melo (1993), for instance, make the plausible assumption that for emerging markets and periphery advanced economies over 1974–1987, the free market rate can be proxied by the interest rate on the external debt (which the authorities cannot directly
27 When the only friction is the difference between actual and expected inflation, it follows that r r

27 control) while the interest rate on domestic debt is determined by financial repression policies as described.28 Unfortunately, we cannot observe such a benchmark for the “free rate” over 1945–1980, most (if not all) countries had capital controls and similar financial repression policies in the McKinnon and Pill (1997) sense (see Battilossi, 2005, and Background Material, Appendix II). During this period, many countries (emerging markets included) had no external debt at all (as discussed), as the Depression and WWII had brought to a halt the trend in borrowing from abroad.29 One could make some assumption about the relationship between observed real economic growth and the “equilibrium” real interest rate. Alternatively, one can answer the question what were total ex-post savings in debt servicing costs under alternative assumptions about market real interest rates. To that end, we compared the ex-post real contractual interest rate to three feasible scenarios: real interest rates of one, two and three percent over 1945–1980. This range is consistent with common assumptions (and estimates) of preference parameters. Interest savings is the difference between the hypothetical “market” rate and the observed real rate on the debt for all years. The tax base is the level of domestic debt. The estimated savings under the three simulation scenarios are expressed as a percent of nominal GDP and total receipts. Interest savings, however, do not necessarily speak to the issue of debt reduction. When real interest payments are negative, these constitute a revenue (subsidy) rather than an expenditure for the government. In equation (2), when debt is at face value, this will be the case where r 0. In these years, the sum of the unanticipated inflation effect and the financial repression effect is large enough to outweigh the free market interest payments, which is given by the second term on the left hand side of the equation. Given that government debt is liquidated in any year where real interest payments are negative, those years will be defined as liquidation years. The saving (or revenue) to the government or the liquidation effect is the (negative) real interest rate times the “tax base,” which is the stock of domestic government debt outstanding.
The liquidation effect represents a lower bound for the financial repression tax.30 In effect, in any year in which the administered interest rate is below the market rate of interest (that
28 Note that this assumption still represents an approximation to the “free rate, i .” While the domestic and external debt have a common issuer (hence a shared default risk) the fact that external debt is US dollar denominated and domestic debt is local currency debt, implies that Giovanini and de Melo also have to contend with the unobservable expected currency depreciation/appreciation component, which they estimate.
29 See Reinhart and Rogoff (2009) chapter on domestic debt.
30 Although it is possible for the equilibrium real interest rate to be negative during recession, our sample period coincides with a high growth period. The equilibrium real interest rate estimated for the US by Laubach and
(continued…)

28 would have otherwise prevailed absent regulation, intervention, etc.) there is a saving for the government. This saving on interest costs is irrespective of whether the real interest rate is negative or positive on that particular year. In order to gain some understanding of the relative contribution of inflation expectations and FR on domestic debt, we estimate those expectations in Section V. By considering the remainder of the total effect as due to financial repression, this approach also provides some understanding of the relative importance of financial repression.
V. EMPIRICAL ESTIMATES
This section presents estimates of the interest savings (financial repression tax) and liquidation effect (debt reduction) for twelve advanced and emerging economies for most of the post-World War II period. Our main interest lies in the period prior to the process of financial liberalization that took hold during the 1980s—that is, the era of financial repression.31 However, as noted, this three-plus decade-long stretch is by no means uniform-we refer to these as stages of financial repression. The decade immediately following World War II was characterized by a very high public debt overhang—the legacy of the war, a higher incidence of inflation, a public used to controls, and often multiple currency practices (with huge black market exchange rate premiums) in many advanced economies.32 The next decade (1960s) was the heyday of the Bretton Woods system with heavily regulated domestic and foreign exchange markets and more stable inflation rates in the advanced economies (as well as more moderate public debt levels). The 1970s was quite distinct from the prior decades, as leakages in financial regulations proliferated, the fixed exchange rate arrangements under Bretton Woods among the advanced economies broke down, and inflation began to resurface in the wake of the global oil shock and accommodative monetary policies in the United States and elsewhere. To this end, we also provide estimates of the liquidation of government debt for relevant sub-periods. Thus in the latter stage of the financial repression era much of the action came from inflation, as opposed to the aftermath of the war, when regulation succeeded in keeping nominal interest rates low and stable.
Williams (2003) during the period 1961Q1–2013Q4 is negative only during the period 2012Q4–2013Q4 [http://www.frbsf.org/economic-research/economists/john-williams/].
31 The fact that during this period capital accounts were mostly closed does not allow us to do an across country comparison of real interest rates. For this reason, we restrict our analysis to country-by-country.
32 See De Vries (1969), Horsefield (1969), Reinhart and Rogoff (2002).
29 A. Savings on interest payments and the financial repression tax
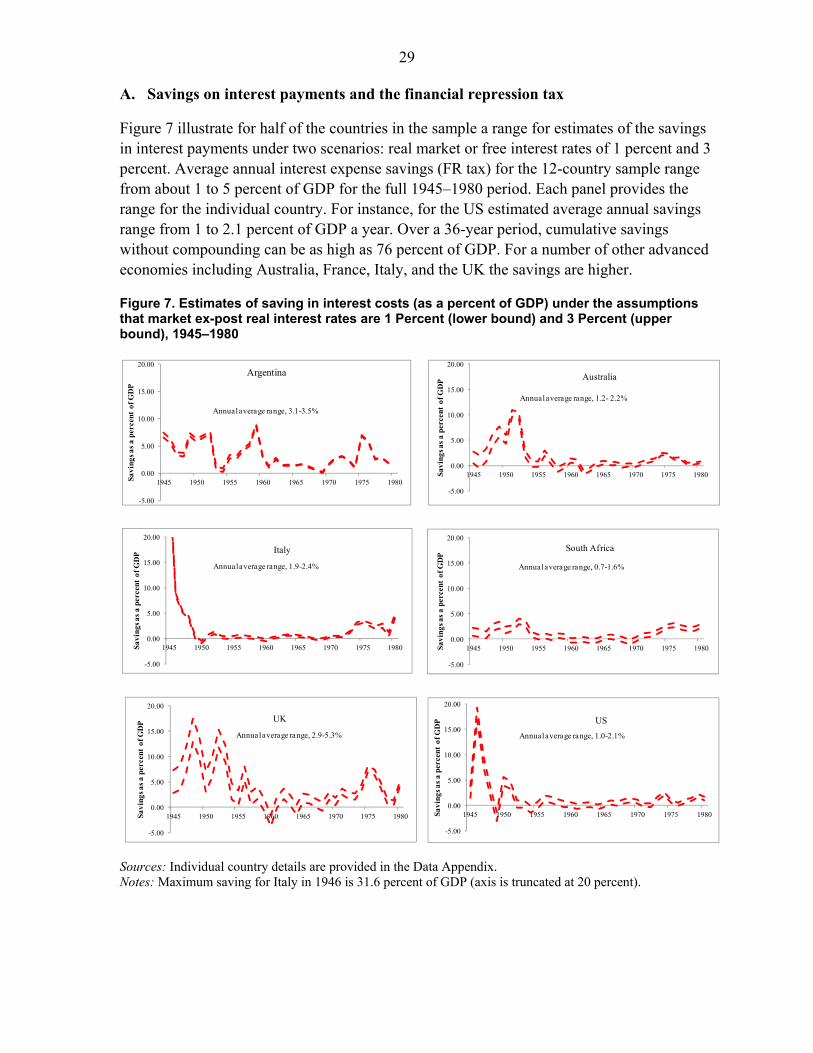
Figure 7 illustrate for half of the countries in the sample a range for estimates of the savings in interest payments under two scenarios: real market or free interest rates of 1 percent and 3 percent. Average annual interest expense savings (FR tax) for the 12-country sample range from about 1 to 5 percent of GDP for the full 1945–1980 period. Each panel provides the range for the individual country. For instance, for the US estimated average annual savings range from 1 to 2.1 percent of GDP a year. Over a 36-year period, cumulative savings without compounding can be as high as 76 percent of GDP. For a number of other advanced economies including Australia, France, Italy, and the UK the savings are higher. Figure 7. Estimates of saving in interest costs (as a percent of GDP) under the assumptions that market ex-post real interest rates are 1 Percent (lower bound) and 3 Percent (upper bound), 1945–1980
Sources: Individual country details are provided in the Data Appendix. Notes: Maximum saving for Italy in 1946 is 31.6 percent of GDP (axis is truncated at 20 percent).
-5.00
0.00
5.00
10.00
15.00
20.00
1945 1950 1955 1960 1965 1970 1975 1980Savi
ngs a
s a
perc
ent
of G
DP
Annual average range, 1.2- 2.2%
Australia
-5.00
0.00
5.00
10.00
15.00
20.00
1945 1950 1955 1960 1965 1970 1975 1980Savi
ngs a
s a
perc
ent
of G
DP
Annual average range, 1.9-2.4%
Italy
-5.00
0.00
5.00
10.00
15.00
20.00
1945 1950 1955 1960 1965 1970 1975 1980Savi
ngs a
s a
perc
ent
of G
DP
Annual average range, 2.9-5.3%
UK
-5.00
0.00
5.00
10.00
15.00
20.00
1945 1950 1955 1960 1965 1970 1975 1980Savi
ngs a
s a
perc
ent
of G
DP
Annual average range, 1.0-2.1%
US
-5.00
0.00
5.00
10.00
15.00
20.00
1945 1950 1955 1960 1965 1970 1975 1980Savi
ngs a
s a
perc
ent
of G
DP
Argentina
Annual average range, 3.1-3.5%
-5.00
0.00
5.00
10.00
15.00
20.00
1945 1950 1955 1960 1965 1970 1975 1980Savi
ngs a
s a
perc
ent
of G
DP
Annual average range, 0.7-1.6%
South Africa

30 B. Incidence and magnitude of the “liquidation tax”
Table 2 provides information on a country-by-country basis for the period under study, column (2); the incidence of debt liquidation years (share of years with negative real rates, column 3); the average real interest rate during the whole sample, column (4); and the minimum real interest rate recorded (and the year in which that minimum was reached). Given its notorious high and chronic inflation history, coupled with heavy-handed domestic financial regulation and capital controls, it is not surprising that Argentina tops the list. Almost all the years (94 percent) were recorded as liquidation years, as the Argentine real ex-post interest rates were negative in every single year during 1945–1980 except for 1954 and 1969. For India, the comparable share was 50 percent. Before concluding that debt liquidation through financial repression was/is predominantly an emerging market phenomenon, note that the share of liquidation years for the United Kingdom was about 67 percent during 1945–1980. For the United States, the world’s financial center, close to half of the years during that same period Treasury debt had negative ex post real interest rates. Table 2. Incidence and Magnitude of Liquidation of Public Debt via Negative Real Interest Rates, 1945–1980
Notes: Share of liquidation years is defined as the number of years during which the real interest rate on the portfolio is negative divided by the total number of years as noted in column (2). 1 No data on the composition of debt to calculate CIR available for 1964-1968. 2 No data on the composition of debt to calculate CIR available for 1953-1958, 1960-1963. 3 In 1944 (not included in the calculations) inflation peaked at 492 Percent.
Country PeriodShare of liquidation
years Average Minimum Year
(1) (2) (3) (4) (5) (6)
Australia 1945-1980 44.4 -1.2 -14.1 1952
Belgium1 1945-1974 28.0 0.5 -7.4 1974
France2 1945-1980 65.4 -6.6 -34.5 1948
Italy3 1945-1980 55.6 -4.6 -56.8 1945
Japan 1945-1980 50.0 -2.7 -65.6 1946
United Kingdom 1945-1980 66.7 -1.7 -11.2 1975
United States 1945-1980 50.0 -0.3 -13.6 1946
Argentina 1945-1980 94.4 -21.5 -73.5 1976
India 1949-1980 50.0 -0.9 -17.9 1974
Ireland 1960-1983 58.3 -1.1 -8.4 1981
South Africa 1945-1980 38.9 -0.4 -5.3 1976
Sweden 1945-1980 55.6 -0.4 -7.9 1952
Countries with large buildup of debt during the war
Countries with no large debt buildup during the war
Real contractual interest rate (CIR)
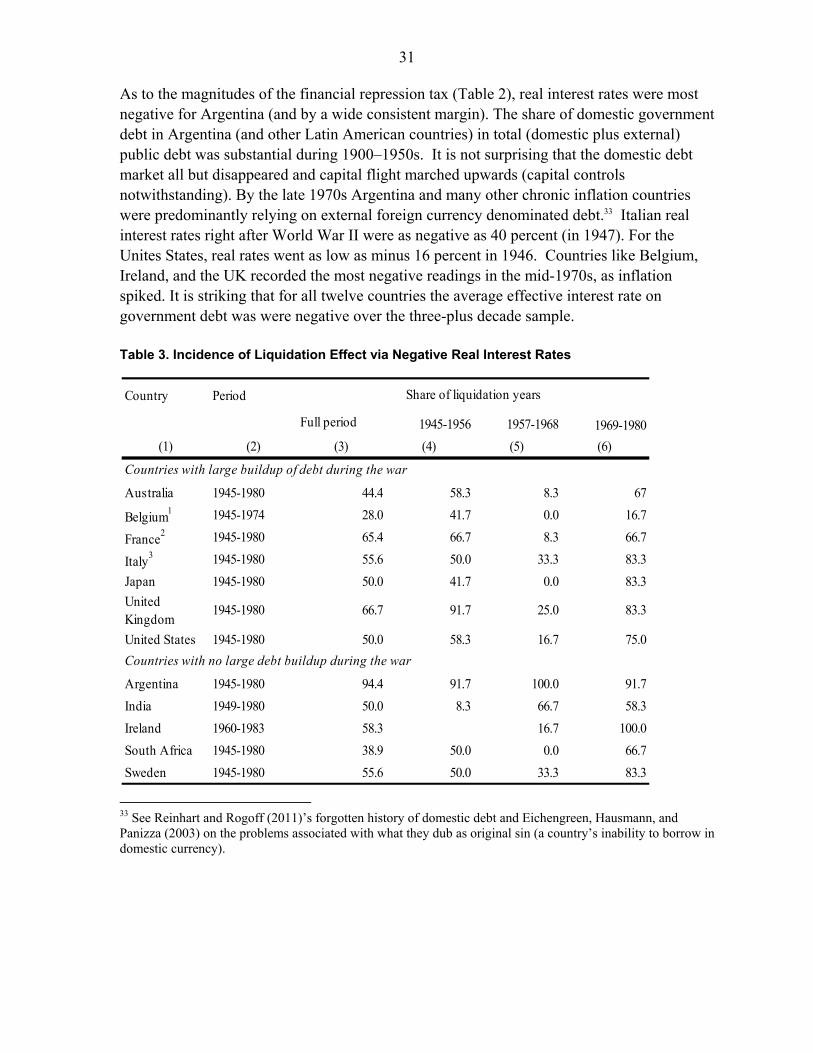
31 As to the magnitudes of the financial repression tax (Table 2), real interest rates were most negative for Argentina (and by a wide consistent margin). The share of domestic government debt in Argentina (and other Latin American countries) in total (domestic plus external) public debt was substantial during 1900–1950s. It is not surprising that the domestic debt market all but disappeared and capital flight marched upwards (capital controls notwithstanding). By the late 1970s Argentina and many other chronic inflation countries were predominantly relying on external foreign currency denominated debt.33 Italian real interest rates right after World War II were as negative as 40 percent (in 1947). For the Unites States, real rates went as low as minus 16 percent in 1946. Countries like Belgium, Ireland, and the UK recorded the most negative readings in the mid-1970s, as inflation spiked. It is striking that for all twelve countries the average effective interest rate on government debt was were negative over the three-plus decade sample. Table 3. Incidence of Liquidation Effect via Negative Real Interest Rates
33 See Reinhart and Rogoff (2011)’s forgotten history of domestic debt and Eichengreen, Hausmann, and Panizza (2003) on the problems associated with what they dub as original sin (a country’s inability to borrow in domestic currency).
Country Period
Full period 1945-1956 1957-1968 1969-1980
(1) (2) (3) (4) (5) (6)
Australia 1945-1980 44.4 58.3 8.3 67
Belgium1 1945-1974 28.0 41.7 0.0 16.7
France2 1945-1980 65.4 66.7 8.3 66.7
Italy3 1945-1980 55.6 50.0 33.3 83.3
Japan 1945-1980 50.0 41.7 0.0 83.3
United Kingdom
1945-1980 66.7 91.7 25.0 83.3
United States 1945-1980 50.0 58.3 16.7 75.0
Argentina 1945-1980 94.4 91.7 100.0 91.7
India 1949-1980 50.0 8.3 66.7 58.3
Ireland 1960-1983 58.3 16.7 100.0
South Africa 1945-1980 38.9 50.0 0.0 66.7
Sweden 1945-1980 55.6 50.0 33.3 83.3
Countries with large buildup of debt during the war
Countries with no large debt buildup during the war
Share of liquidation years

32
Notes: Share of liquidation years is defined as the number of years during which the real interest rate on the portfolio is negative divided by the total number of years as noted in Table 2. 1No data available for 1964-1968. 2 No data available for 1953-1958, 1960-1963. While we have data for 1945-1946, we exclude these very high inflation years. Inflation peaked at 74 Percent in 1946. 3 Calculations based on the period 1946-1980 to exclude war years; in 1944, inflation peaked at 492 Percent. 4 The data for 1945 and 1946 is available but inflation approaches 400 Percent.
Table 3 shows the share of liquidation years by subperiods. There are two patterns that can be identified. The most common one is a high incidence of liquidation years immediately after the end of WWII, a lower incidence between 1957 and 1968, and a higher incidence again in the 1970s. This is the case for nine countries: Australia, Belgium, France, Italy, Japan, South Africa, Sweden, the UK and the US. In all of these countries, there is a higher incidence during the period 1969–1980 than during 1945–1956. These are typically countries where the debt ratios were high at the end of WWII. The low incidence period of 1957–1968 coincides with the golden era of Bretton Woods, while the high incidence during the 1970s occurs at a time when a surge in the price of commodities led to an increase in the inflation rates of most countries. The second pattern occurs in the case of Argentina, India, and Ireland, who exhibit a reasonably constant incidence of liquidation years across the subperiods. An interesting observation is that, for the countries for which we have data, the incidence of liquidation years diminishes after 1980, when most of the controls were lifted and the era financial liberalization began.
VI. ESTIMATES OF THE LIQUIDATION EFFECT
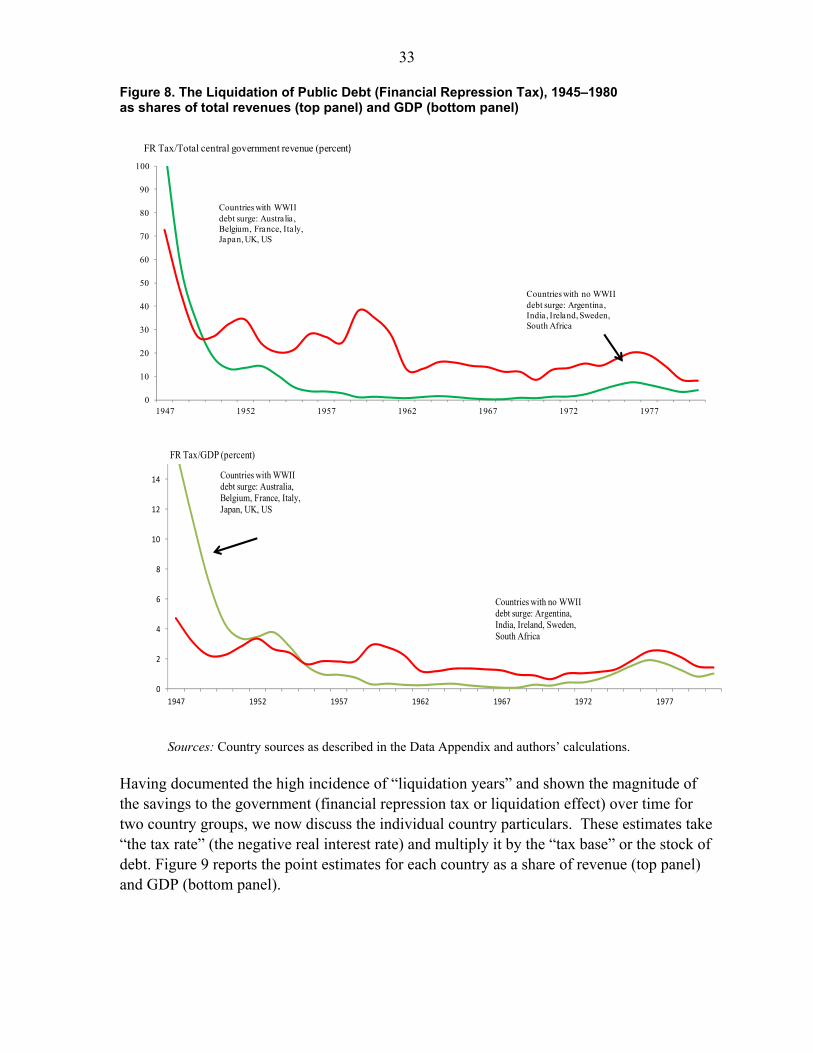
Figure 8 shows the time profile of the liquidation effect as it evolved through the era of financial repression. There are two distinct patterns in the twelve-country sample. The first group is where the negative real interest rates coincided, in the years following World War II, with peak debt (i.e., the tax base). This pattern is evident in Australia, Belgium, France, Italy, Japan, the United Kingdom and the United States, although negative real rates re-emerge following the breakdown of Bretton Woods in 1974–1975. One could say it has a slight U-shaped pattern. Then there is the second group where there is no surge in debt associated with WWII, but there is a persistent reliance on financial repression (as another steady form of taxation) throughout the sample as a way of funding government deficits and/or eroding existing government debts. The cases of Argentina (in the extreme), India, and South Africa in the emerging markets and Ireland and Sweden in the advanced economies make up this group. This flatter profile over time is shown by the red line in Figure 8, which averages the four aforementioned countries. The difference in the two groups is most evident when the financial repression tax is scaled by revenues.
33 Figure 8. The Liquidation of Public Debt (Financial Repression Tax), 1945–1980 as shares of total revenues (top panel) and GDP (bottom panel)
Sources: Country sources as described in the Data Appendix and authors’ calculations.
Having documented the high incidence of “liquidation years” and shown the magnitude of the savings to the government (financial repression tax or liquidation effect) over time for two country groups, we now discuss the individual country particulars. These estimates take “the tax rate” (the negative real interest rate) and multiply it by the “tax base” or the stock of debt. Figure 9 reports the point estimates for each country as a share of revenue (top panel) and GDP (bottom panel).
0
10
20
30
40
50
60
70
80
90
100
1947 1952 1957 1962 1967 1972 1977
Countries with WWIIdebt surge: Australia ,Belgium, France, Italy,Japan, UK, US
Countries with no WWIIdebt surge: Argentina, India , Ireland, Sweden,South Africa
FR Tax/Total central government revenue (percent)
0
2
4
6
8
10
12
14
1947 1952 1957 1962 1967 1972 1977
Countries with WWIIdebt surge: Australia,Belgium, France, Italy,Japan, UK, US
Countries with no WWIIdebt surge: Argentina,India, Ireland, Sweden,South Africa
FR Tax/GDP (percent)

34 The magnitudes are in all cases non-trivial, irrespective of whether we use the benchmark measure that is exclusively based on interest rate (coupon yields) or the alternative measure that includes capital gains (or losses) for the cases where the bond price data is available.34 Turning first to the FR tax as a share of tax revenues, it is very clear that in ¾ of the countries the liquidation tax was anywhere between 10 and 40 percent of tax revenues, which can hardly be considered trivial. For the United States and the United Kingdom the annual liquidation of debt via negative real interest rates amounted on average to 2 to 3 ½ percent of GDP per liquidation year. Interestingly (but not entirely surprising), the average annual magnitude of the liquidation effect for Argentina is about the same as that of the UK, despite the fact that the average real interest rate averaged about -2 percent for the UK and -21 percent for Argentina during the 1945–1980 repression era. Just as money holdings secularly shrink during periods of high and chronic inflation, so does the domestic debt market.35 Argentina’s “tax base” (domestic public debt) shrank steadily during this period; at the end of World War II nearly all public debt was domestic and by the early 1980s domestic debt accounted for less than ½ of total public debt. Without the means to liquidate external debts, Argentina defaulted on its external obligations in 1982. Countries like Ireland, India, and South Africa which, as stressed, did not experience a massive public debt build-up during World War II recorded more modest annual savings (but still substantive) during the heyday of global financial repression.36
34 The latter measure is not reported here but available from the longer working paper version or upon request from the authors.
35 These issues are examined in Reinhart and Rogoff (2009).
36 These issues are examined in Reinhart and Rogoff (2009).

35 Figure 9. The “Liquidation Effect” revenues per liquidation year: As a Percent of Tax Revenues and GDP
Sources: See data appendix and sources cited therein and authors’ calculations. Notes: 1945–1980 for Australia, France, UK, US, South Africa; 1945–1980 for Argentina; 1945–1974 for Belgium; 1949–1980 for India; 1960–1983 for Ireland; 1946–1980 for Italy; 1945–2008 for Japan; and 1945–1990 for Sweden. Arguably the financial repression “era” did not end uniformly in 1980. In effect, for Italy it persisted into the early 1990s and for India it runs through the present. It is also ongoing in Argentina, (albeit with multiple policy reversals since 1980).
To sum up, the revenues from the FR tax, as calculated here were the most significant in reducing government debt to the tune of averaging about 8 percent of GDP across the twelve countries during the early stages (1945–1956) of the FR era (see Figure 2 and inset). This relatively high “revenue” importantly owes to the markedly larger tax base (the size of the domestic debt) right after the war. Also, the narratives on the existence of leakages via evasion of capital controls and the emergence of shadow banking all point to this phenomenon becoming a larger issue during the 1970s, as the Bretton Woods arrangements
41.0
57.2
11.9
16.3
10.3
37.2
9.1
23.2
11.1
7.2
6.8
3.0
0.0 10.0 20.0 30.0 40.0 50.0 60.0 70.0
Argentina
Italy
Japan
India
United Kingdom
France
Australia
Belgium
United States
South Africa
Ireland
Sweden
Percent of revenues
Countries without a significant WWIIpublic debt build-up(in red)
7.2
6.1
3.1
3.2
2.4
3.3
4.6
1.9
1.9
1.3
1.4
0.6
0.0 1.0 2.0 3.0 4.0 5.0 6.0 7.0 8.0
Japan
France
Argentina
Italy
Australia
United Kingdom
Belgium
United States
Ireland
India
South Africa
Sweden
Percent of GDP
Countries without a significant WWIIpublic debt build-up(in red)

36 began to fall apart. The more modest size of the tax in the earlier era also provided less of a “push” factor out of government securities.
VII. FINANCIAL REPRESSION OR UNANTICIPATED INFLATION?
The measures presented so far do not distinguish between the relative contributions of inflation surprises and financial repression. The goal of this section is to estimate inflation expectations, in order to identify the relative contribution of each factor. The empirical strategy to estimate inflation expectations follows Fama (1975) and Mishkin (1981), who were interested in testing for market efficiency. An advantage of this method is that it allows standard errors to be obtained. The methodology and results of this intermediate exercise are relegated to the Appendix Note on inflation expectations while Table 3 shows the share of inflation surprises relative to the total number of years in the sample for each country, as well as the overlap between inflation surprises years and liquidation years. The results are presented using both the lower and upper bound estimates for the standard errors. The average share of inflation surprises each county has is 10 percent using upper bound standard errors and 25 percent using the lower bound. The frequency of inflation surprise years in liquidation years is 17 to 42 percent, depending on which estimate for the standard errors is used. In other exercises, we relaxed our definition of an inflation surprise (from two standard deviations to one) and also worked out the case where inflation forecasts follow a random walk. In these various scenarios inflation surprises are not the primary drivers of liquidation years. 37 For most countries, inflation surprises are concentrated immediately after the end of World War II and during the 1970s. It is worth noting that, after the end of World War I, most countries experienced low inflation rates as they tried to return to the gold standard. This led many people to expect low inflation rates after World War II, and many economists thought that the biggest challenge after the war would be slow growth and high unemployment (Studenski and Krooss, 1963). What actually happened is that average inflation rate in the decade after WWII was 7 percentage points higher than the average inflation rate in the decade after WWI. The other period with high incidence of inflation surprise years, in the 1970s, corresponds to a period of oil shocks and a surge in the price of commodities. The gist of this exercise is that debt liquidation had more to do with financial repression than with inflation surprises except for the 1970s). While most exercises (including this one) involving estimates of inflation expectations (apart from survey data), need to be taken with a
37 Of course, the predictive equations are estimated over the entire period, implying surprises cumulate to zero.

37 grain of salt, this finding is in line with our comprehensive chronology of regulations. Controlled interest rates, after all, will often yield negative ex post real interest rates even if individuals were possessed with perfect foresight.
Table 4. Inflation Surprises and Liquidation Years
Notes: Inflation surprises are defined as years where the realized inflation rate is two standard deviations above the estimated expected inflation rate. A comparable exercise for one standard deviation is included in the appendix, while an earlier version of the paper also reports results for a random walk alternative. The actual standard errors cannot be obtained but a lower and upper bound for them.
VIII. REGULATION AND CAPTIVE AUDIENCES: PAST AND PRESENT The high incidence of low and negative real interest rates since the crisis in advanced economies (Figure 4) is not the only parallel to the era of financial repression. Regulatory changes have taken a decided turn towards promoting home bias by requiring institutions to hold higher shares of government debt in their portfolios or in more extreme cases (such as Iceland and Cyprus) by the introduction of strict foreign exchange controls. The European Union is in the process of moving toward a financial transactions tax (see Box 1) and has taken measures to curb activities that are deemed speculative (see van Riet, 2013 for an extensive discussion of these developments). Moral suasion has also been applied to government debt auctions in periphery Europe. Table 4, illustrates this trend in regulatory and what are often now called macro-prudential measures. The list is barely the tip of the iceberg, as volumes would be required to fully capture all that has been turned into law—let alone what has been and continues to be discussed. Rising country risk premium and credit rating downgrades have also been major contributors to the decline in cross-border exposures for financial institutions at large and the return of home bias.
CountryUpper Lower Upper Lower
Countries with large buildup of debt during the warAustralia 6 22 13 44Belgium 8 24 29 43France 19 35 29 53Italy 14 33 25 60Japan 17 31 33 61United Kingdom 6 33 8 46United States 6 25 11 39Countries with no large buildup of debt during the warArgentina 22 36 24 38India 3 25 6 50Ireland 4 17 7 29South Africa 6 25 14 57Sweden 6 14 10 25
Share of Inflation Surprises
Overlap with Liquidation Years

38
In the United States, the Federal Reserve and foreign central banks hold a record share of the outstanding marketable debt (these data start in 1945). With domestic banks, insurance companies, and pension funds increasingly exposed to domestic government securities, one can only speculate that the next targeted audience may be households (as during past wars when debt was escalating). Table 5. The Re-emergence of Financial Repression, 2008–2013
The Advanced Economies (mostly directing domestic credit to the government)
Cyprus, March 2013: Severe capital controls limiting credit card transactions, daily withdrawals, money transfers abroad and the cashing of checks. The controls were announced as a temporary measure to deal with the banking/external debt crisis. How temporary remains to be seen (see Iceland entry). EU, July 2013: Bank regulation tightens capital requirements and introduces new liquidity rules (new standards phased in from January 2014 to January 2019). Government securities in domestic currency are deemed to be zero-risk, high-quality and liquid assets, which supports the banking sector’s demand for sovereign bonds. France, December 2010: Liquidation of Fonds de Reserve Pour Les Retraites (FFR) The French government changed the law to shift the €37bn FFR from providing long-term financial support to the French PAYG pension system after 2020 to instead pay an annual €2.1bn to the Caisse d’Amortissement de la Dette Sociale (CADES) from 2011 to 2024 and at that point transfer all remaining assets to the CADES in one lump-sum payment. This shift in FFR’s investment horizon has meant a radical shift in asset allocation from longer-term diversified riskier assets to a short-term LDI-strategy dominated by liability matching short-term French government bonds. For the duration of its lifespan the FRR has consequently been transformed into a large captive buyer of French government bonds. Iceland, October 2010: Strict controls on both inflows and outflows to stem capital flight during the crisis. The measures were announced as temporary but the left over debt overhang from the carry trade in some of the largest banks significantly raises the risks associated with lifting the controls. See Baldursson and Portes, 2013. Ireland, 2010: Use of the National Pension Reserve Fund to Recapitalize Banks As a result of the banking crisis, Ireland National Pension Reserve Fund (NPRF) may have to contribute up to €17.5bn to recapitalize Ireland’s banks. The NPRF was originally set up in 2001 to help finance the long-term costs of Ireland's social welfare and public service pensions from 2025 onwards. However, a 2010 law directed the NPRF to invest in Irish government securities and provides the legal authority for the Irish government to fund capital expenditure from the NPRF from 2011-2013. April 2011: Levy on pension funds. During 2011-2013, the Irish government imposed a levy of 0.6 percent on pension fund assets, with a 0.75 percent levy imposed in 2014 and a final 0.15 percent levy due to be imposed in 2015. Japan, March 2010: Reversal of Post Privatization and Raising of Deposit Ceiling The new DPJ government reversed the 2007 plan to privatize Japan Post, the world’s largest financial conglomerate with more than ¥300tr in assets. Crucially, the DPJ government with the new law also doubled the deposit cap at Japan Post Bank to ¥20mn and raised the life insurance coverage limit at Japan Post Insurance Co. from ¥13mn to ¥25mn. Given Japan Post’s traditional roughly 75 percent asset allocation to JGBs, and under the assumption that consumers will transfer deposits to a company certain to enjoy a government guarantee, the

39 reversal of the Japan Post privatization provides additional incentives to a captive customer of Japanese government debt. Portugal, 2010: The transfer of the previously privatized Portugal Telecom pension scheme back to the Portuguese government, which in the process immediately booked €2.8bn (1.6 Percent of GDP) in extra revenues. This enabled the Portuguese government to improve its budget deficit in 2010 sufficiently to cosmetically appear to be in line with annual EU deficit reduction targets. Spain, April 2010: Interest rate ceilings on deposits. The Ministry of Finance (MoF) requires that institutions offering deposit interest rates that are considered to be above market rates (determined by MoF) double their contributions to the Fondo de Garantía de Depósitos. April 2013: Spain’s social security pension reserve fund increased its portfolio allocation to domestic government bonds in 2012 from 90 Percent to 97.5 Percent. (In 2007, the fund was 50 Percent invested in Spanish bonds.) UK, October 2009, UK Financial Services Authority (FSA) puts a global regulatory liquidity marker. The proposal by the FSA requires UK banks, investment banks, and subsidiaries or branches of foreign banks operating in the London market to hold more high quality government securities—at least around ₤110 billion more (at that time), and cut their reliance on short-term funding by 20 percent in the first year alone.
US, October 2013. The Federal Reserve Board proposed a rule to strengthen the liquidity positions of large financial institutions. The proposal would for the first time create a standardized minimum liquidity requirement for large and internationally active banking organizations and systemically important, non-bank financial companies designated by the Financial Stability Oversight Council. These institutions would be required to hold minimum amounts of high-quality, liquid assets such as government and corporate debt that can be converted easily and quickly into cash.
Sources: Baldursson and Portes, (2013), Reinhart (2012) and Magud, Reinhart, Rogoff (2011), van Riet (2013). Dobbs et.al. (2013), who study the distributional impact of these very low post- crisis interest rates arrive at estimates of debt servicing savings to governments that are in line with the magnitudes observed in the financial repression era studied here. For instance, since 2007 they estimate that cumulative savings to the United States and United Kingdom governments from the low rate environment are around 7 percent of GDP (which is roughly about 1 ½ percent saving per annum). This is comparable to the financial repression tax magnitudes reported here for the US over 1945–1980 (see Figure 7a). As public debts have yet to stabilize in many of the advanced economies, the impact of interest rate policy on fiscal finances will continue to expand.
IX. CONCLUDING REMARKS
The substantial tax on financial savings imposed by the financial repression that characterized 1945–1980 was a major factor explaining the relatively rapid reduction of public debt in a number of the advanced economies. This fact has been largely overlooked in much of the literature on debt reduction. The UK’s history offers a pertinent illustration. Following the Napoleonic Wars, the UK’s public debt was a staggering 260 percent of GDP; it took over 40 years to bring it down to about 100 percent (a massive reduction in an era of
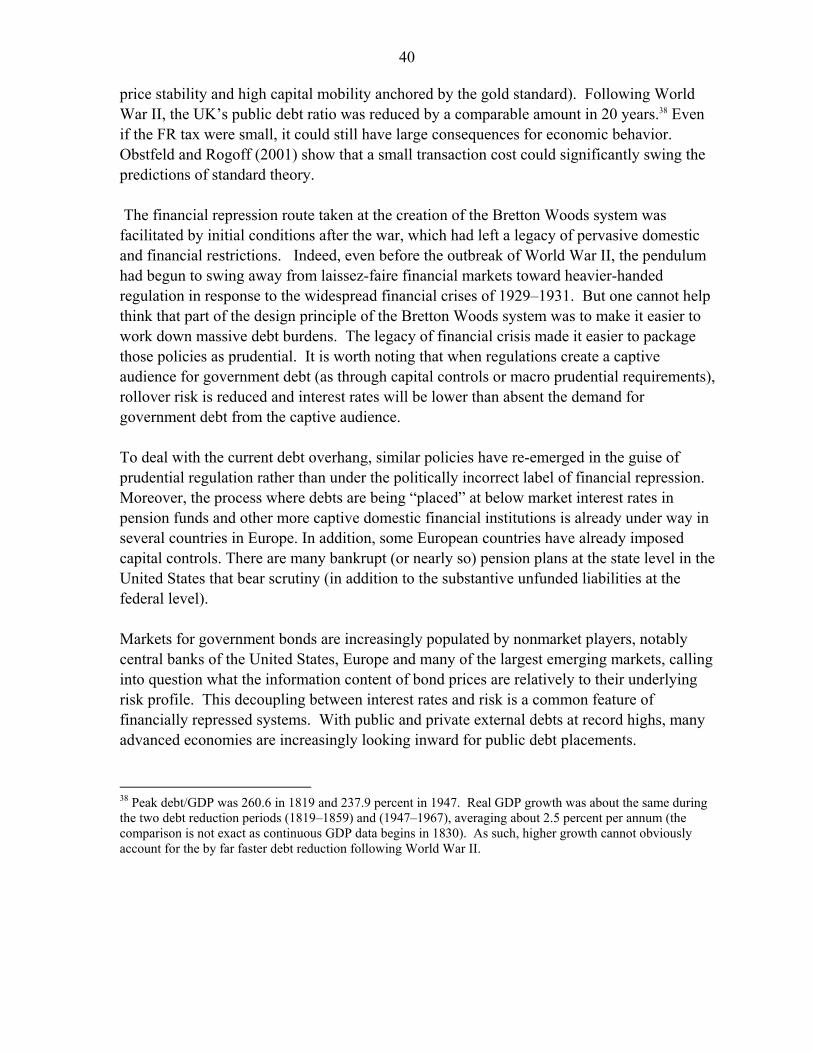
40 price stability and high capital mobility anchored by the gold standard). Following World War II, the UK’s public debt ratio was reduced by a comparable amount in 20 years.38 Even if the FR tax were small, it could still have large consequences for economic behavior. Obstfeld and Rogoff (2001) show that a small transaction cost could significantly swing the predictions of standard theory. The financial repression route taken at the creation of the Bretton Woods system was facilitated by initial conditions after the war, which had left a legacy of pervasive domestic and financial restrictions. Indeed, even before the outbreak of World War II, the pendulum had begun to swing away from laissez-faire financial markets toward heavier-handed regulation in response to the widespread financial crises of 1929–1931. But one cannot help think that part of the design principle of the Bretton Woods system was to make it easier to work down massive debt burdens. The legacy of financial crisis made it easier to package those policies as prudential. It is worth noting that when regulations create a captive audience for government debt (as through capital controls or macro prudential requirements), rollover risk is reduced and interest rates will be lower than absent the demand for government debt from the captive audience. To deal with the current debt overhang, similar policies have re-emerged in the guise of prudential regulation rather than under the politically incorrect label of financial repression. Moreover, the process where debts are being “placed” at below market interest rates in pension funds and other more captive domestic financial institutions is already under way in several countries in Europe. In addition, some European countries have already imposed capital controls. There are many bankrupt (or nearly so) pension plans at the state level in the United States that bear scrutiny (in addition to the substantive unfunded liabilities at the federal level). Markets for government bonds are increasingly populated by nonmarket players, notably central banks of the United States, Europe and many of the largest emerging markets, calling into question what the information content of bond prices are relatively to their underlying risk profile. This decoupling between interest rates and risk is a common feature of financially repressed systems. With public and private external debts at record highs, many advanced economies are increasingly looking inward for public debt placements.
38 Peak debt/GDP was 260.6 in 1819 and 237.9 percent in 1947. Real GDP growth was about the same during the two debt reduction periods (1819–1859) and (1947–1967), averaging about 2.5 percent per annum (the comparison is not exact as continuous GDP data begins in 1830). As such, higher growth cannot obviously account for the by far faster debt reduction following World War II.

41 While to state that initial conditions on the extent of global integration are vastly different at the outset of Bretton Woods in 1946 and today is an understatement, the direction of regulatory changes have many common features. The incentives to reduce the debt overhang are more compelling today than about half a century ago. After World War II, the overhang was limited to public debt (as the private sector had painfully deleveraged through the 1930s and the war); at present, the debt overhang many advanced economies face encompasses (in varying degrees) households, firms, financial institutions and governments. Financial repression is already set to make an extended comeback, however, it is important to remember that financial repression is a more gradual approach toward debt reduction than debt restructuring and haircuts (unless of course it is coupled with surging inflation). Given the orders of magnitudes of both public and private debt levels, financial repression may be necessary but probably not sufficient to restore debts to more manageable levels. For such cases, it is best viewed as a complement to restructuring not a substitute for it. As sovereign debts have migrated in increasing shares to the official sector “voluntary” debt restructurings (as the reference to the 1951 Fed-Treasury accord that opens this paper reminds us) may also fall under the larger category of financial repression.
At any rate, fiscal savings of 1–2 percent a year via lower interest rates (or even modest debt reduction when rates are negative) are not to be taken lightly when other alternatives are as unspeakable as restructuring and as unpalatable as perpetual austerity. The growth and redistributive implications of financial repression are not well understood, as the studies of the former are usually confined to some of the more extreme distortionary cases. Further research on the milder cases of financial repression may provide insights on this score. Fiscal issues aside, however, the connection between financial liberalization, credit and capital flow cycles and financial crises is not a new one. Kaminsky and Reinhart (1999) conclude the financial liberalization usually preceded systemic banking crises and that, indeed, it helps predict them. In this vein, it is worth noting that systemic financial crises in both advanced economies and emerging markets were rare in the financial repression era we have studied here.39
39 See Reinhart and Rogoff (2009), page 157

42
References
Agénor, Pierre-Richard, and Peter J. Montiel, 2008. Development Macroeconomics, Third edition, Princeton: Princeton University Press.
Aizenman, Joshua, and Pablo Guidotti. 1994. Capital Controls, Collection Costs, and Domestic Public Debt, Journal of International Money and Finance, February, 41–54.
Aizenman, Joshua and Nancy Marion. 2010. Using Inflation to Erode the U.S. Public Debt, SCIIE Department Working Paper, December.
Alesina, Alberto, Vittorio Grilli and Gian Maria Milesi-Ferretti. 1993. The Political Economy of Capital Controls, in L. Leiderman and A. Razin, eds., Capital Mobility: New Perspectives, Cambridge UK: Cambridge University Press.
Aloy, Marcel, Gilles Dufrénota, and Anne Péguin-Feissolle. 2013. Is Financial Repression a Solution to Reduce Fiscal Vulnerability? The Example of France Since the end of World War II. Forthcoming in Applied Economics.
Bai, Chong-En, David D. Li, Yingyi Qian, and Yijang Wang. 2001. Financial Repression and Optimal Taxation. Economic Letters, Vol. 70, No. 2, February, 245–51
Barro, Robert. 1978. Unanticipated Money, Output, and the Price Level in the United States. The Journal of Political Economy, Vol. 86, No. 4, 549–580.
Baldursson, Friðrik Már and Richard Portes. 2013. Capital controls and the resolution of failed cross-border banks: The case of Iceland, Vox EU, November 12.
Battilossi, S., 2003. Capital mobility and financial repression in Italy, 1960-1990: a public finance perspective. Universidad Carlos III de Madrid Working Paper, No. 03–06.
Battilossi, Stefano. 2005. The Second Reversal: The Ebb and Flow of Financial Development in Western Europe, 1950–1991, Department of Economic History and Institutions, Universidad Carlos III Madrid.
Beim, David O., and Charles W. Calomiris. 2001. Emerging Financial Markets. New York: McGraw-Hill/Irwin.
Brock, Philip.1989. Reserve Requirements and the Inflation Tax, Journal of Money, Credit and Banking, Vol 21, No. 1, February, 106–121.
Burmeister, Kent D. Wall and James D. Hamilton. 1986. Estimation of Unobserved Expected Monthly Inflation Using Kalman Filtering. Journal of Business & Economic Statistics Vol. 4, No. 2, 147–160.

43 Campbell, John Y. and Kenneth A. Froot, 1994. “International Experiences with Securities
Transactions Taxes,” in The Internationalization of Equity Markets, Jeffrey Frankel ed., (Chicago: University of Chicago Press for NBER), 277–308.
Chandler, Lester. 1949. Federal Reserve Policy and the Federal Debt, American Economic Review, Vol. 39, No. 2, 405–429.
Cukierman, Alex. 1992. Central Bank Strategy, Credibility, and Independence: Theory and Evidence, Cambridge, MA: MIT Press.
Darrat, Ali F. 1985. Unanticipated Inflation and Real Output: The Canadian Evidence. The Canadian Journal of Economics, Vol. 18. No.1, 146–155.
Deacon, Mark and Andrew Derry. 1994. Estimating the Term Structure of Interest Rates. Bank of England Working Paper No. 24.
DeVries, Margaret, 1969. The International Monetary Fund, 1945–1965: Twenty Years of International Monetary Cooperation. Volume II, Washington DC: International Monetary Fund.
Dobbs, Richard, Susan Lund, Tim Koller, Ari Shwayder. 2013. QE and ultra-low interest rates: Distributional effects and risks, McKinsey Global Institute Discussion Paper, November.
Easterly, William R. 1989. Fiscal Adjustment and Deficit Financing During the Debt Crisis. In I. Husain and I. Diwan, eds., Dealing with the Debt Crisis. Washington DC: The World Bank: 91–113.
Eichengreen, Barry, Ricardo Hausmann and Ugo Panizza, 2003. Currency Mismatches, Debt Intolerance and Original Sin: Why They Are Not the Same and Why it Matters, NBER Working Papers 10036, National Bureau of Economic Research, Inc.
Elmendorf, Douglas and Gregory Mankiw, “Government Debt,” Handbook of Macroeconomics, Vol. 1, Taylor, J.B. and M. Woodford, eds., Elsevier Science, B.V., 1999, 1615–1699.
Fama, Eugene. 1975. Short-Term Interest Rates as Predictors of Inflation. American Economic Review Vol. 65, 269–282.
Fisher, Irving. 1933. The Debt-Deflation Theory of Great Depressions. Econometrica, Vol. 1, no. 4 (October): 337–57.
Friedman, Milton and Anna Schwartz. 1982. Monetary Trends in the United States and United Kingdom: Their Relation to Income, Prices, and Interest Rates, 1867–1975. Chicago: The University of Chicago Press.

44 Giannitssarou, Chryssi and Andrew Scott. 2006. “Inflation Implications of Rising
Government Debt.” Centre for Economic Policy Research. Discussion Paper No. 5961.
Giovannini, Alberto and Martha de Melo. 1993. "Government Revenue from Financial Repression." American Economic Review, vol. 83, No. 4: 953–963.
Green, Christopher, Eric Pentecost, and Tom Weyman-Jones. (2011). Financial Crisis and the Regulation of Finance. Edward Elgar Publisher.
Homer, Sydney, and Richard Sylla. 2005. A History of Interest Rates, 4th ed. Hoboken, NJ: John Wiley & Sons, Inc.
Horsefield, J. Keith, 1969. The International Monetary Fund, 1945–1965: Twenty Years of International Monetary Cooperation. Volume I, Washington DC: International Monetary Fund.
Horvitz, Paul M. and Richard A. Ward. 1987. Monetary Policy and the Financial SystemEnglewoods Cliffs, NJ: Prentice Hall Inc. (6th edition)
Kaminsky, Graciela and Carmen M. Reinhart. 1999. The Twin Crises: The Causes of Banking and Balance-of-Payments Problems. American Economic Review, vol. 89(3), p. 473–500.
Keynes, John Maynard, 1940. How to Pay for the War, (London: Macmillan and Co.)
Lane, Philip R. 2012. The European Sovereign Debt Crisis, Journal of Economic Perspectives, Vol. 26, No. 3, Summer 2012, 46–68.
Lane, Philip R., and Gian Maria Milesi-Ferretti. 2010. "The External Wealth of Nations Mark II: Revised Extended Estimates of Foreign Assets and Liabilities, 1970–2004" Journal of International Economics 73, 223–250.
Lardy, Nicolas. 2008. “Financial Repression in China” Peterson Institute Policy Brief Number PB08-08, Washington DC: Peterson Institute for International Economics.
Laubach, Thomas and John C. Williams. 2003. “Measuring the Real Interest Rate” Review of Economics and Statistics 85(4), 2003, 1063–1070
Lorenzen, H., 2012. Heading for the Great Repression? Citigroup Global Markets, 20 March.
Magud, Nicolas, Carmen M. Reinhart and Kenneth Rogoff. 2011. “Capital Controls: Myth and Reality: A Portfolio Balance Approach.” NBER Working Paper 16805.
45 McConnell, Margaret. and Gabriel Perez-Quiros. 2000, “Output Fluctuations in the United
States: What has Changed Since the Early 1980’s?” American Economic Review, Vol. 90, 5:1464-1476.
McKinnon, Ronald I. 1973. Money and Capital in Economic Development. Washington DC: Brookings Institute.
McKinnon, Ronald I. and Pill, H. 1997. Credible Economic Liberalizations and Overborrowing. American Economic Review, 87(2), pp. 189–193.
Meltzer, Allan. 2003. A History of the Federal Reserve, Volume 1: 1913-1951. Chicago: Chicago University Press.
Mishkin, Frederic S. 1981. The Real Interest Rate: an Empirical Investigation. NBER Working Paper No. 622.
Obstfeld, Maurice and Alan Taylor, 1998. “The Great Depression as a Watershed: International Capital Mobility over the Long Run” in Michael D. Bordo & Claudia Goldin & Eugene N. White, 1998. The Defining Moment: The Great Depression and the American Economy in the Twentieth Century, NBER Books, National Bureau of Economic Research, September.
Obstfeld, Maurice, and Alan M. Taylor. 2004. Global Capital Markets: Integration, Crisis, and Growth. Japan-U.S. Center Sanwa Monographs on International Financial Markets (Cambridge: Cambridge University Press).
Obstfeld, Maurice and Kenneth Rogoff. 2001. The Six Major Puzzles in International Macroeconomics: Is There a Common Cause? NBER Macroeconomics Annual 2000, Volume 15, MIT Press.
Persson, Torsten, and Lars Svensson. 1996. Debt, Cash Flow and Inflation Incentives: A Swedish Example. NBER Working Paper No. 5772.
Reinhart, Carmen M. 2012. “The Return of Financial Repression,” Banque de France Financial Stability Review, No. 16, April, 37–48.
Reinhart, Carmen M. and Vincent R. Reinhart, 1999. On the Use of Reserve Requirements in Dealing with the Capital-Flow Problem, International Journal of Finance and Economics, Vol. 4, No.1, January, 27–54.
Reinhart, Carmen M. Vincent R. Reinhart, and Kenneth Rogoff. 2012. Public Debt Overhangs: Advanced-Economy Episodes since 1800,” Journal of Economic Perspectives Vol. 26, No. 3, Summer 2012, 69–86.

46 Reinhart, Carmen M. and Kenneth Rogoff. 2002. The Modern History of Exchange Rate
Arrangements: A Reinterpretation, Quarterly Journal of Economics, CXIX No. 1, February 2004, 1–48.
Reinhart, Carmen M. and Kenneth Rogoff. 2009. This Time is Different: Eight Hundred Centuries of Financial Folly. Princeton: Princeton University Press.
Reinhart, Carmen M. and Kenneth Rogoff. 2011. The Forgotten History of Domestic Debt. Economic Journal, Vol. 121, Issue 552, May 2011, 319–350.
Reinhart,Carmen M. and M. Belen Sbrancia “The Liquidation of Government Debt,” NBER Working Paper 16893, March 2011.
Schularick, Moritz and Alan Taylor. 2012. Credit Booms Gone Bust: Monetary Policy, Leverage Cycles and Financial Crises, 1870–2008, American Economic Review, Vol. 102 (April): 1029–6.
Shaw, Edward S. 1973. Financial Deepening in Economic Development. New York: Oxford University Press.
Studenski, Paul and Herman E. Krooss. 1963. Financial History of the United States. McGraw-Hill Book Company, Inc.
Sturzenegger, Federico and Jeromin Zettelmeyer. 2006. Debt Defaults and Lessons from a Decade of Crises. Cambridge: MIT Press.
Taggart, Robert A. 1981. Deregulation of Deposit Rate Ceilings in the United States: Prospects and Consequences. In Competition and Regulation in Financial Markets, ed. Albert Verheirstraeten. New York, NY: St. Martin’s Press, Inc.
van Riet, Ad. 2013. “Financial Repression to Ease Fiscal Stress: Turning Back the Clock in Eurozone?” European Central Bank, mimeograph, November.
World Economic Outlook. 2012. “The Good, the Bad, and the Ugly: 100 Years of Dealing with Public Debt Overhangs”. International Monetary Fund, October 2012.
Wiles, P. J. D.1952. Pre-War and War-Time Controls in the British Economy 1945–1950, London: Oxford University Press.