the legal market - legal insight | thought leadership...
TRANSCRIPT
The Melbourne Law School and Thomson Reuters Peer Monitor® are pleased to present
this report setting out the dominant trends impacting the legal market in 2015 and the
key issues likely to infl uence the market in 2016 and beyond.
2015Australia: State of the Legal Market
REUTERS/Mark Bader
State of the Legal Market: Australia – 2015 WHITE PAPER
2
FOREWORD
Professor Carolyn Evans, Dean Melbourne Law SchoolOnly ten years ago it would have been a particularly farsighted partner or pundit who could have predicted the depth
and breadth of changes that would lie ahead for the legal profession in the coming decade.
The Australian legal profession has been impacted by trends seen around the world, including client demand for
greater value and lower costs, the increasing use of digital solutions for legal problems and off-shoring. While the
resources boom and the healthy state of the Chinese economy gave Australia protection for a period of time, the
global financial crisis caught up with us in the last few years with grim effects in terms of employment and profitability
in many firms. We appear to also be behind lawyers in the northern hemisphere in recovering from the GFC’s effects,
although this report does note some promising tendrils of new growth. It has been a challenging time for the Australian
legal profession, as it has for the profession in many parts of the world, with disruptions on a scale not seen for a
long time and with the likelihood of many more reforms to come.
Some of the changes have been more specific to Australia, including the rapid expansion of the local presence of global
firms either in their own right or through various forms of relationship with existing Australian firms. Despite the trying
times, a number of medium sized firms flourished to become substantial players on the national and even international
stage. And from a legal educator’s point of view, it is also worth noting that while enrolments to US law schools have
plummeted in recent years, in Australia both the number of law graduates and law schools continues to grow.
For the person aiming to predict the next wave of change and to read in the tea leaves either signs of hope or warnings
of further hardship, the contents of this report will be invaluable. It deliberately focuses only on the portion of the market
that includes the Big 8 and several selected large commercial law firms with a view to analyzing the current position
and trends in recent years against a range of important indicators.
The striking and sustained decline in demand for the work of these firms is the grim opening to the report. The drying
up of demand is not shared equally around all practice areas or firms but it is a signal, as the author notes in his
conclusion, that firms that choose complacency and mediocrity will rapidly find themselves on the outer. The environment
is too competitive to allow firms to engage in business as usual while their clients are demanding innovation and cost
containment – if clients are not finding their demands met, there are plenty of old and new firms with a hunger for
the more limited work available.
Firms are taking up the challenge with increased investment in legal project management and other innovations.
This report will provide very useful data for the strategic planning that now must be given laser-like focus in firms
looking to not just survive but to flourish in this challenging environment. Melbourne Law School is pleased to be
associated with this project and the value that it provides for the profession.
The Melbourne Law School and Thomson Reuters gratefully acknowledge the participation of the following persons in the preparation of this report: Joel Barolsky, Senior Fellow & Principal at Barolsky Advisors (lead author), Jennifer Roberts, Sr. Analyst, Client Management & Global Thought Leadership at Thomson Reuters, Jeremy Crowther, Analyst at Peer Monitor and Christopher Langton, Research Assistant at the Melbourne Law School.
State of the Legal Market: Australia – 2015 WHITE PAPER
3
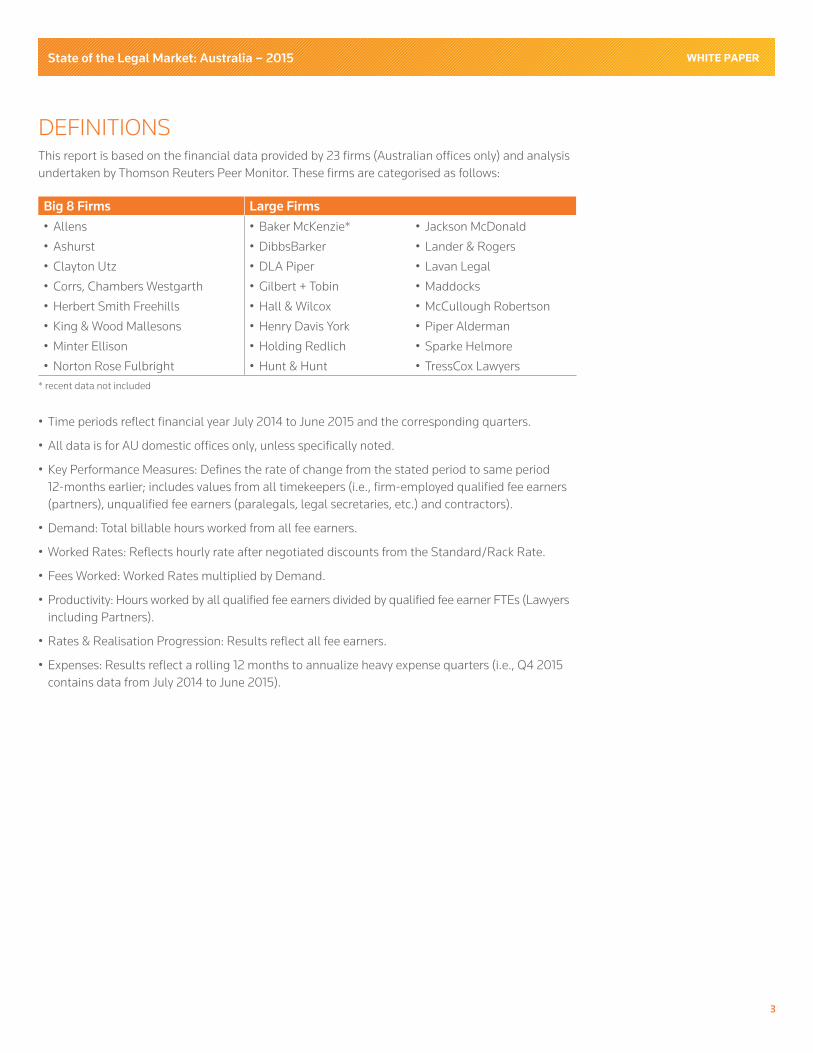
DEFINITIONSThis report is based on the financial data provided by 23 firms (Australian offices only) and analysis
undertaken by Thomson Reuters Peer Monitor. These firms are categorised as follows:
• Time periods reflect financial year July 2014 to June 2015 and the corresponding quarters.
• All data is for AU domestic offices only, unless specifically noted.
• Key Performance Measures: Defines the rate of change from the stated period to same period
12-months earlier; includes values from all timekeepers (i.e., firm-employed qualified fee earners
(partners), unqualified fee earners (paralegals, legal secretaries, etc.) and contractors).
• Demand: Total billable hours worked from all fee earners.
• Worked Rates: Reflects hourly rate after negotiated discounts from the Standard/Rack Rate.
• Fees Worked: Worked Rates multiplied by Demand.
• Productivity: Hours worked by all qualified fee earners divided by qualified fee earner FTEs (Lawyers
including Partners).
• Rates & Realisation Progression: Results reflect all fee earners.
• Expenses: Results reflect a rolling 12 months to annualize heavy expense quarters (i.e., Q4 2015
contains data from July 2014 to June 2015).
Big 8 Firms Large Firms
• Allens
• Ashurst
• Clayton Utz
• Corrs, Chambers Westgarth
• Herbert Smith Freehills
• King & Wood Mallesons
• Minter Ellison
• Norton Rose Fulbright
• Baker McKenzie*
• DibbsBarker
• DLA Piper
• Gilbert + Tobin
• Hall & Wilcox
• Henry Davis York
• Holding Redlich
• Hunt & Hunt
• Jackson McDonald
• Lander & Rogers
• Lavan Legal
• Maddocks
• McCullough Robertson
• Piper Alderman
• Sparke Helmore
• TressCox Lawyers
* recent data not included

State of the Legal Market: Australia – 2015 WHITE PAPER
4
BY THE NUMBERS
Demand DeclineDemand for commercial legal services has been on a relatively steady downward trajectory for the past five years,
and 2015 failed to break this trend, with demand again falling 2.0%. Notably, Q4 2015 saw a slight increase in demand,
the first quarter in almost 3 years of declining demand.
The overall decline in demand is primarily attributable to the decline in demand for the industry’s three biggest practice
groups: dispute resolution, banking & finance and corporate general. These three practices represent 48% of all legal
services provided.
Chart 1: Demand Y/Y Change (2009-2015)
While still experiencing falling demand for their services, the Big 8 firms nevertheless fared better than the Large firms
for the year (-1.1% and -2.4%, respectively). This is largely attributable to the more substantial decline in demand for
the dispute resolution services of the Large firms (-6.4%) compared to the Big 8 firms (-4.8%), as well as a decline in
demand for banking and finance advice (-11.7% and -9.4%, respectively). Further, the growth in demand for real
estate services experienced by the Big 8 (6.1%) was substantially higher than the growth experienced by the Large
firms in the same practice area (3.5%).
It is worth noting that while the Big 8 firms
collectively may have fared better than the
Large firms in the market in terms of demand
for legal services, there were anomalies. In
particular, HWL Ebsworth (data not included
in the Peer Monitor statistics) has seen its
revenue increase from $102m to $219m over
the past three years.
The data also reveals that the demand for
the services of both the Big 8 and Large firms
traditionally increases in the November-
December period before significantly dropping
away in January. This trend appears to be more
pronounced in recent years, with the peak
demand in December growing higher, and
demand falling lower through January.
-6%2010v2009 2011v2010 2012v2011 2013v2012 2014v2013 2015v2014
-3%
0%
3%
6%
9%
Source: Thomson Reuters Peer Monitor All timekeepers/billable time type
Source: Thomson Reuters Peer Monitor All timekeepers/billable time type
-4%All Firms Big 8 Large
-3%
-2%
-1%
0%
Chart 2: Y/Y Demand Growth (2015v2014)

State of the Legal Market: Australia – 2015 WHITE PAPER
5
CORE PRACTICES SLUMPING
Banking: Demand for the second largest practice area
(banking and finance) slumped significantly over the
2015FY, with the Large firms suffering more than the
Big 8 (-11.7% and -9.4%, respectively). As of year-end
2015, demand growth was down -10.5% industry-wide,
following a modest but significant growth in demand
for this practice area for the previous year (up 1.8%).
Corporate: General corporate law advice remained the
third biggest practice area in 2015. Demand for the
practice area was down 5.5% for the year industry-wide.
Much of this decline was amongst the Large firms
(-7.0% for 2015FY). It is worth noting that the Big 8 firms
experienced substantial growth in general corporate law
demand in Q4 2015FY (up 9.4%).
TRANSACTIONAL WORK GROWTH
M&A: M&A work for all firms saw a 2.1% increase in demand for the year, spurred in part by significant growth in Q4,
which saw demand rise 10.5%. Mergermarket reports that Australia is the second-largest M&A market in the Asia/
Pacific region, second only to China. Mid-market ($10m–$250m USD) deals continue to dominate the M&A market
in Australia, accounting for 68% of the total M&A work in 2014. Notably, 40% of all M&A transactions in Australia
fell within the lower end of the mid-market work (i.e., between $10m-$50m USD). This demonstrates that mid-sized
Australian businesses continue to feel the need to consolidate
so as to remain competitive against the larger market players.
Nevertheless, M&A activity numbers from the 2015 financial
year also reflect a number of large deals, such as the $8bn
takeover of Toll Holdings by Japan Post and BHP Billiton’s
demerger from South32, among others.
These increases in demand are reflective of the growth
in business confidence, low interests rates, and the
privatisation of government assets, collectively creating
an economic environment particularly more favourable
for mergers and acquisitions. This economic environment
is made further fertile by the falling Australian dollar,
making investing in Australia cheaper and reducing
the risk of currency fluctuation for foreign bidders.1
Consequently, in 2014 a higher proportion of bidders
were foreign in all M&A deals (reportedly two-thirds
of all bidders). There is much speculation that these
factors will again combine to significantly increase M&A activity in the 2016 financial year, with the potential reform
of the Foreign Investment Review Board to also play a role2.
Importantly, the China-Australia FTA is likely to carry with it a flurry of transactional activity for Australian law firms,
particularly as the PRC invests in agriculture and infrastructure/large residential property3. Consequently, as the
fallout from the recession and mining boom continues to unwind, M&A deals will continue to shift away from the
mining industry toward the real estate, agriculture and construction sectors.
Corporate General
-15% -10% -5% 0% 5%
Dispute Resolution
Workplace Relations
Insurance Defence
Banking & Finance
Source: Thomson Reuters Peer Monitor All timekeepers/billable time type
LargeBig 8All
Chart 3: Y/Y Demand Growth (2015v2014)
Chart 4: All Firms Growth
Practice Area Proportion of Work Growth (2015 v 2014)
Construction 5% 3.2%
Real Estate & Projects 10% 3.1%
Intellectual Property 4% 2.2%
M&A 6% 2.1%
Regulatory 3% -0.8%
Workplace Relations 7% -2.2%
Insurance Defence 6% -2.3%
Taxation 2% -5.4%
Corporate General 13% -5.5%
Dispute Resolution 22% -5.8%
Insolvency & Restructuring 3% -6.4%
Environment & Planning 2% -7.1%
Banking & Finance 13% -10.5%
1 Corrs Chambers Westgarth – http://www.corrs.com.au/thinking/insights/australias-m-and-a-market-2015-ten-trends-that-are-shaping-the-market/ 2 http://www.smh.com.au/business/markets/mergers-and-acquisitions-to-dominate-markets-in-2015-20150105-12idk1.html 3 Merger Market Mid Market Report March 2015

State of the Legal Market: Australia – 2015 WHITE PAPER
6
Real Estate: For the full-year 2015 period, real estate and projects work experienced increased demand over the
previous year, up 3.1%. Notably however, the Big 8 Firms have experienced a far greater increase in demand in this area
than the Large firms, with 6.1% and 3.5%, respectively for 2015.
LITIGIOUS WORK
The notable decline in the demand for litigation work has continued throughout 2015, with total market demand
for dispute resolution services declining 5.8% on last year’s figures.
Chart 5: Dispute Resolution vs. Transactional
The demand for dispute resolution work by the Large firms peaked into positive demand growth in the third and fourth
quarter, potentially indicating a neutralizing of the sector. Further, as indicated by the trend line on the below graph,
the decline in dispute resolution work appears to be slowing.
Chart 6: Dispute Resolution Y/Y Growth by Quarter
Source: Thomson Reuters Peer Monitor All timekeepers/billable time type
LargeBig 8All
-12%
-10%
-8%
2 3Q12014
4 2 3Q12015
4
-6%
-4%
-2%
0%
2%
4%
Source: Thomson Reuters Peer Monitor All timekeepers/billable time type
TransactionalDispute Resolution
-18%
-15%
-12%
2012 20132011 2014 2015
-9%
-6%
-3%
0%
3%
6%
12%
9%
State of the Legal Market: Australia – 2015 WHITE PAPER
7
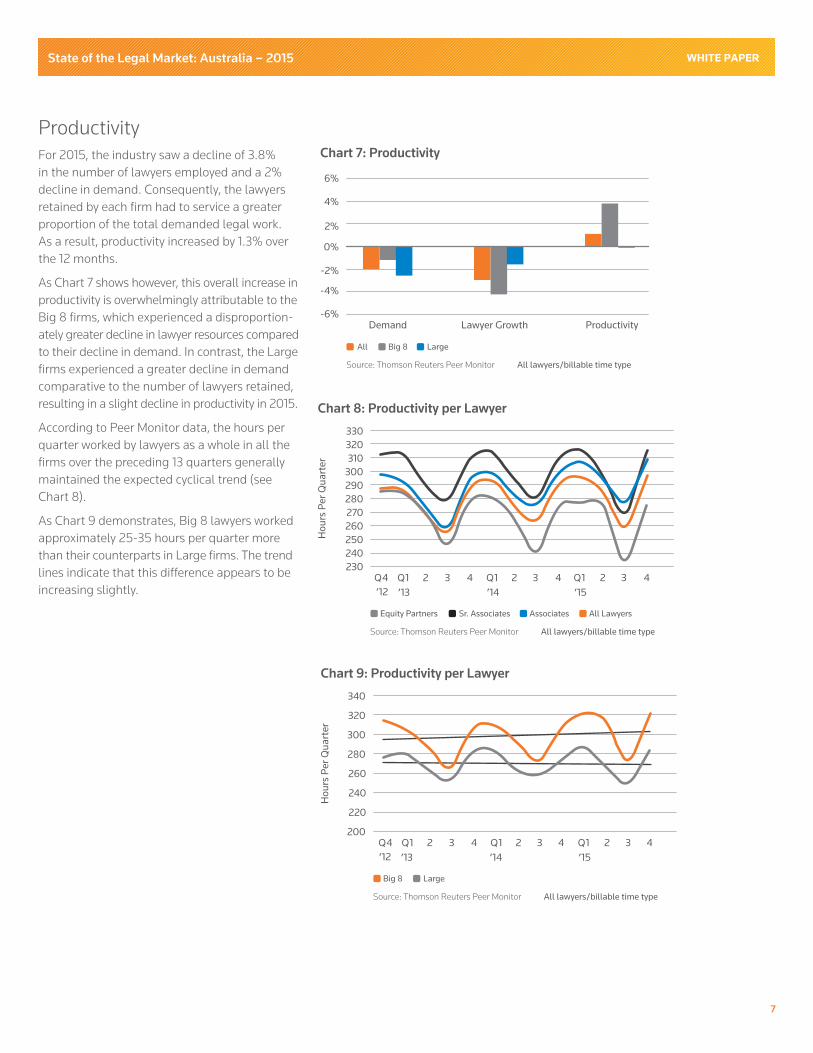
ProductivityFor 2015, the industry saw a decline of 3.8%
in the number of lawyers employed and a 2%
decline in demand. Consequently, the lawyers
retained by each firm had to service a greater
proportion of the total demanded legal work.
As a result, productivity increased by 1.3% over
the 12 months.
As Chart 7 shows however, this overall increase in
productivity is overwhelmingly attributable to the
Big 8 firms, which experienced a disproportion-
ately greater decline in lawyer resources compared
to their decline in demand. In contrast, the Large
firms experienced a greater decline in demand
comparative to the number of lawyers retained,
resulting in a slight decline in productivity in 2015.
According to Peer Monitor data, the hours per
quarter worked by lawyers as a whole in all the
firms over the preceding 13 quarters generally
maintained the expected cyclical trend (see
Chart 8).
As Chart 9 demonstrates, Big 8 lawyers worked
approximately 25-35 hours per quarter more
than their counterparts in Large firms. The trend
lines indicate that this difference appears to be
increasing slightly.
Source: Thomson Reuters Peer Monitor All lawyers/billable time type
LargeBig 8All
-6%
-4%
-2%
0%
2%
4%
6%
Demand Lawyer Growth Productivity
Chart 7: Productivity
Chart 8: Productivity per Lawyer
Chart 9: Productivity per Lawyer
Source: Thomson Reuters Peer Monitor All lawyers/billable time type
Q4
’12 ’13 ’14 ’15
Q1 2 3 4 Q1 Q12 3 4 2 3 4
Ho
urs
Pe
r Q
ua
rte
r
230
290
280
270
260
250
240
300
320
310
330
Sr. AssociatesEquity Partners Associates All Lawyers
Source: Thomson Reuters Peer Monitor All lawyers/billable time type
Q4
’12 ’13 ’14 ’15
Q1 2 3 4 Q1 Q12 3 4 2 3 4
Ho
urs
Pe
r Q
ua
rte
r
200
260
240
220
280
320
300
340
LargeBig 8

State of the Legal Market: Australia – 2015 WHITE PAPER
8
ExpensesLaw firm expenses continued to decline over the 2015 financial year,
with indirect expenses down 1.5% and direct expenses down 1.4%
in Q4. It is interesting to note that if the 2015 trend continues, direct
expenses may increase in 2016. Sector-wide, recruitment expenses
experienced the biggest growth (17.5%), with Big 8 firms and Large
firms spending 49% and 6.5%, respectively, more this year compared
with the same time last year. Compared with 2014, 2015 staff
compensation rose 1.5% and benefits increased 4.7%. Most of that
growth in staff compensation was driven by the Big 8 firms (up 4.8%),
although the Big 8 firms spent considerably less (-5.0%) on benefits
comparative to 2014. In contrast, the Large firms experienced a
minor increase in staff compensation costs (1.0%), and a 2.4%
increase in expenditures on benefits.
Highlighting the continuing trend of developing reliance on achieving
efficiencies through technology, expenditures on technology increased
2.4% on last year. To some degree, this is also a factor in the increase
to lawyer productivity. Nevertheless, the legal services market remains
labour intensive, and the level of technological change is relatively
low within the market.
Chart 11: Realisation Against Standard
Chart 12: Expense Growth Y/Y% Change
Chart 10: Rate Progression
Source: Thomson Reuters Peer Monitor All lawyers/billable time type
Q4
’12 ’13 ’14 ’15
Q1 2 3 4 Q1 Q12 3 4 2 3 480%
88%
86%
84%
82%
90%
94%
92%
96%
BilledWorked
Source: Thomson Reuters Peer Monitor
Q2
’14 ’15
3 4 Q1 2 3 4-4%
-2%
-3%
-1%
1%
0%
2%
IndirectDirect
Source: Thomson Reuters Peer Monitor All lawyers/billable time type
Q4
’12 ’13 ’14 ’15
Q1 2 3 4 Q1 Q12 3 4 2 3 4$350
$400
$375
$425
$475
$450
$500
WorkedStandard Billed
Rates and RealisationAs Chart 10 shows, billing rates for all firms have steadily increased over the past three years, from $365 in Q4 2012,
to $377 in Q4 2015. However, this 3.3% increase in billing rates correlated with a slight decrease in realisation, down
from 84.1% to 82.0% against the standard (rack) rate.
From Q4 2012 to Q4 2015, Big 8 billed rates have increased 5.1%. By contrast, over the same three-year period, the
Large firms increased their billed rates by just 2.3%.
It is interesting to note that Q4 billed rates in 2013, 2014 and especially 2015 declined quite markedly. This perhaps
reflects some heavy discounting to drive revenue and achieve financial year budgets.

State of the Legal Market: Australia – 2015 WHITE PAPER
9
Chart 13: Per Lawyer Expenditure (Rolling 12 Months)
Interestingly, Marketing and Business Development expenditure was 1.4% less than 2014. Evidence from many other
industries shows that when demand starts to decline, firms spend more on revenue generating activities and attempt
to cut other overheads. The data suggests Australian law firms on the whole are not following this strategy.
For Big 8 firms, expenditures on Outside Services experienced the most significant growth, up 24.0% on the previous
year, while the Large firms increased their expenditures in the same area by a more moderate 10.2%.
Chart 14: 2015v2014 Expenses
Source: Thomson Reuters Peer Monitor All lawyers/billable time type
LargeBig 8
$0Occupancy Office
ExpensesStaff
CompTech Outside
Services*Taxes Mktg &
BDLibrary Recruiting Benefits**
$5,000
$10,000
$15,000
$20,000
$25,000
$75
,08
4
$6
5,7
06
$5
8,2
26
$4
2,4
53
LargeBig 8
-5%
0%
5%
10%
15%
24
.0%
49
.6%
Source: Thomson Reuters Peer Monitor
Occupancy OfficeExpenses
StaffComp
Tech OutsideServices*
Taxes Mktg & BD
Library Recruiting Benefits**
* This includes outsourced services for mailroom, copy center, and records management, etc. This also includes professional services such as tax return preparation, outside legal services, payroll processing, trust administration expenses, employee benefi t consulting and other consulting services. This does not include outsourced technology functions, (e.g., helpdesk and datacenter, see Technology), or outsourced marketing functions, (e.g., public relations and market research, see Marketing). This category does not include temporary help.
** This includes fi rm-paid employee insurance (medical, dental, and other health and welfare coverage, life/disability/long-term care, accidental death coverage, travel insurance, income protection, etc.), fi rm-paid retirement benefi ts (pension plan/profi t sharing contributions, retirement plan expenses), and other fi rm-paid benefi ts (e.g., employee assistance programs, transportation allowances, overtime transportation, childcare assistance, golf/health club memberships, wellness programs, physi-cal exams, tuition reimbursement for dependents, etc.)

State of the Legal Market: Australia – 2015 WHITE PAPER
10
ProfitabilityFor this report, we are calculating profitability by dividing total firm profit by the total number of equity partners
(regardless of point allocation).
Chart 15 demonstrates that the profitability of the Big 8 firms has improved over the past three years. In comparison,
as of Q4 2015 the profitability of the Large firms has fallen below 2013 levels after taking an even steeper decline in
2014 – figures rebounded slightly in 2015 over 2014. The data suggests global firms have enjoyed a steady increase
in PPEP from 2013 to 2015.
Chart 15: Profit per Equity Partner (PPEP)*
Chart 16: Three-Year Growth by Lawyer Title
The data suggests that firm profitability was largely maintained or increased through a combination de-equitisation
and reducing headcount. It is striking to note that the number of equity partners reduced by 10% in the Big 8 firms
and by just over 5% in the Large firm segment (Q4 2012 versus Q4 2015). Equity partner status is not only more
difficult to achieve, it’s also more difficult to maintain.
Big 8 firms reduced total lawyer FTEs by 10.8% over the three-year period ending Q4 2015. The figure was 6.9% for
the Large firm segment. Senior Associate and Associate roles appear to be the ones most at risk. Associate positions
at Big 8 firms decreased by 18.6% over the analysis period.
Source: Thomson Reuters Peer Monitor All lawyers/billable time type
2014 20132015
$0LargeBig 8 Global Domestic
$200,000
$100,000
$400,000
$300,000
$600,000
$500,000
$800,000
$700,000
Source: Thomson Reuters Peer Monitor All lawyers/billable time type
LargeBig 8
-30%Non-Equity
PartnerEquity Partner
Of Counsel**Sr Associate Associate Senior/StaffCounsel
-10%
-20%
0%
30%
20%
10%
40%
50%
Global firms include Allens, Ashurst, Herbert Smith Freehills, King & Wood Mallesons, Norton Rose Fulbright and DLA Piper
* PPEP is the total profi t divided by the number of equity partners (regardless of their point allocation).
** An Of Counsel timekeeper is a high-profi le lawyer but is not a Partner. They may have a special relationship with an industry or the government or are hired for another unique reason. Retired and former partners are included in this category. We would expect these fee earners to have a billing rate similar to Partners.
State of the Legal Market: Australia – 2015 WHITE PAPER
11
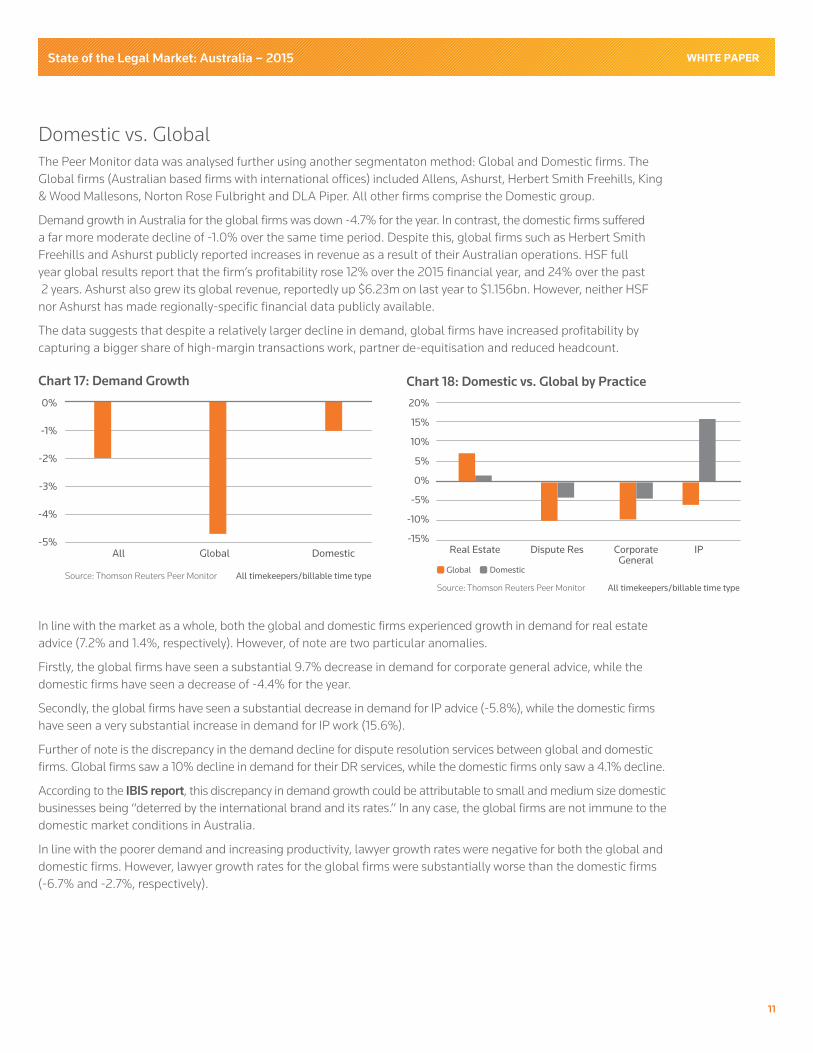
Domestic vs. GlobalThe Peer Monitor data was analysed further using another segmentaton method: Global and Domestic firms. The
Global firms (Australian based firms with international offices) included Allens, Ashurst, Herbert Smith Freehills, King
& Wood Mallesons, Norton Rose Fulbright and DLA Piper. All other firms comprise the Domestic group.
Demand growth in Australia for the global firms was down -4.7% for the year. In contrast, the domestic firms suffered
a far more moderate decline of -1.0% over the same time period. Despite this, global firms such as Herbert Smith
Freehills and Ashurst publicly reported increases in revenue as a result of their Australian operations. HSF full
year global results report that the firm’s profitability rose 12% over the 2015 financial year, and 24% over the past
2 years. Ashurst also grew its global revenue, reportedly up $6.23m on last year to $1.156bn. However, neither HSF
nor Ashurst has made regionally-specific financial data publicly available.
The data suggests that despite a relatively larger decline in demand, global firms have increased profitability by
capturing a bigger share of high-margin transactions work, partner de-equitisation and reduced headcount.
Chart 17: Demand Growth
In line with the market as a whole, both the global and domestic firms experienced growth in demand for real estate
advice (7.2% and 1.4%, respectively). However, of note are two particular anomalies.
Firstly, the global firms have seen a substantial 9.7% decrease in demand for corporate general advice, while the
domestic firms have seen a decrease of -4.4% for the year.
Secondly, the global firms have seen a substantial decrease in demand for IP advice (-5.8%), while the domestic firms
have seen a very substantial increase in demand for IP work (15.6%).
Further of note is the discrepancy in the demand decline for dispute resolution services between global and domestic
firms. Global firms saw a 10% decline in demand for their DR services, while the domestic firms only saw a 4.1% decline.
According to the IBIS report, this discrepancy in demand growth could be attributable to small and medium size domestic
businesses being “deterred by the international brand and its rates.” In any case, the global firms are not immune to the
domestic market conditions in Australia.
In line with the poorer demand and increasing productivity, lawyer growth rates were negative for both the global and
domestic firms. However, lawyer growth rates for the global firms were substantially worse than the domestic firms
(-6.7% and -2.7%, respectively).
Chart 18: Domestic vs. Global by Practice
Source: Thomson Reuters Peer Monitor All timekeepers/billable time type
DomesticGlobal
-15%
-10%
-5%
0%
5%
10%
15%
20%
Real Estate Dispute Res CorporateGeneral
IP
Source: Thomson Reuters Peer Monitor All timekeepers/billable time type
-4%
-5%All Global Domestic
-3%
-2%
0%
-1%
State of the Legal Market: Australia – 2015 WHITE PAPER
12
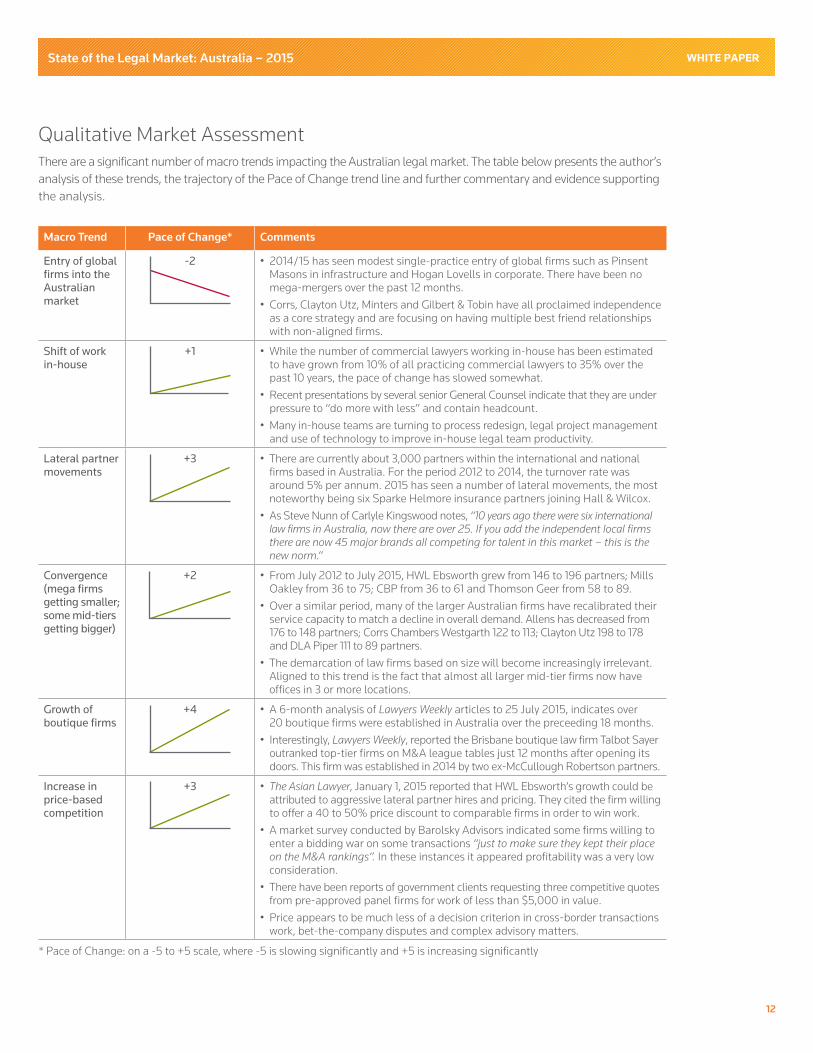
Qualitative Market AssessmentThere are a significant number of macro trends impacting the Australian legal market. The table below presents the author’s
analysis of these trends, the trajectory of the Pace of Change trend line and further commentary and evidence supporting
the analysis.
Macro Trend Pace of Change* Comments
Entry of global firms into the Australian market
-2 • 2014/15 has seen modest single-practice entry of global firms such as Pinsent Masons in infrastructure and Hogan Lovells in corporate. There have been no mega-mergers over the past 12 months.
• Corrs, Clayton Utz, Minters and Gilbert & Tobin have all proclaimed independence as a core strategy and are focusing on having multiple best friend relationships with non-aligned firms.
Shift of work in-house
+1 • While the number of commercial lawyers working in-house has been estimated to have grown from 10% of all practicing commercial lawyers to 35% over the past 10 years, the pace of change has slowed somewhat.
• Recent presentations by several senior General Counsel indicate that they are under pressure to “do more with less” and contain headcount.
• Many in-house teams are turning to process redesign, legal project management and use of technology to improve in-house legal team productivity.
Lateral partner movements
+3 • There are currently about 3,000 partners within the international and national firms based in Australia. For the period 2012 to 2014, the turnover rate was around 5% per annum. 2015 has seen a number of lateral movements, the most noteworthy being six Sparke Helmore insurance partners joining Hall & Wilcox.
• As Steve Nunn of Carlyle Kingswood notes, “10 years ago there were six international
law firms in Australia, now there are over 25. If you add the independent local firms
there are now 45 major brands all competing for talent in this market – this is the
new norm.”
Convergence (mega firms getting smaller; some mid-tiers getting bigger)
+2 • From July 2012 to July 2015, HWL Ebsworth grew from 146 to 196 partners; Mills Oakley from 36 to 75; CBP from 36 to 61 and Thomson Geer from 58 to 89.
• Over a similar period, many of the larger Australian firms have recalibrated their service capacity to match a decline in overall demand. Allens has decreased from 176 to 148 partners; Corrs Chambers Westgarth 122 to 113; Clayton Utz 198 to 178 and DLA Piper 111 to 89 partners.
• The demarcation of law firms based on size will become increasingly irrelevant. Aligned to this trend is the fact that almost all larger mid-tier firms now have offices in 3 or more locations.
Growth of boutique firms
+4 • A 6-month analysis of Lawyers Weekly articles to 25 July 2015, indicates over 20 boutique firms were established in Australia over the preceeding 18 months.
• Interestingly, Lawyers Weekly, reported the Brisbane boutique law firm Talbot Sayer outranked top-tier firms on M&A league tables just 12 months after opening its doors. This firm was established in 2014 by two ex-McCullough Robertson partners.
Increase in price-based competition
+3 • The Asian Lawyer, January 1, 2015 reported that HWL Ebsworth’s growth could be attributed to aggressive lateral partner hires and pricing. They cited the firm willing to offer a 40 to 50% price discount to comparable firms in order to win work.
• A market survey conducted by Barolsky Advisors indicated some firms willing to enter a bidding war on some transactions “just to make sure they kept their place
on the M&A rankings”. In these instances it appeared profitability was a very low consideration.
• There have been reports of government clients requesting three competitive quotes from pre-approved panel firms for work of less than $5,000 in value.
• Price appears to be much less of a decision criterion in cross-border transactions work, bet-the-company disputes and complex advisory matters.
* Pace of Change: on a -5 to +5 scale, where -5 is slowing significantly and +5 is increasing significantly

State of the Legal Market: Australia – 2015 WHITE PAPER
13
Macro Trend Pace of Change* Comments
Growth of New Law firms
+2 • After a flurry of New Law startups in 2012, 2013 and 2014 including Hive Legal, Keypoint, Nexus, Marque, Nest, LawPath, Bespoke, View and LawCentral, just to mention a few, the pace of new entrants slowed slightly in 2015.
• Anedoctal feedback is that many of these NewLaw firms are enjoying double digit growth but off a very low base. One indicator of size and growth rate is that after eight years of operation Advent Balance has around 150 freelance lawyers in its network.
• One new entrant worthy of note is Salvos Legal. This is a commercial law firm owned by the Salvation Army where all profits are channeled to the humanitarian efforts of the Salvos. One could imagine many government, trade union, industry super fund, statutory authorities and other not-for-profit organisations giving preference for their non-complex business law work to a firm like Salvos Legal.
Growth of Multi-Disciplinary Practices (MDPs)
+2 • PricewaterhouseCoopers (PwC) has publicly proclaimed that they aim to be a top 20 global legal service provider within the next five years. Ex-King & Wood Mallesons Managing Partner, Tony O’Malley, is leading the charge for PwC in Australia. At the 2015 Managing Partners Forum, O’Malley indicated his intent not to replicate the mistakes made by PwC in its foray into legal a decade prior. He said growth would be modest and targeted in key areas that complemented the rest of the PwC offering, particularly international and domestic tax, deals, corporate finance, regulatory and human resource consulting.
• KPMG, EY and Deloitte have also flagged interest in growing their legal capability. Each of these firms currently has over 1,000 lawyers working for them, mostly in their tax advisory practices.
• It is evident that many other consulting and business advisory firms are expanding their offers to include legal or quasi-legal advice. Similarly, real estate firms are offering “one-stop shops” that include legal conveyancing and leasing services.
Growth of diversification or hedge strategies
+3 • With declining core business, some Australian law firms have sought to diversify their offering. Four interesting case studies in this space include:
– Orbit by Corrs Chambers Westgarth – a network of freelance lawyers, including Corrs’ alumni, offered to clients for a fixed fee for a defined scope of work. This is similar to Allen & Overy’s Peerpoint service.
– Lexvoco by McInnes Wilson – offering an in-house legal counsel on-call for those organisations that cannot justify hiring a permanent employee.
– Accelerate by Allens-Linklaters – a suite of fixed-fee services aimed at start-ups and emerging companies. The “hook” is a collection of essential documents offered free-of-charge with user-friendly guidance notes. It appears that Accelerate does not cannabalise Allens’ existing client base and potentially allows them to start servicing an acorn that might one day become a massive oak tree.
– Claims Funding Australia Limited – a litigation funding business owned by partners of the specialist plaintiff litigation firm Maurice Blackburn.
Supply of legal graduates
+5 • The supply of legal graduates continues unabated despite the fact that most cannot find work in law. To illustrate this point, 12 years ago there were only two law schools in Melbourne. There are now eight universities offering law degrees in Melbourne plus a range of on-line and distance education providers.
Focus of talent diversity
0 • The 2015 Australian Financial Review partnership survey revealed that women associates now dominate the legal industry but “the percentage of female partners has barely budged.”
• A report by the Asian Australian Lawyers Association, published in April 2015, found that a ‘bamboo ceiling’ may be preventing lawyers with Asian heritage from rising to senior levels in the profession. The study found that six large law firms in Australia have no partners with Asian backgrounds and that only 0.8 percent of the judiciary have Asian heritage.
* Pace of Change: on a -5 to +5 scale, where -5 is slowing significantly and +5 is increasing significantly
State of the Legal Market: Australia – 2015 WHITE PAPER
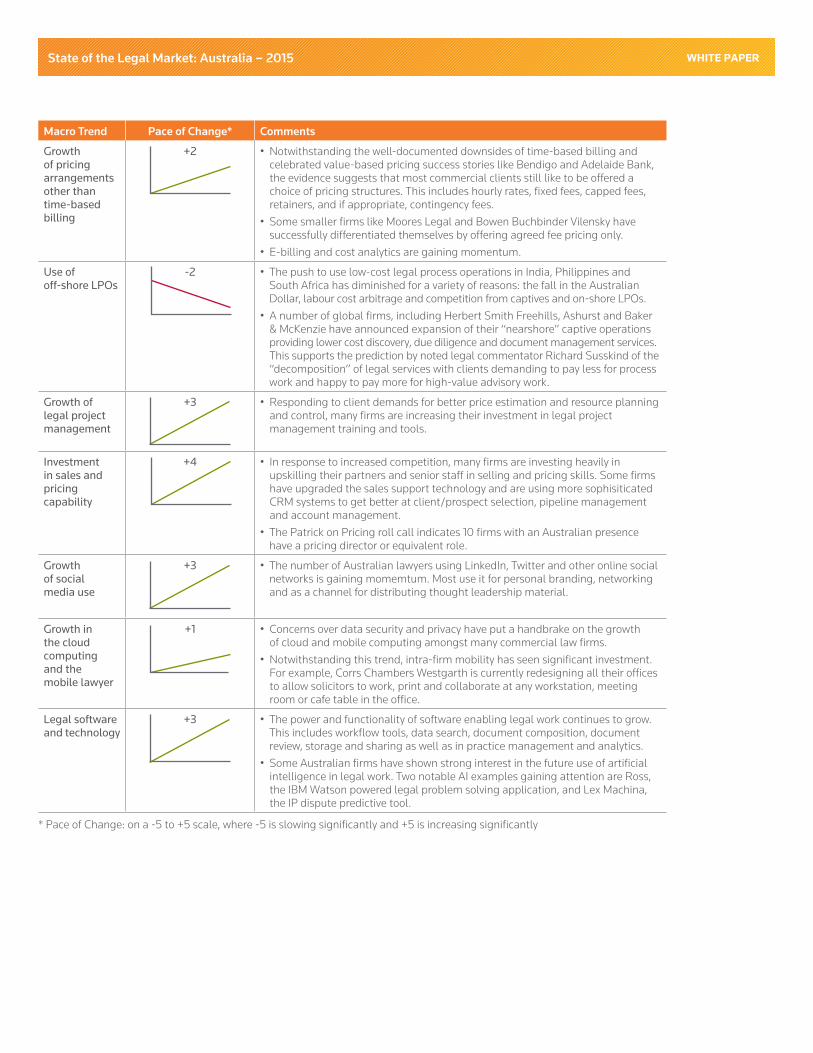
Macro Trend Pace of Change* Comments
Growth of pricing arrangements other than time-based billing
+2 • Notwithstanding the well-documented downsides of time-based billing and celebrated value-based pricing success stories like Bendigo and Adelaide Bank, the evidence suggests that most commercial clients still like to be offered a choice of pricing structures. This includes hourly rates, fixed fees, capped fees, retainers, and if appropriate, contingency fees.
• Some smaller firms like Moores Legal and Bowen Buchbinder Vilensky have successfully differentiated themselves by offering agreed fee pricing only.
• E-billing and cost analytics are gaining momentum.
Use of off-shore LPOs
-2 • The push to use low-cost legal process operations in India, Philippines and South Africa has diminished for a variety of reasons: the fall in the Australian Dollar, labour cost arbitrage and competition from captives and on-shore LPOs.
• A number of global firms, including Herbert Smith Freehills, Ashurst and Baker & McKenzie have announced expansion of their “nearshore” captive operations providing lower cost discovery, due diligence and document management services. This supports the prediction by noted legal commentator Richard Susskind of the “decomposition” of legal services with clients demanding to pay less for process work and happy to pay more for high-value advisory work.
Growth of legal project management
+3 • Responding to client demands for better price estimation and resource planning and control, many firms are increasing their investment in legal project management training and tools.
Investment in sales and pricing capability
+4 • In response to increased competition, many firms are investing heavily in upskilling their partners and senior staff in selling and pricing skills. Some firms have upgraded the sales support technology and are using more sophisiticated CRM systems to get better at client/prospect selection, pipeline management and account management.
• The Patrick on Pricing roll call indicates 10 firms with an Australian presence have a pricing director or equivalent role.
Growth of social media use
+3 • The number of Australian lawyers using LinkedIn, Twitter and other online social networks is gaining momemtum. Most use it for personal branding, networking and as a channel for distributing thought leadership material.
Growth in the cloud computing and the mobile lawyer
+1 • Concerns over data security and privacy have put a handbrake on the growth of cloud and mobile computing amongst many commercial law firms.
• Notwithstanding this trend, intra-firm mobility has seen significant investment. For example, Corrs Chambers Westgarth is currently redesigning all their offices to allow solicitors to work, print and collaborate at any workstation, meeting room or cafe table in the office.
Legal software and technology
+3 • The power and functionality of software enabling legal work continues to grow. This includes workflow tools, data search, document composition, document review, storage and sharing as well as in practice management and analytics.
• Some Australian firms have shown strong interest in the future use of artificial intelligence in legal work. Two notable AI examples gaining attention are Ross, the IBM Watson powered legal problem solving application, and Lex Machina, the IP dispute predictive tool.
* Pace of Change: on a -5 to +5 scale, where -5 is slowing significantly and +5 is increasing significantly
State of the Legal Market: Australia – 2015 WHITE PAPER
© 2015 Thomson Reuters S024161/8-15
In conclusionThere is little doubt that the Australian legal market is in the mature phase of the life cycle with declining demand,
increased price-based competition and pressure on operating margins. In this environment or the “new normal,” as
some refer to it, clients want more for less and it appears they are getting it. Other than a substantive lift in general
economic activity or major regulatory change, it is hard to see what will accelerate demand in the short to near term.
In the past, a combination of high demand, naïve clients and old boys club competition meant even mediocre firms
could thrive. It is clear the market will no longer tolerate mediocrity. The war for top talent will intensify. Quality people
will seek out quality firms that are well led and have a coherent strategy. Firms that don’t make the grade will simply
fragment or fold.
One of the most challenging aspects of this new phase of competition is that much of the investment to improve and
innovate gets matched by rivals. If everything is matched, everyone stays roughly in the same position. For example,
if all firms train their partners in sales skills, no one firm will gain an edge by being better at sales. For the firms that
truly wish to outperform, the key lies in “softer” capabilities that are harder to emulate. These include things like agility,
discipline, execution, cultural cohesion, diversity and true collaboration. In our view these will be the traits of the firms
that will fly in 2016 and beyond.