the least preferred co-worker scale as a predictor of
TRANSCRIPT

Portland State University Portland State University
PDXScholar PDXScholar
Dissertations and Theses Dissertations and Theses
1990
The Least preferred co-worker scale as a predictor The Least preferred co-worker scale as a predictor
of leadership behavior in work settings of leadership behavior in work settings
Jenell Arlene Streeter Portland State University
Follow this and additional works at: https://pdxscholar.library.pdx.edu/open_access_etds
Part of the Psychology Commons
Let us know how access to this document benefits you.
Recommended Citation Recommended Citation Streeter, Jenell Arlene, "The Least preferred co-worker scale as a predictor of leadership behavior in work settings" (1990). Dissertations and Theses. Paper 4136. https://doi.org/10.15760/etd.6019
This Thesis is brought to you for free and open access. It has been accepted for inclusion in Dissertations and Theses by an authorized administrator of PDXScholar. Please contact us if we can make this document more accessible: [email protected].

AN ABSTRACT OF THE THESIS OF Jenell Arlene Streeter for the Master of Science in
Psychology presented July 23, 1990.
Title: The Least Preferred Co-worker Scale as a Predictor of Leadership Behavior in
Work Settings.
APPROVED BY THE MEMBERS OF THE THESIS COMMITTEE:
Dean E. Frost, Chair
Nancy A. Perrin ''
Steward
This study evaluates the construct validity of the Least Preferred Co-worker (LPC)
Scale by testing the predictions made by the motivational hierarchy hypothesis. The
respondents were one hundred fifty-nine supervisors and managers. The LPC determined
leadership style as either relationship-oriented or task-oriented. Situational control was

2
measured by the Leader-Member Relations scale, Task Structure scale, and Position Power
scale. Consideration behavior, measured by the adapted LBDQ, reflected a need for
inteipersonal success. Initiation of structure behaviors, measured by the adapted LBDQ,
reflected a need for task success. Two hypotheses were tested: (1) High LPC leaders in
high control situations engage in more task-oriented behaviors than high LPC leaders in
low control situations. Low LPC leaders' task-oriented behaviors are consistent across
situational control. (2) Low LPC leaders in high control situations engage in more
consideration behaviors than low LPC leaders in low control situations. High LPC
leaders' consideration behaviors are consistent across situational control. The results of
this study supplements previous research (Green, Nebeker & Boni, 1976; Michaelson,
1973) supportive of the motivational hierarchy inteipretation of the LPC. Hypothesis 1
was not supported. However, a significant interaction effect supported Hypothesis 2.
Criticisms concerning the construct validity of the LPC, the motivational hierarchy
inteipretation of the LPC, and the Contingency Model of Leadership Effectiveness are
discussed. Several recommendations for future research are suggested.

THE LEAST PREFERRED CO-WORKER SCALE AS A PREDICTOR OF
LEADERSHIP BERA VIOR IN WORK SETTINGS
by
JENELL ARLENE STREETER
A thesis submitted in partial fulfillment of the requirements for the degree of
MASTER OF SCIENCE in
PSYCHOLOGY
Portland State University 1990

TO THE OFFICE OF GRADUATE STUDIES:
The members of the committee approve the thesis of Jenell Arlene Streeter
presented July 23, 1990.
Dean E. Frost, Chair
\;/
Nancy A. Perrin ~
Larry Steward
APPROVED:
Roger Jennings, Chgir, Department.Qf ,Psychology
C. William Savery, Vice Provost for 0¥{tduate Studies and Research \/

ACKNOWLEDGEMENTS
I would like to express my appreciation to my committee members for their effort
and contributions. I am especially grateful to Dr. Dean Frost, who exposed to the field of
industrial/organizational psychology and the study of leadership. His expertise and total
involvement in this project made this thesis possible. His support, instruction, and
feedback on early drafts of the paper were invaluable. This project is as much his as it is
mine. Finally, I would like to thank my family and friends for their love, understanding,
and support throughout my education.

TABLE OF CONTENTS
ACKNOWLEDGEMENTS ...................................................................... iii
LIST OF TABLES .................... ......................... .................................... vi
LIST OF FIGURES ...... ......................................................................... vii
INTRODUCTION................................................................................... 1
REVIEW OF THE LITERATURE ................................................................ 2
The Contingency Model of Leadership Effectiveness .................................. 2
Interpretation of the Least Preferred Co-Worker Scale ................................. 9
Leader Behavior ........................................................................... 13
Recent Research ........................................................................... 14
DESCRIPTION OF THE PROBLEM .......................................................... 16
Hypotheses................................................................................. 16
METHODS AND INSTRUMENTS ............................................................ 18
Sample ..................................................................................... 18
Procedure .... ............. .............................................. ................... 18
Instruments ................ ............... ......................... ........................ 19
RESULTS .......................................................................................... 21
DISCUSSION ..................................................................................... 30
REFERENCES .................................................................................... 37
APPENDICES
A INSTRUCTIONS FOR THE LEAST PREFERRED
CO-WORKER SCALE ......................................................... 39

v
B LEAST PREFERRED CO-WORKER SCALE .............................. 41
C LEADER-MEMBER RELATIONS SCALE ................................. 43
D TASK STRUCTURE RATING SCALE ..................................... 45
E POSITION POWER RA TING SCALE
SELF-REPORT .................................................................. 47
F MY BEHAVIOR WITH SUBORDINATES ................................. 49
G POSITION POWER RATING SCALE
ORGANIZATIONAL REPORT ............................................... 52

TABLE
I
II
111
N
v
LIST OF TABLES
PAGE
Fiedler's Situational Control Variables in Octants ............................. 6
Descriptive Statistics ............................................................. 21
Intercorrelation Matrix . .. .. .. .. .. ........ ..... .. ...... .. ...... .. .... .. ..... .. .. .. 23
Weights for Multiple Regression on Consideration .......................... 24
Changes in Increments of Variance Accounted for in Predicting
Consideration ...... ..... ... . . . ... .. ..... ... . .. . . ... ...... ..... ..... ... . .. ...... ... 28
VI Changes in Increments of Variance Accounted for in Predicting
Initiation of Structure ............................................................ 29

FIGURE
1.
2.
3.
LIST OF FIGURES
PAGE
Correlations between leader LPC and group performance ................... 7
The hypothesized regression lines for initiation of structure and
consideration behavior for high and low LPC leaders. ...................... 17
Regression lines for high and low LPC leaders for consideration
behavior across situational control. ............................................ 25
4. Regression line for high and low LPC leaders for initiation of
structure behavior across situational control. ... ... ... .. ... ... ......... .. ..... 27

INTRODUCTION
Leadership is recognized as a fundamental and broad field of study with its share of
controversy. One important theory in the field of leadership is Fielder's Contingency
Model of Leadership Effectiveness. Bass ( 1981) states that
Fiedler's (1967a) contingency model ofleadership is the most widely researched on leadership. At the same time, it is the most widely criticized ... controversy continues about what is being measured by LPC - Fielder's Least Preferred Co-worker questionnaire. This, in turn, affects the ability to understand its varying relation to effectiveness in different situations (p. 341).
Construct validity is a crucial issue when evaluating and applying a theory. If a
measure lacks construct validity, one can not interpret scores on the test to determine why
and in what ways the test is a reflection of the construct of interest. This study is an
attempt to evaluate the validity of the Least Preferred Co-Worker (LPC) Score testing the
motivational hierarchy hypothesis. The LPC is a key variable in the Contingency Model of
Leadership Effectiveness (Fiedler, 1967, 1978), but exactly what the LPC measures is very
controversial, as Rice (1978) and Bass (1981) point out. The LPC is used to determine
leadership style, and the rest of the model is based on the correct typing of leadership style.
If the LPC lacks validity, the whole model can not be valid. It is also important that the
LPC have face validity. In field experiments and in business application, leaders must
except the LPC as a measure of their style. If they do not except the LPC's interpretation
of their style, the research investigation is hampered and leadership training is impossible.
To date, there has not been a comprehensive study testing the predictions made by the
motivational hierarchy hypothesis using Fielder's measures of leadership style and
situational control. This study is an attempt to do just that.

REVIEW OF THE LITERATURE
THE CONTINGENCY MODEL OF LEADERSHIP EFFECTIVENESS
Fred Fiedler changed the direction of leadership research by developing the first
contingency model of leadership. Since the first publication on this theory in 1964, more
than 400 journal articles and books have been written about the model. A training program
has also been developed and published based on Fiedler's model. It has been dubbed by
Fiedler as 11 ••• the most researched and best validated leadership theory 11 (Fiedler, 1984, p.
6). The Contingency Model of Leadership Effectiveness is based on the assumption that
leadership is a function of the individual's leadership orientation and the situational context.
The model looks at both the leader, as an individual, and the context in which the leader
deals.
The Least Preferred Co-Worker Scale (LPC) is used by Fiedler to determine an
individual's leadership style as either relationship-oriented or task-oriented. Fiedler
developed the LPC in the 1950's when he and Carl Rogers (the father of Client Centered
Therapy) were attempting to apply trait theories to therapists doing group therapy by using
the Assumed Similarity of Opposites Scale (ASO). They were exploring the relationship
between clinical psychologists' effectiveness as therapists and their perception of their
clients. The ASO is a projective test. In psychoanalytic theory, projection is an ego
defense mechanism in which one attributes to others unacceptable unconscious desires,
impulses, and traits one does not want to see or accept in oneself. Therefore, responses
from a projective test may be interpreted as a self evaluation under the pretense of
describing someone else. The ASO consists of bipolar adjective pair on which an individual
describes his or her best friend and an individual he or she dislikes. The difference
between the two rating is interpreted as the degree of social distance one maintains with

3
others. Fielder attempted to generalize this work to leaders hypothesizing that good
leaders, like good therapist, are not distant. Fiedler revised and renamed the scales to be
appropriate for leaders. He then asked the leaders to rate their Most Preferred Co-worker
(MPC) and their Least Preferred Co-worker (LPC). Like the ASO score for a close friend,
Fielder found very little variation is the way individuals described their Most Preferred Co
worker (MPC). Because the MPC did not help in discriminating between people, only the
LPC was used in later research. Fiedler later discovered that under some situations the
LPC score was correlated with work group performance, and thereafter labeled the scale as
a measure of leadership style. Through years of research and development on the LPC, the
item content and the number of items on the scale have changed. Though the LPC was
originally modeled after the ASO, it has been modified to the point it no longer similar to
the ASO in method or meaning. The latest version of the scale consists of 18 bipolar
adjective pairs describing the leader's least preferred co-worker. The person is instructed
to think of a co-worker (present or past) with whom he or she has had the most difficulty in
getting a job done (can work least well with) and describe that person using the adjective
pairs (see Appendix A and B).
Low LPC scoring leaders describe their least preferred co-worker in a negative
manner. They are typified as task-oriented leaders because they develop very negative
feelings about a person who prevents the group from successfully accomplishing the task.
Task-oriented leaders' concerns focus on group goals, goal achievement, and production.
They keep their distance psychologically from group members, and therefore are often
described as cold and aloof, with an inability to trust co-workers. As a manager, they
closely supervise their subordinates in a controlling manner. Task-oriented leaders are
associated with personal factors such as self-sufficiency, resourcefulness, aloofness,
seriousness, ascendency, objectivity, thoughtfulness, and a high need for achievement
(Bass, 1981).

4
High LPC leaders describe the co-worker more positively than low LPC leaders.
They are typed as relationship-oriented leaders, because they are able to appreciate positive
traits in the person as an individual regardless of his or her ability to successfully complete
the task at hand. Their least preferred co-worker is often described as uncooperative and
untrustworthy, and thus inhibit positive social relationships within the work group.
Relationship-oriented leaders utilize a human relations approach in leading others. They are
described as being concerned with group maintenance and as striving for friendly,
supportive relationships with their co-workers. As managers they usually prefer
general supervision over close supervision of their subordinates (Bass, 1981).
Relationship-oriented leaders are associated with personal factors such as socially group
dependent, warm, and sociable. Relationship-oriented leaders often have a high need for
affiliation, a need to be controlled by others, and a need for inclusion.
Though the styles are distinctively different this does not mean one style is
preferred over the other, or that one style is more effective than the other. Both
relationship-orientation and task-orientation as leadership styles correlate positively with
group productivity, goal attainment, and subordinates' performance. These empirical
results vary under certain situations, which has led to the need for contingency approaches.
A second major variable in Fiedler's contingency theory is situational control. The
differences in the leaders' work context are operationalized by three situational factors. The
first factor is the leader-member relations, which is the degree to which the leader and the
group get along, originally ref erred to as group atmosphere. The increased acceptance of
the leader is reflected in the increased confidence, trust, and respect for the leader (see
Appendix C).
The second factor used to measure situational control is the task structure, which is
the degree of simplicity in completing a task. This factor has four components; goal clarity,
goal-path multiplicity, decision-verifiability, and decision-specificity. Goal clarity refers to

the degree that the tasks and duties are clearly stated and to how well the group members
know their job. Goal-path multiplicity is reflected in the number of different procedures
and processes that can be used in completing the task. Decision-verifiability is the degree
to which the outcome can be evaluated as correct or incorrect. The last component of task
structure is decision-specificity, which refers to the degree to which there is more than one
correct outcome or solution (see Appendix D).
The third factor used to measure situational control is the leader's position power,
which refers to the leader's legitimate authority and the availability of sanctions to be
exercised by the leader (see Appendix E).
5
The three situational control factors are seen as interval level rating scales with the
cut-off scores of "high" and "low" set the median value, unless experimentally manipulated
in laboratory studies. Factorially combining the three variables with two levels each leads
to eight possible situations which the leader may experience. Fiedler labeled these Octants.
Octants 1-4 are described as having high Leader-Member Relations, and octants 5-8 are
described as having low Leader-Member Relations. Octants 1, 2, 5, and 6 have high Task
Structure and octants 3, 4, 7, and 8 have low Task Structure. Octants 1, 3, 5, and 7 have
high Leader Position Power, and octants 2, 4, 6, and 8 have low Leader Position Power
(see Table I).

TABLE I
FIEDLER'S SITUATIONAL CONTROL VARIABLES IN OCTANTS
Situation
Leader-member relations
Task Structure
Position power
Octants
1 2 3 4 5 6 7 8
Good Good Good Good Poor Poor Poor Poor
High High Low Low High High Low Low
High Low High Low High Low High Low
6
High Control -------------------------------------------------~---------------- Low Control
At first, the octants were interpreted as Situational Favorablity. The term was
replaced by Situational Control, because favorablity was often confused with task difficulty
(Fiedler, 1978). Fiedler (1978) conceptually defines Situational Control "as the degree to
which the situation enables leaders to determine the outcome of their decisions and actions"
(p. 86). This interpretation is supported by Nebeker (1975). Fiedler now uses scales that
measure the three situational factors and combines the three into one scale called Situational
Control. He has divided his Situational Control continuum into three levels for his training
program; high, moderate, and low. For research purposes the situational control variable
should be treated as a continuous variable, not a categorical variable. Situational Control is
an improvement to the theory that should now be utilized to improve measurement of
situations and data analysis (Nebeker, 1975).
The Contingency Model of Leadership Effectiveness was inductively derived based
on the correlations between the leader' LPC and the group performance (see Figure 1 ). In

Median correlations between leader LPC and group performance High LPC 1 .00
.80
.60
.40
.20
.00 i------------,,-0
-.20
-.40 I •
-.60 • -.80
.. . .. . LowLPC -1.00'-~~-"~~~ ....... ~~~ ........ ~~~.._~~~~~~ ....... ~~~ ......... ~~~
7
Favorable I II Ill IV V VI VII VIII Unfavorable for leader for leader
Leader-member relations Good Good Good Good Moderately Moderately Moderately Moderately poor poor poor poor
Structured Unstructured Structured Unstructured Task structure Structured Unstructured Structured Unstructured
Leader-position power Strong Weak Strong Weak Strong Weak Strong Weak
Source: F. E. Fiedler, A Th~Of"Y of uad~rship Effectiv~n~ss (New York: McGraw-Hill, 1967), p. 146.
Figure 1. Correlations between leader LPC and group performance.

8
Figure 1 the line connects the median correlations. Those median correlations falling below
the mid-line indicates that low LPC leader perform better than high LPC leaders. Median
correlations falling above the mid-line indicate that high LPC leaders perform better than
low LPC leaders in those situations. Fiedler's theory makes the following predictions:
Low LPC leaders are more effective in high control and low control situations ( octants 1,
2, 3, and 8); high LPC leaders are more effective in moderate control situations (octants 4,
5, 6, and 7).
Fielder (1978) explains the changes in leadership effectiveness in behavioral terms.
In high-control situations, high-LPC leaders are seen as inconsiderate and more concerned with the task than with their interpersonal relations. Low-LPC leaders are rated as relatively unconcerned with the task, but considerate, pleasant, and relaxed in their interactions with group members.
In moderate-control situations, in which high-LPC leaders generally perform best, low-LPC leaders become increasingly concerned with the task. They are described as relatively more task-oriented, structuring, and controlling, and as less considerate and less concerned with interpersonal relations. High-LPC leaders, on the other hand, are generally rated as considerate and interpersonally oriented.
In low-control situation, which is characterized by poor leader-member relations, low task structure, low position power, and/or high stress, the low-LPC leaders tend to perform well. The high-LPC leaders tend to become anxious in this situation and seeks emotional support. He is relatively nondirective, nonstructuring, and pays less attention to the task. In conditions of very high stress, high-LPC leaders may withdraw almost completely from the leadership role, as indicated by the way their subordinates tend to describe them, namely as nondirective, nonstructuring, nonsupportive, and inconsiderate. It is then not surprising that the task performance of high-LPC leaders is poor in low-control situations. Low-LPC leaders, on the other hand, are described as directive, structuring and concerned with the task, but inconsiderate and unconcerned with their relations with subordinates (pp.101-102).
Strube and Garcia (1981) used a meta-analytic technique in a validation study of
Fiedler's Contingency Model of Leadership Effectiveness. They concluded that the model
was robust in predicting group performance and should be applied through the use of the
Leader Match training program (Fielder and Chemers, 1984). Strube and Garcia (1981)
also suggested that further research be done with more diverse samples, other than military

and student groups, to add to the models' external validity (or generalizability) and to
further the understanding of factors contributing to leadership effectiveness. Kennedy's
(1982) study also found support for the validity of the contingency model using the
analysis of variance technique with a sample size of 1089. Based on the findings of these
researchers and others, the contingency model is a well researched theory deserving of
continued exploration and application but a major criticism of the theory remains, the
construct validity of the Least Preferred Co-worker scale (LPC).
INTERPRETATION OF THE LEAST PREFERRED CO-WORKER SCALE
9
For over thirty years, researchers have attempted to establish the construct validity
of the LPC by correlating the LPC with personality traits and behavior observation scores
(Bass, 1981). Rice (1978) points out the four different interpretations (not including his
own) of the LPC that have been suggested post hoc to explain new empirical findings. The
five interpretations include; social distance, motives and needs, cognitive complexity,
value-attitude, and motivational hierarchy.
The social distance hypothesis was based on the assumed similarity data from
person perception research in therapeutic settings (Fiedler, 1957). The LPC was almost
perfectly correlated with Assumed Similarity between Opposites (ASO), an index of
psychological closeness. Fiedler (l 953a, 1953b) hypothesized leaders would assume
greater similarity between themselves and co-workers they liked, and would assume less
similarity with co-workers they disliked. Low LPC leaders were thought to be more
socially (or psychologically) distant from their least preferred co-worker than high LPC
leaders, who were generally closer to co-workers. Rice's (1978) review of social distance
studies found the data to be contradictory.
In 1964, Fiedler proposed a motives and needs interpretation to replace the social
distance hypothesis. He stated that the LPC was a measure of two different needs; the need

10
for interpersonal success and the need for task performance success. High LPC leaders
were thought to have a strong need for interpersonal success. Low LPC leaders were
thought to have a strong need for task-performance success. The behaviors of leaders were
thought to reflect the differences in needs. Low LPC leaders were thought to behave in a
task-oriented manner, and high LPC leaders were thought to behave in a relationship-
oriented manner. Some data showed a reversal of the expected behavior with low LPC
leaders behaving in a relations-oriented manner and high LPC leaders behaving in a task-
oriented manner.
Due to the inability to explain such reversals with the motives and needs
hypothesis, this interpretation was replaced by Hill (1969) and Foa, Mitchell, and Fiedler
(1971) who proposed the cognitive complexity hypothesis. This hypothesis stated that
high LPC leaders are cognitively more complex than low LPC leaders. Their proposal was
based on the positive correlation between LPC and cognitive complexity measures.
Numerous follow-up studies, however, failed to support this interpretation (Bass, 1981 ).
Rice offers his own interpretation of the LPC, which he labels a value-attitude. He
states that the LPC scale is "a measure of attitudes that reflect basic differences in the
values of person scoring high or low on the scale" (p.1215). Rice (1978) proposes that
"high-LPC persons value interpersonal success relatively more than do low-LPC persons
and that low-LPC persons value task success relatively more than do high-LPC persons"
(p. 1230). The value-attitude interpretation dismisses the proposition of secondary goals
and focuses exclusively on primary goals. Rice explains the variation in leader behavior
and reported interactions between LPC and situational control as merely
... showing inconsistency between attitudes (LPC) and behavior. .. Given the generally tenuous relationships between attitudes and behavior, we should not be surprised by results showing that low-LPC leaders are not always task oriented in their behavior and that high-LPC persons are not always relationship oriented in their behavior (p.1221).
The motivational hierarchy hypothesis is the most recent hypothesis suggested by

11
Fiedler (1972). Fielder proposes that the primary goal of high LPC leaders is interpersonal
success, and their secondary goal is task success. Low LPC leaders', on the other hand,
primary goal is task success, and their secondary goal is interpersonal success. Fiedler
assumes, based on Maslow's (1954) goal hierarchy concept, that primary goals must be
fulfilled before gratification of secondary goals can be attempted, and that gratification of
secondary goals is only possible in relatively more favorable (or higher control) situations.
Therefore, high LPC leaders in low control situations are concerned with interpersonal
success (their primary goal), and in high control situations are concerned with task success
(their secondary goal). Low LPC leaders, conversely, are concerned with task success
(their primary goal) in low control situations, and interpersonal success (their secondary
goal) in high control situations. If the motivational hierarchy is a correct interpretation of
what the LPC is measuring, behaviors related to the secondary goals of low and high LPC
leaders should change along with changes in their degree of situational control.
In Rice's (1978) discussion of variance in leader behavior he states "These data are
sparse, but they suggest that leaders may show greater behavioral consistency (less
variance) in domains of greatest concern (p.1219)," these domains are referred to here as
the primary goal. A motivational hierarchy suggests this consistency occurs because the
primary goal remains a high priority in any situation. The variance in secondary goals may
be attributed to changes in the degree of situational control. As the degree of situational
control increases the leader is free to pursue his or her secondary goal, when situational
control decreases the leader ceases to pursue the secondary goal while attending only to
their primary goal. In high levels of situational control the primary goal is maintained,
therefore there is less variance.
Rice (1978) describes the empirical support for the interaction effect documented by
Fielder (1972), as " ... not as strong as Fielder's review might imply" (p. 1220). He
states three reasons for his conclusion. The first being that

... there are a substantial number of significant main effects for leader behavior. Such results, showing consistent differences in the behavior of high- and low-LPC leaders across a wide range of situations, give no support to the notion that the behavioral patterns of high- and low-LPC persons reverse themselves as favorable situations allow for the pursuit of secondary goals (1220).
Secondly, he cites studies that found interaction effects that are not consistent with
predictions based on motivational hierarchy. Finally, he cites mixed results in studies of
leader behavior directly testing the motivational hierarchy hypothesis.
12
Contrary to Rice's conclusions, consistent differences between low and high LPC
leaders should be expected and do not invalidate the motivational hierarchy, because
leader's primary goals remain constant throughout the span of situational control. Only the
degree to which the secondary goal is pursued changes. The mixed results Rice cites may
also be due to the type of analysis used. Many studies use analysis of variance and treat
situational control as a discrete ordinal variable with eight levels. The low statistical power
of these studies has been a consistent, long-standing, and well recognized problem.
The issue of method of analysis is of great importance to field researchers for
several reasons. In the first place, random assignment into octants is not possible. The
degree of situational control a leader possesses is a given and can not be manipulated.
Secondly, the eight octants do not occur with equal likelihood in realistic settings.
Situations described by octants three and six, for example, are quite rare. Therefore, the
equal distribution of subjects into octants is probably impossible. Finally, to get enough
subjects in each group for an ANOV A the sample size must be extremely large because the
information is not distributed equally.
As Nebeker (1975) points out, combining the three component variables into a
single interval scale for situational control provides for "finer discrimination among
situations" and" ... allows full use of all of the variance available in each of the component
variables" (p. 286). His study concludes that each factor has been weighted as to reflect

its importance in determining Situational Control and, therefore, should be used as a
continuous variable instead.
LEADER BEHAVIOR
13
Research studying the effects of situations on leadership behavior have typically
been done using the two most widely used dimensions of leader behavior, "consideration"
and "initiation of structure". Fleishman and Harris's (1962) consideration factor is
correlated with a relationship-orientation, and their initiation of structure factor is correlated
with task-orientation (Fiedler, 1967). Initiation of structure refers to leader behaviors that
focus on goal attainment through defining roles, structuring tasks, and fulfill the processing
functions of leadership. These behaviors include defining subordinates' roles, organizing
and managing activities, meeting production deadlines, and goal achievement.
Consideration refers to leader behaviors that show subordinates respect for their ideas and
consideration of their feeling, focusing on the members' self-esteem, job satisfaction, and
expression of appreciation (Fleishman, 1957a, 1957b).
Many studies use the Leadership Behavior Description Questionnaire (LBDQ) to
measure subordinates' perceptions of the leader's behavior (Fleishman, 1957a). The
LBDQ contains subscales for consideration and initiation of structure. An adapted version
of the LBDQ can be used for the leaders' descriptions of their own behavior (See Appendix
F). Thus, the primary difference is self perception in contrast to the perception by others.
If there exist differences in leaders relating to their style then these two behaviors, initiation
of structure and consideration, should show those differences exist behaviorally in an
explicit fashion.

RECENT RESEARCH
Though the Contingency Model and the corresponding Leader Match training
program (Fiedler &Chemers, 1984) are currently being used in research, there is a
surprising lack of current research testing the validity of the motivational hierarchy
hypothesis that attempts to explain the meaning of LPC.
1 4
Green, Nebeker, and Boni (1976) suggests that when placed in unfavorable
situations in which the leader is under stress, high LPC leaders are more interpersonally
oriented and low LPC are more task oriented. The study was done in a laboratory with
undergraduate psychology students as subjects. Interpersonal and task orientation was
measured by the leaders describing their own behavior with an adapted LBDQ.
Consideration items were used to measure interpersonal orientation, and initiation of
structure items were used to measure task orientation. Results showed that "the high LPC
leaders were significantly more interpersonally oriented, and low LPC leaders were
significantly more task oriented (p. 190-191)". In other words, this is the well documented
main effect. The study also found that high LPC leaders engaged in consideration
behaviors in unfavorable situations, while low LPC leaders engaged in initiation of
structure behaviors. The correlation between the judges' ratings and self ratings of
consideration behavior was r=.29, p<.10 and for initiation of structure behavior was
r=.62, p<.001. Because all leaders were engaged in an unfavorable situation, as defined
by Fiedler, a test of the motivational hierarchy was not possible. However, the authors
note that leaders are motivated to attend to their primary goal in unfavorable situations.
In a correlational study using the Survey of Management to determine leadership
orientation (task or interpersonal) and the Survey of Organizations to construct six
dependent variables and a situational control index, Michaelsen (1973) attempted to test
Fielder's motivational hierarchy hypothesis that in low control situations leaders' behaviors

reflect an attempt to achieve their primary goals, and in high control situation leaders'
behaviors reflect an attempt to achieve their secondary goal. Without using the Fiedler's
LPC and Situational Control measures, but "an entire set of conceptually similar but
operationally different independent, dependent, and control variables" (p.241), his study
supported the hypothesis. He found that
... in a very unfavorable situation, supervisors directed most of their behavior toward the achievement of their primary goals, while in a very favorable situation, they concentrated less on the achievement of primary goals and more on the achievement of secondary goals (p. 226).
15
The hypotheses tested the general theory behind the motivational hierarchy, but the study is
not helpful in assessing the construct validity of the LPC since the LPC was not used to
determine leadership orientation.

DESCRIPTION OF THE PROBLEM
The task now remains to replicate Michaelsen's findings using the measures
designed for the theory (LPC and Situational Control), the most widely used and validated
leader behavior measures (consideration and initiation of structure from the adapted
LBDQ), and the proper method of analysis (multiple regression) to validate the motivational
hierarchy interpretation of the LPC.
Support for Fiedler's motivational hierarchy hypothesis will be obtained if: In low
control situations, leaders' behavior reflects an attempt to achieve their primary goals; and
in high control situations leaders' behavior reflects an attempt to achieve their secondary
goals. The LPC scale will be used to determined each leader's orientation and, therefore,
their primary and secondary goals. Situational control will be measured by the Leader
Member Relations, Task Structure, and Position Power scales taken from Improving
Leadership Effectiveness: The Leader Match Concept (Fiedler, 1984). Consideration
behaviors, measured by the adapted LBDQ, will be used to reflect a leader's attempt to
fulfill the need for interpersonal success. Initiation of structure behaviors, measured by the
adapted LBDQ, will be used to reflect a leader's attempt to fulfill the need for task success.
The following hypotheses will be tested:
Hypothesis 1: Interaction Effect: High LPC leaders in high control situations engage in
more task- oriented behaviors than high LPC leaders in low control
situations. Low LPC leaders' task-oriented behaviors remain
consistent across situational control (see Figure 2 ).
Hypothesis 2: Interaction Effect: Low LPC leaders in high control situations engage in
more consideration behaviors than low LPC leaders in low control

situations. High LPC leaders' consideration behaviors remain
consistent across situational control (see Figure 2).
Hypothesis 1
Low LPC Initiation of Structure
------ -HighLPC
Situational Control
Hypothesis 2
Consideration High LPC
LowLPC
Situational Control Figure 2: The hypothesized regression lines for Initiation of Structure and Consideration Behavior for High and Low LPC leaders.
17
METI-IODSANDINSTRUMENTS
SAMPLE
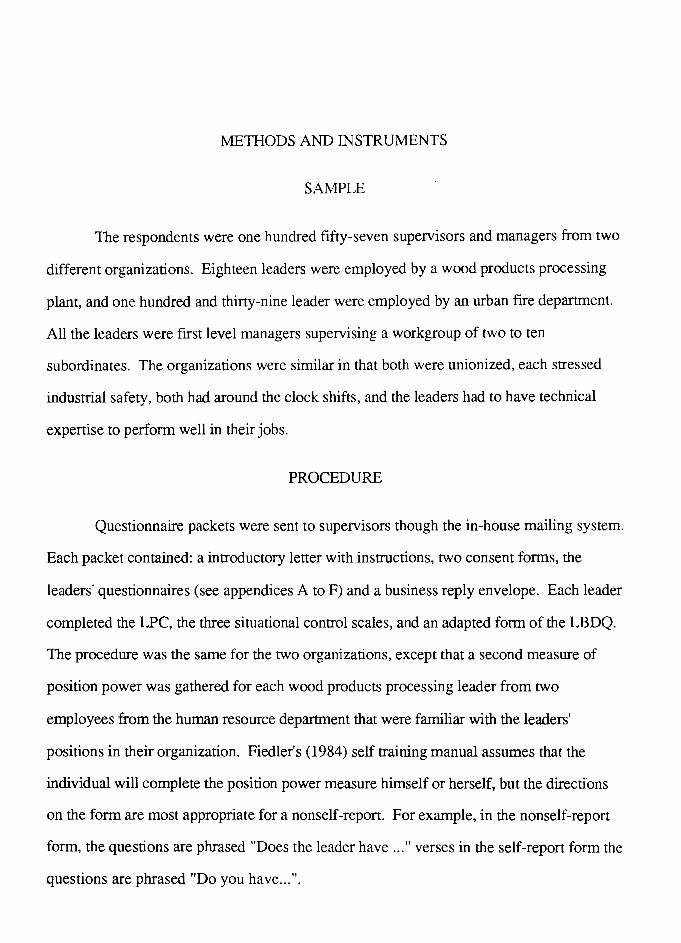
The respondents were one hundred fifty-seven supervisors and managers from two
different organizations. Eighteen leaders were employed by a wood products processing
plant, and one hundred and thirty-nine leader were employed by an urban fire department.
All the leaders were first level managers supervising a workgroup of two to ten
subordinates. The organizations were similar in that both were unionized, each stressed
industrial safety, both had around the clock shifts, and the leaders had to have technical
expertise to perform well in their jobs.
PROCEDURE
Questionnaire packets were sent to supervisors though the in-house mailing system.
Each packet contained: a introductory letter with instructions, two consent forms, the
leaders' questionnaires (see appendices A to F) and a business reply envelope. Each leader
completed the LPC, the three situational control scales, and an adapted form of the LBDQ.
The procedure was the same for the two organizations, except that a second measure of
position power was gathered for each wood products processing leader from two
employees from the human resource department that were familiar with the leaders'
positions in their organization. Fiedler's (1984) self training manual assumes that the
individual will complete the position power measure himself or herself, but the directions
on the form are most appropriate for a nonself-report. For example, in the nonself-report
form, the questions are phrased "Does the leader have ... " verses in the self-report form the
questions are phrased "Do you have ... ".

19
INSTRUMENTS
The Least Preferred Co-Worker Scale (LPC) was be used to determine the
individual's leadership style as either relationship-oriented or task-oriented. The written
instructions (see Appendix A) were taken directly from Improving Leadership
Effectiveness: The Leader Match Concept, 2nd. Ed. (Fiedler & Chemers, 1984). The
LPC consists of 18 bipolar adjectives pair describing the leaders least preferred co-worker
(e.g., friendly-unfriendly, cooperative-uncooperative). The response scale ranges from one
to eight. The favorable pole for each item is scored as an eight. The unfavorable pole for
each item is scored as an one (see Appendix B).
Situational Control is an interval scale created by combining the scores on the three
situational factors; Leader-Member Relations, Task Structure, and Position Power. Scales
were taken from Improving Leadership Effectiveness: The Leader Match Concept, 2nd.
Ed. (1984) by Fiedler & Chemers. Situational Control scores may range from 8 to 70.
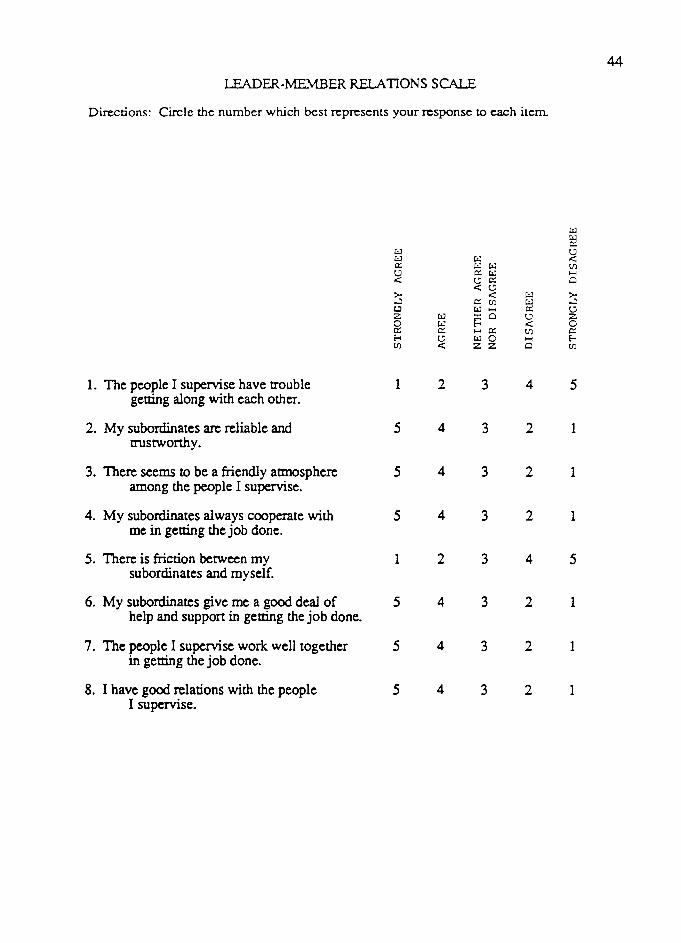
The Leader-Member Relations Scale is an eight item questionnaire with a response
scale of 1 to 5 with verbal anchors ranging from Strongly Agree to Strongly Disagree, and
possible scores range from 8 to 40. A high score reflects a supportive and loyal
environment for the leader. A low score reflects an unsupportive and unfriendly
environment (See Appendix C).
The Task Structure Rating Scale is a ten item questionnaire with a response scale of
0 to 2, each with a verbal anchor. Possible scores range from 0 to 20. A high scores
describes a very structured task, and a low score describes a very unstructured task (See
Appendix D).
The Position Power Rating Scale is a five item questionnaire with varying verbal
anchors and a possible score range of 0 to 10. A high score describes a leader with the
ability to enforce compliance due to the position he or she holds in the organization. A low

20
score describes a leader who, because of the particular position held, does not have
sanctions available to enforce compliance. For the sample of leaders in the wood products
processing organization, a self-report Position Power (see Appendix E) was collected as
well as an organizational report (see Appendix G). To reflect a self-report form, the
questionnaire published in the Leader Match book was adopted by changing the wording of
the items slightly (i.e., "the leader" has been replaced with "you"). Two managers from
the Personnel department who are familiar with the leaders' work roles completed the
Position Power scales for the leaders in this sample. Thus, self-reports and nonself-reports
of Position Power ratings could be compared in this sample.
The adapted LBDQ, re-labeled here as "My Behavior with Subordinates" (see
Appendix F) was completed by the leader. The questions were sightly reworded so as to
ask directly about the leader's own behavior. Leaders were asked to report the frequency
with which they use the behavior in question. Response choices include: Always; Often;
Occasionally; Seldom; Never; and are scored five to one, respectively. Some items are
reverse coded because they measure behavior in the the opposite direction (i.e., behavior
that is inconsiderate). Items that must be reverse coded are: 17, 26, 29.

RESULTS
The leaders' behavior in the two organizations were measured by two different
forms of the LBDQ with some different items and therefore the leaders' behavior scores
were standardized. Table II gives the descriptive statistics for all the other measures for the
two samples combined. The mean for Situational Control is in the high range of control.
As a whole, the leaders reported having good Leader-Member Relations and high Position
Power. The mean for LPC is typical, and the sample is representative of the population in
terms of the number of relationship-oriented leader and task-oriented leaders. Of the 157
leaders from the original sample, 56 were high LPC leaders, 73 were low LPC leaders, and
28 were middle LPC leaders. The leaders falling in the middle LPC category were
excluded from the analyses, leaving a total sample of 129 (see Kennedy, 1982 for a
discussion on this third category of leadership style).
Variable
LPC
Situational Control
TABLE II
DESCRIPTIVE STATISTICS
N Mean
129 65.31
129 52.88
Leader Member Relations 129 33.02
Task Structure 129 12.01
Position Power 129 7.84
Std. Dev.
25.41
5.19
3.27
3.34
1.32

22
In the manufacturing sample, two reports of Position Power were collected. One
measure was a self-report, the second measure reflected the organization's perception of the
leaders' position power. Fiedler proposes that the Position Power be completed by
someone other than the leader. In Improving Leadership Effectiveness: The Leader Match
Concept (Fiedler & Chemers, 1984), Fiedler assumes the individual will self-report the
measure, but the scale remains in a form not suitable for self-report. To clarify that the
measure collected in either fashion is acceptable, both were collected for the sample of
eighteen leaders at the wood products processing plant. A test for difference between
variances of two related samples (test of homogeneity of related variances) on the self
report and organizational report was not significant with t = 1.11, p >.05. Because the
variances are not significantly different a paired t-test was performed. The paired t-test
using the difference score between the self-report and organizational report resulted in a t =
2.15, p < .05, with a mean difference score of .5. Which means the difference score is
significantly different from zero. Therefore, the two reports are significantly different with
the leaders reporting higher position power than the organization. The correlation between
the self-report and the organizational report was r=.79, p < .0001, showing that there is a
linear relationship between the reports.
Table III contains the correlation coefficients among the variables used in the
analysis. It is important to note that the LPC score and Situational Control score (SC) are
not correlated, leadership style is not related to the leader's degree of control and influence
in a situation. LPC score is also not correlated with the dependent measures. The
correlation between the two dependent variables, r=.31, is significant at the p< .001 level.
The relationships between these variables change when high and low LPC leaders are
separated. The correlations between the two dependent variables is not significant for high
LPC leaders, r=.25, but remains significant for low LPC leaders, r=.39, p<.001. These
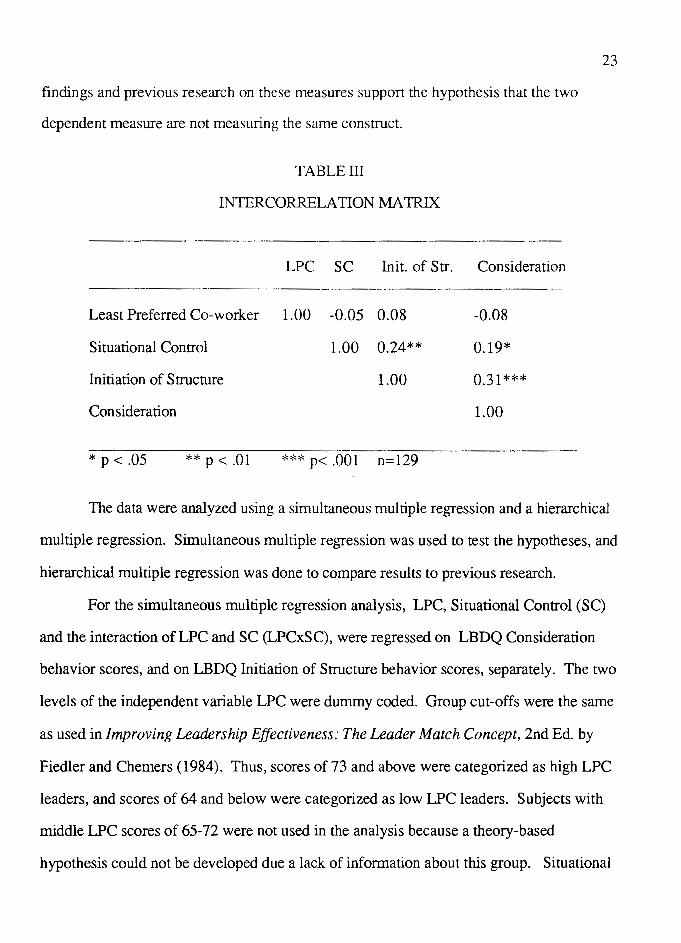
findings and previous research on these measures support the hypothesis that the two
dependent measure are not measuring the same construct.
TABLE III
INTERCORRELA TION MA TRIX
LPC SC Init. of Str.
Least Preferred Co-worker 1.00 -0.05 0.08
Situational Control 1.00 0.24**
Initiation of Structure 1.00
Consideration
* p <.OS ** p < .01 *** p< .001 n=129
Consideration
-0.08
0.19*
0.31 ***
1.00
23
The data were analyzed using a simultaneous multiple regression and a hierarchical
multiple regression. Simultaneous multiple regression was used to test the hypotheses, and
hierarchical multiple regression was done to compare results to previous research.
For the simultaneous multiple regression analysis, LPC, Situational Control (SC)
and the interaction ofLPC and SC (LPCxSC), were regressed on LBDQ Consideration
behavior scores, and on LBDQ Initiation of Structure behavior scores, separately. The two
levels of the independent variable LPC were dummy coded. Group cut-offs were the same
as used in Improving Leadership Effectiveness: The Leader Match Concept, 2nd Ed. by
Fiedler and Chemers (1984). Thus, scores of 73 and above were categorized as high LPC
leaders, and scores of 64 and below were categorized as low LPC leaders. Subjects with
middle LPC scores of 65-72 were not used in the analysis because a theory-based
hypothesis could not be developed due a lack of information about this group. Situational

Control (SC), the second independent variable, was analyzed as a continuous variable.
The scores ranged from 41-64, with the mean at 52.7.
24
The simultaneous multiple regression with Consideration behaviors resulted in a R
squared of 0.105, F value = 4.90 (3, 125) p < .003. The weights for LPC, SC, and the
interaction were all significant and are shown in Table IV.
TABLE IV
WEIGHTS FOR MULTIPLE REGRESSION ON CON SID ERA TION
Variable Estimate t-test p>ITI
LPC
SC
LPC *SC
5.019
0.077
-0.098
2.86
3.59
-2.97
.005
.001
.004
The shrunken R-squared is .084. Due to the significant interaction, separate regression
equations are need for each level of the coded independent variable. The separate
regression equations are:
Low LPC Consideration (Y') = -3.956 + 0.077 (Situational Control)
High LPC Consideration (Y') = 1.063 - 0.021 (Situational Control)
Figure 3 shows the interaction between LPC and SC. High LPC leaders engage in more
consideration behaviors than low LPC leaders in moderate control situations. Low LPC
leaders engage in more consideration behaviors than high LPC leaders in high control
situations. The significant positive slope in the equation for low LPC leaders (p < .001)
means low LPC leaders engage in more consideration behavior as the level of situational
control increases. The slope for high LPC leaders is not significant (p > .10), therefore the

25
consideration behavior does not change significantly for high LPC leaders across
moderate and high control situations. It should be noted, however, that the slope is
negative and the inclusion of leaders in low control situations (which are not represented in
the sample), might result in a significant change. The result for low and high LPC leaders
supports Hypothesis 2: Low LPC leaders in high control situations engage in more
consideration behaviors than low LPC leaders in low control situations. High LPC
leaders' consideration behaviors remain consistent across situational control (see Figure 2).
1.0
0.8
0.6
0.4
CONSIDERATION 0.2 BEHAVIOR
0
-0.
-0.
-1.
145
Low LPC
HighLPC
1so 1ss 160
165
SITUATIONAL CONTROL
Figure 3. Regression lines for high and low LPC leaders for consideration behavior across situational control.

26
The simultaneous multiple regression with Initiation of Structure behaviors resulted
in an R-squared of 0.087, F value= 3.98 (3, 125) p < .01. However, none of the
individual factors were significant. In order to investigate the individual main effects and
interaction, the procedure outlined in Pedhazur (1982) was followed. First, the interaction
was tested and was found not to be significant with F value= 2.27 (1, 154) p >.05. Since
the interaction was not significant it was dropped from the model. Next the main effect of
LPC was examined and found to be not significant with an F value= 2.73 (1, 126) p >.05.
Therefore it was also dropped from the model. The main effect of Situational Control was
then tested and it was significant with an R-squared of 0.06, F value = 8.28 (1, 126) p <
.01. The shrunken R-squared is 0.05. The final regression equation is: Initiation of
Structure (Y')= -2.404 + .046 (Situational Control). As shown in Figure 4, leaders in high
control situations engage in more initiation of structure behavior than leaders in moderate
control situations, regardless of their leadership style. This result does not support the
hypothesis 1: High LPC leaders in high control situations engage in more task- oriented
behaviors than high LPC leaders in low control situations. Low LPC leaders' task-oriented
behaviors will remain consistent across situational control (see Figure 2 ).

INITIATION OF STRUCTURE
0.6
0.4
0.2
0
-0.2
-0.4
-0.6
'.:L / 1
45 1so 1ss 1
60 165
SITUATIONAL CONTROL
Figure 4. Regression line for high and low LPC leaders for initiation of structure behavior across situational control.
27
The results from the hierarchical multiple regression for Consideration are reported
in Table 5. Each independent variable was added to the model one at a time. The change in
the increment of variance accounted for due to the addition of the variable is reported in
Table 5. LPC was placed in the model first because leadership style is considered a given
that can not be manipulated, and because the LPC is often discussed as the main factor
contributing to leader beha".ior. SC was added second into the model because this variable
is continually changing in natural settings and can be manipulated by the leader. The
interaction term was the last variable entered into the model. The F ratio for the LPC
shows it does not account for a significant proportion of variance in the dependent variable.
SC contributes significantly to prediction, above and beyond LPC. The interaction term
also accounts for a significant proportion of variance above and beyond the variance
accounted for by LPC and SC. This means that leadership style alone does not predict

consideration behavior, but it is the interaction of leadership style and the situation that
determines consideration behavior.
Variable
LPC
SC
LPC *SC
* p <.05
TABLEV
CHANGES IN INCREMENTS OF VARIANCE ACCOUNTED FOR IN PREDICTING CON SID ERA TION
Change in R-squared
.008
.034
.063
**p < .01
Fratio
1.04
4.47*
8.81 **
df
1, 127
1, 126
1, 125
The results from the hierarchical multiple regression for Initiation of Structure are
reported in Table VI. Variables were placed in the model in the same order as in the
regression for Consideration; LPC first, SC second, and the interaction last. Again LPC
does not contribute significantly in accounting for variance in Initiation of Structure. SC
28
accounts for a significant amount of variance above and beyond LPC. The interaction does
not contribute significantly to the model above and beyond the variance accounted for LPC
and SC. This means that the situation alone is the main determinant of the frequency in
which leaders engage in initiation of structure behavior.

Variable
LPC
SC
LPC *SC
**p < .01
TABLE VI
CHANGES IN INCREMENTS OF VARIAN CE ACCOUNTED FOR IN PREDICTING INITIATION OF STRUCTURE
Change in R-squared
.017
.060
.010
F ratio
2.15
8.57**
1.43
df
1, 127
1, 126
1, 125
29

DISCUSSION
This study is the first complete field test of the Contingency Model of Leadership
Effectiveness within a single sample using the latest instrumentation available (Situational
Control, as a continuous variable, and the 18 item LPC) and the most appropriate method
of data analysis (multiple regression). The results of this study supplements previous
research (Green, Nebeker & Boni, 1976; Michaelsen, 1973) supportive of the motivational
hierarchy interpretation for LPC. The study addresses criticisms about the construct
validity of the Least Preferred Co-worker scale (LPC), the motivational hierarchy
interpretation of the LPC, and the Contingency Model of Leadership Effectiveness, as well
as suggests several recommendations for further research.
Hypothesis 1 states in part that high LPC leaders in high control situations engage
in more initiation of structure behaviors than high LPC leaders in low control situations.
This was supported with the main effect of situational control. The hypothesis also
predicts a significant interaction and a nonsignificant slope for Low LPC leaders. This was
not supported in the results. To increase the power of the test for the simple main effect of
LPC, the sample would need to have leaders in low control situations. It is the High LPC
leaders in low control situations engaging in primarily consideration behaviors, and very
little initiation of structure behaviors, that makes a the strong contrast to Low LPC leaders.
Hypothesis 2 (low LPC leaders in high control situations engage in more
consideration behaviors than low LPC leaders in low control situations) was supported
with a significant interaction effect. The hypothesized interaction was ordinal, but the
analysis resulted in a disordinal interaction. High LPC leaders were hypothesized to
engage in more consideration behavior than low LPC leaders across situational control.

31
Instead, low LPC leaders in high control situations were engaging in more consideration
behaviors that high LPC leaders in high control situations. As expected, the separate
regression equation for low LPC leaders has a significant positive slope and the slope of
the regression equation for high LPC leaders is not significant as hypothesized. Though
the high LPC slope was not significant, the slope is negative as predicted by Fiedler
(1978). This finding is in direct support of the motivational hierarchy interpretation of the
LPC.
Fiedler's theory predicts: Low LPC leaders are more effective in high control and
low control situations (octants; 1, 2, 3, and 8) ; high LPC leaders are more effective in
moderate control situations (octants 4, 5, 6, and 7). According to the motivational
hierarchy interpretation of the LPC and the contingency theory: . Low LPC leaders are
effective when they (1) engage primarily in initiation of structure behaviors while engaging
in very little consideration behaviors (low control situations) and (2) when they engage in
initiation of structure behaviors and a great deal of consideration behaviors simultaneously
(high control situations). High LPC leaders, on the other hand, are effective when they
engage in consideration behaviors and moderate amounts of initiation of structure behaviors
simultaneously (moderate situational control). One could conclude that when high and low
LPC leaders' behavior is balanced between consideration behaviors and initiation of
structure behaviors, their workgroups respond by being highly effective. Because there are
no leaders in low control situations in the present sample, leaders' behavior can not be
related to effectiveness as hypothesized by the theory and demonstrated in previous
research. The data does support that in high control situations (SC range is 51-70) low
LPC leaders engage in a great deal of initiation of structure behaviors and consideration
behaviors. There is also support that in moderate control situations (SC range is 31-50)
high LPC leaders engage in more initiation of structure, which may account for their
increase in effectiveness.

32
The hierarchical regression analysis was done to compare results with other
researchers. Kennedy (1982) reports conducting a hierarchical regression procedure, but
he does not report the changes in R-squared. He does report the results of an analysis of
variance technique were he finds a significant main effect of LPC, SC, and their interaction
in predicting performance. Rice (1978) summarized previous research reports of main
effects of LPC with leader behavior and found contradictory conclusions. The majority of
studies find an significant main effect with low LPC leaders engaging in task oriented
behaviors and high LPC leaders engaging in relationship oriented behaviors. A few cases
reported a significant main effect for LPC with low LPC leaders engaging is relationship
oriented behaviors and high LPC leaders engaging in task oriented behaviors. Many
studies also reported a significant interaction between LPC and situational factors (not
necessarily SC). Due to the "substantial number of significant main effects for leader
behavior" (ignoring the reversals, numerous non-significant results, a numerous significant
interactions), Rice claims the the idea of a motivational hierarchy can not be supported
because "Such results, showing consistent differences in the behavior of high and low LPC
leaders across a wide rage of situations (p. 1220)". The present study shows that for
consideration behavior it is the interaction between LPC and SC, and the main effect of SC
that accounts for a significant amount of variance in behavior. The results of this study
supports Fielder's motivational hierarchy interpretation of the LPC (which focuses on
interaction) over Rice's value-attitude interpretation (which focuses on main effects of
LPC).
The study has limitations that may have contributed to the lack of significants of one
hypothesis, yet does not invalidate the hypothesis that was supported. As Hogan and
Nicholson (1988) point out there are four basic explanations to consider if a hypothesis on
construct validity is not confirmed

... (a) The initial hypothesis was wrong; (b) the hypothesis was right, but the research sample was inappropriate; (c) the measure of [the construct] does not reflect the [construct] in question ... (d) the index of [the dependent variable] does not reflect performance in the domain of interest ... (p. 622).
One or more of the last three explanations may account for the lack of a significant
interaction for Hypothesis 1.
The first possible problem is due to the restricted range of the Situational Control
33
variable (i.e. inappropriate research sample). Fiedler categorizes the variable at three levels:
High control is 70-51, moderate control is 50-31 and low control is 30-10. The sample
only represented the high control category and the upper portion of the moderate control
category, leaving the lower half of the situational control continuum unaccounted for in the
analysis. Therefore, significant changes as the variable increases in extremes is not
assessed, only the changes from the middle of the moderate range to the high range. This
is the opposite problem that Green, Nebeker, and Boni (1976) had with their sample of
male undergraduates. Their subjects were all placed in unfavorable situations and
therefore, were unable to test the motivational hierarchy. Due to their finding that leaders
are motivated to attend to their primary goal in unfavorable situations (referred to here as
low Situational Control), one would expect that if the present sample contained leaders in
low Control Situations that the motivational hierarchy would have been supported in its
entirety.
The measure of the construct, the LPC, may not reflect the motivational hierarchy in
the way Fiedler describes. Rice and Seaman (1981) did a factor analysis on a 22-item
version of the LPC and found two factors. One factor was labeled Task LPC, and the
other Social LPC. In Fiedler's last version of the LPC, 18 items, the items loading on the
social factor were removed and new items have been added. Fiedler's attempted to include
only items that would load on the task factor. Since this change was made, a new factor
analysis of the LPC has not been done, therefore, it is reasonable to doubt whether the new
items will load on the task factor as intended. Research should continue on the LPC but
due to the low proportion of variance accounted for, another measure of motivational
hierarchy may need to be developed.
34
The adapted LBDQ reflects self-perceived behaviors, verses actual behaviors
(which can only be measured through observation) and subordinate perception of
behaviors, this may be problematic when attempting to interpreting the behavior. A
decrease in self reported frequency of behavior may reflect ( 1) the actual behavior
frequency, or (2) their awareness of the behavior, how salient the behavior is to them
under the present circumstances. For example, a slight decrease in consideration behavior
of the high LPC leaders in high control situations can be interpreted as a letting go of the
primary motivator (an actual decrease) or that the initiation of structure behavior is so
salient to them under the circumstances they are less aware of their consideration behavior,
which is actually constant.
Though the support is not conclusive, the motivational hierarchy as an interpretation
of the LPC is still viable and should be explored further. Future studies should continue to
be done in the field with real leaders, not students put in experimentally manipulated
"workgroups". Researchers must take special care in selecting a sample that will reflect the
entire range of situational control, so that a complete test of the motivational hierarchy can
be achieved with one sample. Future researchers should also use simultaneous multiple
regression with Situational Control as a continuous variable for data analysis, since it is the
most appropriate method of data analysis. To ensure that all items on the LPC are loading
on a task factor, a exploratory factor analysis on the 18 item version of the LPC needs to be
done with at least 180 LPC scales. It is important that the leaders are describing their least
preferred co-worker in terms of their ability to perform the task, and not social factors.
This study found that leaders' self-report of position power was higher than the
organization's reports of the leaders' position power. This finding maybe a function of the
specific organization and should not be generalized to other samples. When collecting

35
position power, researchers should keep in mind the possible difference in self-report of
position power and the organization's report of position power. Researchers must consider
what perspective is most relevant to their research question. To look at the phenomenon in
greater detail, position power ratings should be obtained from the leader, the organization,
and the leader's subordinates. The perspective of the subordinates might answer the
question of which report is most accurate. For example, if the subordinates rate their
leader's position power like the organization, the research might conclude that the
organization's report is more reflective of the leader's position power. On the other hand,
if the subordinates rate the leader's position power like the leader, the researcher might
conclude the leader's representation is most reflective of the position power held by the
leader in the workgroup.
A new area of exploration that would contribution significantly to the theory is the
motivational hierarchy of the middle LPC leaders (also referred to socio-independent). An
exploratory analysis on the middle LPC would require a significantly larger sample size
(approximately 300 subjects) since in the sample of 157, only 28 fell in the middle LPC
range; which is approximately what would be expected from a normal sample.
Given the limitations of the study few direct applications to the selection,
placement, and training of leaders can be made. However, numerous direct applications
could be made if the motivational hierarchy hypothesis is confirmed in its entirety. For
example, Fiedler's Leader Match training program could be revised. The training program
currently focuses on manipulating the situation to suit the leader's style. In addition,
behavioral aspect of leadership could be addressed in terms of how leaders' behavior
changes in response to their situation and their primary and secondary goals. Leaders
would gain awareness of why their behavior changes, when their behavior is likely to
change, and what effect their behavior has on the group effectiveness. For selection and

36
placement, organizations could match supervisors and managers to workgroups that share
their primary goal and to positions that are more suited to a particular primary goal.

REFERENCES
Bass, B.M. (1981). Stogdill's Handbook of Leadership. New York: The Free Press.
Bass, B. M. & Dunteman, G. (1963). Behavior in groups as a function of self, interaction, and task orientation. Journal of Abnormal Social Psychology, 66, pp. 419-428.
Fiedler, F. E. (1978). The contingency model and the dynamics of the leadership process. In L. Berkowitz (Ed.) Advances in Experimental Social Psychology, 11, pp. 59-112. New York: Academic Press.
Fiedler, F. E. (1972). Personality, motivational system, and the behavior of high- and low-LPC persons. Human Relations, 25, pp. 391-412.
Fiedler, F. E. (1967). A Theory of Leadership Effectiveness. New York: McGraw Hill.
Fiedler, F. E. (1957). A note on leadership theory: the effect of social barriers between leaders and followers. Sociometry, 20, pp. 87-94.
Fiedler, F. E. (1953a). Quantitative studies in the role of therapists' feelings toward their patients. In 0. H. Mowrer (Ed.), Psychotherapy: theory and research. New York: Ronald Press.
Fiedler, F. E. (1953b). The psychological distance dimension in interpersonal relations. Journal of Personality, 22, pp. 142-150.
Fiedler, F. E., & Chemers, M. M. (1984). Improving Leadership Effectiveness: The Leader Match Concept, 2nd ED. New York: Wiley.
Fiedler, F. E., Chemers, M. M. & Mahar L. (1976). Improving leadership effectiveness: The Leader Match concept. New York: Wiley.
Fleishman, E. A. (1957a). A leader behavior description for industry. In R. M. Stogill & A. E. Coons (Eds.), Leadership behavior: Its description and measurement. Columbus,OH: The Bureau of Business Research, The Ohio State University.
Fleishman, E. A. (1957b). The leadership opinion questionnaire. In R. M. Stogill & A. E. Coons (Eds.), Leadership behavior: its description and measurement. Columbus, OH: The Bureau of Business Research, The Ohio State University.
Fleishman, E. A. & Harris, E. F. (1962). Patterns of leadership behavior related to employee grievances and turnover. Personnel Psychology, 15, pp. 43-56.

('
38
Foa, U. G., Mitchell, T. R., & Fiedler, F. E. (1971). Differentiation matching. Behavioral Science, 16, pp. 130-142.
Green, F. G., Nebeker, D. M., & Boni, M.A. (1976). Personality and situational effects on leader behavior. Academy of Management Journal, 19, pp. 184-194.
Hill, W. A. (1969). The LPC leader: A cognitive twist. 29th Annual Meeting Academy of Management Proceedings, pp. 125-130.
· Hogan, R. & Nicholson, R. A. (1988). The meaning of personality test scores. American Psychologist, August, pp. 621-626.
Kennedy, J. K. (1982). Middle LPC leaders and the Contingency Model of Leadership Effectiveness. Organizational Behavior and Human Performance, 30, pp. 1-14.
Maslow, A.H. (1954). Motivation and Personality. Chicago: Harper.
Michaelsen, L. K. (1973). Leader orientation, leader behavior, group effectiveness and situational favorability: An empirical extension of the contingency model. Organizational Behavior and Human Performance, 9, pp. 226-245.
Mitchell, T. R. (1970). The construct validity of three dimensions of leadership research. The Journal of Social Psychology, 80, pp. 89-94.
Nebeker, D. M. (1975). Situational favorability and environmental uncertainty: an integrative study. Administrative Science Quarterly, 20, pp. 281-294.
Nebeker, D. M. & Mitchell (1974). Leader behavior: An expectancy theory approach. Organizational Behavior and Human Performance, 11, pp. 355-367.
Pedhazur, E. J. (1982). Multiple Regression in Behavioral Research: Explanation and Prediction. 2nd Edition. New York: Holt, Rinehart and Winston.
'1' Rice, R. W. (1978). Construct validity of the least preferred co-worker score. '·- Psychological Bulletin, 85, 6, pp. 1199-1237.
Rice, R. W. (1981). Internal analyses of the least preferred co-worker (LPC) scale. Educational and Psychological Measurement, 41, pp. 109-120.
Strube, M. J. & Garcia, J.E. (1981) A meta-analytic investigation of Fiedler's Contingency Model of Leadership Effectiveness. Psychological Bulletin, 90, pp. 307-321.

V XICIN3:ddV

LEAST PREFERRED COWORKER SCALE
INSTRUCTIONS
Throughout your life you have worked in many groups with a wide variety of different people - on your job, in social clubs, in church organizations, in volunteer groups, on athletic teams, and in many others. You probably found working with most of your coworkers quite easy, but working with others may have been very difficult or all but impossible.
Now, think of all the people with whom you have ever worked. Next, think of the one person in your life with whom you could work least well. This individual may or may not be the person you also disliked most. It must be the one person with whom you had the most difficulty getting a job done, the one single individual with whom you would least want to work- a boss, a subordinate or a peer. This person is called your "Least Preferred Coworker" (LPC).
On the scale below, describe this person by placing an "X" in the appropriate space. The scale consists of pairs of words that are opposite in meaning, such as Very Neat and Very Untidy. Between each pair of words are eight spaces that form the following scale:
Very Neat Very Untidy 8 7 6 5 4 3 2
Think of those eight spaces as steps ranging from one extreme to the other. Thus, if you ordinarily think that this least preferred coworker is quite neat, you would write an "X" in the space marked 7, like this:
Very Neat 8 Very Neat
x 7 Quite Neat
Very Untidy 6 5 4 3 2 1 Some- Slight- Slight- Some- Quite Very what ly ly what Untidy Untidy Neat Neat Untidy Untidy
However, if you ordinarily think of this person as being only slightly neat, you would put your "X" in space 5. If you think of this person as being very untidy (not neat), you would put your "X" in space 1.
Sometimes the scale will run in the other direction, as shown below:
Frustrating Helpful 1 2 3 4 5 6 7 8
Before your mark your "X", look at the words at both ends of the line. There are no right or wrong answers. Work rapidly; your first answer is likely to be the best. Do not omit any items, and mark each item only once. Think of a real person in your experience, not an imaginary character. Remember, it is not necessarily the person whom you liked least, but the person with whom it is (or was) most difficult to work.
40

trIV:JS ~EDIBOM-Q;) amnitltltrnd .LSVffl
H XIGNtlddV

42
Pleasant -- Unpleasant 8 7 6 s 4 3 2
Friendly -- -- -- -- Unfriendly 8 7 6 s 4 3 2
Rejecting -- -- Accepting 2 3 4 s 6 7 8
Tense Relaxed --2 3 4 5 6 7 8
Distant Close --2 3 4 5 6 7 8
Cold -- -- Wann 2 3 4 5 6 7 8
Supportive -- -- Hostile 8 7 6 5 4 3 2
Boring -- -- -- -- Interesting 2 3 4 5 6 7 8
Quarrelsome -- Harmonious 2 3 4 5 6 7 8
Gloomy -- -- -- -- Cheenul 1 2 3 4 5 6 7 8
Open -- -- -- Guarded 8 7 6 5 4 3 2
Backbiting -- -- Loyal 1 2 3 4 5 6 7 8
Untrust- Trustworthy worthy 1 2 3 4 5 6 7 8
Considerate -- Inconsiderate 8 7 6 5 4 3 2 1
Nasty -- Nice 2 3 4 5 6 7 8
Agreeable Disagreeable 8 7 6 5 4 3 2 1
Insincere Sincere 1 2 3 4 5 6 7 8
Kind Unkind --8 7 6 5 4 3 2 1

3:'1VJS SNOlL V'1ffil }:Imrwaw-}:13:CI\fITT
J XIGN3:dclV
44
LEADER-?vfE.MBER RELATIONS SCALE
Directions: Circle the number which best represents your response to each item.
i:::i
~ i:::i CJ i:::i i:::i .:x: 0:: i:::i i:::i UJ CJ 0:: i:::i ....... < CJ 0:: Cl
< CJ >o < i:::i >o ...:l 0:: UJ µJ ...:l c.:i i:::i ....... 0:: CJ z µJ ~ Cl CJ z 0 ~ < 0 0:: ..... 0:: UJ 0:: E-; CJ i:::i 0 ....... E-; UJ < z z Cl UJ
1. The people I supervise have trouble 1 2 3 4 5 getting along with each other.
2. My subordinates are reliable and 5 4 3 2 1 trustworthy.
3. There seems to be a friendly attnosphere 5 4 3 2 1 among the people I supervise.
4. My subordinates always cooperate with 5 4 3 2 1 me in getting the job done.
5. There is friction between my 1 2 3 4 5 subordinates and myself.
6. My subordinates give me a good deal of 5 4 3 2 1 help and suppon in getting the job done.
7. The people I supervise work well together 5 4 3 2 1 in getting the job done.
8. I have good relations with the people 5 4 3 2 1 I supervise.

'.'.I'lV:JS ONI.l~ ffi:Ifll:Jfnus )JSV.L
a XIGN3:ddV

46
TASK STRUCTURE RATING SCALE
Directions: Circle the number in the appropriate column.
Usually Sometimes Seldom Trne In1s:; ~
Is the goal clearly stated or known? 1. Is there a blueprint, picture, model or 2 1 0
detailed description available of the finished product or service, or how the job should be done?
2. Is there a person available to advise and 2 1 0 give a description of the finished product or service, or how the job should be done?
Is there only one way to accomplish the task? 3. Is there a step-by-step procedure, or a 2 1 0
standard operating procedure which indicates in detail the process which is to be followed?
4. Is there a specific way to subdivide the task 2 1 0 into separate parts or steps?
5. Are there some ways which are clearly 2 1 0 recognized as better than others for performing this task?
Is there only one correct answer or solution? 6. Is it obvious when the task is finished 2 1 0
and the correct solution has been found? 7. Is there a generally agreed upon under- 2 1 0
standing about the standards the particular product or service has to meet to be considered acceptable?
Is it easy to check whether the job was done right: 8. Is there a generally agreed upon under- 2 1 0
standing about the standards the particular product or service has to meet to be considered acceptable?
9. Is the evaluation of this task generally made 2 1 0 on some quantitative basis?
10. Can the leader and the group find out how 2 1 0 well the task has been accomplished in enough time to improve future performance?

l"M0dffil-d'T3:S
tllV:JS DNil V(J "MtIMOd NOilISOd
3 XIGN3ddV

POSITION POWER SELF-RA TING SCALE
Circle the number which best represents your answer.
1. Can you directly or by recommendation administer rewards and punishments to subordinates?
2
Can act directly or can recommend with high effectiveness
Can recommend with mixed results
0
No
2. Can you directly or by recommendation affect the promotion, demotion, hiring or firing of subordinates?
2
Can act directly or can recommend with high effectiveness
Can recommend with mixed results
0
No
3. Do you have the knowledge necessary to assign tasks to subordinates and instruct them in task completion?
2
Yes Sometimes or in some aspects
4. Is it your job to evaluate the performance of subordinates?
2
Yes
1
Sometimes or in some aspects
0
No
0
No
5. Have you been given some official title of authority by the organization (e.g., foreman, department head)?
2 0
Yes No
48

S:li VNimIOHflS HLIA\ (IQIA VH38 .t\W
cl XIGN3ddV

MY BEHAVIOR WITH SUBORDINATES
Directions
This questionnaire contains a number of statements about supervising others on the job.
For each statement choose the alternative which most nearly expresses how frequently you
use the behavior. Respond by circling the appropriate number indicating your use of the
behavior. Make a choice for every statement; do not skip any. Remember: You are ratio~
how you actually behave with your suborr!inates. not what you think is desirable or should
be done. Your responses will be confidential, and reponed in group form only (i.e.
averages).
How often do you engage in this behavior? >< ..:J ..:J < z 0
:::: ..... Ul 0:: 0 Ul z >< s: Cl < w <
..:J u ... :s w w u i:... z Ul 0 0 <
1. Let group members know what is expected 1 2 3 4 5 of them
2. Am friendly and approachable 1 2 3 4 5
3. Encourage overtime work 1 2 3 4 5
4. Encourage the use of uniform procedures 1 2 3 4 5
5. Do little things to make it pleasant to be 1 2 3 4 5 a member of the group
6. Stress being ahead of competing groups 1 2 3 4 5
7. Try out your ideas in the group 1 2 3 4 5
8. Put suggestions made by the group into 1 2 3 4 5 operation
9. Needle members for greater effort 1 2 3 4 5
10. Make your attitudes clear to the group 1 2 3 4 5
11. Treat all group members as your equal 1 2 3 4 5
50
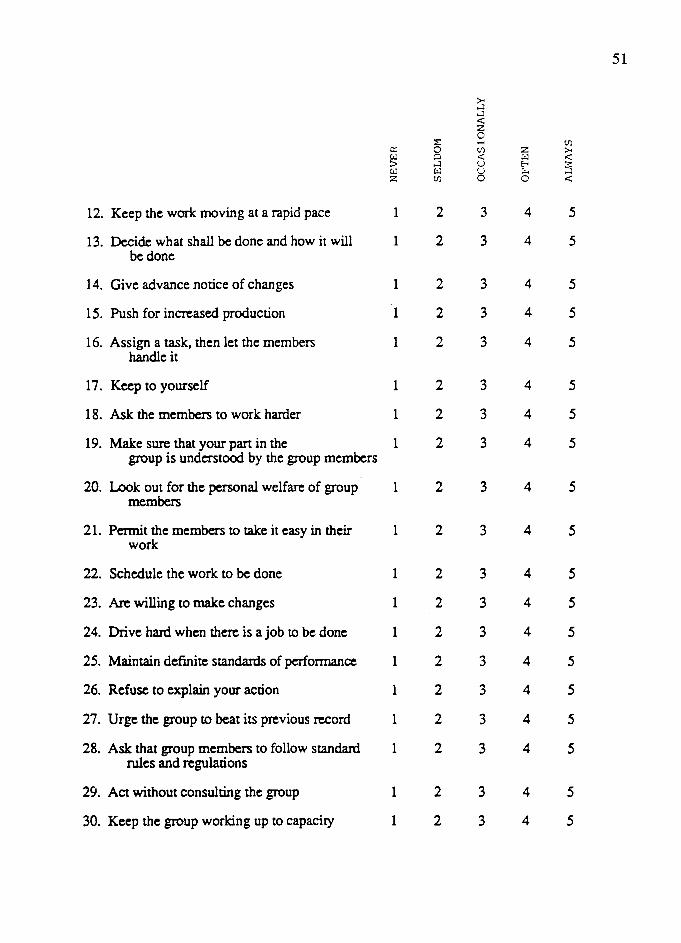
51
>< ....J ....J < z 0
::;: ..... Ul c:: 0 Ul z >< g; Cl < w .:::
....J u E-< 3: w w u ~ ....J z Ul 0 0 .:::
12. Keep the work moving at a rapid pace 1 2 3 4 5
13. Decide what shall be done and how it will 1 2 3 4 5 be done
14. Give advance notice of changes 1 2 3 4 5
15. Push for increased production 1 2 3 4 5
16. Assign a task, then let the members 1 2 3 4 5 handle it
17. Keep to yourself 1 2 3 4 5
18. Ask the members to work harder 1 2 3 4 5
19. Make sure that your part in the 1 2 3 4 5 group is understood by the group members
20. Look out for the personal welfare of group 1 2 3 4 5 members
21. Permit the members to take it easy in their 1 2 3 4 5 work
22. Schedule the work to be done 1 2 3 4 5
23. Are willing to make changes 1 2 3 4 5
24. Drive hard when there is a job to be done 1 2 3 4 5
25. Maintain definite standards of performance 1 2 3 4 5
26. Refuse to explain your action 1 2 3 4 5
27. Urge the group to beat its previous record 1 2 3 4 5
28. Ask that group members to follow standard 1 2 3 4 5 rules and regulations
29. Act without consulting the group 1 2 3 4 5
30. Keep the group working up to capacity 1 2 3 4 5

.UIOdffif 'lVNOI.L VZINVD"MO
:~r:IV:JS DNI.L~ "MtIMOd NOI.LISOd
D XIGN3:ddV

POSITION POWER RA TING SCALE
Name~~~~~~~~~~~~~~-
Title or Position _________ _
Circle the number which best represents your answer.
1. Can the leader directly or by recommendation administer rewards and punishments to subordinates?
2
Can act directly or can recommend with high effectiveness
Can recommend with mixed results
0
No
2. Can the leader directly or by recommendation affect the promotion, demotion, hiring or firing of subordinates?
2
Can act directly or can recommend with high effectiveness
1
Can recommend with mixed results
0
No
3. Does the leader have the knowledge necessary to assign tasks to subordinates and instruct them in task completion?
2
Yes
1
Sometimes or in some aspects
4. Is it the leader's job to evaluate the performance of subordinates?
2
Yes
1
Sometimes or in some aspects
0
No
0
No
5. Has the leader been given some official title of authority by the organization (e.g., foreman, department head)?
2 0
Yes No
53