the leader in oilfield management · the leader in oilfield management technologies. ......
TRANSCRIPT

2012
May 2017
NASDAQ:PFIE
The Leader in Oilfield Management Technologies

NASDAQ:PFIE
Important Cautions Regarding Forward‐looking Statements
2
This presentation contains forward‐looking statements, as defined in the Private Securities Litigation Reform Act of 1995. All statements other than historical facts are forward‐looking statements, including without limitation, those regarding activities, events, financial results or developments that we intend, plan, expect, believe, project, forecast or anticipate will or may occur in the future. Examples of forward‐looking statements include, but are not limited to, statements we make regarding the potential size of the market for our products, impacts of future legislation and regulatory action, forecasts of future performance, financial condition and results of operations, plans to expand to other markets, development of new technologies, potential acquisitions and the possibility of up‐listing or cross‐listing our equity securities. These statements reflect our management’s current views with respect to future events, are not guarantees of future performance, and involve risks and uncertainties that are difficult to predict. Further, forward‐looking statements are based upon assumptions of future events that may not prove to be accurate. Such assumptions and assessments are made in light of our experience and perception of historical trends, current conditions and expected future results. These statements involve known and unknown risks, uncertainties, assumptions and other factors many of which are out of our control and difficult to forecast which may cause actual results to differ materially from those that may be described or implied herein. Such factors include but are not limited to: general economic conditions; competitive factors; political, economic, and regulatory changes affecting the oil and gas industry; commodity price changes (i.e. of oil and gas) that could affect sales strategies; changes in supplier pricing or transit costs; changes in exchange rates; changes in demand for combustion management products, and various other factors, both referenced and not referenced above, and other factors that are described in our filings with the Securities and Exchange Commission (the “Commission”), including our periodic reports on Forms 10‐K and 10‐Q. Should one or more of these risks or uncertainties materialize, or should underlying assumptions prove incorrect, actual results, performance or achievements may vary materially from those set forth in this presentation. You should not place undue reliance on any forward‐looking statements and are advised to carefully review and consider the various disclosures in our filings with the Commission. Except as required by law, we neither intend nor assume any obligation to revise or update these forward‐looking statements, which speak only as of their dates. We nonetheless reserve the right to make such updates from time to time by press release, periodic report or other method of public disclosure without the need for specific reference to this financial outlook. No such update shall be deemed to indicate that other statements not addressed by such update remain correct or create an obligation to provide any other updates.
Although we report our results using US GAAP, we have included in this presentation the non‐GAAP measures of EBITDA and EBITDA Margin because management believes these measures are commonly used by securities analysts, investors and others interested parties in the evaluation of financial performance. These non‐GAAP measures have limitations as analytical tools and you should not consider these non‐GAAP measures in isolation or as a substitute for analysis of our results as reported under GAAP. A reconciliation of non‐GAAP to GAAP results is included in this presentation, which has been posted online at http://www.profireenergy.com/.
Excluding the information from sources indicated, the content of this presentation is copyright 2016 Profire Energy, Inc. All Rights Reserved.

NASDAQ:PFIEWho is Profire?
3
Profire Energy is a leading oilfield‐technology company We specialize in delivering and
maintaining state‐of‐the‐art Burner Management Systems (BMS) that replace dangerous and more costly manual methods
Our Chemical Management System (CMS) can improve efficiency, safety, and industry compliance
Our systems make oil & gas production safer, more efficient, and more compliant with changing industry regulations
Profire Products Support Safe, Efficient and Compliant Oil & Gas Production
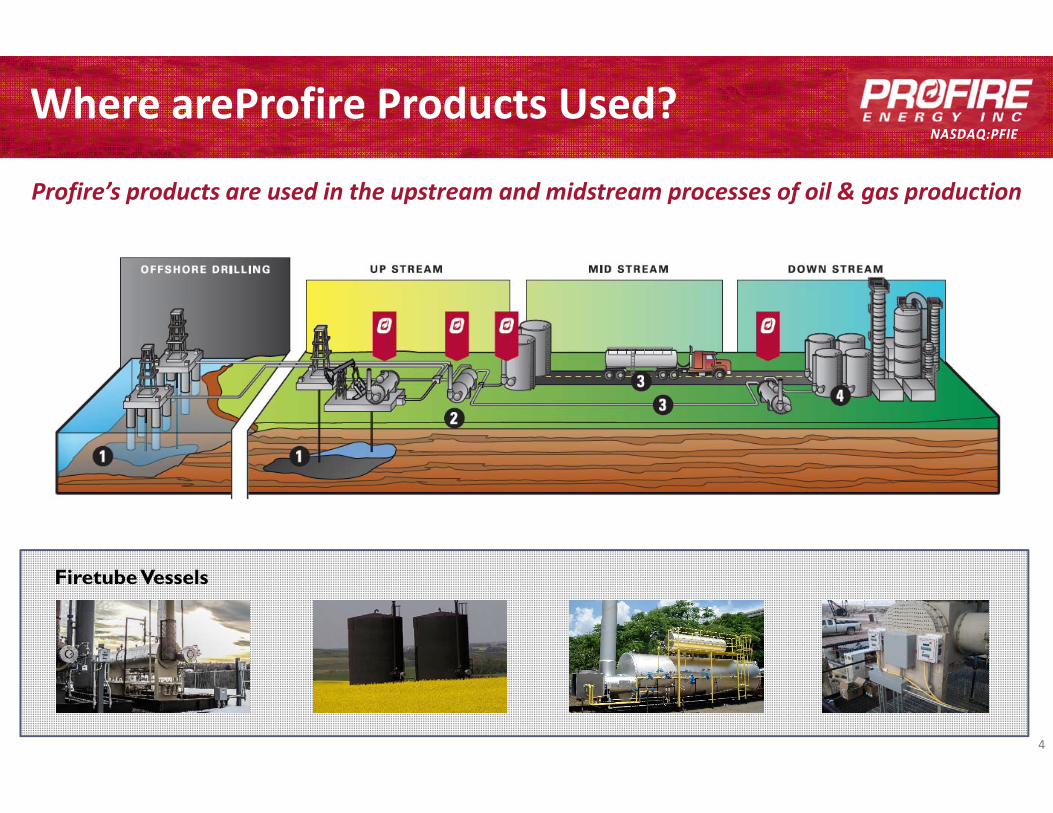
NASDAQ:PFIEWhere areProfire Products Used?
4
Firetube Vessels
Profire’s products are used in the upstream and midstream processes of oil & gas production

NASDAQ:PFIEKey Metrics: PFIE (NASDAQ CM)
3
(ttm) = trailing 12 months at March 31, 2017(mrq) = most recent quarter at March 31, 2017
Data Source: NASDAQ
1) Fully diluted shares outstanding at 3/31/2017.2) Institutional holdings per NASDAQ.3) See reconciliation of non‐GAAP measures to GAAP measures on the last slide of this presentation.
Stock Price (05/26/17) $1.48
Market Cap $74.3M
Shares Outstanding¹ ~50.2M
Public Float ~24.5M
Insider Holdings ~51.2%
Institutional Holdings2 ~19.7%
Enterprise Value $63.9M
EV/Revenue (ttm) 2.7x
Founded 2002
Employees ~85
Revenues (ttm) $23.8M
Net Income (ttm) $0.7M
EPS (ttm) $0.01
EBITDA3 (ttm) $1.8M
Net Cash from Ops (ttm) $2.8M
Cash & Equiv. (mrq) $10.5M
Total Assets (mrq) $44.5M
Total Debt (mrq) $0.0M
Total Liabilities (mrq) $2.6M
Revenue, Net Income & Cash
Changed fiscal year from March to December effective Dec 31, 2016
$millions
$millions

NASDAQ:PFIEContact Us
6
Ryan W. OviattCFO & Investor Relations(801) 796.5127 [email protected]
Visit www.ProfireEnergy.com for investor resources & updates

7
Appendix
NASDAQ:PFIE
About the Use of Non‐GAAP Financial Measure
8
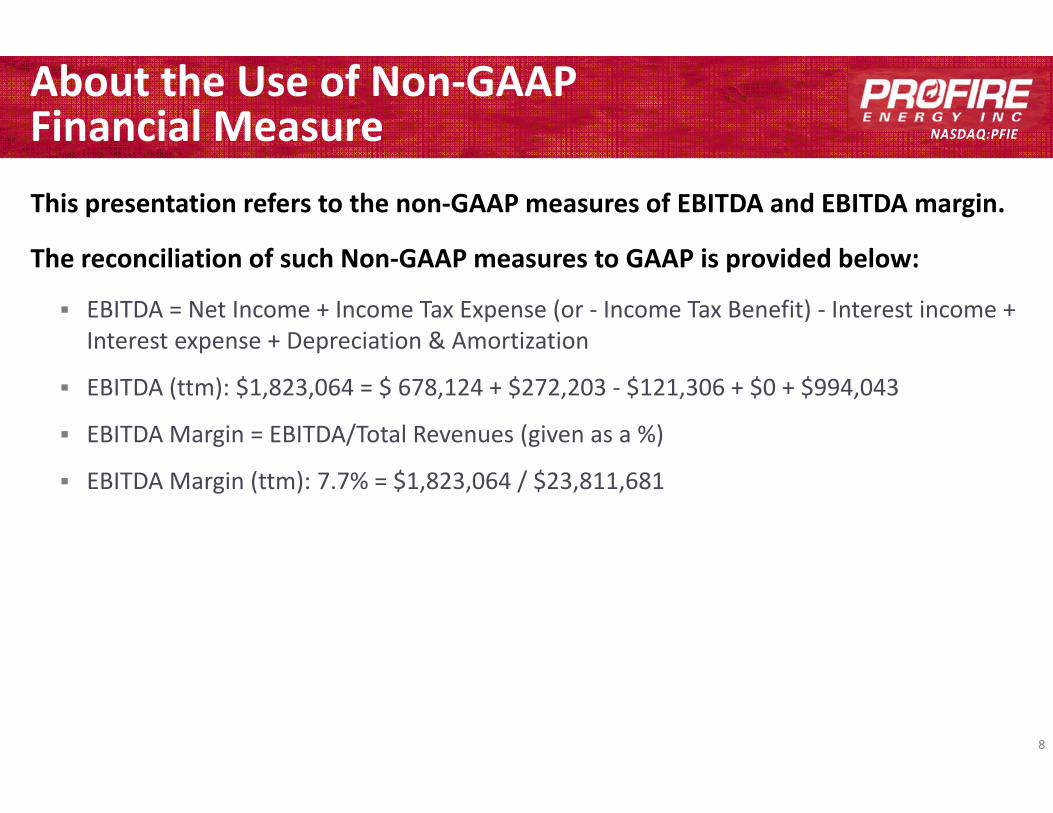
This presentation refers to the non‐GAAP measures of EBITDA and EBITDA margin.
The reconciliation of such Non‐GAAP measures to GAAP is provided below:
EBITDA = Net Income + Income Tax Expense (or ‐ Income Tax Benefit) ‐ Interest income + Interest expense + Depreciation & Amortization
EBITDA (ttm): $1,823,064 = $ 678,124 + $272,203 ‐ $121,306 + $0 + $994,043
EBITDA Margin = EBITDA/Total Revenues (given as a %)
EBITDA Margin (ttm): 7.7% = $1,823,064 / $23,811,681