the latin monetary union: some evidence on europe’s failed … bailey lmu-2003.07… · the latin...
TRANSCRIPT
The Latin Monetary Union: Some Evidence on Europe’s Failed Common Currency
Kee-Hong Bae and Warren Bailey *
Korea University and Cornell University
Current version: 7 July 2003
Abstract The Latin Monetary Union was initiated in 1865 by France, Belgium, Italy, and Switzerland. We find that LMU membership or adoption of a gold standard is frequently associated with lower volatility of private bill yields, bond yields, inflation, and deviations from Purchasing Power Parity. However, neither standard induces convergence with LMU leader France or gold standard leader Great Britain. Bond yield spreads indicate that adoption of the gold standard is more credible than membership of the LMU. Italy is an outlier, perhaps due to errant fiscal and monetary policies. A comparison to the modern EMS/EMU confirms that the LMU was a weaker and less credible currency arrangement. JEL Classifications: E5, F3, F4 Keywords: currency union, European Monetary Union, EMU, Latin Monetary Union * College of Business Administration, Korea University, 1, 5-Ka, Anam-dong Sungbuk-ku, Seoul, 136-701 Korea, 822-3290-1957, [email protected]; and Johnson Graduate School of Management, Cornell University, Sage Hall, Ithaca, NY 14853-6201, (607) 255-4627, [email protected]. We thank Jim Lothian for helpful suggestions. 2003 Kee-Hong Bae and Warren Bailey.
The Latin Monetary Union: Some Evidence on Europe’s Failed Common Currency
Abstract The Latin Monetary Union was initiated in 1865 by France, Belgium, Italy, and Switzerland. We find that LMU membership or adoption of a gold standard is frequently associated with lower volatility of private bill yields, bond yields, inflation, and deviations from Purchasing Power Parity. However, neither standard induces convergence with LMU leader France or gold standard leader Great Britain. Bond yield spreads indicate that adoption of the gold standard is more credible than membership of the LMU. Italy is an outlier, perhaps due to errant fiscal and monetary policies. A comparison to the modern EMS/EMU confirms that the LMU was a weaker and less credible currency arrangement.
1
1. Introduction
The implications of common currency areas, pegged currencies, and currency boards are
important to economists, policy makers, investors, and ordinary citizens. The European
Monetary System (EMS) and recent adoption of the euro rest on the idea that currency union will
further economic growth, temper volatility, and reduce transactions costs. Ongoing debates in
Denmark and the U.K. indicate concerns about the loss of economic sovereignty and the potential
transmission of unwanted foreign economic shocks if the euro is adopted. A peg to the U.S.
dollar has persisted for twenty years in Hong Kong, and recently the dollar has been adopted by
Ecuador and El Salvador. On the other hand, a dollar peg has been blamed for contributing to the
recent catastrophic collapse of the currency, banking system, and economic output in Argentina.
It is difficult to predict the impact of adopting a common or pegged currency. On the one
hand, a pegged regime can increase the volatility of domestic macroeconomic and financial
indicators (Frenkel and Mussa 1980). This is because foreign economic shocks can no longer be
absorbed by exchange rate fluctuations and, therefore, are transmitted directly to domestic prices,
interest rates, and economic growth. Heightened domestic volatility can be particularly
pronounced if the credibility of a common currency or peg is questionable (Flood and Hodrick
1986). On the other hand, some studies (Fratianni and von Hagen 1990, Artis and Taylor 1994)
find that the volatility of domestic prices, interest rates, money, and output is dampened after
adoption of the European Monetary System. This may result from more international trade and
investment, less exchange rate volatility, or adherence to the conditions for EMS entry. Other
empirical evidence finds that the volatility of domestic macroeconomic indicators (Baxter and
Stockman 1989, Flood and Rose 1995, Rose 1995) and stock market returns (Bodart and Reding
1999) does not depend on whether the exchange rate regime is fixed or flexible.
2
Successful adoption of a common currency or peg implies a degree of convergence
between economies that share the same currency. If a fixed exchange rate increases trade and
investment, economic conditions across member countries will tend to converge. At a minimum,
the lack of a flexible exchange rate to absorb shocks implies more commonalities across
economies that share a currency or monetary system. In cases like the EMS, macroeconomic
convergence on a number of dimensions is mandated. Furthermore, arbitrage should drive
interest rates and bond yields closer together. Thus, we can predict that correlation of economic
indicators across countries will increase when they share a common currency or other joint
monetary arrangement. Of course, the same issue of credibility that can induce heightened
volatility in a currency arrangement can also reduce cross-country correlations if credibility
differs across member states. There is some evidence from European securities markets that
declining volatility (Bodart and Reding 1999) and convergent risk premiums (Hardouvelis,
Malliaropulos, and Priestley 1999) are associated with EMS and the adoption of the euro.
The purpose of our study is to examine the financial and economic record of the Latin
Monetary Union, a 19th century attempt at forging a common monetary policy and virtually
common currency. We examine the volatility and correlation of interest rates, bond yields,
inflation, and trade across member and non-member states during the time when this agreement
was in force in one form or another. We use data from this era to develop fresh evidence on the
implications of adopting (or, in this case, attempting to adopt) a common currency policy. The
Latin Monetary Union is of particular interest because it originated in Western Europe and, thus,
is an historical predecessor of today’s common European monetary arrangements. Our results
indicate that the volatility of interest rates, bond yields, inflation, trade, and deviations from
Purchasing Power Parity are typically lower when a country joins or follows the LMU, though
3
this effect is more pronounced for countries adopting an alternative rigorous monetary system,
the gold standard. We also find no evidence that LMU membership increases the correlation of
interest rates, bond yields, and inflation with the key LMU member, France. It is also the case
that correlation with the key gold standard country, Great Britain, does not increase under a gold
standard. Furthermore, credibility (as measured with the spread of bond yields over the British
bond yield) under a gold standard is much more striking than with membership of the LMU.
Throughout our results, it is clear that Italy’s volatile economic conditions and policies
distinguish it from other countries, in spite of its membership of the LMU since its inception. In
contrast, some comparative results from the modern EMS/EMU era suggest that EMS/EMU
membership converges bond yields and inflation rates to those of Germany, perhaps most
prominently for Italy.
The balance of the paper is organized as follows. Section 2 provides a detailed
description and chronology of the development of the Union. Section 3 outlines our
methodology and data. Section 4 presents and discusses results. Section 5 presents some
comparable results on the modern European monetary system, and discusses the applicability of
our LMU era results to understanding modern currency systems. Section 6 is a summary and
conclusion.
2. The Latin Monetary Union
At the beginning of the nineteenth century, many countries found themselves with
bimetallic monetary systems under which both gold and silver coins could circulate.
Furthermore “free coinage” meant that anyone could bring metal to the mint to be coined into
standard gold or silver money. The weight, fineness, and denomination of coins defined a “mint
ratio” for the value of gold versus silver. If, for example, a silver one- franc coin contained 5
4
grams of silver and a gold twenty-franc coin contained 6 2/3 grams of gold, the implied mint
parity was 15 to 1.1 The system was intended to adjust naturally to changes in the relative market
value of the two metals. If, for example, silver became more valuable, silver coins would be
removed from circulation by arbitrageurs while additional gold would be brought to the mint for
coinage and circulation. As more silver was sold in the bullion market while more gold
disappeared into coin, the relative prices of the two metals would revert back towards the mint
ratio.
Real world events and frictions complicated the workings of such a system. Starting in
the late 1840s, large gold discoveries in California and Australia greatly increased the global
supply of gold and drove up the market price of silver relative to gold as is evident in Figure 1.
As a consequence, silver coins were often removed from circulation and melted, yielding a dearth
of small coins to facilitate commerce. Some countries responded by producing “subsidiary”
silver coins, that is, small silver coins whose metallic value was substantially less than the coin’s
face value. Such coins were less likely to be withdrawn for melting and, therefore, were
available to support commerce. However, these coins led to other problems. When, for example,
Switzerland reduced the purity of her small silver coins to 80% on 31 January 1860, arbitrageurs
used the new coins to purchase French and Belgian coins of higher purity and remove them from
circulation for melting. France consequently banned small Swiss silver from circulation on 14
April 1864 and reduced the fineness of her own small silver coins to 83.5% on 24 May 1864.
Italy’s neighbors suffered a flood of Italian minor silver coins when Italy reduced the fineness of
her small silver coins to 83.5% starting 24 August 1862. Larger, more pure silver coins also
caused problems between western European neighbors. When, for example, Belgium adopted
1 For example, the ratio was 16 for France and 15.5 for the U.S. during their respective bimetallic periods.
5
the silver standard in 1850 and began to produce new 5 franc silver coins, they were immediately
replaced by arbitrageurs who bought the new coins with worn old French 5 franc coins of
reduced weight, melted them, and pocketed the difference.
France, Belgium, Italy, and Switzerland agreed to form the Latin Monetary Union (LMU)
at the conclusion of a conference on 23 December 1865 and to take effect on 1 August 1866.
Recognizing the potential for lowered transactions costs and increased price transparency, the
treaty confirmed standard sizes for gold and silver coins of union members, guaranteed the
acceptability of each member’s coins in settling public and private payments in all member
states, and attempted to constrain the stock and flow of minor silver coins to a reasonable amount
based on each country’s population. However, Willis (1901) notes that the Union “had simply
provided for a uniform fineness and weight of the coins of the different countries, but had not
even prohibited issues of paper or…dictated the amount of coin which should be issued. The
limitation of the coinage of silver had been merely intended as a means of protecting the
members of the union from one another’s over-issues.”
Less than a few months after ratification of the treaty, Italy suspended the convertibility of
her banknotes into metal coins and put into circulation huge numbers of small denomination
banknotes. Italy’s small silver coins, in turn, flowed into France, Belgium, and other neighboring
economies. The Pontifical State, the only remaining holdout from newly unified Italy, expressed
an interest in joining the LMU but reversed course in 1868 due to limits on minting of minor
silver coins. On 17 February 1870, Pontifical minor coins were banned from circulation in
France, particularly as it was found that the coins claimed to be of 83.5% purity but were often
only 83.167%. The flow of such coins ceased when the Pope’s remaining territories were
incorporated into Italy on 20 September 1870. Greece’s admission to the LMU was associated
6
with a similar problem. To avoid a massive flood of small Greek coins, Greece agreed that all
coins would be produced at the Paris Mint and shipped directly to Greece. However, small Greek
silver coins were found circulating in Paris within weeks after the agreement was put in force.
All these cases were associated with fiscal deficits and rapid money supply growth in the over-
issuing countries.
Such problems persisted, and were aggravated by continuing falls in the price of silver
[Figure 1]. Some members acted to restrict the supply of silver coins by suspending the right of
“free coinage” of silver. In November 1878, a revised treaty banned the minting of new full
weight five-franc coins and imposed on Italy a timetable for redeeming her small silver coins and
small banknotes. Negotiations resulted in a less harsh deal for Italy but by 30 July 1879 “free
coinage” of silver was eliminated. Continuing problems with silver led France, in March 1884,
to demand full redemption of outstanding silver coins by their issuers, particularly if an issuing
country planned to leave the Union. Countries with large amounts of such silver coins
circulating in Europe switched tactics afterwards, with Italy and Belgium voicing support for a
pure gold standard in the hopes that they could negotiate favorable terms for the retirement of
their silver coins held in France, Switzerland, and other neighbors. A treaty revision in December
1885 specified terms for redemption. In the middle 1890s, Italy was still demanding concessions
on redemption and experiencing shortages of pocket change as her silver coins were exported to
her neighbors.
Table 1 summarizes the currency regimes in force during the period we study. As the
table indicates, it is often difficult to distinguish shifts in policy as many gradual changes were
experienced. In particular, there was often a gradual movement towards a gold standard
(stopping the free coinage of large silver coins, stopping all production of such coins, removing
7
them from circulation, de facto or de jure acceptance of foreign gold coins into circulation),
rather than a clear-cut change in standard. We can, however, characterize several time periods of
the Union’s history. From its inception in 1865 through about 1873, the Union may be thought of
as bimetallic. Starting in late 1873, more measures to restrain silver money appear. For example,
LMU members agreed to suspend free coinage of silver as of 31 January 1874. Willis (1901)
describes the period starting November 1878 as the “period of suspension” during which LMU
members stopped producing large silver coins. He describes the period starting 1886 as the
“period of compulsory redemption” during which more pressure was put on errant LMU
members to redeem their subsidiary coins held by other members.
While the Union survived in one form or another until 1925, it was not considered a
success. Some member states typically ran budget deficits and attempted to “export inflation” to
others in the form of large numbers of minor silver coins. Keeping the Union together was often
seen as little more than a ploy to avoid the forced redemption of those coins if a member state left
the Union or if the Union dissolved: the weaker states did not believe they could afford to retire
their minor coins in gold and, thus, kept the Union alive. The strong, leading member of the
Union, France, felt a need to avoid pushing weaker neighbors to the financial brink and, in effect,
subsidized them. The outbreak of the First World War in June 1914 led to the general suspension
of gold coinage and effectively ended what was left of the Union.
Since the LMU can be thought of as Europe’s first broad common currency arrangement,
it is useful to briefly summarize the development of today’s European monetary system. In
March 1979, the European Monetary System (EMS) and its Exchange Rate Mechanism (ERM)
came into force. Under the ERM, exchange rates were permitted to fluctuate in bands ranging
from 2¼% to 15%, depending on the particular country. Conventional central bank tools were to
8
be used to keep exchange rates within the agreed bands but, with persistent differences in
inflation and other economic conditions across member states, there were repeated adjustments
to target exchange rates. On 15th September 1992, Britain and Italy officially exited the ERM,
Finland, Norway, and Sweden exited unofficially, and rates were realigned for Spain, Portugal
and Ireland. In August 1993, the bands were widened for remaining members.
More recently, member states agreed to converge domestic economic conditions by
adhering to limits on such variables as government borrowing, inflation, and bond yields. On 31
December 1998, the Irrevocable Euro Conversion Rates were published, defining fixed exchange
rates for each member currency and the new euro unit of the European Monetary Union (EMU).
Member states also agreed to yield their power to create money to the European Central Bank
(ECB). At the start of 2002, Euro coins and notes went into circulation in member countries,
formally replacing the individual currencies of member states.
3. Research design
3.1 Methodology
As described in more detail below, the biggest constraint on our research is the
availability of data. In some cases, we have access to annual data only while in others there is no
recorded information at all. Therefore, we confine our statistics to simple unconditional
variances and correlations within sub periods, linear regressions including time period dummy
variables, and tests for statistically significant differences across sub periods.
We focus our tests on several questions implied by our previous discussion and by the
nature of the LMU. A key aspect is to benchmark the LMU against the gold standard. The
classical gold standard was a rigorous monetary system demanding that gold coin or paper money
9
freely convertible into gold be strictly maintained (Bordo and MacDonald 1997). In theory, the
LMU was similarly demanding, requiring convergence to a common standard and limiting the
emission of undervalued silver coins or paper money. In practice, LMU members sometimes
skirted these conditions, exited a metallic standard entirely, or eventually returned to gold. In
comparing empirical results on the LMU to those on the gold standard, we seek to measure the
significance of the adoption of the LMU and its perceived and actual credibility relative to a gold
standard. Put another way, did membership of the LMU imply the same degree of monetary
stability and credibility as explicitly adopting the gold standard directly?
We begin by examining the volatility of financial and economic indicators across time
periods of different monetary regimes:
H1. The volatility of interest rates, bond yields, inflation, and trade is lower when a
country is a member of the LMU.
H2. The volatility of interest rates, bond yields, inflation, and trade is lower when a
country is on the gold standard.
H1 suggests that membership of the LMU contributes to economic stability and is associated
with lower volatility, even if member countries violated the spirit of LMU or even adopted paper
money at points. H2 predicts that adoption of the gold standard can serve a similar purpose.
In a related manner, we test whether adoption of a particular monetary system (LMU or
gold) implies convergence to the economic indicators of the leading proponent of that system:
10
H3. Interest rates, bond yields, inflation rates, and trade of LMU members (or others who
mimic LMU standards) are more highly correlated with those of the dominant LMU
member, France, when they are both LMU members.
H4. Interest rates, bond yields, inflation rates, and trade of a particular country are more
highly correlated with those of the U.K. when the particular country is on the gold
standard.
Again, we benchmark the significance of the LMU by comparing it to the significance, in terms
of economic convergence, of the gold standard as upheld by Great Britain throughout our sample
period.
Next, we transform our inflation and exchange rate data in a useful manner for an
additional volatility test:
H5. Purchasing Power Parity deviations decline during periods when a country is
(formally or informally) an LMU member.
H6. Purchasing Power Parity deviations decline during periods when a country is on gold.
For those countries, time periods, and frequencies for which we have inflation data, we compute
the average PPP deviation within sub periods and test whether the average deviation is
significantly different during the period a particular country was in the LMU, or on gold. Again,
11
the varying degrees with which member states followed the LMU imply looking at individual
countries. PPP deviations are computed against the French franc or British pound.
Finally, we follow previous authors (see, for example, Bordo and Rockoff 1996) and
study the spread of a country’s bond yield over the British bond yield as a measure of credibility:
H7. The spread of a country’s bond yield over gold standard leader Great Britain declines
when the country adopts the gold standard.
H8. The spread of a country’s bond yield over gold standard leader Great Britain declines
when the country is a member of the LMU.
3.2 Data
The LMU was agreed to in December 1865. Our starting point is 1822, by which time
the U.K. had fully adopted the gold standard. We terminate the sample at June 1914, the time of
the outbreak of the First World War when more fundamental economic and military
considerations were at work. Our principal source of data is the Global Financial Database
(http://www.globalfindata.com), which is available by subscription. We also employ a few series
previously collected by Bailey and Bhaopichitr (2002) and Bailey, Mao, and Zhong (2002).
Throughout the tables of results, we organize the countries into four sets: founding LMU
members (France, Belgium, Italy, Switzerland), principal non-LMU European countries that
typically maintained a gold standard (Germany, Netherlands, U.K.), other European countries
(Austria-Hungary, Denmark, Finland, Greece, Portugal, Russia, Spain, Sweden, Turkey), and
non-European countries (Canada, India, South Africa, U.S.A.).
12
Table 2 summarizes the data series that are available for the countries of interest
identified in Table 1. The quality of data varies widely across sample countries, frequencies, and
types of information. France has generally good monthly data for private bill rates and bond
yields, although there are large runs of missing bond yields, private bill yields begin only in
1860, and the consumer price index is annual. Among other LMU founders, Belgium has fewer
available bond yields than France while Italy and Switzerland have little or no bond or interest
rate information. A later LMU entrant that experienced difficulties, Greece, has only scraps of
bond yield data. At the other extreme, Great Britain has excellent coverage of all data series. The
U.S. has fairly good data as well, but its usefulness is compromised since the use of depreciated
currency during and after the Civil War makes the U.S. much less suitable than Britain as a
benchmark for other countries. Wherever possible, we splice related series together to maximize
the time series and cross section of available data. For example, dollar exchange rates are
translated to pounds to fill in any gaps in pound exchange rates, Berlin private bill yields replace
the Hamburg yields that end in 1899, and wholesale price inflation stands in for any unavailable
consumer price inflation.
Our empirical results suffer the potentially confounding impact of contemporaneous
events. For example, the Franco Prussian War (14 July 1870 to 10 May 1871) drove France to
inconvertible paper money and put a large war indemnity in Prussia’s hands at war’s end. The
“Panic of 1873” and other crises affected economies around the globe. Regional tensions and
wars involving Italy, Austria-Hungary, and other European countries were also at work during
the period we study. Furthermore, the ultimate ambiguity in this study is the degree to which the
LMU was an ideal rather than an actual monetary system. Adherence to LMU rules by LMU
members (or those states paralleling LMU) was often uneven. This is clear from our discussion
13
in Section 2. Italy and others sometimes violated the spirit of the Union by overproducing cheap
silver coins or small denomination paper money. Therefore, we must treat each country or pair of
countries individually in estimating and interpreting empirical results.
To compare the behavior of economic and financial indicators under the LMU to their
behavior in the modern European monetary system, we also collected three-month interbank
interest rates, 10-year government bond yields, inflation, and industrial production growth from
Datastream for the 15 members of the European Union. The data is monthly and spans the
period from January 1979 to December 2000. The sample of 15 countries includes four
(Denmark, Greece, Sweden, and the U.K.) that, as of the end of 2000, were not members of the
new common currency, the euro.
4. Results
4.1 Volatility over LMU and gold standard time periods
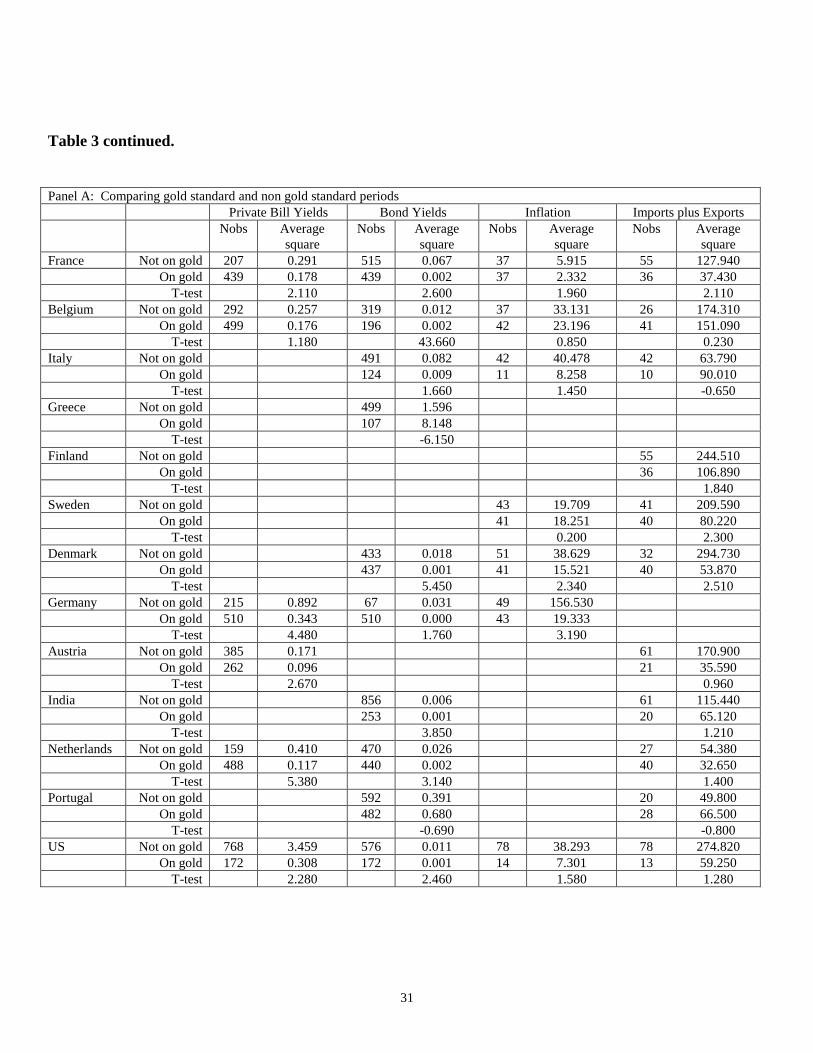
Table 3 summarizes difference-in-means tests for squared values of private bill yields,
bond yields, inflation, and trade across LMU, gold standard, and other time periods. In Panel A,
there is substantial, though less than perfect, evidence that France, Belgium, and most other
countries that followed relatively responsible policies experienced decreases in the volatility of
money market interest rates and bond yields during periods spent on the gold standard, H2. On
the other hand, there is only mixed evidence that the most egregious violator of LMU rules and
good monetary practices, Italy, experienced change in the volatility of these indicators while on
the gold standard. Across all countries, the evidence on inflation and trade is typically weaker,
perhaps because of the short series of only annual data that are available.
14
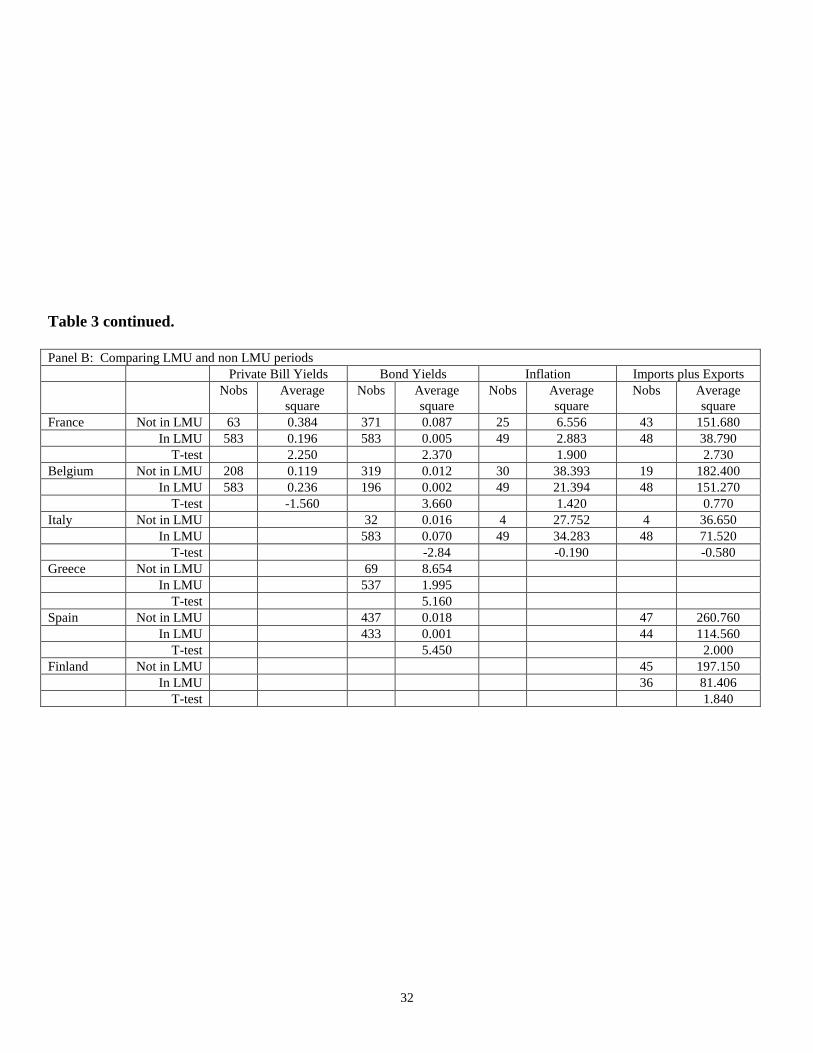
Table 3 also breaks the data in “LMU” and “non LMU” periods, in addition to “gold” and
“not gold” periods as discussed previously. In Panel B, there are fewer countries with which to
study the “on LMU” slope dummy, and this is aggravated by lack of data on some series for
some time periods. The results indicate less volatility in bond yields for core LMU members,
France and Belgium, during periods when they are in the LMU, thus supporting hypothesis H1.
There is also evidence that joining or following the LMU reduced bond yield volatility for two
countries, Greece and Spain, with a more volatile economic record. Again, much weaker results
for annual inflation and trade may be the result of small time series of data. Thus, mere LMU
membership may have reassured the bond markets that good policies were in place or would be
adhered to soon. On the other hand, there is no evidence that LMU membership, as was the case
for adoption of a gold standard, lowered the volatility of Italian bond yields.
4.2 Correlation with French and British indicators
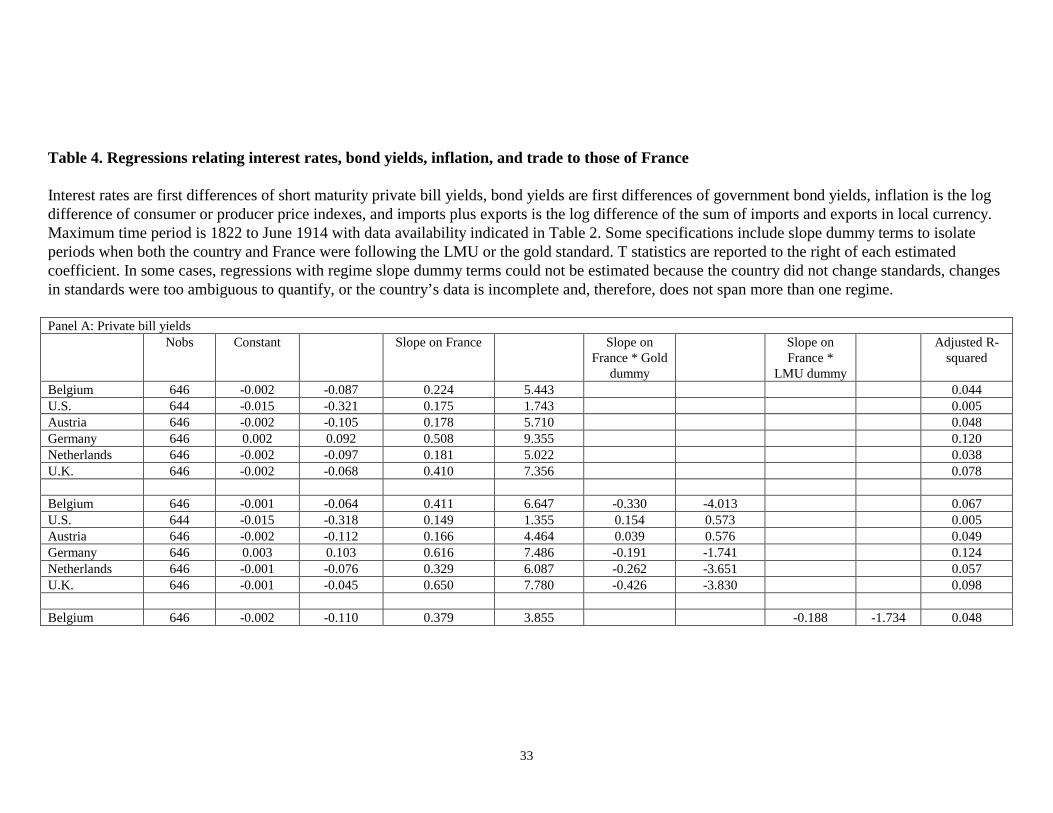
Table 4 summarizes results of regressions that relate interest rates (Panel A), bond yields
(Panel B), inflation rates (Panel C), and trade (Panel D) to those of the LMU leader, France (H3).
Regressions include slope dummy terms to identify changes in the relationship when the
particular country is on the gold standard or in the LMU:
Zi,t,t+1 = α + β ZFrance,t,t+1+ β (DLMU,i,t,t+1*ZFrance,t,t+1)+ β (Dgold,i,t,t+1*ZFrance,t,t+1) + εi,t,t+1 (1)
Zi,t,t+1 represents the change in economic or financial indicator Z for country i from t to t+1,
ZFrance,t,t+1 represents the contemporaneous change in the indicator for France, DLMU,i,t,t+1 is a
dummy variable that takes the value one when country i follows the LMU from t to t+1,
Dgold,i,t,t+1 and is a dummy variable that takes the value one when both country i and France are
15
on a gold standard. The dummy variables define slope dummy terms that allow us to observe
changes in the relationship over different monetary regimes. The other symbols represent the
estimated intercept, slopes, and errors.
In Panel A, there is evidence of strong correlation between private bill yields of European
states and those of France. This suggests some degree of commonality or integration across
European money markets. However, many insignificant slopes on the gold and LMU slope
dummy terms indicate no evidence that adoption of gold or membership of the LMU induced
convergence towards French money market prices. Furthermore, negative slopes (Belgium,
Netherlands, Great Britain) suggest less convergence with France during common gold standard
periods.
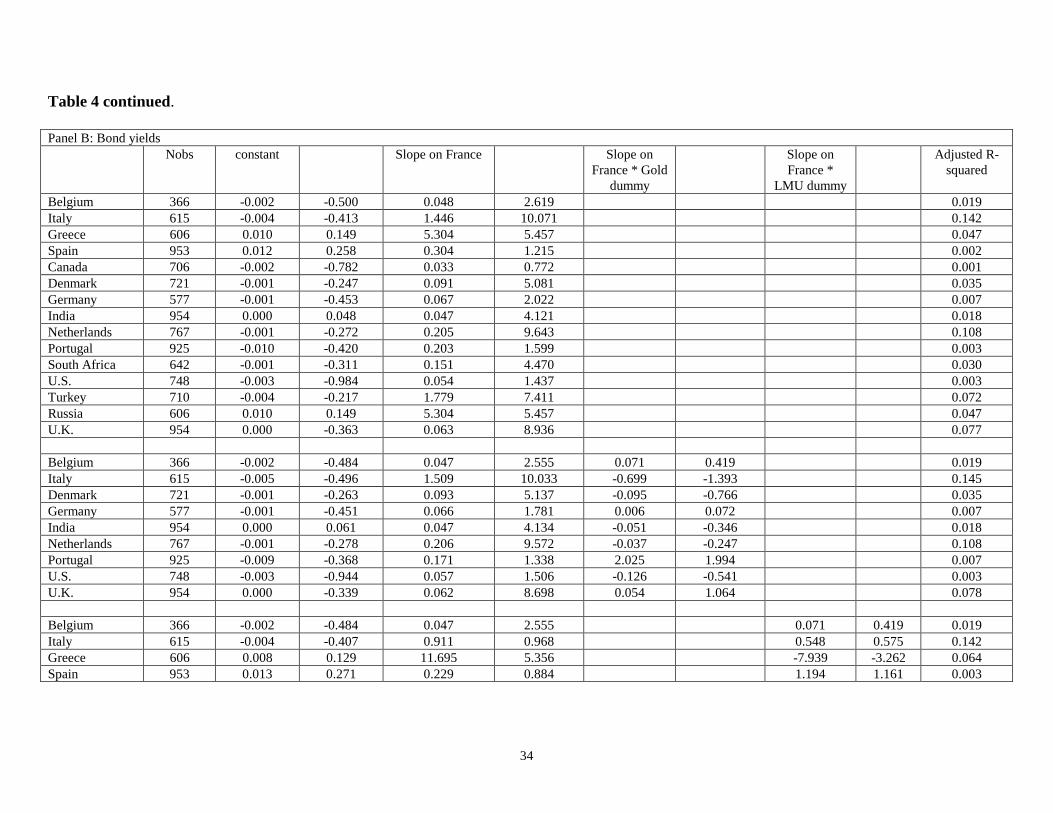
Panel B presents similar evidence for bond yields. The slope coefficients on the French
bond yield indicate strong commonalities between French bond yields and those of other states,
even economies like Italy, Greece, Turkey, and Russia that experienced economic and monetary
policy turmoil at several points during our sample period. However, estimated coefficients on
gold and LMU slope dummy terms again indicate little convergence to the pricing of France’s
bonds with gold or LMU membership. The negative slope for Greece on the LMU slope dummy
term suggests that Greek bond pricing become more idiosyncratic once Greece joined the LMU.
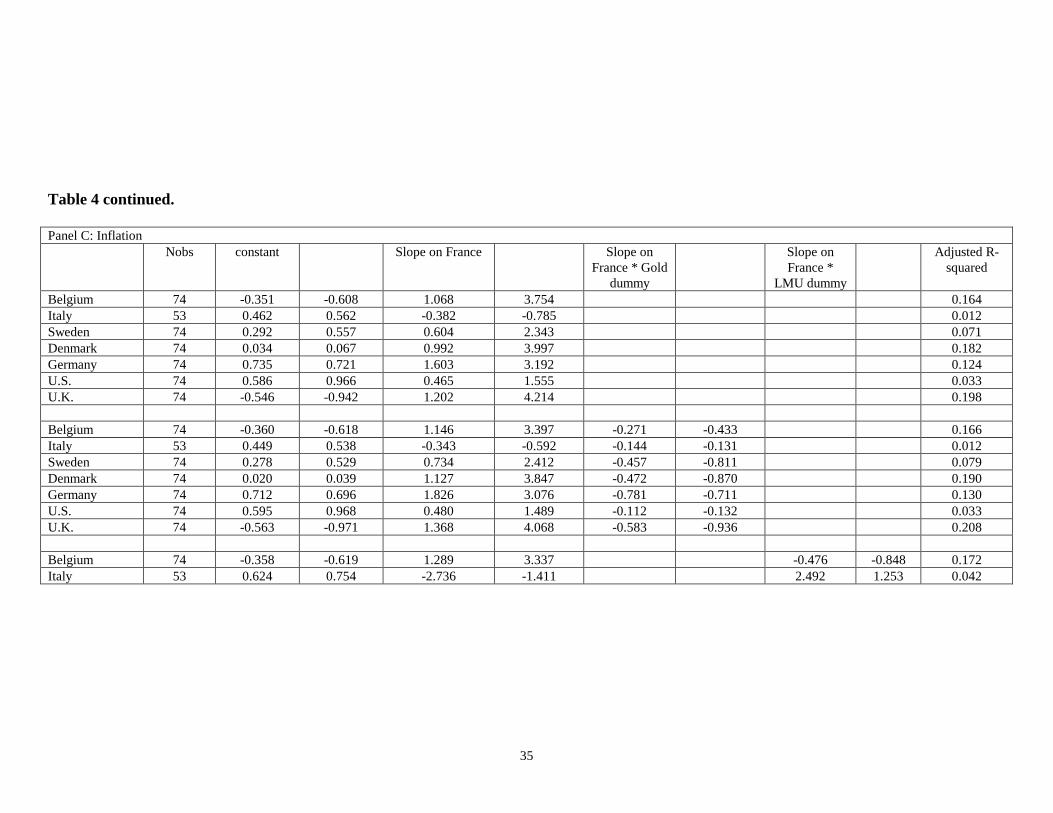
Panel C presents similar evidence on inflation rates as they relate to French inflation.
Again, there is evidence in the slope coefficients of common factors across many of our sample
countries. At the same time, Italy’s relatively low r-squares are consistent with the chaotic Italian
fiscal and monetary policies contributing to detaching Italian inflation from French trends during
this period.
16
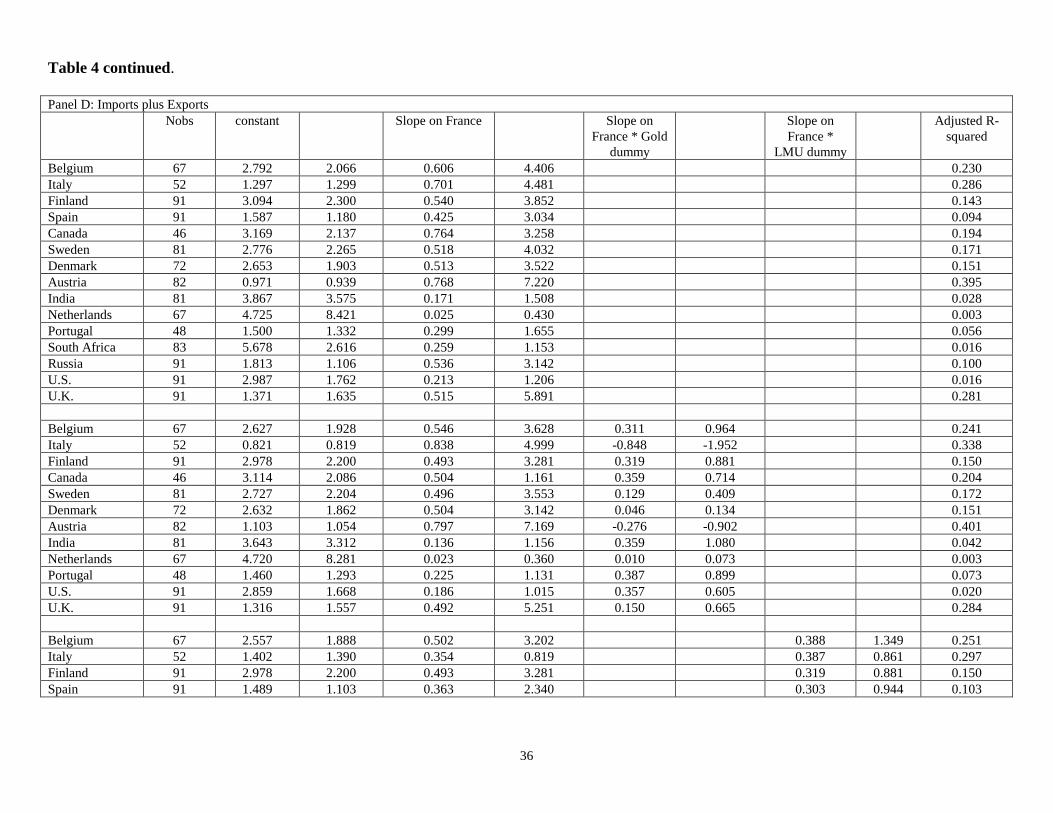
Panel D presents similar evidence on rates of growth of trade (imports plus exports) as
they relate to corresponding rates for France. Given the lack of GDP or Industrial Production
data for our sample countries during this early time period, the trade numbers may be thought of
as proxies for real activity, in addition to being of interest in and of themselves.2 Again, there is
evidence in the slope coefficients of commonalities between France and many countries. At the
same time, there is no evidence that correlation was heightened when the country and France
were both members of the LMU or both on gold.
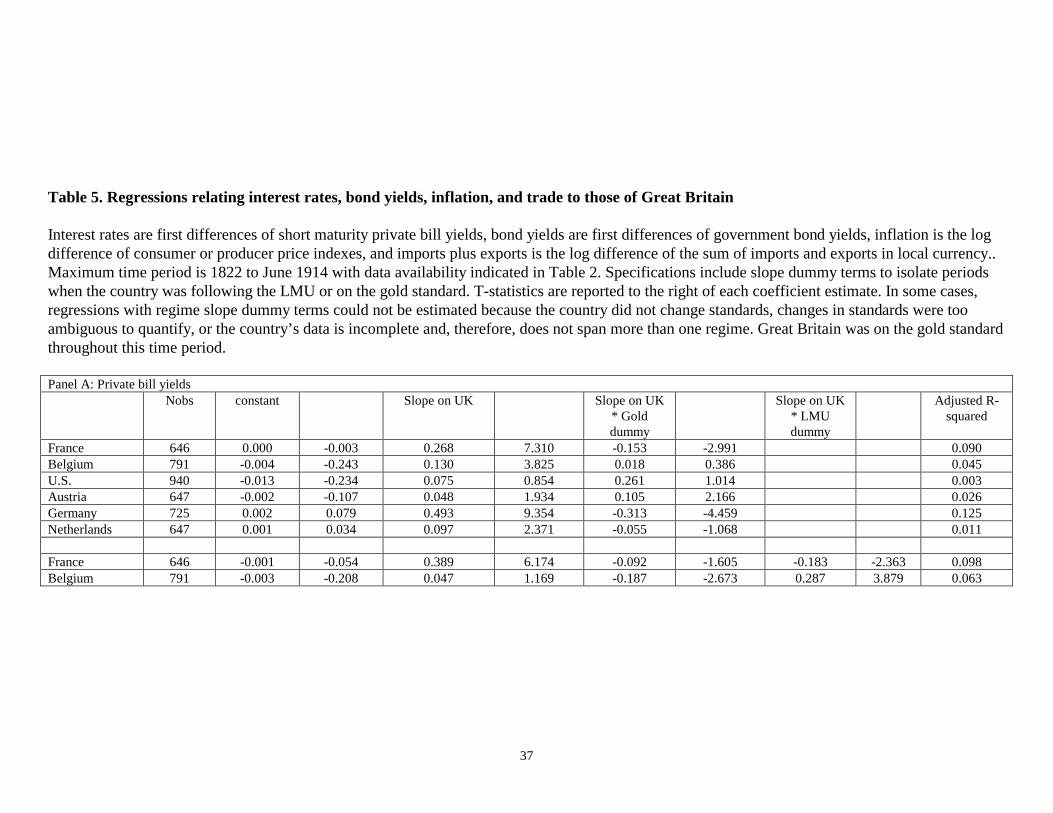
Table 5 summarizes results of regressions that relate interest rates (Panel A), bond yields
(Panel B), inflation rates (Panel C), and trade (Panel D) to those of gold standard Great Britain.
The specification is similar to that used in Table 4, that is, equation (1). Our hypothesis, H4, is
that the adoption of gold (rather than the LMU) was critical in binding a particular country to the
economic conditions of the standard-bearer of that monetary system.
In Panel A, there is evidence that, except for the U.S., there is a strong relationship
between U.K. interest and those of other economies. Note, however, that the absence of data for
Italy and other problematic non-LMU members like Russia and Turkey limits this conclusion.
Furthermore, there is little evidence among the estimated coefficients on slope dummy terms that
adoption of the gold standard (or membership of the LMU) made any difference in converging
interest rates to those of the U.K. Indeed, negative slopes for France and Germany suggest lower
correlation with gold standard U.K. during gold or LMU periods.
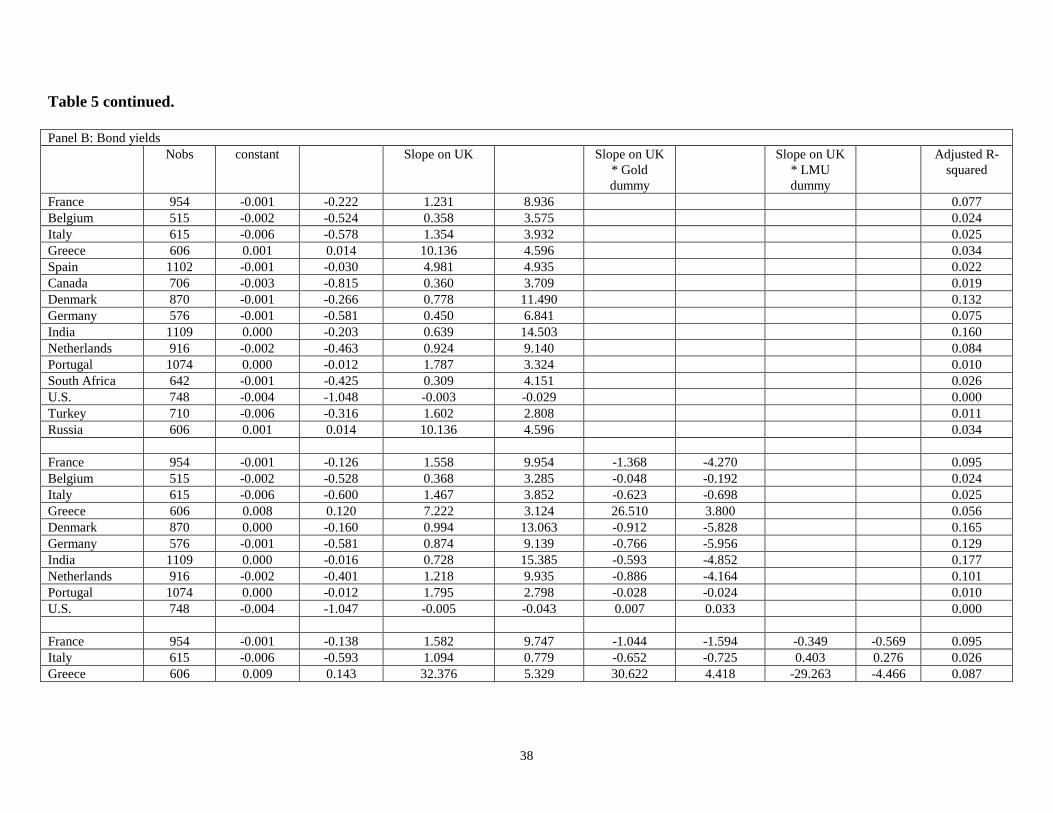
Panel B presents similar evidence on bond yields: there is much evidence of correlation
with U.K. bond yields but little evidence that the correlation tightened when a particular country
2 Bailey and Bhaopichitr (2002), for example, use the rate of change of the sum of imports and exports to proxy for economic activity in their study of Pacific Rim capital markets and monetary regimes in the period from 1870 to 1939.
17
shared Britain’s gold standard. The positive slope for Greece on the gold slope dummy indicates
greater correlation with the U.K. when both are on gold while the negative slope for Greece on
the LMU slope dummy indicates less correlation, as do negative coefficients on the gold slope
dummy for France, Denmark, India, and the Netherlands.
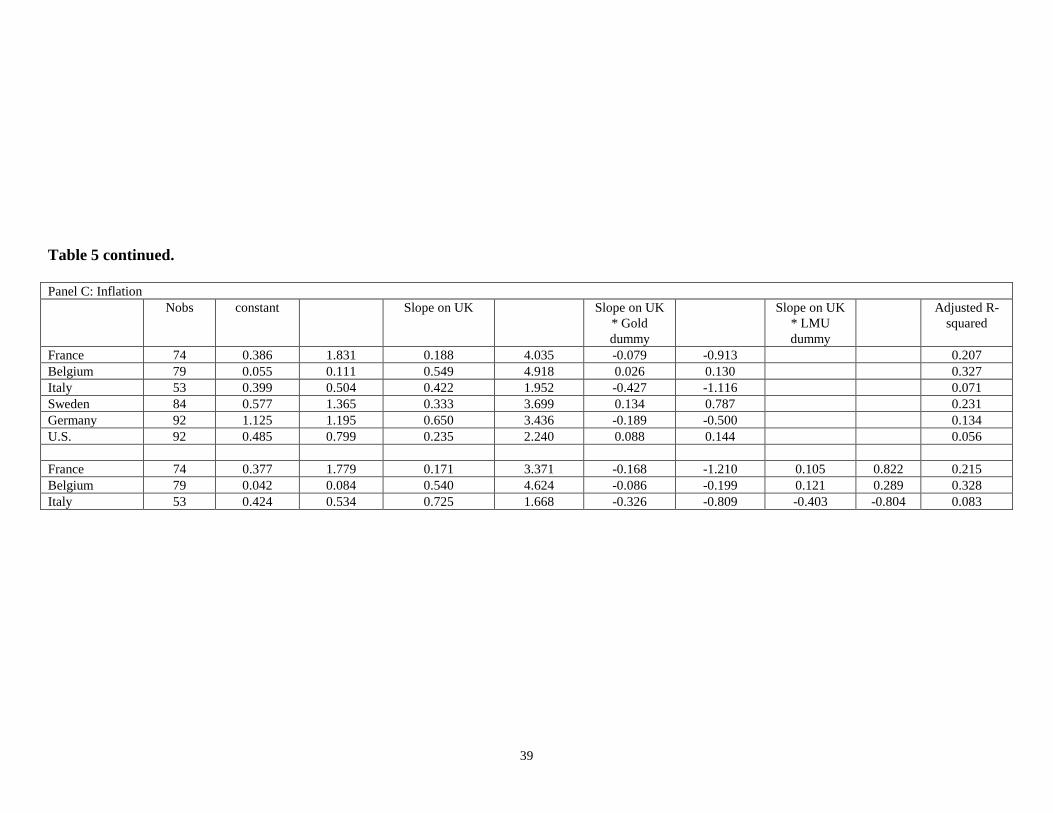
Panel C mirrors what we report earlier for convergence on French indicators. There is
generally strong correlation between national inflation rates and U.K. inflation, but no impact of
monetary regime slope dummy terms. Again, it is notable that the correlation is relatively low
for Italy, suggesting much volatility and turmoil in the economic conditions and policies of this
LMU member. Collectively, the evidence indicates that LMU membership did not hasten
convergence to the economic conditions of the leading member. However, there is no evidence
that the gold standard had any more power to converge economic conditions to those of the U.K.
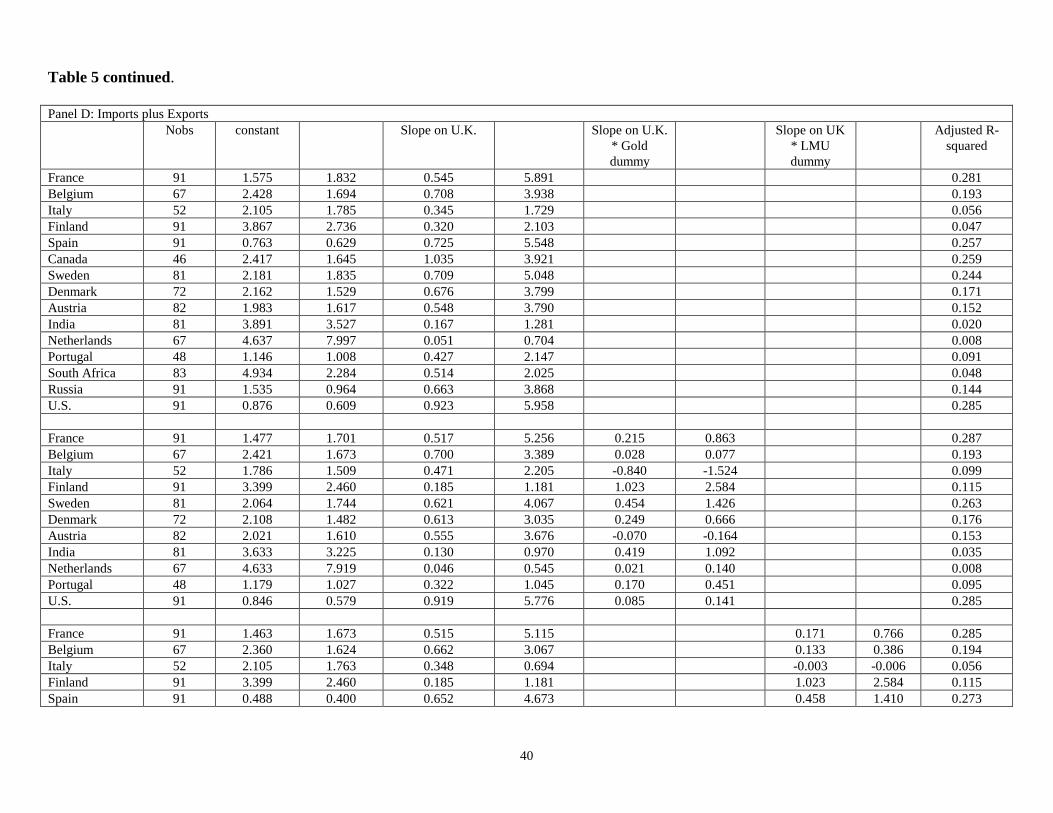
Panel D roughly mirrors what was reported for correlations with France’s trade in Panel
D of Table 4. There is much evidence of strong links between the trade of our sample countries
and trade of gold standard leader Great Britain, but little evidence that the links tightened when a
particular country adopted the gold standard.
4.3 Adherence to Purchasing Power Parity during LMU and gold periods
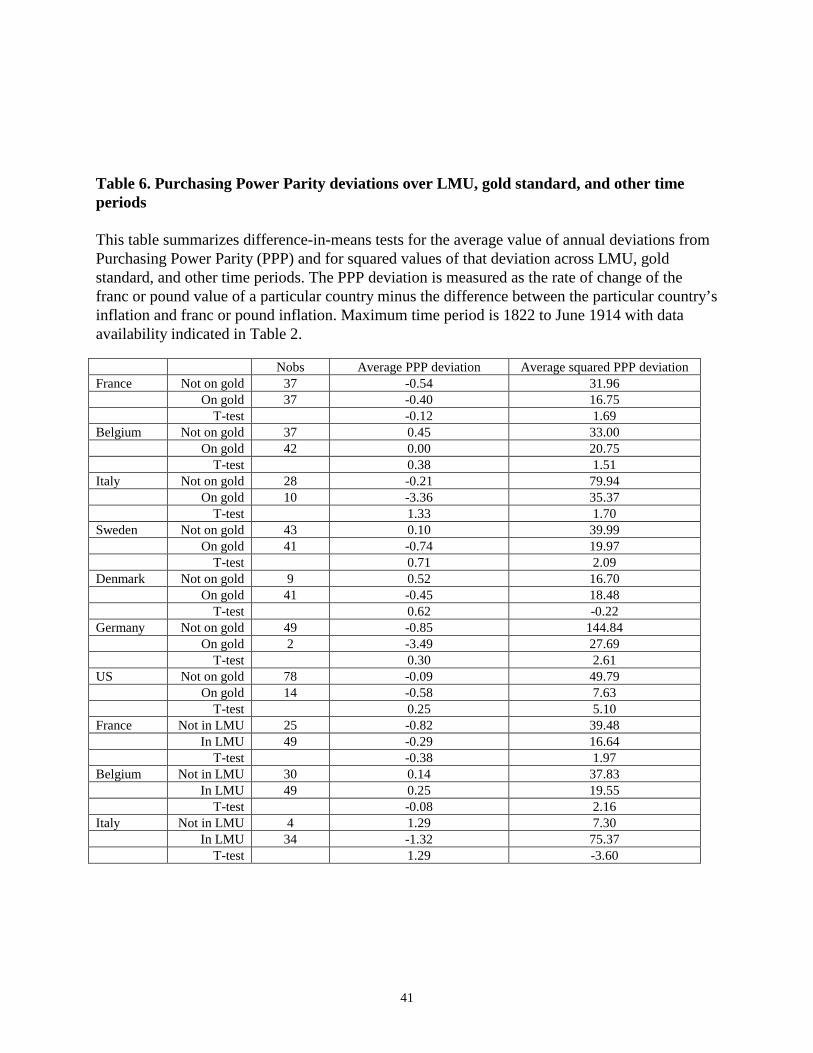
Table 6 summarizes difference-in-means tests for the average deviation from Purchasing
Power Parity (PPP) and average squared values of that deviation across LMU, gold standard, and
other time periods. The PPP deviation is measured as the rate of change of the franc or pound
value of a particular country minus the difference between the particular country’s inflation and
franc or pound inflation.
The center column of the table indicates that, on average, PPP deviations were small and
did not differ across monetary systems. However, the right-hand column of the table indicates
18
that the volatility of PPP deviations was often significantly or marginally significantly lower as
an LMU member or on the gold standard. Interestingly, LMU membership seems more
significant than a gold standard in reducing fluctuations in PPP deviations for key LMU member
states France and Belgium. Once again, Italy deviates from the behavior of other countries:
squared PPP deviations appear larger during the LMU period, although the number of non LMU
data points available for study is extremely limited. The results confirm earlier findings and our
hypotheses H5 and H6: the choice of monetary regime appears to be associated with the volatility
of economic and financial indicators and, in particular, adherence to some sort of standard
appears to reduce that volatility.
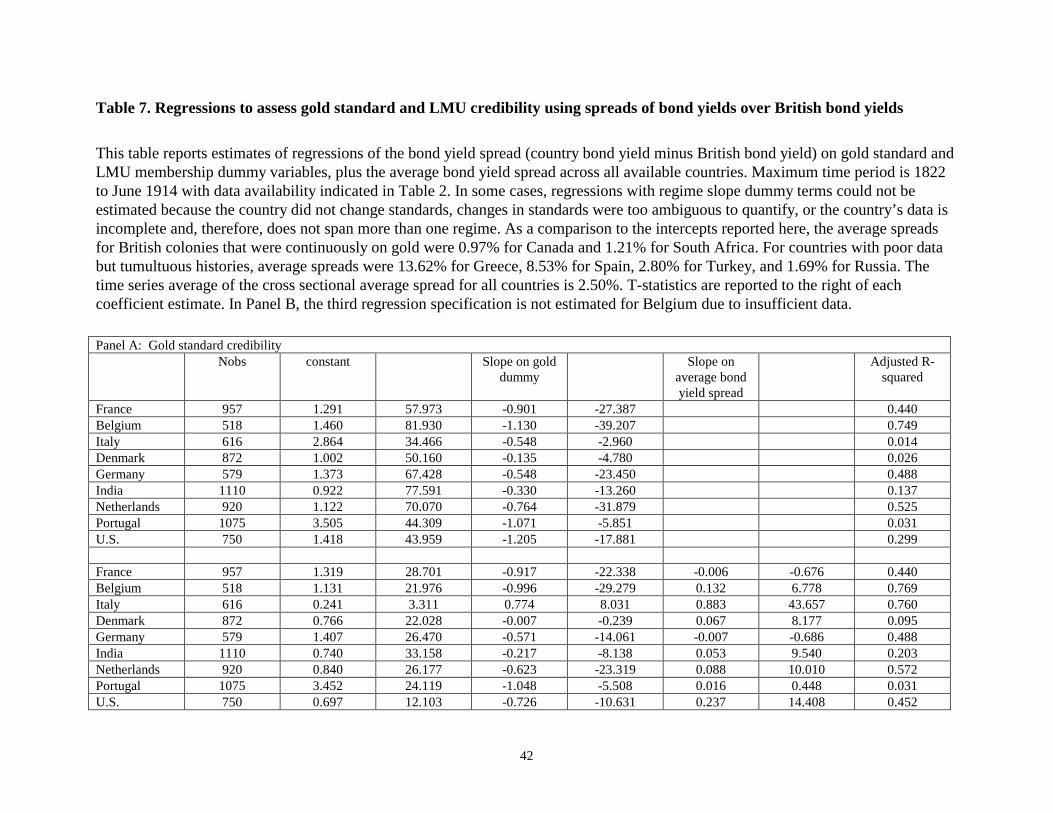
4.4 Bond yields and the credibility of a monetary standard
Table 7 reports results of regressions of country bond spreads on monetary regime
dummy variables and an average bond spread. Each country’s bond spread equals the yield on
the country’s bond minus the yield on the comparable British bond. The average bond spread is
a cross sectional average of such spreads across all countries. It is intended to pick up market-
wide movements in bond spreads (Bordo and Rockoff 1996). The two panels of Figure 2 plot
bond yield spread series for selected sample countries. The size and variability of spreads is
particularly evident for Italy, Greece, and Spain.
In Panel A of the table, credibility under a gold standard, H7, is examined. Most countries
display strongly statistically significant negative slopes for the gold regime dummy. This
indicates that, on a gold standard, bond yields in these countries became closer to yields on Great
Britain’s debt. Once again, however, Italy stands out: after controlling for the average market -
wide spread, Italian yield spreads seem to increase when the country is on gold, implying
declining credibility.
19
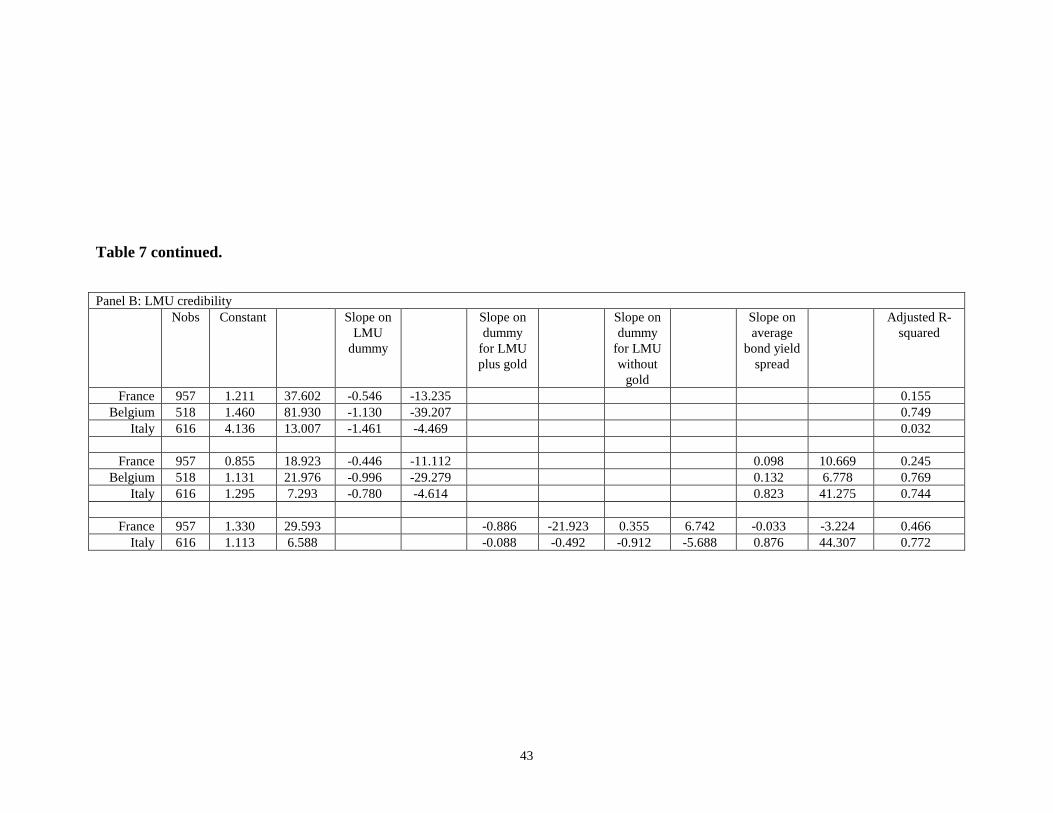
Panel B tests for credibility during membership of the LMU, H8. We employ a more
complex set of dummy variables to isolate periods when the particular country was a member of
the LMU but there was no concurrent gold standard. It appears that France’s bond spreads were
lower under concurrent LMU and gold standards but higher while an LMU member but not on
gold. This is sensible. The measure of “credibility under LMU” actually implies greater
credibility for Italy on an “LMU plus paper money” system. Again, the complex situation of
Italy is evident.
5. Does history repeat itself?
A primary driving factor in the failure of the LMU was the performance of Italy’s
government. Budget deficits and government borrowing were not kept under control while
issuance of subsidiary silver coin and small denomination paper money imposed costs on other
Union members. Similar problems arose under the pre Euro arrangements in Europe when the
fiscal deficits and money growth of weaker members were “exported” to Germany and other
stronger economies through the managed exchange rate system that prevailed at the time.
Is this likely to happen again? Euro-area countries have no power to create additional
money and, furthermore, they must adhere to constraints on budget deficits and other macro
indicators. Thus, the powers that Italy used to undermine the LMU to her own benefit are not
available to Euro-area countries. However, the conditions under which a member state might be
“warned” or penalized for violating fiscal deficit strictures remain an issue and it is conceivable
that a member in trouble may put itself at risk of leaving or being ejected from the euro area.
There are recent precedents, such as the case of Argentina exiting its currency board, for hard
currency standards being abandoned in times of economic turmoil. More recently, fiscal
20
problems in France and Germany threaten the convergence criteria established for euro-area
membership.
To look at the impact of the evolution of the European Monetary System and subsequent
European Monetary Union, we relate interest rates, government bond yields, inflation rates, and
industrial production growth of 14 European Union states to those of core EMS/EMU member,
Germany. The monthly data span the period from January 1979 to December 2000, and the
regressions include slope dummy terms to identify the period of convergence (from the February
1992 signing of the Maastricht Treaty to the month before approval of the Euro Plan in May
1998) and the period of monetary union (from May 1998 to the present). Note that, as of
December 2000, four EU states, Denmark, Greece, Sweden, and the United Kingdom, had not
adopted the euro.
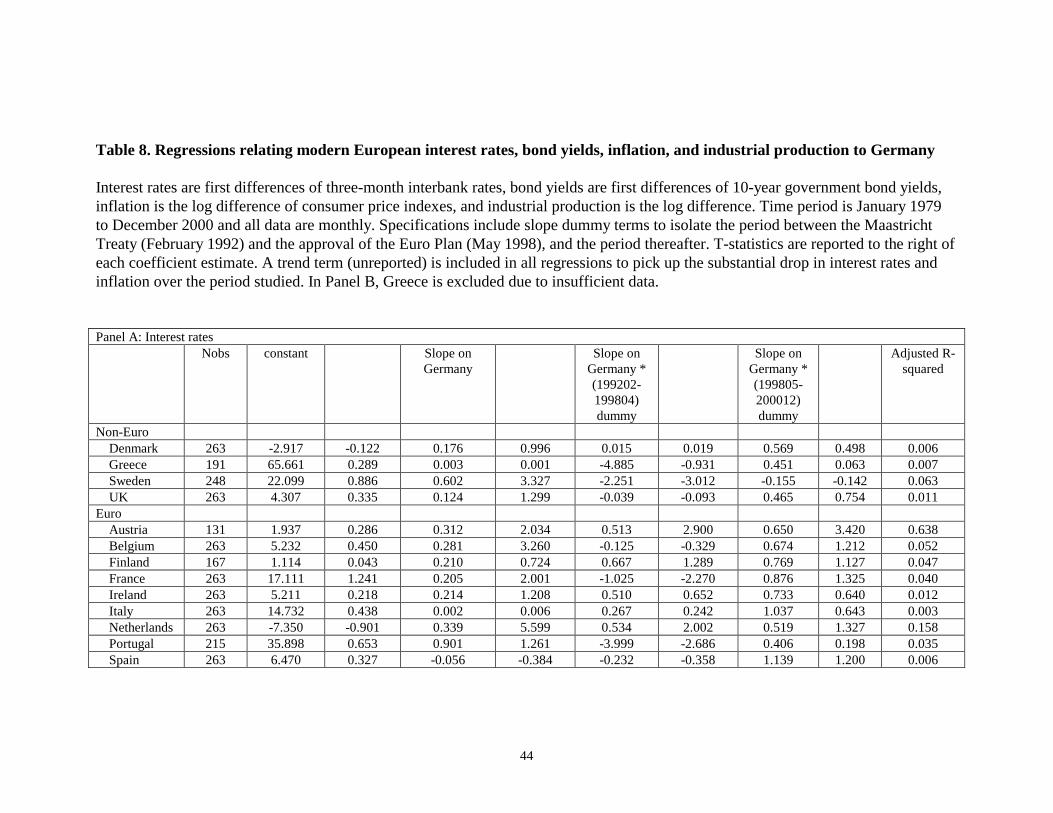
Table 8 presents the results in a format similar to Tables 4 and 5. In Panel A of Table 8,
changes in three-month interbank rates are related to changes in three-month German interbank
rates and slope dummy terms. There is evidence of significant correlation between interbank
interest rate changes in Germany and in a few other euro members (Austria, Belgium, France,
Netherlands) and one non-member (Sweden). There is little evidence that this correlation tightens
during specific periods in the development of the EMS/EMU, and some evidence that it weakens.
In Panel B of Table 8, changes in 10-year government bond rates are related to changes in
10-year German government bond yields. In contrast to the results on short term interest rates in
Panel A, the slope coefficient estimates indicate a strong correlation with German bond yields
regardless of the state of the EMS/EMU for most EU countries whether they adopt the euro or
not. Interestingly, some of the strongest correlations exist for those economies that have not
adopted the euro. Strong positive slopes on the (199202 – 199804) slope dummy term for many
21
economies indicates that the convergence to German bond yields strengthened with the
Maastricht Treaty and the expectation that EU states would converge their economic and
financial conditions as a prelude to monetary union. Several countries also display a strong
positive slope on the (199805 – 200012) slope dummy term, indicating still stronger convergence
with the formal approval of the Euro plan.
A number of other interesting results are evident in the table. First, the Netherlands shows
no significance on the slope dummy terms. This is consistent with the country’s continually close
tracking of German economic and monetary conditions and policies. Second, bond yields of Italy
and Spain are significantly correlated with those of Germany only during the post Maastricht
convergence and formal euro periods. This is consistent with the volatile economic and
monetary conditions in Italy and Spain vanishing as those countries agreed to converge to the
Maastricht criteria. In comparing the Netherlands to Italy and Spain, it is evident that adoption of
a demanding monetary regime is most significant for member states that previously suffered from
poor policies and volatile conditions. In comparing this bond yield evidence from the modern
EMS/EU to our earlier bond and private bill evidence on the LMU, it is also evident that the
adoption of the LMU was not perceived as converging interest rates to those of the core member,
France, or the leading gold standard country, Great Britain. In contrast, EMS/EMU membership
often draws bond yields closer to those of Germany, particularly for those states that previously
experienced relatively unstable economic and monetary conditions. The contrast between Italy
under the LMU and Italy in the EMS/EMU is particularly dramatic.
Panel C of Table 8 presents regression results on the convergence of EU member
inflation to Germany’s inflation. As was the case for bond yields in Panel B, there is strong
evidence that inflation rates generally for a number of EU members are strongly correlated with
22
German inflation regardless of the time period studied. The sample of countries for which this
holds includes both core EU members that adopted the euro and others that did not. At the same
time, the estimated coefficients on the (199202-199804) slope dummy terms suggest that, for a
few states, inflation become less attached to core German inflation under the convergence criteria
of the Maastricht Treaty. However, this is largely associated with “fringe” EU states Denmark,
Great Britain, and Greece that did not subsequently join the euro area.
Panel D of Table 8 presents regression results on the convergence of EU member
industrial production growth to Germany’s industrial production growth. There is little evidence
that monthly industrial production across EMS/EMU members converges to Germany’s
industrial production growth. This matches what we found for our real activity proxy, the rate of
growth of trade, during the LMU era. In brief, the modern European monetary system appears
more different and, in particular, more credible than the LMU on the bond yield and inflation
dimensions.
Table 9 uses bond yield spreads to assess EMS/EMU credibility in a manner similar to
the assessment of the credibility of LMU and gold standards presented earlier in Table 7. In
contrast to what we found for the LMU era, there is virtually no evidence that the credibility of
modern European monetary systems varies with specific developments in the EMS/EMU. It
suggests a uniformly credible system throughout its life.
6. Summary and Conclusions
We study financial and economic indicators from the era of the Latin Monetary Union, an
interesting nineteenth century currency system which may be thought of as a precursor of modern
European monetary and currency arrangements. The Latin Monetary Union was adopted in 1865
by France, Belgium, Italy, and Switzerland, and by other countries either formally or informally

23
in subsequent years. Our empirical results are based on an extensive, though incomplete,
database of exchange rates, interest rates, bond yields, inflation rates, and trade figures that span
a period of about 90 years from the early 19th century to the outbreak of the First World War.
We find that membership of the LMU or adoption of a gold standard is frequently
associated with lower volatility of private bill yields, bond yields, inflation, and deviations from
Purchasing Power Parity. This result, however, does not extend to Italy. We also find that LMU
membership or gold standard does not induce convergence with the key LMU economy, France,
or the key gold standard economy, Great Britain. Thus, we have tentative evidence that gold
money or LMU membership “mattered” to financial and economic volatility but did not appear to
induce “convergence” with key economies. The weakness of the LMU is confirmed by bond
yield spread evidence suggesting that gold standard adoption was “credible” while LMU
membership was not. The evidence on Italy is strongly consistent with the weak fiscal and
monetary policies of the Italian government, and is a reminder that mere membership of a
seemingly responsible currency standard does not confer economic success or respectability in
the money and bond markets. In contrast, comparable results on modern European bond yields
and inflation rates suggest that development and implementation of the EMS/EMU has been
effective in inducing convergence to the German economy, most notably for Italy and Spain.
We acknowledge limitations to our use of very old data from the LMU period. The data
series are not complete or, in many cases, are available only annually. This limits our ability to
employ more powerful and interesting statistical techniques.3 Furthermore, money markets and
bond markets may have been less liquid or efficient in responding to information or changes in
3 For example, Hallwood, MacDonald, and Marsh (2000) apply a GARCH specification to detect risk premiums for the U.S. dollar in the period 1890 to 1897.
24
monetary regime than modern markets.4 Thus, money market and bond yields may not reflect
precisely the impact of LMU events on the economies of member states. In spite of this, our
results are interesting and, in particular, highlight differences between the LMU and modern
EMS/EMU, and contrasting role of Italy across the two agreements.
4 For example, Tuniolo, Conte, and Vecchi (2002) find that bond pricing across Italian cities varied considerably, implying impediments to arbitrage and trading in spite of the lack of any barriers or other costs.
25
Bibliography Artis, M. J., and Taylor, M. P., 1994, The Stabilizing Effect of the ERM on Exchange Rates and
Interest Rates, International Monetary Fund Staff Papers 41, 123-148.
Bailey, Warren, and Bhaopichitr, Kirida, 2002, How Important was Silver? Some Evidence on
Exchange Rate Fluctuations and Stock Returns in Colonial Era Asia, forthcoming
Journal of Business.
Bailey, Warren, Connie X. Mao, and Rui Zhong, 2002, Exchange Rate Regimes and Stock
Return Volatility: Some Evidence from Asia’s Silver Era, forthcoming Journal of
Economics and Business.
Bartov, Eli, Bodnar, Gordon M., and Kaul, Aditya, 1996, Exchange Rate Variability and the
Riskiness of U.S. Multinational Firms: Evidence from the Breakdown of the Bretton
Woods System, Journal of Financial Economics 42, 105-132.
Baxter, M., and Stockman, A. C., 1989, Business Cycles and the Exchange Rate Regime: Some
International Evidence, Journal of Monetary Economics 23, 377-400.
Bodart, Vincent, and Redding, Paul, 1999, Exchange Rate Regime, Volatility, and International
Correlations on Bond and Stock Markets. Journal of International Money and Finance
18, 133-151.
Bordo, Michael D., and Schwartz, Anna J., eds., 1984, A Retrospective on the Classical Gold
Standard, 1821-1931, Chicago: University of Chicago Press.
Bordo, Michael D., and Capie, Forrest, eds., 1994, Monetary Regimes in Transition, Cambridge:
Cambridge University Press.
Bordo, Michael D., and Robert MacDonald, 1997, Violations of the “rules of the game” and the
credibility of the classical gold standard, 1880 – 1914, NBER working paper #6115
(July).
Bordo, Michael D., and Hugh Rockoff, 1996, The gold standard as a “Good Housekeeping Seal
of Approval”, Journal of Economic History 56, 389-428.
Einaudi, Luca, 2001, Money and Politics: European Monetary Unification and The
International Gold Standard (1865-1873), Oxford: Oxford University Press.
Flood, Robert P, and Hodrick, Robert J., 1986, Real Aspects of Exchange Rate Regime Choice
with Collapsing Fixed Rates. Journal of International Economics 21, 215-232.
26
Flood, Robert P., and Rose, Andrew K., 1995, Fixing Exchange Rates: A Virtual Quest for
Fundamentals. Journal of Monetary Economics 36, 3-37.
Fratianni, Michele, and Franco Spinelli, 1997, A Monetary History of Italy, Cambridge:
Cambridge University Press.
Fratianni, Michele, and von Hagen, J., 1990, The European Monetary System Ten Years After,
Carnegie-Rochester Conference Series on Public Policy 32, 173-242.
Frenkel, J.A., and Mussa, M. L., 1980, The Efficiency of Foreign Exchange Markets and
Measures of Turbulence, American Economic Association Papers and Proceedings 70,
374-381.
Friedman, Milton, 1990, The Crime of 1873, Journal of Political Economy 98, 1159-1194.
Friedman, Milton, and Schwartz, Anna Jacobson, 1960, A Monetary History of the United States
1867-1960, Princeton: Princeton University Press.
Global Financial Data, 2001, GFD Encyclopedia of Global Financial Markets (8th edition),
http://www.globalfindata.com.
Hallwood, C. Paul, MacDonald, Robert, and Ian W. Marsh, 2000, Realignment expectations and
the U.S. dollar, 1890 – 1897: Was there a “Peso Problem”?, Journal of Monetary
Economics 46, 605-620.
Hardouvelis, Gikas, Malliaropulos, Dimitrios, and Priestley, Richard, 1999, EMU and European
Stock Market Integration, Unpublished National Bank of Greece working paper.
Kindleberger, Charles P., 1993, A Financial History of Western Europe, New York: Oxford
University Press.
Leavens, Dickson H., 1939, Silver Money, Bloomington: Principia Press.
Longin Francois, and Solnik, Bruno, 1995, Is the correlation in international equity returns
constant: 1960 -1990?, Journal Of International Money And Finance 14, 3-26.
Lothian, James R., and Taylor, Mark P., 1996, Real Exchange Rate Behavior: The Recent Float
from the Perspective of the Past Two Centuries, Journal of Political Economy 104, 488-
509.
Newey, Whitney K., and West, Kenneth D., 1987, A Simple, Positive Semi-Definite,
Heteroskedasticity and Autocorrelation Consistent Covariance Matrix, Econometrica 55,
703-08.
27
Pixley and Abell Bullion Brokers, 1933, A Table Showing the Monthly Fluctuations, in London,
in the Price of Bar-Silver per Oz. Std. From January 1833 to December 1933, London.
Rose, A. K., 1995, After the Deluge: Do Fixed Exchange Rates Allow Inter-temporal Volatility
Tradeoffs?, International Journal of Financial Economics 1, 47-54.
Tuniolo, Gianni, Conte, Leandro, and Giovanni Vecchi, 2002, Monetary union, institutions, and
financial market integration: Italy, 1862-1905, unpublished Universitá di Roma working
paper (October).
Willis, Henry Parker, 1901, A History of the Latin Monetary Union, Chicago: University of
Chicago Press.
28
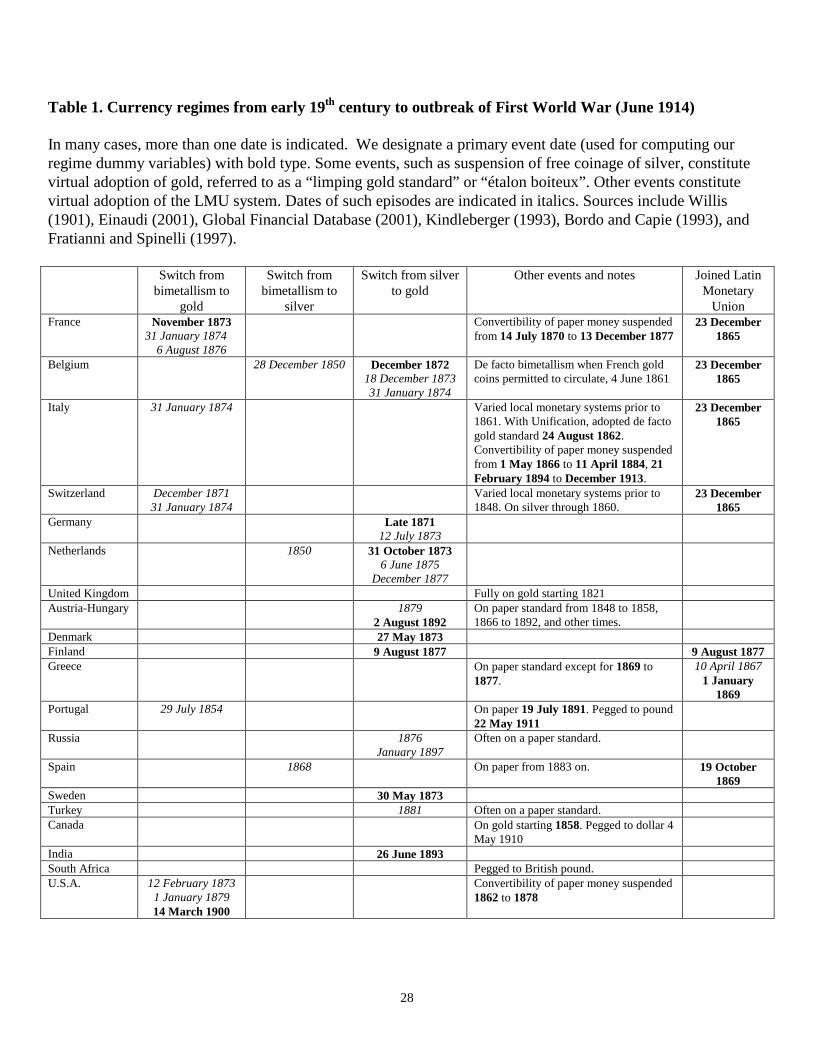
Table 1. Currency regimes from early 19th century to outbreak of First World War (June 1914) In many cases, more than one date is indicated. We designate a primary event date (used for computing our regime dummy variables) with bold type. Some events, such as suspension of free coinage of silver, constitute virtual adoption of gold, referred to as a “limping gold standard” or “étalon boiteux”. Other events constitute virtual adoption of the LMU system. Dates of such episodes are indicated in italics. Sources include Willis (1901), Einaudi (2001), Global Financial Database (2001), Kindleberger (1993), Bordo and Capie (1993), and Fratianni and Spinelli (1997). Switch from
bimetallism to gold
Switch from bimetallism to
silver
Switch from silver to gold
Other events and notes Joined Latin Monetary
Union France November 1873
31 January 1874 6 August 1876
Convertibility of paper money suspended from 14 July 1870 to 13 December 1877
23 December 1865
Belgium 28 December 1850 December 1872 18 December 1873 31 January 1874
De facto bimetallism when French gold coins permitted to circulate, 4 June 1861
23 December 1865
Italy 31 January 1874 Varied local monetary systems prior to 1861. With Unification, adopted de facto gold standard 24 August 1862. Convertibility of paper money suspended from 1 May 1866 to 11 April 1884, 21 February 1894 to December 1913.
23 December 1865
Switzerland December 1871 31 January 1874
Varied local monetary systems prior to 1848. On silver through 1860.
23 December 1865
Germany Late 1871 12 July 1873
Netherlands 1850 31 October 1873 6 June 1875
December 1877
United Kingdom Fully on gold starting 1821 Austria-Hungary 1879
2 August 1892 On paper standard from 1848 to 1858, 1866 to 1892, and other times.
Denmark 27 May 1873 Finland 9 August 1877 9 August 1877 Greece On paper standard except for 1869 to
1877. 10 April 1867
1 January 1869
Portugal 29 July 1854 On paper 19 July 1891. Pegged to pound 22 May 1911
Russia 1876 January 1897
Often on a paper standard.
Spain 1868 On paper from 1883 on. 19 October 1869
Sweden 30 May 1873 Turkey 1881 Often on a paper standard. Canada On gold starting 1858. Pegged to dollar 4
May 1910
India 26 June 1893 South Africa Pegged to British pound. U.S.A. 12 February 1873
1 January 1879 14 March 1900
Convertibility of paper money suspended 1862 to 1878

29
Table 2. Summary of data This table summarizes the span of our data. The starting point is January 1822 and the ending point is June 1914 for monthly bond and bill data and 1914 for annual inflation and trade data, yielding maximum possible observations of 1110 and 93 respectively. “All” indicates that the particular series spans the entire period. For Germany, “H” indicates Hamburg and “B” Berlin. Number in square brackets indicates approximate number of observations for those series that are neither complete nor empty. A few irregular missing values also occur for some series, as is evident in the number of observations reported for subsequent tests.
Monthly exchange rate with pound
Monthly exchange rate with U.S. dollar
Monthly government bond yield Monthly private bill yield (3 month)
Annual Wholesale Price Index
Annual Consumer Price Index
Annual Imports and Exports
France
All All 7/1822 to 3/1833, 3/1844 to 5/1846, 10/1847 on [957]
8/1860 on [648] 1840 on [74] All
Belgium 1/1830 on [1015] 6/1832 to 1/1859, 1/1885 to 12/1897, 1/1911 on [518]
7/1848 on [793] 1835 on [79] 1846 on [68]
Italy Thru 12/1899 All 3/1863 on [616] 1861 on [53] 1861 on [53] Switzerland All All
Germany
H: thru 2/1873 H: thru 12/1872 7/1872 on
7/1822 to 3/1826, 1/1870 on [579]
H: 1/1854 –12/1899 spliced to
B: 1/1900 on [726]
All
All
Netherlands
All All 10/1831 to 6/1870, 4/1873 to 12/1873, 1/1875 to 3/1880, 8/1882 on [920]
7/1860 on [649] 1846 on [68]
United Kingdom All All All All All All Austria-Hungary thru 12/1899 All 7/1860 on [649] 1831 on [83]
Denmark
1/1864 on [607] 7/1822 to 9/1858, 1/1878 on [872] All 1841 on [73]
Finland 4/1860 on [652] All Greece 3/1863 – 5/1880, 2/1881 on [608]
Portugal All All 11/1823 – 12/1902, 1/1904 on [1075] 1865 on [49] Russia thru 12/1899 All 9/1822 on [1102] All Spain All All 8/1822 on [1103] All All
Sweden All 1860 on [54] 1830 on [84] 1832 on [82] Turkey 1/1826 on [1063] 4/1855 on [711] Canada 1/1858 on [679] 8/1855 on [707] All 1832 on [82] India 7/1822 on [1105] All 1832 on [82]
South Africa 1/1844 on [835] 12/1860 on [643] 1826 on [88] U.S.A.
All 1/1849 to 12/1857, 1/1861 on [750] 12/1835 on [944] All All All
30
Table 3. Volatility over LMU, gold standard, and other time periods This table summarizes difference-in-means tests for squared values of interest rates, bond yields, inflation, and trade across LMU, gold standard, and other time periods. Interest rates are monthly first differences of short maturity private bill yields, bond yields are monthly first differences of government bond yields, inflation is annual log difference of consumer or producer price indexes, and imports plus exports are annual log differences of the sum of those two indicators. Maximum time period is 1822 to June 1914, with data availability indicated in Table 2.
31
Table 3 continued. Panel A: Comparing gold standard and non gold standard periods Private Bill Yields Bond Yields Inflation Imports plus Exports
Nobs Average square
Nobs Average square
Nobs Average square
Nobs Average square
France Not on gold 207 0.291 515 0.067 37 5.915 55 127.940 On gold 439 0.178 439 0.002 37 2.332 36 37.430 T-test 2.110 2.600 1.960 2.110 Belgium Not on gold 292 0.257 319 0.012 37 33.131 26 174.310 On gold 499 0.176 196 0.002 42 23.196 41 151.090 T-test 1.180 43.660 0.850 0.230 Italy Not on gold 491 0.082 42 40.478 42 63.790 On gold 124 0.009 11 8.258 10 90.010 T-test 1.660 1.450 -0.650 Greece Not on gold 499 1.596 On gold 107 8.148 T-test -6.150 Finland Not on gold 55 244.510 On gold 36 106.890 T-test 1.840 Sweden Not on gold 43 19.709 41 209.590 On gold 41 18.251 40 80.220 T-test 0.200 2.300 Denmark Not on gold 433 0.018 51 38.629 32 294.730 On gold 437 0.001 41 15.521 40 53.870 T-test 5.450 2.340 2.510 Germany Not on gold 215 0.892 67 0.031 49 156.530 On gold 510 0.343 510 0.000 43 19.333 T-test 4.480 1.760 3.190 Austria Not on gold 385 0.171 61 170.900 On gold 262 0.096 21 35.590 T-test 2.670 0.960 India Not on gold 856 0.006 61 115.440 On gold 253 0.001 20 65.120 T-test 3.850 1.210 Netherlands Not on gold 159 0.410 470 0.026 27 54.380 On gold 488 0.117 440 0.002 40 32.650 T-test 5.380 3.140 1.400 Portugal Not on gold 592 0.391 20 49.800 On gold 482 0.680 28 66.500 T-test -0.690 -0.800 US Not on gold 768 3.459 576 0.011 78 38.293 78 274.820 On gold 172 0.308 172 0.001 14 7.301 13 59.250 T-test 2.280 2.460 1.580 1.280
32
Table 3 continued. Panel B: Comparing LMU and non LMU periods Private Bill Yields Bond Yields Inflation Imports plus Exports Nobs Average
square Nobs Average
square Nobs Average
square Nobs Average
square France Not in LMU 63 0.384 371 0.087 25 6.556 43 151.680 In LMU 583 0.196 583 0.005 49 2.883 48 38.790 T-test 2.250 2.370 1.900 2.730 Belgium Not in LMU 208 0.119 319 0.012 30 38.393 19 182.400 In LMU 583 0.236 196 0.002 49 21.394 48 151.270 T-test -1.560 3.660 1.420 0.770 Italy Not in LMU 32 0.016 4 27.752 4 36.650 In LMU 583 0.070 49 34.283 48 71.520 T-test -2.84 -0.190 -0.580 Greece Not in LMU 69 8.654 In LMU 537 1.995 T-test 5.160 Spain Not in LMU 437 0.018 47 260.760 In LMU 433 0.001 44 114.560 T-test 5.450 2.000 Finland Not in LMU 45 197.150 In LMU 36 81.406
T-test 1.840
33
Table 4. Regressions relating interest rates, bond yields, inflation, and trade to those of France Interest rates are first differences of short maturity private bill yields, bond yields are first differences of government bond yields, inflation is the log difference of consumer or producer price indexes, and imports plus exports is the log difference of the sum of imports and exports in local currency. Maximum time period is 1822 to June 1914 with data availability indicated in Table 2. Some specifications include slope dummy terms to isolate periods when both the country and France were following the LMU or the gold standard. T statistics are reported to the right of each estimated coefficient. In some cases, regressions with regime slope dummy terms could not be estimated because the country did not change standards, changes in standards were too ambiguous to quantify, or the country’s data is incomplete and, therefore, does not span more than one regime. Panel A: Private bill yields Nobs Constant Slope on France Slope on
France * Gold dummy
Slope on France *
LMU dummy
Adjusted R-squared
Belgium 646 -0.002 -0.087 0.224 5.443 0.044 U.S. 644 -0.015 -0.321 0.175 1.743 0.005 Austria 646 -0.002 -0.105 0.178 5.710 0.048 Germany 646 0.002 0.092 0.508 9.355 0.120 Netherlands 646 -0.002 -0.097 0.181 5.022 0.038 U.K. 646 -0.002 -0.068 0.410 7.356 0.078 Belgium 646 -0.001 -0.064 0.411 6.647 -0.330 -4.013 0.067 U.S. 644 -0.015 -0.318 0.149 1.355 0.154 0.573 0.005 Austria 646 -0.002 -0.112 0.166 4.464 0.039 0.576 0.049 Germany 646 0.003 0.103 0.616 7.486 -0.191 -1.741 0.124 Netherlands 646 -0.001 -0.076 0.329 6.087 -0.262 -3.651 0.057 U.K. 646 -0.001 -0.045 0.650 7.780 -0.426 -3.830 0.098 Belgium 646 -0.002 -0.110 0.379 3.855 -0.188 -1.734 0.048
34
Table 4 continued. Panel B: Bond yields Nobs constant Slope on France Slope on
France * Gold dummy
Slope on France *
LMU dummy
Adjusted R-squared
Belgium 366 -0.002 -0.500 0.048 2.619 0.019 Italy 615 -0.004 -0.413 1.446 10.071 0.142 Greece 606 0.010 0.149 5.304 5.457 0.047 Spain 953 0.012 0.258 0.304 1.215 0.002 Canada 706 -0.002 -0.782 0.033 0.772 0.001 Denmark 721 -0.001 -0.247 0.091 5.081 0.035 Germany 577 -0.001 -0.453 0.067 2.022 0.007 India 954 0.000 0.048 0.047 4.121 0.018 Netherlands 767 -0.001 -0.272 0.205 9.643 0.108 Portugal 925 -0.010 -0.420 0.203 1.599 0.003 South Africa 642 -0.001 -0.311 0.151 4.470 0.030 U.S. 748 -0.003 -0.984 0.054 1.437 0.003 Turkey 710 -0.004 -0.217 1.779 7.411 0.072 Russia 606 0.010 0.149 5.304 5.457 0.047 U.K. 954 0.000 -0.363 0.063 8.936 0.077 Belgium 366 -0.002 -0.484 0.047 2.555 0.071 0.419 0.019 Italy 615 -0.005 -0.496 1.509 10.033 -0.699 -1.393 0.145 Denmark 721 -0.001 -0.263 0.093 5.137 -0.095 -0.766 0.035 Germany 577 -0.001 -0.451 0.066 1.781 0.006 0.072 0.007 India 954 0.000 0.061 0.047 4.134 -0.051 -0.346 0.018 Netherlands 767 -0.001 -0.278 0.206 9.572 -0.037 -0.247 0.108 Portugal 925 -0.009 -0.368 0.171 1.338 2.025 1.994 0.007 U.S. 748 -0.003 -0.944 0.057 1.506 -0.126 -0.541 0.003 U.K. 954 0.000 -0.339 0.062 8.698 0.054 1.064 0.078 Belgium 366 -0.002 -0.484 0.047 2.555 0.071 0.419 0.019 Italy 615 -0.004 -0.407 0.911 0.968 0.548 0.575 0.142 Greece 606 0.008 0.129 11.695 5.356 -7.939 -3.262 0.064 Spain 953 0.013 0.271 0.229 0.884 1.194 1.161 0.003
35
Table 4 continued. Panel C: Inflation Nobs constant Slope on France Slope on
France * Gold dummy
Slope on France *
LMU dummy
Adjusted R-squared
Belgium 74 -0.351 -0.608 1.068 3.754 0.164 Italy 53 0.462 0.562 -0.382 -0.785 0.012 Sweden 74 0.292 0.557 0.604 2.343 0.071 Denmark 74 0.034 0.067 0.992 3.997 0.182 Germany 74 0.735 0.721 1.603 3.192 0.124 U.S. 74 0.586 0.966 0.465 1.555 0.033 U.K. 74 -0.546 -0.942 1.202 4.214 0.198 Belgium 74 -0.360 -0.618 1.146 3.397 -0.271 -0.433 0.166 Italy 53 0.449 0.538 -0.343 -0.592 -0.144 -0.131 0.012 Sweden 74 0.278 0.529 0.734 2.412 -0.457 -0.811 0.079 Denmark 74 0.020 0.039 1.127 3.847 -0.472 -0.870 0.190 Germany 74 0.712 0.696 1.826 3.076 -0.781 -0.711 0.130 U.S. 74 0.595 0.968 0.480 1.489 -0.112 -0.132 0.033 U.K. 74 -0.563 -0.971 1.368 4.068 -0.583 -0.936 0.208 Belgium 74 -0.358 -0.619 1.289 3.337 -0.476 -0.848 0.172 Italy 53 0.624 0.754 -2.736 -1.411 2.492 1.253 0.042
36
Table 4 continued. Panel D: Imports plus Exports Nobs constant Slope on France Slope on
France * Gold dummy
Slope on France *
LMU dummy
Adjusted R-squared
Belgium 67 2.792 2.066 0.606 4.406 0.230 Italy 52 1.297 1.299 0.701 4.481 0.286 Finland 91 3.094 2.300 0.540 3.852 0.143 Spain 91 1.587 1.180 0.425 3.034 0.094 Canada 46 3.169 2.137 0.764 3.258 0.194 Sweden 81 2.776 2.265 0.518 4.032 0.171 Denmark 72 2.653 1.903 0.513 3.522 0.151 Austria 82 0.971 0.939 0.768 7.220 0.395 India 81 3.867 3.575 0.171 1.508 0.028 Netherlands 67 4.725 8.421 0.025 0.430 0.003 Portugal 48 1.500 1.332 0.299 1.655 0.056 South Africa 83 5.678 2.616 0.259 1.153 0.016 Russia 91 1.813 1.106 0.536 3.142 0.100 U.S. 91 2.987 1.762 0.213 1.206 0.016 U.K. 91 1.371 1.635 0.515 5.891 0.281 Belgium 67 2.627 1.928 0.546 3.628 0.311 0.964 0.241 Italy 52 0.821 0.819 0.838 4.999 -0.848 -1.952 0.338 Finland 91 2.978 2.200 0.493 3.281 0.319 0.881 0.150 Canada 46 3.114 2.086 0.504 1.161 0.359 0.714 0.204 Sweden 81 2.727 2.204 0.496 3.553 0.129 0.409 0.172 Denmark 72 2.632 1.862 0.504 3.142 0.046 0.134 0.151 Austria 82 1.103 1.054 0.797 7.169 -0.276 -0.902 0.401 India 81 3.643 3.312 0.136 1.156 0.359 1.080 0.042 Netherlands 67 4.720 8.281 0.023 0.360 0.010 0.073 0.003 Portugal 48 1.460 1.293 0.225 1.131 0.387 0.899 0.073 U.S. 91 2.859 1.668 0.186 1.015 0.357 0.605 0.020 U.K. 91 1.316 1.557 0.492 5.251 0.150 0.665 0.284 Belgium 67 2.557 1.888 0.502 3.202 0.388 1.349 0.251 Italy 52 1.402 1.390 0.354 0.819 0.387 0.861 0.297 Finland 91 2.978 2.200 0.493 3.281 0.319 0.881 0.150 Spain 91 1.489 1.103 0.363 2.340 0.303 0.944 0.103
37
Table 5. Regressions relating interest rates, bond yields, inflation, and trade to those of Great Britain Interest rates are first differences of short maturity private bill yields, bond yields are first differences of government bond yields, inflation is the log difference of consumer or producer price indexes, and imports plus exports is the log difference of the sum of imports and exports in local currency.. Maximum time period is 1822 to June 1914 with data availability indicated in Table 2. Specifications include slope dummy terms to isolate periods when the country was following the LMU or on the gold standard. T-statistics are reported to the right of each coefficient estimate. In some cases, regressions with regime slope dummy terms could not be estimated because the country did not change standards, changes in standards were too ambiguous to quantify, or the country’s data is incomplete and, therefore, does not span more than one regime. Great Britain was on the gold standard throughout this time period. Panel A: Private bill yields Nobs constant Slope on UK Slope on UK
* Gold dummy
Slope on UK * LMU dummy
Adjusted R-squared
France 646 0.000 -0.003 0.268 7.310 -0.153 -2.991 0.090 Belgium 791 -0.004 -0.243 0.130 3.825 0.018 0.386 0.045 U.S. 940 -0.013 -0.234 0.075 0.854 0.261 1.014 0.003 Austria 647 -0.002 -0.107 0.048 1.934 0.105 2.166 0.026 Germany 725 0.002 0.079 0.493 9.354 -0.313 -4.459 0.125 Netherlands 647 0.001 0.034 0.097 2.371 -0.055 -1.068 0.011 France 646 -0.001 -0.054 0.389 6.174 -0.092 -1.605 -0.183 -2.363 0.098 Belgium 791 -0.003 -0.208 0.047 1.169 -0.187 -2.673 0.287 3.879 0.063
38
Table 5 continued. Panel B: Bond yields Nobs constant Slope on UK Slope on UK
* Gold dummy
Slope on UK * LMU dummy
Adjusted R-squared
France 954 -0.001 -0.222 1.231 8.936 0.077 Belgium 515 -0.002 -0.524 0.358 3.575 0.024 Italy 615 -0.006 -0.578 1.354 3.932 0.025 Greece 606 0.001 0.014 10.136 4.596 0.034 Spain 1102 -0.001 -0.030 4.981 4.935 0.022 Canada 706 -0.003 -0.815 0.360 3.709 0.019 Denmark 870 -0.001 -0.266 0.778 11.490 0.132 Germany 576 -0.001 -0.581 0.450 6.841 0.075 India 1109 0.000 -0.203 0.639 14.503 0.160 Netherlands 916 -0.002 -0.463 0.924 9.140 0.084 Portugal 1074 0.000 -0.012 1.787 3.324 0.010 South Africa 642 -0.001 -0.425 0.309 4.151 0.026 U.S. 748 -0.004 -1.048 -0.003 -0.029 0.000 Turkey 710 -0.006 -0.316 1.602 2.808 0.011 Russia 606 0.001 0.014 10.136 4.596 0.034 France 954 -0.001 -0.126 1.558 9.954 -1.368 -4.270 0.095 Belgium 515 -0.002 -0.528 0.368 3.285 -0.048 -0.192 0.024 Italy 615 -0.006 -0.600 1.467 3.852 -0.623 -0.698 0.025 Greece 606 0.008 0.120 7.222 3.124 26.510 3.800 0.056 Denmark 870 0.000 -0.160 0.994 13.063 -0.912 -5.828 0.165 Germany 576 -0.001 -0.581 0.874 9.139 -0.766 -5.956 0.129 India 1109 0.000 -0.016 0.728 15.385 -0.593 -4.852 0.177 Netherlands 916 -0.002 -0.401 1.218 9.935 -0.886 -4.164 0.101 Portugal 1074 0.000 -0.012 1.795 2.798 -0.028 -0.024 0.010 U.S. 748 -0.004 -1.047 -0.005 -0.043 0.007 0.033 0.000 France 954 -0.001 -0.138 1.582 9.747 -1.044 -1.594 -0.349 -0.569 0.095 Italy 615 -0.006 -0.593 1.094 0.779 -0.652 -0.725 0.403 0.276 0.026 Greece 606 0.009 0.143 32.376 5.329 30.622 4.418 -29.263 -4.466 0.087
39
Table 5 continued. Panel C: Inflation Nobs constant Slope on UK Slope on UK
* Gold dummy
Slope on UK * LMU dummy
Adjusted R-squared
France 74 0.386 1.831 0.188 4.035 -0.079 -0.913 0.207 Belgium 79 0.055 0.111 0.549 4.918 0.026 0.130 0.327 Italy 53 0.399 0.504 0.422 1.952 -0.427 -1.116 0.071 Sweden 84 0.577 1.365 0.333 3.699 0.134 0.787 0.231 Germany 92 1.125 1.195 0.650 3.436 -0.189 -0.500 0.134 U.S. 92 0.485 0.799 0.235 2.240 0.088 0.144 0.056 France 74 0.377 1.779 0.171 3.371 -0.168 -1.210 0.105 0.822 0.215 Belgium 79 0.042 0.084 0.540 4.624 -0.086 -0.199 0.121 0.289 0.328 Italy 53 0.424 0.534 0.725 1.668 -0.326 -0.809 -0.403 -0.804 0.083
40
Table 5 continued. Panel D: Imports plus Exports Nobs constant Slope on U.K. Slope on U.K.
* Gold dummy
Slope on UK * LMU dummy
Adjusted R-squared
France 91 1.575 1.832 0.545 5.891 0.281 Belgium 67 2.428 1.694 0.708 3.938 0.193 Italy 52 2.105 1.785 0.345 1.729 0.056 Finland 91 3.867 2.736 0.320 2.103 0.047 Spain 91 0.763 0.629 0.725 5.548 0.257 Canada 46 2.417 1.645 1.035 3.921 0.259 Sweden 81 2.181 1.835 0.709 5.048 0.244 Denmark 72 2.162 1.529 0.676 3.799 0.171 Austria 82 1.983 1.617 0.548 3.790 0.152 India 81 3.891 3.527 0.167 1.281 0.020 Netherlands 67 4.637 7.997 0.051 0.704 0.008 Portugal 48 1.146 1.008 0.427 2.147 0.091 South Africa 83 4.934 2.284 0.514 2.025 0.048 Russia 91 1.535 0.964 0.663 3.868 0.144 U.S. 91 0.876 0.609 0.923 5.958 0.285 France 91 1.477 1.701 0.517 5.256 0.215 0.863 0.287 Belgium 67 2.421 1.673 0.700 3.389 0.028 0.077 0.193 Italy 52 1.786 1.509 0.471 2.205 -0.840 -1.524 0.099 Finland 91 3.399 2.460 0.185 1.181 1.023 2.584 0.115 Sweden 81 2.064 1.744 0.621 4.067 0.454 1.426 0.263 Denmark 72 2.108 1.482 0.613 3.035 0.249 0.666 0.176 Austria 82 2.021 1.610 0.555 3.676 -0.070 -0.164 0.153 India 81 3.633 3.225 0.130 0.970 0.419 1.092 0.035 Netherlands 67 4.633 7.919 0.046 0.545 0.021 0.140 0.008 Portugal 48 1.179 1.027 0.322 1.045 0.170 0.451 0.095 U.S. 91 0.846 0.579 0.919 5.776 0.085 0.141 0.285 France 91 1.463 1.673 0.515 5.115 0.171 0.766 0.285 Belgium 67 2.360 1.624 0.662 3.067 0.133 0.386 0.194 Italy 52 2.105 1.763 0.348 0.694 -0.003 -0.006 0.056 Finland 91 3.399 2.460 0.185 1.181 1.023 2.584 0.115 Spain 91 0.488 0.400 0.652 4.673 0.458 1.410 0.273
41
Table 6. Purchasing Power Parity deviations over LMU, gold standard, and other time periods This table summarizes difference-in-means tests for the average value of annual deviations from Purchasing Power Parity (PPP) and for squared values of that deviation across LMU, gold standard, and other time periods. The PPP deviation is measured as the rate of change of the franc or pound value of a particular country minus the difference between the particular country’s inflation and franc or pound inflation. Maximum time period is 1822 to June 1914 with data availability indicated in Table 2. Nobs Average PPP deviation Average squared PPP deviation France Not on gold 37 -0.54 31.96 On gold 37 -0.40 16.75 T-test -0.12 1.69 Belgium Not on gold 37 0.45 33.00 On gold 42 0.00 20.75 T-test 0.38 1.51 Italy Not on gold 28 -0.21 79.94 On gold 10 -3.36 35.37 T-test 1.33 1.70 Sweden Not on gold 43 0.10 39.99 On gold 41 -0.74 19.97 T-test 0.71 2.09 Denmark Not on gold 9 0.52 16.70 On gold 41 -0.45 18.48 T-test 0.62 -0.22 Germany Not on gold 49 -0.85 144.84 On gold 2 -3.49 27.69 T-test 0.30 2.61 US Not on gold 78 -0.09 49.79 On gold 14 -0.58 7.63 T-test 0.25 5.10 France Not in LMU 25 -0.82 39.48 In LMU 49 -0.29 16.64 T-test -0.38 1.97 Belgium Not in LMU 30 0.14 37.83 In LMU 49 0.25 19.55 T-test -0.08 2.16 Italy Not in LMU 4 1.29 7.30 In LMU 34 -1.32 75.37 T-test 1.29 -3.60
42
Table 7. Regressions to assess gold standard and LMU credibility using spreads of bond yields over British bond yields
This table reports estimates of regressions of the bond yield spread (country bond yield minus British bond yield) on gold standard and LMU membership dummy variables, plus the average bond yield spread across all available countries. Maximum time period is 1822 to June 1914 with data availability indicated in Table 2. In some cases, regressions with regime slope dummy terms could not be estimated because the country did not change standards, changes in standards were too ambiguous to quantify, or the country’s data is incomplete and, therefore, does not span more than one regime. As a comparison to the intercepts reported here, the average spreads for British colonies that were continuously on gold were 0.97% for Canada and 1.21% for South Africa. For countries with poor data but tumultuous histories, average spreads were 13.62% for Greece, 8.53% for Spain, 2.80% for Turkey, and 1.69% for Russia. The time series average of the cross sectional average spread for all countries is 2.50%. T-statistics are reported to the right of each coefficient estimate. In Panel B, the third regression specification is not estimated for Belgium due to insufficient data. Panel A: Gold standard credibility Nobs constant Slope on gold
dummy Slope on
average bond yield spread
Adjusted R-squared
France 957 1.291 57.973 -0.901 -27.387 0.440 Belgium 518 1.460 81.930 -1.130 -39.207 0.749 Italy 616 2.864 34.466 -0.548 -2.960 0.014 Denmark 872 1.002 50.160 -0.135 -4.780 0.026 Germany 579 1.373 67.428 -0.548 -23.450 0.488 India 1110 0.922 77.591 -0.330 -13.260 0.137 Netherlands 920 1.122 70.070 -0.764 -31.879 0.525 Portugal 1075 3.505 44.309 -1.071 -5.851 0.031 U.S. 750 1.418 43.959 -1.205 -17.881 0.299 France 957 1.319 28.701 -0.917 -22.338 -0.006 -0.676 0.440 Belgium 518 1.131 21.976 -0.996 -29.279 0.132 6.778 0.769 Italy 616 0.241 3.311 0.774 8.031 0.883 43.657 0.760 Denmark 872 0.766 22.028 -0.007 -0.239 0.067 8.177 0.095 Germany 579 1.407 26.470 -0.571 -14.061 -0.007 -0.686 0.488 India 1110 0.740 33.158 -0.217 -8.138 0.053 9.540 0.203 Netherlands 920 0.840 26.177 -0.623 -23.319 0.088 10.010 0.572 Portugal 1075 3.452 24.119 -1.048 -5.508 0.016 0.448 0.031 U.S. 750 0.697 12.103 -0.726 -10.631 0.237 14.408 0.452
43
Table 7 continued. Panel B: LMU credibility Nobs Constant Slope on
LMU dummy
Slope on dummy
for LMU plus gold
Slope on dummy
for LMU without
gold
Slope on average
bond yield spread
Adjusted R-squared
France 957 1.211 37.602 -0.546 -13.235 0.155 Belgium 518 1.460 81.930 -1.130 -39.207 0.749
Italy 616 4.136 13.007 -1.461 -4.469 0.032
France 957 0.855 18.923 -0.446 -11.112 0.098 10.669 0.245 Belgium 518 1.131 21.976 -0.996 -29.279 0.132 6.778 0.769
Italy 616 1.295 7.293 -0.780 -4.614 0.823 41.275 0.744
France 957 1.330 29.593 -0.886 -21.923 0.355 6.742 -0.033 -3.224 0.466 Italy 616 1.113 6.588 -0.088 -0.492 -0.912 -5.688 0.876 44.307 0.772
44
Table 8. Regressions relating modern European interest rates, bond yields, inflation, and industrial production to Germany Interest rates are first differences of three-month interbank rates, bond yields are first differences of 10-year government bond yields, inflation is the log difference of consumer price indexes, and industrial production is the log difference. Time period is January 1979 to December 2000 and all data are monthly. Specifications include slope dummy terms to isolate the period between the Maastricht Treaty (February 1992) and the approval of the Euro Plan (May 1998), and the period thereafter. T-statistics are reported to the right of each coefficient estimate. A trend term (unreported) is included in all regressions to pick up the substantial drop in interest rates and inflation over the period studied. In Panel B, Greece is excluded due to insufficient data. Panel A: Interest rates Nobs constant Slope on
Germany Slope on
Germany * (199202-199804) dummy
Slope on Germany * (199805-200012) dummy
Adjusted R-squared
Non-Euro Denmark 263 -2.917 -0.122 0.176 0.996 0.015 0.019 0.569 0.498 0.006 Greece 191 65.661 0.289 0.003 0.001 -4.885 -0.931 0.451 0.063 0.007 Sweden 248 22.099 0.886 0.602 3.327 -2.251 -3.012 -0.155 -0.142 0.063 UK 263 4.307 0.335 0.124 1.299 -0.039 -0.093 0.465 0.754 0.011
Euro Austria 131 1.937 0.286 0.312 2.034 0.513 2.900 0.650 3.420 0.638 Belgium 263 5.232 0.450 0.281 3.260 -0.125 -0.329 0.674 1.212 0.052 Finland 167 1.114 0.043 0.210 0.724 0.667 1.289 0.769 1.127 0.047 France 263 17.111 1.241 0.205 2.001 -1.025 -2.270 0.876 1.325 0.040 Ireland 263 5.211 0.218 0.214 1.208 0.510 0.652 0.733 0.640 0.012 Italy 263 14.732 0.438 0.002 0.006 0.267 0.242 1.037 0.643 0.003 Netherlands 263 -7.350 -0.901 0.339 5.599 0.534 2.002 0.519 1.327 0.158 Portugal 215 35.898 0.653 0.901 1.261 -3.999 -2.686 0.406 0.198 0.035 Spain 263 6.470 0.327 -0.056 -0.384 -0.232 -0.358 1.139 1.200 0.006
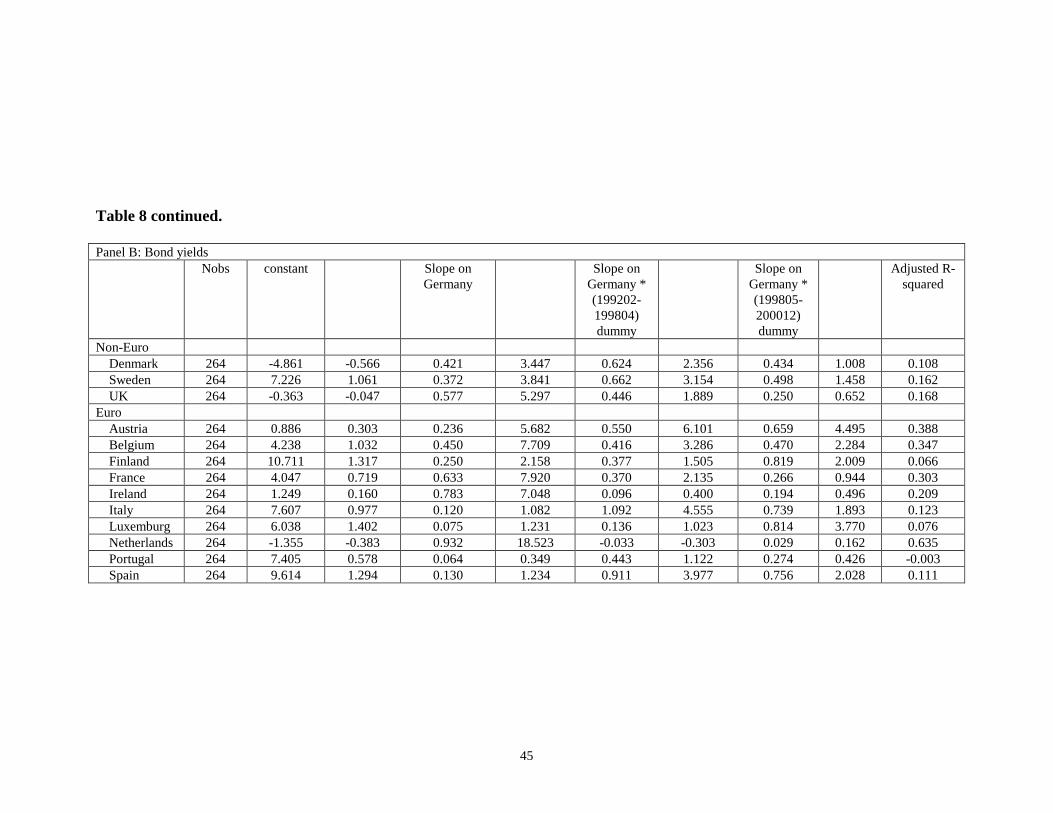
45
Table 8 continued. Panel B: Bond yields Nobs constant Slope on
Germany Slope on
Germany * (199202-199804) dummy
Slope on Germany * (199805-200012) dummy
Adjusted R-squared
Non-Euro Denmark 264 -4.861 -0.566 0.421 3.447 0.624 2.356 0.434 1.008 0.108 Sweden 264 7.226 1.061 0.372 3.841 0.662 3.154 0.498 1.458 0.162 UK 264 -0.363 -0.047 0.577 5.297 0.446 1.889 0.250 0.652 0.168
Euro Austria 264 0.886 0.303 0.236 5.682 0.550 6.101 0.659 4.495 0.388 Belgium 264 4.238 1.032 0.450 7.709 0.416 3.286 0.470 2.284 0.347 Finland 264 10.711 1.317 0.250 2.158 0.377 1.505 0.819 2.009 0.066 France 264 4.047 0.719 0.633 7.920 0.370 2.135 0.266 0.944 0.303 Ireland 264 1.249 0.160 0.783 7.048 0.096 0.400 0.194 0.496 0.209 Italy 264 7.607 0.977 0.120 1.082 1.092 4.555 0.739 1.893 0.123 Luxemburg 264 6.038 1.402 0.075 1.231 0.136 1.023 0.814 3.770 0.076 Netherlands 264 -1.355 -0.383 0.932 18.523 -0.033 -0.303 0.029 0.162 0.635 Portugal 264 7.405 0.578 0.064 0.349 0.443 1.122 0.274 0.426 -0.003 Spain 264 9.614 1.294 0.130 1.234 0.911 3.977 0.756 2.028 0.111
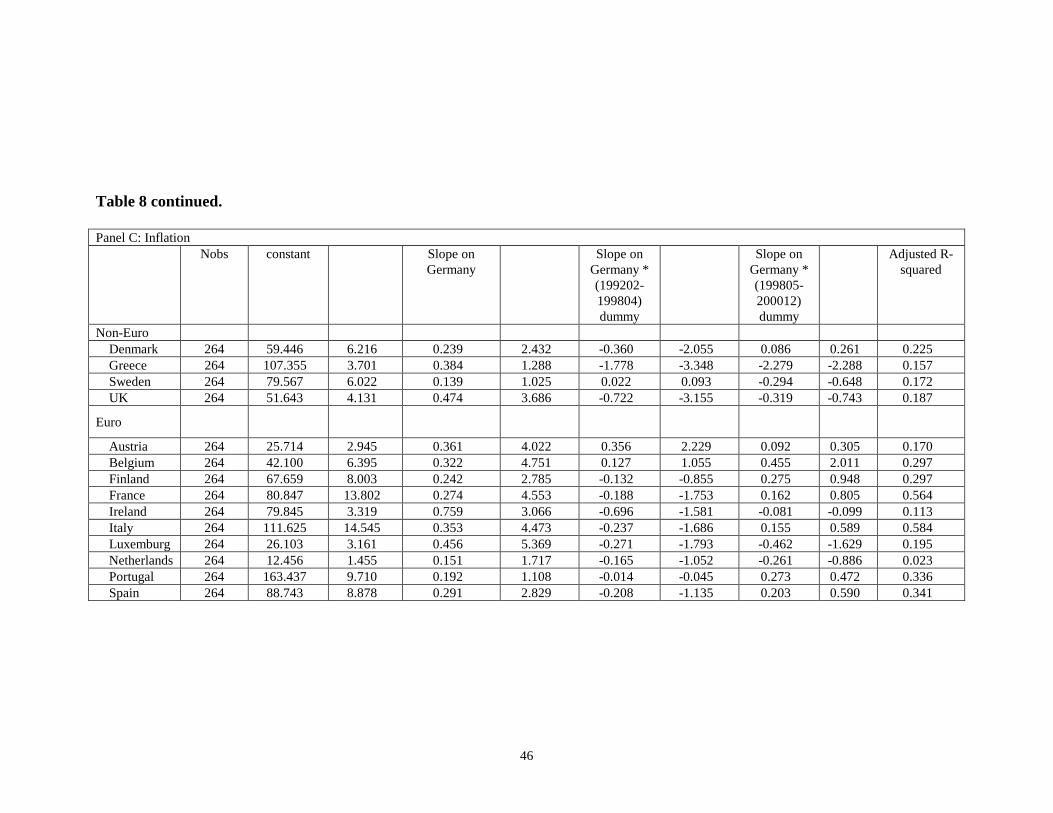
46
Table 8 continued. Panel C: Inflation Nobs constant Slope on
Germany Slope on
Germany * (199202-199804) dummy
Slope on Germany * (199805-200012) dummy
Adjusted R-squared
Non-Euro Denmark 264 59.446 6.216 0.239 2.432 -0.360 -2.055 0.086 0.261 0.225 Greece 264 107.355 3.701 0.384 1.288 -1.778 -3.348 -2.279 -2.288 0.157 Sweden 264 79.567 6.022 0.139 1.025 0.022 0.093 -0.294 -0.648 0.172 UK 264 51.643 4.131 0.474 3.686 -0.722 -3.155 -0.319 -0.743 0.187
Euro
Austria 264 25.714 2.945 0.361 4.022 0.356 2.229 0.092 0.305 0.170 Belgium 264 42.100 6.395 0.322 4.751 0.127 1.055 0.455 2.011 0.297 Finland 264 67.659 8.003 0.242 2.785 -0.132 -0.855 0.275 0.948 0.297 France 264 80.847 13.802 0.274 4.553 -0.188 -1.753 0.162 0.805 0.564 Ireland 264 79.845 3.319 0.759 3.066 -0.696 -1.581 -0.081 -0.099 0.113 Italy 264 111.625 14.545 0.353 4.473 -0.237 -1.686 0.155 0.589 0.584 Luxemburg 264 26.103 3.161 0.456 5.369 -0.271 -1.793 -0.462 -1.629 0.195 Netherlands 264 12.456 1.455 0.151 1.717 -0.165 -1.052 -0.261 -0.886 0.023 Portugal 264 163.437 9.710 0.192 1.108 -0.014 -0.045 0.273 0.472 0.336 Spain 264 88.743 8.878 0.291 2.829 -0.208 -1.135 0.203 0.590 0.341
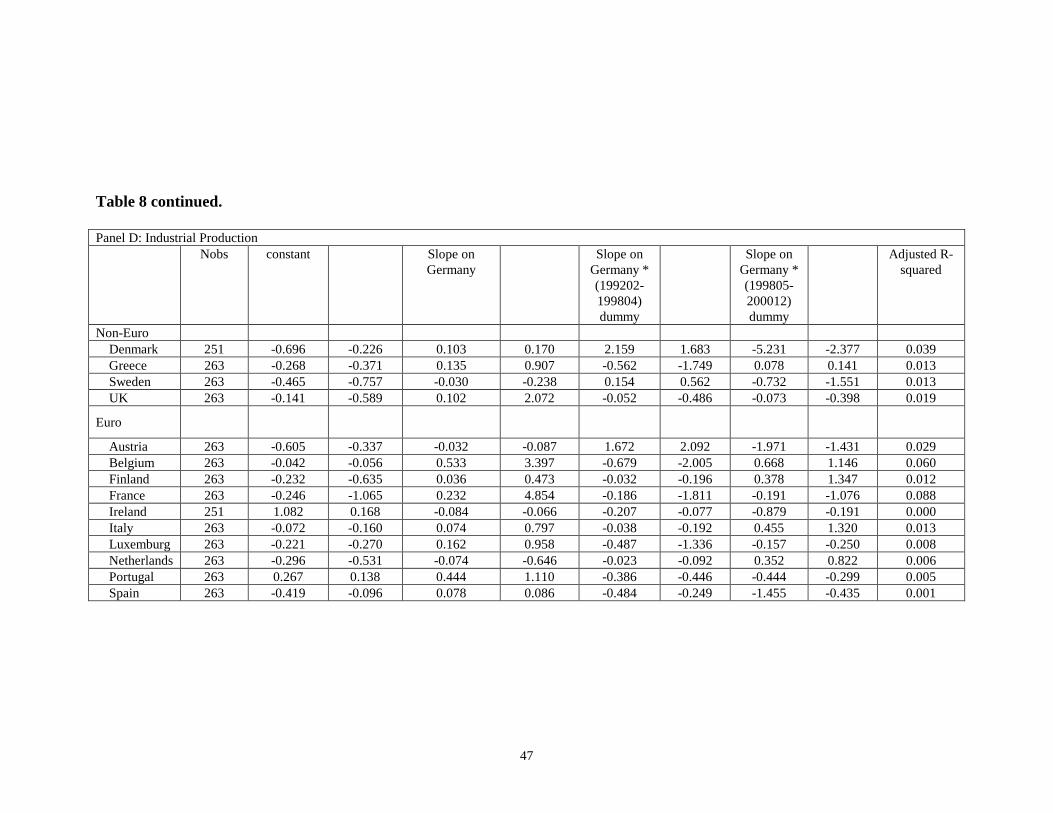
47
Table 8 continued. Panel D: Industrial Production Nobs constant Slope on
Germany Slope on
Germany * (199202-199804) dummy
Slope on Germany * (199805-200012) dummy
Adjusted R-squared
Non-Euro Denmark 251 -0.696 -0.226 0.103 0.170 2.159 1.683 -5.231 -2.377 0.039 Greece 263 -0.268 -0.371 0.135 0.907 -0.562 -1.749 0.078 0.141 0.013 Sweden 263 -0.465 -0.757 -0.030 -0.238 0.154 0.562 -0.732 -1.551 0.013 UK 263 -0.141 -0.589 0.102 2.072 -0.052 -0.486 -0.073 -0.398 0.019
Euro
Austria 263 -0.605 -0.337 -0.032 -0.087 1.672 2.092 -1.971 -1.431 0.029 Belgium 263 -0.042 -0.056 0.533 3.397 -0.679 -2.005 0.668 1.146 0.060 Finland 263 -0.232 -0.635 0.036 0.473 -0.032 -0.196 0.378 1.347 0.012 France 263 -0.246 -1.065 0.232 4.854 -0.186 -1.811 -0.191 -1.076 0.088 Ireland 251 1.082 0.168 -0.084 -0.066 -0.207 -0.077 -0.879 -0.191 0.000 Italy 263 -0.072 -0.160 0.074 0.797 -0.038 -0.192 0.455 1.320 0.013 Luxemburg 263 -0.221 -0.270 0.162 0.958 -0.487 -1.336 -0.157 -0.250 0.008 Netherlands 263 -0.296 -0.531 -0.074 -0.646 -0.023 -0.092 0.352 0.822 0.006 Portugal 263 0.267 0.138 0.444 1.110 -0.386 -0.446 -0.444 -0.299 0.005 Spain 263 -0.419 -0.096 0.078 0.086 -0.484 -0.249 -1.455 -0.435 0.001
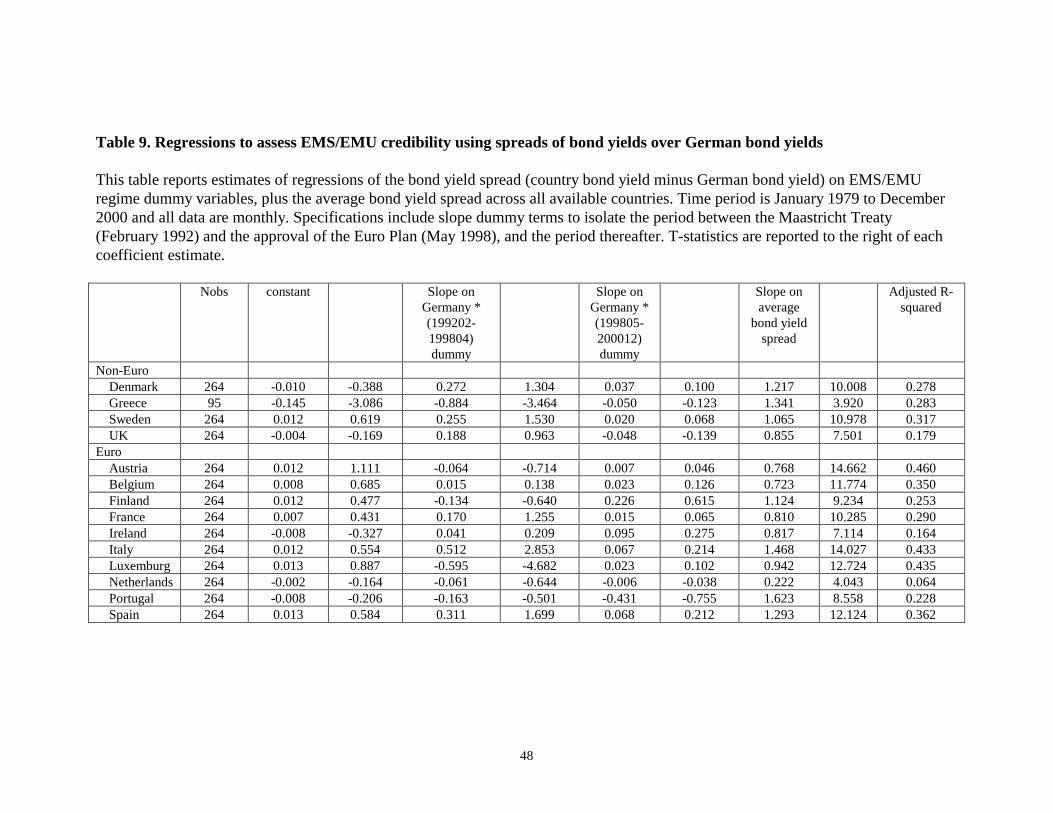
48
Table 9. Regressions to assess EMS/EMU credibility using spreads of bond yields over German bond yields This table reports estimates of regressions of the bond yield spread (country bond yield minus German bond yield) on EMS/EMU regime dummy variables, plus the average bond yield spread across all available countries. Time period is January 1979 to December 2000 and all data are monthly. Specifications include slope dummy terms to isolate the period between the Maastricht Treaty (February 1992) and the approval of the Euro Plan (May 1998), and the period thereafter. T-statistics are reported to the right of each coefficient estimate. Nobs constant Slope on
Germany * (199202-199804) dummy
Slope on Germany * (199805-200012) dummy
Slope on average
bond yield spread
Adjusted R-squared
Non-Euro Denmark 264 -0.010 -0.388 0.272 1.304 0.037 0.100 1.217 10.008 0.278 Greece 95 -0.145 -3.086 -0.884 -3.464 -0.050 -0.123 1.341 3.920 0.283 Sweden 264 0.012 0.619 0.255 1.530 0.020 0.068 1.065 10.978 0.317 UK 264 -0.004 -0.169 0.188 0.963 -0.048 -0.139 0.855 7.501 0.179
Euro Austria 264 0.012 1.111 -0.064 -0.714 0.007 0.046 0.768 14.662 0.460 Belgium 264 0.008 0.685 0.015 0.138 0.023 0.126 0.723 11.774 0.350 Finland 264 0.012 0.477 -0.134 -0.640 0.226 0.615 1.124 9.234 0.253 France 264 0.007 0.431 0.170 1.255 0.015 0.065 0.810 10.285 0.290 Ireland 264 -0.008 -0.327 0.041 0.209 0.095 0.275 0.817 7.114 0.164 Italy 264 0.012 0.554 0.512 2.853 0.067 0.214 1.468 14.027 0.433 Luxemburg 264 0.013 0.887 -0.595 -4.682 0.023 0.102 0.942 12.724 0.435 Netherlands 264 -0.002 -0.164 -0.061 -0.644 -0.006 -0.038 0.222 4.043 0.064 Portugal 264 -0.008 -0.206 -0.163 -0.501 -0.431 -0.755 1.623 8.558 0.228 Spain 264 0.013 0.584 0.311 1.699 0.068 0.212 1.293 12.124 0.362
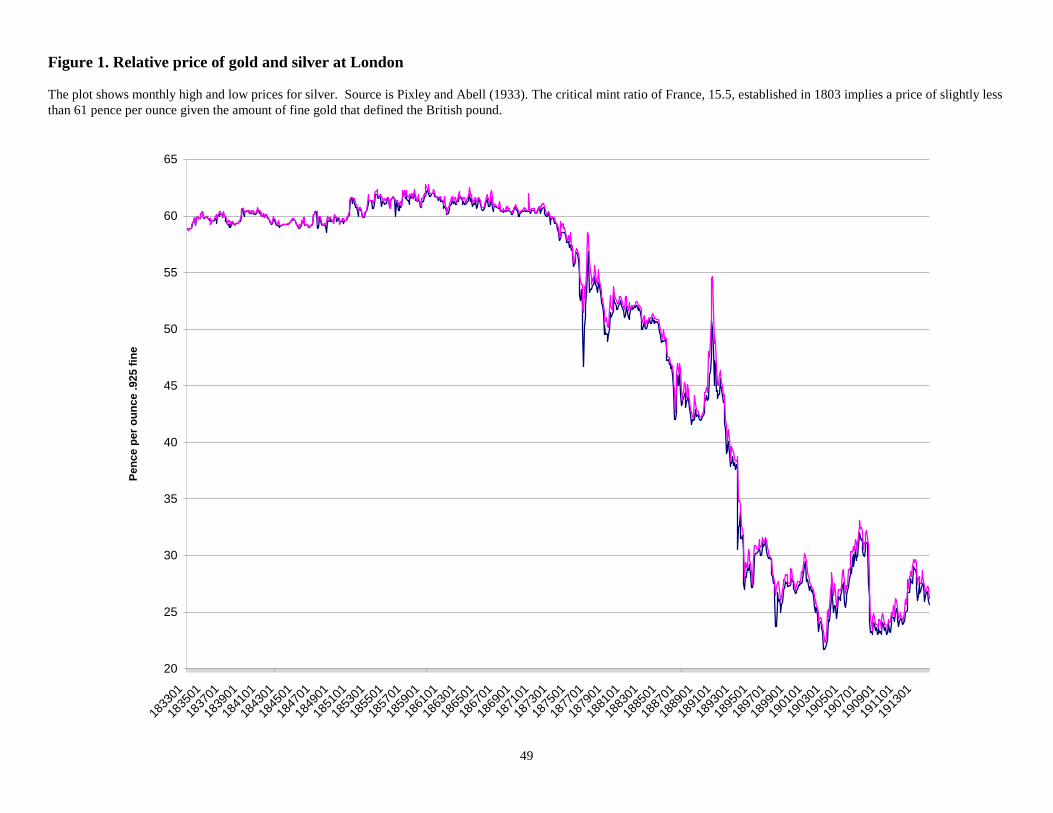
49
Figure 1. Relative price of gold and silver at London The plot shows monthly high and low prices for silver. Source is Pixley and Abell (1933). The critical mint ratio of France, 15.5, established in 1803 implies a price of slightly less than 61 pence per ounce given the amount of fine gold that defined the British pound.
20
25
30
35
40
45
50
55
60
6518
3301
1835
0118
3701
1839
0118
4101
1843
0118
4501
1847
0118
4901
1851
0118
5301
1855
0118
5701
1859
0118
6101
1863
0118
6501
1867
0118
6901
1871
0118
7301
1875
0118
7701
1879
0118
8101
1883
0118
8501
1887
0118
8901
1891
0118
9301
1895
0118
9701
1899
0119
0101
1903
0119
0501
1907
0119
0901
1911
0119
1301
Penc
e pe
r oun
ce .9
25 fi
ne
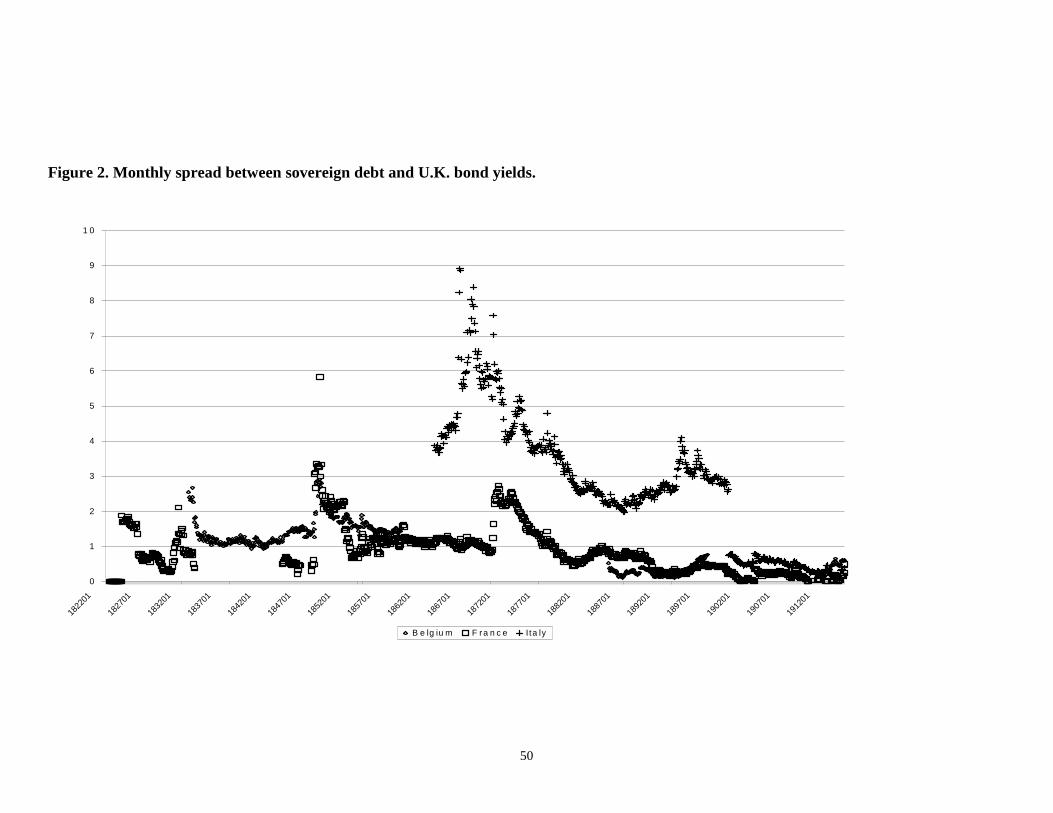
50
Figure 2. Monthly spread between sovereign debt and U.K. bond yields.
0
1
2
3
4
5
6
7
8
9
1 0
1822
01
1827
01
1832
01
1837
01
1842
01
1847
01
1852
01
1857
01
1862
01
1867
01
1872
01
1877
01
1882
01
1887
01
1892
01
1897
01
1902
01
1907
01
1912
01
B e lg iu m F ra n c e Ita ly
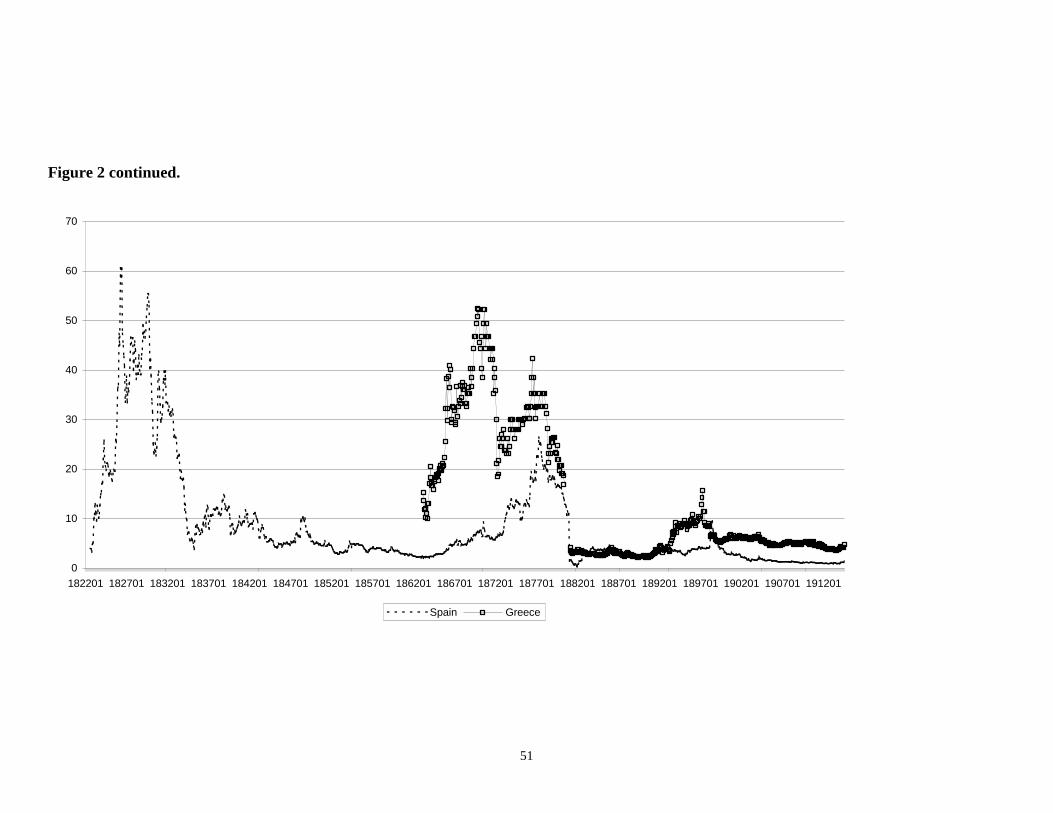
51
Figure 2 continued.
0
10
20
30
40
50
60
70
182201 182701 183201 183701 184201 184701 185201 185701 186201 186701 187201 187701 188201 188701 189201 189701 190201 190701 191201
Spain Greece