the large-scale impact of climate change to mississippi flood hazard
TRANSCRIPT

Drink. Water Eng. Sci., 6, 81–87, 2013www.drink-water-eng-sci.net/6/81/2013/doi:10.5194/dwes-6-81-2013© Author(s) 2013. CC Attribution 3.0 License.
History of Geo- and Space
SciencesOpen
Acc
ess
Advances in Science & ResearchOpen Access Proceedings
Drinking Water Engineering and Science
Open Access
Ope
n A
cces
s Earth System
Science
Data
Drinking Water Engineering and Science
DiscussionsOpe
n Acc
ess
Ope
n A
cces
s Earth System
Science
Data
Discu
ssionsThe large-scale impact of climate change to Mississippi
flood hazard in New Orleans
T. L. A. Driessen1 and M. van Ledden2
1Royal HaskoningDHV, Rivers, Deltas & Coasts, Nijmegen, the Netherlands2Royal HaskoningDHV, Rivers, Deltas & Coasts, Rotterdam, the Netherlands
Correspondence to:T. L. A. Driessen ([email protected])
Received: 1 June 2012 – Published in Drink. Water Eng. Sci. Discuss.: 5 July 2012Revised: 14 May 2013 – Accepted: 23 May 2013 – Published: 12 July 2013
Abstract. The objective of this paper was to describe the impact of climate change on the Mississippi Riverflood hazard in the New Orleans area. This city has a unique flood risk management challenge, heavily influ-enced by climate change, since it faces flood hazards from multiple geographical locations (e.g. Lake Pontchar-train and Mississippi River) and multiple sources (hurricane, river, rainfall). Also the low elevation and signif-icant subsidence rate of the Greater New Orleans area poses a high risk and challenges the water managementof this urban area. Its vulnerability to flooding became dramatically apparent during Hurricane Katrina in 2005with huge economic losses and a large number of casualties.
A SOBEK Rural 1DFLOW model was set up to simulate the general hydrodynamics. This model included thetwo important spillways that are operated during high flow conditions. A weighted multi-criteria calibrationprocedure was performed to calibrate the model for high flows. Validation for floods in 2011 indicated a rea-sonable performance for high flows and clearly demonstrated the influence of the spillways.
32 different scenarios were defined which included the relatively large sea level rise and the changing dischargeregime that is expected due to climate change. The impact of these scenarios on the water levels near New Or-leans were analysed by the hydrodynamic model. Results showed that during high flows New Orleans willnot be affected by varying discharge regimes, since the presence of the spillways ensures a constant dischargethrough the city. In contrary, sea level rise is expected to push water levels upwards. The effect of sea level risewill be noticeable even more than 470 km upstream. Climate change impacts necessitate a more frequent useof the spillways and opening strategies that are based on stages.
1 Introduction
The Mississippi River has the third largest river basin of theworld and drains 41 % of the area of the United States. Theflood risk of the Mississippi River imposed on urban areas,like Baton Rouge and New Orleans, became apparent duringthe great flood in 1927 which was the most destructive riverflood in the history of the United States (Barry, 1998). Theriver, discharging more than 85 000 m3 s−1, caused levee fail-ures at numerous places, displaced over 600 000 people andflooded almost 70 000 km2 causing damage for $400 million.
Looking ahead, climate change is expected to affect theriver discharge due to alterations in the water cycle. Ericson
et al. (2006) found that the relative vulnerability of the Mis-sissippi delta, compared to 39 other deltas, is extreme and isdemonstrated by the population potentially being displacedby current sea level trends to 2050. USGCRP (2000) showedsignificant increases in the heaviest precipitation events andnoted that changes in streamflow follow these changes in pre-cipitation, but are amplified by about a factor three. Addi-tionally, climate change induced sea level rise in combina-tion with the local subsidence of the Mississippi River Deltacauses the projected local relative sea level rise in 50 yr torange between+0.5 m and+0.9 m for different rates of sealevel rise (USACE, 2009; NOAA, 2011). The uncertainty inthese projections is large, since the local subsidence rates
Published by Copernicus Publications on behalf of the Delft University of Technology.

82 T. L. A. Driessen and M. van Ledden: Mississippi flood hazard in New Orleans
vary strongly throughout the delta. Also, river morphologi-cal changes play a role, but they were neglected in this paper.Altogether, relative sea level rise is expected to affect riverstages further upstream in the future. In combination withthe alterations in streamflow the future flood water levels inthe Mississippi River are subject to change.
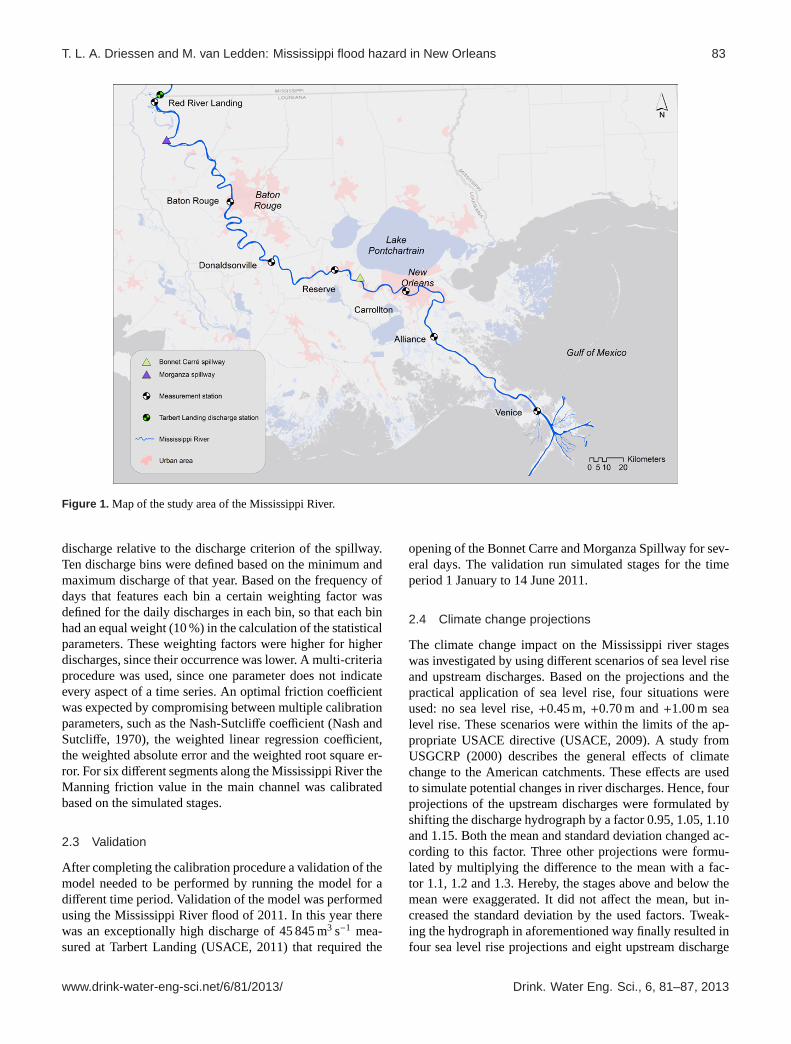
In view of future changes there are various managementchallenges in the Mississippi River Delta to be dealt with inorder to sustain the economic benefits for society, reduce theflood risk of urban areas, such as New Orleans, and to pre-serve the environmental value of the wetlands. Many of theseissues are interrelated which each other. As an example, thehigh river levees prevent the river overflowing into the his-toric flood plains and therefore withhold fertile river sedi-ment being deposited in the floodplains. This sediment star-vation induces coastal marsh deterioration. Since the 1930ssome 4900 km2 of coastal wetlands have already disappearedin the Gulf of Mexico and this process continues at a rate of65 km2 per year (Bourne Jr., 2004). Marsh deterioration isalso enhanced by the strong subsidence in the area which in-creases the potential for inundation (Nicholls et al., 2007).Subsidence enables more intrusion of salty water which de-structs the fresh/brackish marshlands and allows sea waterto penetrate further inland. Another water management chal-lenge is more closely related to flood hazard in City of NewOrleans. The Mississippi River levees downstream of Ba-ton Rouge, LA, do not have large floodplains to overflowwhen the bankfull discharge is exceeded. This results in asteep discharge-stage relation compared to a river system thathas large floodplains available on the riverside of the levees.Near New Orleans a river stage of+5.18 m above the NorthAmerican Vertical Datum of 1988 epoch 2004.65 (NAVD88)is used as the safe water elevation. In order to prevent ex-ceedance of this river stage near New Orleans two importantspillways have been constructed further upstream: the Bon-net Carre Spillway and the Morganza Spillway (see Fig. 1).The Bonnet Carre Spillway is closest to New Orleans andconsists of 350 bays that includes wooden beams. Its inletstructure is opened when the upstream discharge at TarbertLanding exceeds ca. 35 400 m3 s−1. The spillway is capableof discharging almost 7080 m3 s−1. The Morganza Spillwayis opened when the upstream discharge at Red River land-ing exceeds 42 475 m3 s−1 and consists of 125 gates whichare able to divert a maximum flow of almost 17 000 m3 s−1.The Morganza Spillway diverts water to the Atchafalya Riverbasin which is located to the west of the Mississippi River,and was opened for the second time in spring 2011. Themain question that is addressed in this article is how this sys-tem of levees and spillways can be adapted in view of futurechanges.
The objective of this paper is to address the future changesin the Mississippi River stages in the context of climatechange and sea level rise. For this purpose, a hydraulic modeland an overview of modelling scenarios are presented in the
following section of this paper. Next, the model results arediscussed in the context of Mississippi flood hazard.
2 Methods
2.1 Hydrodynamic model
An improved one-dimensional hydraulic model was set up todescribe the general hydrodynamics of the river and to simu-late stages for the lower reach of the Mississippi River, whichincludes the cities Baton Rouge and New Orleans. This in-cluded a model of the last 492 km of the river before it entersthe Gulf of Mexico (see Fig. 1). This model was subsequentlyused to perform a sensitivity analysis on the response of theriver stage to climate change.
A HEC-RAS geometry was used that was provided bythe Hydraulics and Hydrologic Branch of the U.S. ArmyCorps of Engineers (USACE) New Orleans District contain-ing survey data obtained in 2002 and 2003. This geome-try was imported in the SOBEK Rural Advanced Version2.11.002c software (Deltares, 2010) and provided 164 cross-sections between the upstream boundary at Tarbert Landingand the downstream boundary at Venice (see Fig. 1). Themodelled reach receives little lateral inflow due to precipi-tation which justifies the use of the hydrodynamic 1DFLOWmodule within SOBEK Rural and the exclusion of a rainfall-runoff module.
Daily discharge at Tarbert Landing was used for settingthe upstream boundary condition for unsteady flow compu-tations. A stage-discharge relation was used to compute thedaily discharge based on observed daily stages. A fixed wa-ter level, representing the yearly averaged stage, was appliedat the downstream boundary condition at Venice, since nohourly data was available to incorporate the tidal signal. Al-though the tidal signal may have a pronounced effect onthe stages in the Mississippi River during low discharges,a fixed boundary was justified, since the study focused onhigh flows wherein tidal influence on river stages was neg-ligible. Storm surges on the other hand can have a consid-erable effect. However, the study focused on peak flows ofthe Mississippi River, which occur mostly during the first sixmonths of the year. Storm surges are related to hurricanesthat mostly occur from June to November. Hence, the effectof storm surges was not within the scope of this study.
2.2 Calibration
Calibration of the model was performed by a weighted multi-criteria procedure for the main channel friction (Manning)parameter. The model was calibrated with a particular in-terest for high flow conditions. In order to include a realis-tic opening of the Bonnet Carre Spillway stage a dischargeand water level time series originating from 1997 was usedfor the calibration procedure. The discharge into the spill-way is schematised as a lateral outflow that is the surplus of
Drink. Water Eng. Sci., 6, 81–87, 2013 www.drink-water-eng-sci.net/6/81/2013/
T. L. A. Driessen and M. van Ledden: Mississippi flood hazard in New Orleans 83
Figure 1. Map of the study area of the Mississippi River.
discharge relative to the discharge criterion of the spillway.Ten discharge bins were defined based on the minimum andmaximum discharge of that year. Based on the frequency ofdays that features each bin a certain weighting factor wasdefined for the daily discharges in each bin, so that each binhad an equal weight (10 %) in the calculation of the statisticalparameters. These weighting factors were higher for higherdischarges, since their occurrence was lower. A multi-criteriaprocedure was used, since one parameter does not indicateevery aspect of a time series. An optimal friction coefficientwas expected by compromising between multiple calibrationparameters, such as the Nash-Sutcliffe coefficient (Nash andSutcliffe, 1970), the weighted linear regression coefficient,the weighted absolute error and the weighted root square er-ror. For six different segments along the Mississippi River theManning friction value in the main channel was calibratedbased on the simulated stages.
2.3 Validation
After completing the calibration procedure a validation of themodel needed to be performed by running the model for adifferent time period. Validation of the model was performedusing the Mississippi River flood of 2011. In this year therewas an exceptionally high discharge of 45 845 m3 s−1 mea-sured at Tarbert Landing (USACE, 2011) that required the
opening of the Bonnet Carre and Morganza Spillway for sev-eral days. The validation run simulated stages for the timeperiod 1 January to 14 June 2011.
2.4 Climate change projections
The climate change impact on the Mississippi river stageswas investigated by using different scenarios of sea level riseand upstream discharges. Based on the projections and thepractical application of sea level rise, four situations wereused: no sea level rise,+0.45 m,+0.70 m and+1.00 m sealevel rise. These scenarios were within the limits of the ap-propriate USACE directive (USACE, 2009). A study fromUSGCRP (2000) describes the general effects of climatechange to the American catchments. These effects are usedto simulate potential changes in river discharges. Hence, fourprojections of the upstream discharges were formulated byshifting the discharge hydrograph by a factor 0.95, 1.05, 1.10and 1.15. Both the mean and standard deviation changed ac-cording to this factor. Three other projections were formu-lated by multiplying the difference to the mean with a fac-tor 1.1, 1.2 and 1.3. Hereby, the stages above and below themean were exaggerated. It did not affect the mean, but in-creased the standard deviation by the used factors. Tweak-ing the hydrograph in aforementioned way finally resulted infour sea level rise projections and eight upstream discharge
www.drink-water-eng-sci.net/6/81/2013/ Drink. Water Eng. Sci., 6, 81–87, 2013

84 T. L. A. Driessen and M. van Ledden: Mississippi flood hazard in New Orleans
Figure 2. Hydrographs of calibrated simulation run 1997.
projections including the reference situations. Hence, 32 sce-narios were used to assess the sensitivity of the MississippiRiver stages to climate change. These scenarios are all underthe assumption that there is an unchanged river bed.
3 Results
Figure 2 presents the results of the calibration procedure.The Nash-Sutcliffe coefficient and the mean absolute errorare given for each location. The Nash-Sutcliffe coefficient as-sesses the predictive power of a hydrological model and itsoptimum value is 1. It is calculated by one minus the resid-ual variance divided by the data variance. The model resultsshow an overestimation of the maximum discharge peak forall six measurement stations that were used. For the calibra-tion period, the performance of the model to simulate wa-ter levels at Carrolton (New Orleans) is described with an10th and 90th percentile of respectively−0.6 m and+0.3 m.At Alliance, the model errors were relatively large and werepartly caused by the tidal signal that was dominant at thislocation under low flow conditions. The error became rela-tively larger in downstream direction.
The validation results are given in Fig. 3 and show a goodrepresentation of the flood that occurred in May. Both theBonnet Carre Spillway and the Morganza Spillway were
opened during this flood. The latter flooded an area as largeas 7700 km2 and caused the displacement of ca. 25 000 peo-ple. At Carrolton (New Orleans) the mean absolute error ofthe model simulation was 0.31 m. At Red River Landing andCarrolton the difference of maximum stage was less than0.01 m, while at Baton Rouge the maximum stage was under-estimated with 0.09 m. At Alliance the maximum stage wasoverestimated with 0.25 m. The simulated hydrographs had ashift with respect to the observed hydrographs, probably be-cause the velocities in the model were underestimated. How-ever, the model errors described above were relatively smallconsidering the stage range of the Carrolton gage. Its averageannual lowest and highest stages are respectively NAVD88−0.01 m and NAVD88+4.34 m. The model demonstrated tobe capable of simulating the hydrodynamics and, therefore,allowed a legitimate use of the model for a comparative anal-ysis.
The model was also used to simulate the stages when thespillways would not have been opened (see Fig. 4). The im-pact on the stage at Carrolton (New Orleans) was especiallyof interest. The peak stage for this situation was projectedto be NAVD88+7.17 m, while the levee heights at Carroltonare ca. NAVD88+7.30 m. This clearly demonstrates the ben-efit that the spillways have in reducing flood hazard for theurban area of New Orleans.
Drink. Water Eng. Sci., 6, 81–87, 2013 www.drink-water-eng-sci.net/6/81/2013/

T. L. A. Driessen and M. van Ledden: Mississippi flood hazard in New Orleans 85
Figure 3. Validation of the flood in 2011.
Figure 4. The validation of the flood in 2011 when no spillways are opened.
www.drink-water-eng-sci.net/6/81/2013/ Drink. Water Eng. Sci., 6, 81–87, 2013

86 T. L. A. Driessen and M. van Ledden: Mississippi flood hazard in New Orleans
Figure 5. Minimum and maximum stage differences with respect to the reference for three sea level rise projections.
The defined scenarios were used to get an insight in thepotential future behaviour of the Lower Mississippi system.By looking at the sea level rise scenarios where no dischargechange is expected it can be concluded that the distance tothe Gulf of Mexico, the position where the effect of sea levelrise is halved, becomes larger with increasing sea level rise.The minimum stage difference with respect to the referencescenario occurs during high flow conditions when the stageis predominantly dependent on the discharge. Then, the sealevel rise is halved at 130 km, 142 km and 148 km from thedownstream boundary for respectively+0.45 m,+0.7 m and+1.0 m sea level rise as can be seen in Fig. 5. The minimumincrease of stage at Carrolton becomes+0.21 m,+0.34 mand+0.50 m for all discharge regimes except the “−5 %”-scenario. During low flow conditions the sea level affects theriver stages stronger. In this case the sea level rise is halved at442 km, 444 km and 445 km for respectively the same threesea level rise projections. It was found that the stages alongthe entire modelled reach are affected by sea level rise for thethree projections. The maximum stage increase at Carroltonis dependent on the type of discharge regime as well as thestrength of sea level rise.
The relative steep stage-discharge relation due to the con-fined levees downstream of Baton Rouge causes a strong in-crease in stages when upstream discharges increase. At thesame time changes in discharge characteristics did not affectthe stages downstream of Bonnet Carre Spillway when it wasclosed, since a constant discharge passed through. However,
changes in the upstream discharge would affect the frequencyand duration for opening of the spillways. Their effect on thewater level near Carrolton is demonstrated in Figs. 3 and 4.The increase of stages in the downstream section is predom-inantly caused by the sea level rise. Currently, the thresholdfor a spillway opening is defined by the upstream dischargeat Tarbert Landing. Sea level rise causes an increase in stagethat changes the stage-discharge relationship. Thus in orderto not exceed the NAVD88+5.18 m threshold at Carrolton itis likely that a lower discharge threshold is needed for open-ing the spillways.
4 Conclusions
The paper addressed the future changes in the MississippiRiver stages regarding “climate change”-induced changes ofupstream discharge and sea level. The weighted multi-criteriacalibration procedure provided a hydrodynamic model thatwas capable of simulating high flows in the MississippiRiver. During validation a mean absolute error at Carrolton(New Orleans) of 0.31 m was found and a difference duringmaximum stage that was less than 0.01 m. It was concludedthat the model could be used for a comparative analysis.
The presence of the two spillways proved to be of vitalimportance to reduce the flood hazard risk of the city NewOrleans. In the future their role will even be more impor-tant. The challenges of the Mississippi River delta becomeeven more apparent with expected climate change impacts.
Drink. Water Eng. Sci., 6, 81–87, 2013 www.drink-water-eng-sci.net/6/81/2013/

T. L. A. Driessen and M. van Ledden: Mississippi flood hazard in New Orleans 87
All of them increase the flood hazard in the Greater New Or-leans area, which is already situated in a flood-prone area.This study showed that sea level rise is likely to be dominanton the downstream end of the Bonnet Carre Spillway. Dur-ing high flow conditions the stages near New Orleans couldbe increase with a range between 0.21 m and 0.50 m. At thesame time the increased upstream discharge increases the fre-quency and duration of spillway openings.
Appropriate measures to face these future water man-agement challenges and reduce the flood hazard are notdiscussed in this paper. Nevertheless, the Mississippi Rivermodel that is presented in this paper can be of added valuein the analyses of these flood risk reduction measures. Inthat case it is recommended to update the bathymetry andinclude a morphological module to further enhance themodel’s performance.
Edited by: L. Rietveld
References
Barry, J.: Rising Tide – The Great Mississippi Flood of 1927 andHow it Changed America, Simon & Schuster, New York, 1998.
Bourne Jr., J. K.: Gone with the water, National Geographic Maga-zine, available at:http://ngm.nationalgeographic.com/ngm/0410/feature5/ (last access: May 2009), 2004.
Deltares: Design and analysis tools – SOBEK suite, avail-able at:http://www.deltaressystems.com/hydro/product/108282/sobek-suite(last access: October 2011), 2010.
Ericson, J., Vorosmarty, C., Dingman, S., Ward, L., and Meybeck,M.: Effective sea-level rise and deltas – Causes of change andhuman dimension implications, Global Planet. Change, 50, 63–82, 2006.
Nash, J. I. and Sutcliffe, I. V.: River flow forecasting through con-ceptual models: Part I – A discussion of principles, J. Hydrol.,10, 282–290, 1970.
Nicholls, R. J., Wong, P. P., Burkett, V. R., Codignotto, J. O., Hay,J. E., McLean, R. F., Ragoonaden, S., and Woodroffe, C. D.:Coastal systems and low-lying areas. Climate Change 2007: Im-pacts, Adaptation and Vulnerability. Contribution of WorkingGroup II to the Fourth Assessment Report of the Intergovern-mental Panel on Climate Change, Cambridge University Press,Cambridge, UK, 315–356, 2007.
NOAA: Sea Levels Online, available at:http://tidesandcurrents.noaa.gov/sltrends/sltrends.shtml, last access: 28 August 2011.
U.S. Army Corps of Engineers Washington: Water Resource Poli-cies and Authorities Incorporating Sea-level Change Consider-ations in Civil Works Programs, available at:http://140.194.76.129/publications/eng-circulars/ec1165-2-211/entire.pdf(last ac-cess: 28 August 2011), 2009.
U.S. Army Corps of Engineers: Discharge Data; Mississippi Riverat Tarbert Landing, MS, available at:http://www2.mvn.usace.army.mil/cgi-bin/wcmanual.pl?01100, last access: 11 October2011.
USGCRP: Climate change impacts on the United States – Thepotential consequences of climate variability and change, USGlobal Change Research Program, 2000.
www.drink-water-eng-sci.net/6/81/2013/ Drink. Water Eng. Sci., 6, 81–87, 2013