the labour market position of secondgeneration … · the labour market position of...
TRANSCRIPT

Working Paper Research
The labour market position of second‑generation immigrants in Belgium
by Vincent Corluy, Joost Haemels, Ive Marx and Gerlinde Verbist
September 2015 No 285

NBB WORKING PAPER No. 285 – SEPTEMBER 2015
Editor Jan Smets, Governor of the National Bank of Belgium Statement of purpose:
The purpose of these working papers is to promote the circulation of research results (Research Series) and analytical studies (Documents Series) made within the National Bank of Belgium or presented by external economists in seminars, conferences and conventions organised by the Bank. The aim is therefore to provide a platform for discussion. The opinions expressed are strictly those of the authors and do not necessarily reflect the views of the National Bank of Belgium. Orders
For orders and information on subscriptions and reductions: National Bank of Belgium, Documentation - Publications service, boulevard de Berlaimont 14, 1000 Brussels Tel +32 2 221 20 33 - Fax +32 2 21 30 42 The Working Papers are available on the website of the Bank: http://www.nbb.be © National Bank of Belgium, Brussels All rights reserved. Reproduction for educational and non-commercial purposes is permitted provided that the source is acknowledged. ISSN: 1375-680X (print) ISSN: 1784-2476 (online)
NBB WORKING PAPER No. 285 - SEPTEMBER 2015
Abstract
Belgium has one of the largest gaps in labour market outcomes between natives and individuals of foreign origin. One might expect that the children of migrants (the so-called second generation) would perform better than the first generation, as they ought to have a better knowledge of the local language, better educational qualifications and greater opportunities for work experience in the domestic labour market. On the basis of data from the ad hoc module of 2008 Labour Force Survey (LFS) we find that employment rates for generation migrants in Belgium are hardly better than those for first generation migrants. This finding stands in marked contrast what is found in neighbouring countries. Using a unique combination of data sources, we examine the labour market position of second-generation migrants in more depth. We find considerable variation in labour market outcomes by country of origin and a Fairlie decomposition yields that education is an important explanatory factor of the employment rate gap. Yet there still remains a large unexplained part.
JEL Classification: J15, J21, J24, J61.
Keywords: Second generation immigrants, labour market outcomes, decomposition methods, educational attainment.
Authors: Vincent Corluy, Centrum voor Sociaal Beleid Herman Deleeck – Universiteit Antwerpen; Centrum voor
Economische Studiën – KU Leuven, [email protected] Joost Haemels, Centrum voor Sociaal Beleid Herman Deleeck – Universiteit Antwerpen,
[email protected] Ive Marx, Centrum voor Sociaal Beleid Herman Deleeck – Universiteit Antwerpen, [email protected] Gerlinde Verbist, Centrum voor Sociaal Beleid Herman Deleeck – Universiteit Antwerpen,
[email protected] The views expressed in this paper are those of the authors and do not necessarily reflect the views of the National Bank of Belgium or any other institutions to which one of the author is affiliated.

NBB WORKING PAPER - No. 285 - SEPTEMBER 2015
TABLE OF CONTENTS
1. Introduction ............................................................................................................................. 1
2. The labour market position of immigrants and their descendants in Western Europe and Northern America: theories of assimilation .................................... 2
2.1 The position of the second generation relative to natives and first generation immigrants ..... 2
2.2 From classical assimilation to segmented assimilation .......................................................... 3
3. Data and methods ................................................................................................................... 7
3.1 Data ..................................................................................................................................... 8
3.2 Methods ............................................................................................................................. 11
4. A descriptive analysis of the labour market position of first generation immigrants and their children .............................................................................................. 12
4.1 Belgium in an international perspective .............................................................................. 13
4.2 Differences in employment profile using the new database for Belgium .............................. 14
4.2.1 Employment according to the ILO definition .............................................................. 14
4.2.2 Employment according to the socio-economic nomenclature .................................... 18
4.2.3 Employment on the household level ......................................................................... 19
4.3 Wage differences ............................................................................................................... 20
4.4 Differences in other job characteristics ............................................................................... 21
5. Description of explanatory variables of employment gap .................................................. 24
5.1 Education level................................................................................................................... 25
5.2 Socio-demographic variables: age, gender and household composition .............................. 26
5.3 Region of residence ........................................................................................................... 29
6. Trying to understand the employment gap .......................................................................... 30
6.1 Decomposition of the employment gap of immigrants: an international comparison ............ 31
6.2 A more detailed decomposition of the employment gap of immigrants for Belgium .............. 32
6.3 Marginal effects .................................................................................................................. 34
7. Conclusions .......................................................................................................................... 36
References .................................................................................................................................. 39
Annex 1 – Additional figures and tables ........................................................................................ 42
Annex 2 – Probit regressions ....................................................................................................... 45
National Bank of Belgium - Working papers series ....................................................................... 49

1
1 Introduction
In Belgium the employment rate gap between individuals born in Belgium and non-EU
immigrants of the first generation is among the largest in the European Union. Compared to
natives, these immigrants have a higher probability of being unemployed or inactive and/or
they need more time to find work (De Keyser et al., 2012; Neels, 2001; Kalter and Kogan,
2006). Research for Belgium has mainly focused on this first generation, i.e. individuals born
outside Belgium (see e.g. Corluy et al. 2011; Corluy, 2014; De Keyser et al., 2012; Geets,
2011; Martens et al., 2005; OECD, 2010; Phalet & Heath, 2010). One might expect that their
children approximate labour market characteristics of natives, because of better language
skills and an (easier) recognition of their qualifications. Card (2004) argues that the success or
failure of native-born children of migrants that are raised and educated in the country of
residence can be seen as the ultimate benchmark of integration (see also Liebig & Widmaier,
2010). Little is known about this so-called second generation in Belgium. Is their situation
more similar to that of natives or to that of the first generation? There are indications that the
employment gap remains very high for this group (Eurostat, 2011; Vande Zande et al., 2009;
Heath & Cheung, 2007; Fleischman & Dronkers, 2007; OECD, 2010, De Keyser et al., 2012).
Using a unique combination of data sources, this study examines the labour market position
of the second generation, which is defined as those individuals living in Belgium of whom at
least one parent is born in another country. In this study, natives are defined in a narrow way,
namely as those people living in Belgium, who themselves as well as all their parents are born
in Belgium. The labour market position is investigated in the light of the theoretical
framework of classical and segmented assimilation, which is explained in section 2. For the
empirical application we use 1) the data from the ad hoc module of 2008 Labour Force
Survey (LFS), which allows for an international comparison, and 2) a new database, which is
constructed on the basis of matching data from the LFS and the administrative data of the
Datawarehouse Arbeidsmarkt & Sociale Bescherming. These data are described in section 3,
together with the methodology. Section 4 then provides a descriptive analysis of the labour
market position of second generation immigrants in Belgium in comparison with both natives
and the first generation, while section5 discusses the possible explanatory variables. Finally,
using different types of statistical methods, we search for the determinants of the differences

2
in employment position of the second generation compared to natives and the first generation.
The last section concludes and reflects on some potential policy pathways.
2 The labour market position of immigrants and their descendants in Western Europe and Northern America: theories of assimilation
In this section we present a brief overview of studies that have analysed labour market
outcomes of the children of the first generation. As little is known for Belgium, most of these
studies relate to other countries, and especially North America, where the theoretical
framework of classical and segmented assimilation has been used to analyse the topic. We
briefly describe these two theories, as they provide a starting point for our own empirical
analysis.
2.1 The position of the second generation relative to natives and first generation immigrants
The socio-economic differences between natives and the second generation have already been
empirically analysed in several Western countries. These studies indicate that the socio-
economic integration of the second generation lags substantially behind the position of
natives. They also indicate that the second generation is heterogeneous, as there are often
large differences according to the origin of the parents (Heath et al., 2008; Heath, 2009;
Cheung & Heath, 2007; OECD, 2010). For Belgium, Crul et al. (2003) find that Turks and
Moroccans of the second generation generally experience higher unemployment than one
would expect on the basis of their education level, age and place of residence. For Germany,
Worbs (2003) finds that the second generation of Turkish and Yugoslavian immigrants
between 16 and 25 years is more often unemployed or employed in unskilled labour than
Germans of native origin in the same age group. For France, Meurs et al. (2003) observe an
overrepresentation of the second generation in both unemployment and unstable employment
(temporary or subsidized jobs) and an underrepresentation in the public sector, although they
also saw a general improvement of the second generation compared to the first. In another
study for France, Simon (2003) observes for the population aged between 18 and 40 years, a
higher unemployment rate among the second generation of Portuguese, Turkish and
Moroccan immigrants, compared to French natives with the same education level. Ekberg and
Rooth (2003) come to similar conclusions for the Swedish labour market: within the
population between 25 and 40 years, the employment rate of the second generation for almost

3
all foreign groups is significantly lower than that of Swedish natives, when controlling for
education, local unemployment rate, household composition and region. Wage differences,
however, disappear for most immigrant groups when controlling for socio-economic profile
variables. Exceptions are second generation men with South European and non-European
origin, who received significantly lower wages than Swedish natives. Fibbi et al. (2006)
observe a higher unemployment rate in Switzerland for the second generation of German,
Turkish and Balkan origin. Changhwan et al. (2010) find a significant wage handicap for
male, black 1.51 - and second generation in the United States, compared to male, white
Americans of earlier generations with the same education and demographic profile. Herzog-
Punzenberger (2003) examines the position of the Turkish second generation between 15 and
35 years in Austria and concludes that their unemployment rate, after controlling for socio-
economic characteristics, is only slightly higher than that of the native population. The
Turkish second generation is, however, overrepresented in unskilled labour.
Not only is the native population a relevant reference group for the second generation, but it is
also important to compare the latter’s position with that of first generation immigrants. For a
long time the theoretical framework has been dominated by the idea of classical assimilation,
which states that in a ‘normal’ integration process, the second and third generation outperform
the first generation (Greenman & Xie, 2005; Zhou, 1997). According to this theory the
process of socio-economic integration is considered to be a linear, quasi-uniform process of
convergence towards natives for all origin groups. The second generation is supposed to have
significant advantages over the first generation, such as better knowledge of the language,
better educational qualifications and a greater chance of work experience in the domestic
labour market (Heath et al., 2008). Differences in socio-economic position between migrants
and non-migrants may indicate a difference in the pace of assimilation, they do not have to be
seen as signs of structural inequality. In recent literature, there is only little support for
general classical assimilation.
2.2 From classical assimilation to segmented assimilation
The theory of a classical assimilation process came under pressure in recent years, due to
diverging patterns of assimilation between different ethnic groups in several western
countries. It appeared that for different ethnic groups, both upward and downward
1 The 1.5 generation is usually defined as those individuals that migrated together with their parents to the host country just before or during their school career (Heath, 2010). They are born outside the host country, but have access to the same education system as natives and the second generation.
4
intergenerational mobility occur for second generation migrants in education and
employment. Gans (1992) found in the United States such diverse processes of mobility
among children of migrants of the first generation, showing that the results of the second
generation often depend on ethnic origin. Based on these ethnic differences, Portes and Zhou
(1993) introduced in the early 90’s the theory of segmented assimilation. The theory of
segmented assimilation is to find an explanation for diverging paths of assimilation between
the different ethnic groups (Feliciano & Waldinger, 2004). The theory of segmented
assimilation is actually an extension of the classical model of integration built on the idea of
upward mobility, following from two fundamental criticisms on the assumption of classical
assimilation. The first criticism is that of multiculturalism: in the classical theory, all groups
of migrants assimilate to the same ‘mainstream culture’, but following the theory of
multiculturalism, this hypothesis is no longer tenable. Current society is multicultural, which
creates the possibility of diverse mobility trajectories (upward, stable or downward) for the
second generation, at least partly depending on an individual’s cultural environment (Zhou,
1997). A possible explanation of downward mobility could be that the second generation
often grows up in disadvantaged areas and assimilates to an existing underclass in the new
homeland (or may come to replace it). Increasingly, many countries are composed of multiple
ethnic groups who share similar traits and customs derived from the culture in which they
were born (ethnic subcultures) (Greenman & Xie, 2005). The ethnic background is in other
words not just something of the past. The second criticism is more structural in nature: the
theory of segmented assimilation states that in the destination country, often structural factors
stand in the way of the classical assimilation process. In a country with a large gap between
rich and poor and few possibilities of upward mobility, the assimilation process is logically
difficult (Zhou, 1997). Increased immigration streams are also seen as a structural problem for
integration, because the ability of countries to absorb new entrants becomes smaller (Alba &
Nee, 1997). A final structural barrier is obviously racism and discrimination. Proponents of
classical assimilation theory recognize the existence of these structural barriers to integration,
but continue to hold to the thesis that these differences are due to differences in speed of
assimilation, which is still seen as a single upward process for all immigrants (Alba & Nee,
1997).
Based mainly on research in the United States, the theory of segmented assimilation
formulates three possible paths of integration, which can occur in the socio-economic or
cultural domain. The first is the path of classical, upward assimilation to the middle class. The
second possibility is downward assimilation of migrants that assimilate to the existing

5
underclass in the country. The third possibility is that of selective acculturation. In the case of
selective acculturation there is upward mobility, but only partial cultural assimilation.
Immigrants will then preserve their own culture and values in a strong ethnic network, which
is used as a buffer against negative environmental factors (Greenman & Xie, 2005; Portes &
Zhou, 1993; Zhou, 1997). For the socio-economic perspective we use here, the first and the
third path result in similar labour market outcomes, as both paths result in upward mobility.
The thesis of segmented assimilation was initially based on certain evolutions in the United
States. Social researchers saw an increasing concentration of migrants in large cities, which
often ended up in deprived urban neighbourhoods. Because there was a lack of strong ethnic
communities as a buffer against negative environmental factors, which was the case for the
Asian community in the U.S. (Perlmann & Waldinger, 1997), certain ethnic groups
assimilated to the subculture of the already existing urban underclass (Portes & Zhou, 1993).
It was therefore possible that children of migrants had a worse socio-economic position than
their parents. Fernandez-Kelly et al. (2009) studied outcomes of education, income and crime
of the second generation in the United States and found a significantly greater risk of
downward assimilation for the Mexican and Caribbean second generation than for other
ethnic groups. Haller et al. (2011) also suggest that in the United States, different assimilation
pathways are followed by different ethnic groups, as their research shows signs of upward
mobility for the second generation of Cuban descent, while the second generation of Mexican
descent, contrary to the findings of Feliciano & Waldinger (2004), are characterized by
downward mobility.
The segmented assimilation theory has been empirically tested in several western European
countries in recent years. These studies point to selective downward mobility and a
deteriorating relative position of migrants in the second generation. The difference with
natives (often referred to as ‘ethnic penalty’) apparently does not decrease for the second
generation in some cases, but is sometimes stagnating and in some countries even growing.
Diverging trends are found for groups of different ethnic origins. Crul & Doomernik (2003)
find an improvement of the Turkish second generation in the Netherlands compared to the
first generation, but at the same time a downturn for the Moroccan second generation. Algan
et al. (2009) observe a deterioration for the second generation in France at active age
compared to the first generation, in terms of both employment and net hourly wages,
especially among the African and Turkish second generation and to a lesser extent among the
North African and Asian immigrant population. For Germany, Algan et al. (2009) observe a

6
status quo of the second generation compared to first generation immigrants, with variations
between different origin groups: they find improvement for the Greek and Yugoslavian
second generation, but signs of downward mobility in employment and wages for the Turkish
and Central European second generation. Hammarstedt (2005) compares the salaries of first-,
second- and third-generation immigrants in Sweden with those of native Swedish workers.
For almost all ethnic groups wages decline in relative terms, i.e. the remuneration of the first
generation is relatively better than that of the second generation, who in their turn outperform
the third generation. Comparing to natives, Ekberg & Hammarstedt (2009) state that the first
generation receives better salaries, the second generation has a similar position and the third
generation has significantly lower wages than natives.
In general, the majority of the literature seems to support the thesis of segmented assimilation.
The socio-economic outcomes of the second generation relative to natives and first generation
seems to vary across origin, with processes of both upward and downward intergenerational
mobility within the same country.
The research in this paper aims at testing the theses of classical and segmented socio-
economic assimilation for Belgium. We examine the labour market position of the second
generation in Belgium, both compared to natives and the first generation of immigrants. The
thesis of assimilation as tested here only relates to the labour market (economic assimilation),
cultural assimilation is not taken into account. If the classical assimilation thesis applies, then
we should find a uniform upward mobility process for all origin groups. Upward mobility
means here that the second generation has higher employment rates and lower unemployment
rates than the first generation. The classical thesis does not say that the second generation
achieves the same level as natives. However, in comparison with the first generation
immigrants, they are closer to the level of native employment. If this is not the case and there
are significant differences in the relationship between the first and second generation
depending on origin, segmented assimilation is the more likely framework. In a next step, we
then try to determine the factors that explain differences in socio-economic outcomes of the
second generation compared to natives. We analyse here the impact of supply-side factors,
namely characteristics of the individual. But we acknowledge that also demand-side factors
(e.g. network effects, discrimination, familiarity with labour market functioning) probably
also play and important role.
7
3 Data and methods
Until recently, the analysis of the children of first generation migrants in Belgium was
hampered by lack of data in which one could identify this second generation. The EU-Labour
Force Survey is a large household sample survey providing (quarterly) results on labour
participation of people aged 15 and over as well as on persons outside the labour market. In
this harmonised EU-LFS it is in principle only possible to identify the first generation, as it
contains only information on the country of birth of the respondent. An exception is the data
from the ad hoc module of the second quarter of the EU-LFS 2008, containing information on
the country of birth of both parents. This European database allows putting Belgium in an
international perspective2. Another possibility is to use a new database derived from the
linkage of data from the Labour Force Survey and of the Datawarehouse Arbeidsmarkt &
Sociale Bescherming. The two databases are discussed in Section 3.1, while Section 3.2
explains the statistical methods.
The division between natives, first generation and second generation is based on their own
country of birth and the country of birth of their parents. Natives are people who live in
Belgium, who are born in Belgium and of which all parents were also born in Belgium.
Immigrants of the first generation are people who live in Belgium, but were not born in
Belgium. Immigrants3 of the second generation are defined as all persons living in Belgium
and who were born in Belgium and of which at least one parent was not born in Belgium.
Because there are major differences depending on origin, the group of immigrants is divided
into different clusters of origin of the respondents and/or their parents. For the international
comparison, the classification according to origin is limited to non-EU27 and EU27 origin.
The new dataset for Belgium contains a larger sample and thus allows for a more detailed
classification: for EU27 we distinguish between EU15 (i.e. those countries that were an EU
members state before 2004) and EU12 (i.e. those countries that joined the EU from 2004
onwards); for non-EU27 we distinguish three groups, notably those originating from Turkey,
North Africa and other non-EU27 countries.
2 At the moment, the EU-LFS micro data for scientific purposes contain data for all EU28 Member States in addition to Iceland, Norway and Switzerland. 3 Strictly speaking, children of first generation immigrants are themselves not immigrants, as they are born in Belgium. When we use the term ‘immigrant’ here, we actually mean ‘foreign origin’, i.e. somebody who is born outside Belgium or whose parents are born outside Belgium.

8
3.1 Data
We first discuss the ad hoc module of the Labour Force Survey (LFS) 2008, and then the
larger and more detailed database using the Datawarehouse Arbeidsmarkt & Sociale
Bescherming. For both databases, empirical analyses will be performed on a sample that is
limited to the group between 20 and 44 years. This restriction has two reasons. First,
exploratory analyses have revealed that the second generation, mostly the non-western second
generation is significantly younger than the native population. If the full range of working age
(15-64 years) is taken into account, the age distribution of the second generation would be
very skewed compared to natives and these large age effects might distort the results (e.g.
because employment opportunities are very different for a person older than 50 than for a 25
year old). The second reason deals with missing values in older age categories. The
proportion of missing values for the country of birth of the parents is high in the older age
groups, which could also bias results. Because the study has its focus on employment, also
students are excluded from the sample. Bivariate results are weighted using the available
weighting variable in the LFS, which adds weights for gender, age and region of residence.
For the international comparative perspective we use the Labour Force Survey (LFS). For
Belgium, the LFS is a representative sample from the National Register and provides, in
addition to demographic characteristics, both general and more detailed data on the
employment situation, such as the quality of employment, characteristics of the workplace
and information on job search processes; similar procedures are applied for the other
countries. In principle this dataset does not allow for the identification of the second
generation. An exception is the special ad hoc module of LFS 2008, in which respondents are
asked about the country of birth of their parents. The data of this ad hoc module of the Labour
Force Survey (further abbreviated as ‘LFS ad hoc’) refer to the second quarter of 2008, and
thus only includes a part of the entire sample of the year.
The employment situation of immigrants in Belgium is compared to four neighbouring
countries: France, Luxembourg, the Netherlands and United Kingdom4. Unfortunately,
Germany is not included because the German Labour Force Survey makes no division by
origin of its resident population. In order to have sufficiently large groups, we make a broad
distinction between EU27 and non-EU27 origin. In Belgium as well as in neighbouring
4 The LFS 2008 ad hoc includes also information for Austria, Ireland, Greece, Italy, Portugal and Spain. Given the specific situation of immigrants in these countries, we have chosen to limit the comparison to the neighbouring countries only.

9
countries, about a quarter of the population between 20 and 44 years are born abroad or are of
foreign origin (Table 3.1). With regard to the second generation, a relatively greater part of
the second generation is of European origin than in neighbouring countries. Luxembourg is
exceptional in the sense that immigration has a very outspoken European character.
Table 3.1: Share of population groups according to origin and generation, 20-44 years (excl. students), Belgium, 2nd quarter 2008.
Belgium France Luxembourg Netherlands United Kingdom
Natives 75.6% 75.7% 34.4% 76.3% 74.6%
1st generation
EU27 6.6% 2.6% 42.1% 3.2% 7.0% Non-EU27 8.4% 6.8% 6.9% 11.7% 9.6.%
2nd generation
EU27 5.8% 5.8% 15.9% 2.6% 4.1% Non-EU27 3.6% 9.1% 0.8% 6.2% 4.8%
Total 100.0% 100.0% 100.0% 100.0% 100.0% N 7,856 17,160 3,937 34,734 36,872
Note: shares are calculated using the available weighting variable in the LFS. Source: Labour Force Survey, 2008
In order to have an analysis that goes into more depth (i.e. with a more refined breakdown
according to origin of immigrants), and that is more recent, a data request was submitted for a
linked dataset containing data from the LFS and the Datawarehouse Arbeidsmarkt & Sociale
Bescherming (DWH AM&SB). For Belgium, the DWH AM&SB includes register data about
the country of birth of both parents. The link has ensured that for all quarters of the years
2008 to 2012, information on the own country of birth and the country of birth of both parents
is added to the LFS data5. In terms of employment data, the DWH AM&SB also offers
additional perspectives. It contains the socio-economic base nomenclature, through which the
main source of income according to the Belgian social security can be verified. This may be
different from the two definitions of employment within the LFS, namely the ILO definition
and the self-defined socio-economic status (cf. infra).
Table 3.2 gives the number of cases and the shares of the population groups of the new
database, to which we refer further as ‘LFS&DWH’. Given the larger size (namely around
four times larger as in the case of the 2008 LFS ad hoc module), it is now possible to present
results from a more detailed categorisation of both EU27 and non-EU27 migrants. Note,
however, that the number of EU12 second generation is with 56 in 2012 small; this needs to
be borne in mind when interpreting the results. All other categories contain at least 200 5 The specific data link for Belgium has been done through an ad hoc question and, hence, does not apply to other European countries from the Labour Force Survey. The data matching between the LFS and the DWH AM&SB is an exact one, in the sense that the national register numbers have been used to link the individuals’ information in both datasets.

10
respondents. Within the group of 20 to 44 years, the share of foreign origin (first and second
generation) is already very large. In 2012, less than seven out of ten (68.1%) was born in
Belgium and has both parents born in Belgium. More than one in six respondents (19%) was
not born in Belgium, while the second generation makes up 12.9% of the sample. Despite the
short time frame, we can conclude that the proportion of foreign origin in the population is
growing. The proportion of natives fell between 2008 and 2012 by 4.3 percentage points.
There is a difference in origin composition between the first and second generation. Within
the first generation, the largest group (in the age interval 20 to 44 years) was born outside the
EU27. The second generation on the other hand is more of European origin. More than half of
the second generation has one or both parents born in a EU27 country, though the share of
non-EU27 is increasing over time (from 4.5% in 2008 to 5.8% in 2012). For non-EU27
immigrants, a more detailed breakdown is given in Table A.1.1 in Annex as background
information. Given the small number of cases for the further breakdown of ‘non EU27’ the
three categories (Turkish, North African and other non-EU276) are used for the analysis.
Table 3.2: Sample size and shares of population groups, 20-44 years (excl. students), Belgium, 2008-2012
Sample size (N) % distribution Origin 2008 2009 2010 2011 2012 2008 2009 2010 2011 2012 Natives 23,080 21,993 21,320 19,503 19,372 72.4 70.6 69.7 69.0 68.1 1st generation EU27 2,315 2,179 2,342 2,072 2,088 6.3 6.2 6.9 6.7 6.8 EU15 1,905 1,712 1,744 1,471 1,482 5.1 4.8 5.0 4.7 4.7 EU12 410 467 598 601 606 1.2 1.4 1.9 2.1 2.1 Non-EU27 3,142 3,224 3,165 3,292 3,452 9.2 10.4 10.3 11.6 12.2 Turkey 436 438 411 387 416 1.4 1.4 1.4 1.4 1.5 North Africa 972 1,037 991 1,063 994 2.8 3.4 3.2 3.7 3.5 Other non-EU27 1,734 1,749 1,763 1,842 2,042 5.0 5.5 5.6 6.4 7.1 2nd generation EU27 2,508 2,524 2,421 2,121 2,118 7.7 7.9 7.7 7.3 7.1 EU15 2,442 2,458 2,358 2,061 2,062 7.5 7.7 7.5 7.1 6.9 EU12 66 66 63 60 56 0.2 0.2 0.2 0.2 0.2 Non-EU27 1,530 1,527 1,686 1,571 1,664 4.5 4.9 5.4 5.4 5.8 Turkey 246 267 310 290 272 0.8 0.9 1.0 1.1 1.0 North Africa 683 625 694 669 734 2.0 2.1 2.3 2.3 2.7 Other non-EU27 601 635 682 612 658 1.7 1.9 2.1 2.0 2.2 Total 32,369 31,136 30,612 28,202 28,305 100.0 100.0 100.0 100.0 100.0 Note: shares are calculated using the available weighting variable in the LFS. Source: LFS & DWH, 2008-2012
6 In 2012, other non-EU first generation immigrants come mainly from Central and South-Africa (36%), Asia (29%) and Central and East-Europe (24%). Almost 10% is born in Central and South-America. The origin composition of the second generation non-EU group is quite different. Around 60% of them has at least one parent born in Central and South-Africa (potentially in combination with a native born parent). Ten percent has at least one parent born in Central and East-Europe and another 10% has at least one parent born in Asia. Another 20% lives in a heterogeneous (non-EU) origin household, with parents combining different countries of origin (see Table A.1 for more details).

11
Note that for 2008 the shares differ when comparing Tables 3.1 and 3.2, resp. LFS ad hoc and
LFS&DWH, especially for the second generation. This may be due to demographic
fluctuations over the year, but also (and most probably) to the fact that registration of country
of birth of the parents is self-reported in LFS ad hoc, while LFS&DWH relies on
administrative data for this information, and is, hence, considered to be more accurate.
3.2 Methods
The objective of this paper is to gain a better understanding of the employment gap between
natives and immigrants on the basis of a decomposition method and the calculation of
marginal effects.
First, we estimate the factors that affect the labour force position (employed versus non-
employed) of immigrants and natives, using a probit model. We use a Fairlie decomposition7
method (Fairlie, 2005) to decompose the gap in (non-linear) labour market outcomes (vector
Y) between two populations. We estimate the gap for natives with EU born and non-EU born
immigrants respectively, i.e. :
= ( | ) ( | ) + ( | ) ( | ) (1)
Subscript N denotes the native population, subscript I the immigrant population (EU born or
non-EU born), X is a vector of control variables and is a vector of coefficient estimates. The
first term of right-hand side of equation (1) measures the gap due to differences in observed
characteristics (the composition or structural effect, also called the ‘explained gap’). The
second term measures the unexplained gap due to differences in coefficients, or returns to
characteristics (the coefficient effect).
In this decomposition exercise, the choice of the reference group has an impact on the
estimates outcomes. This is called the index number problem. Several options have been
proposed to solve the index number problem. The ‘true’ non-discriminatory basis should lie
somewhere between the native coefficients and the immigrant coefficients:
= + ( ) (2)
7 The Fairlie decomposition builds further upon the Oaxaca decomposition. The Oaxaca (1973) decomposition was initially applied in explaining differences in earnings between population groups. Fairlie (2005) adapted the technique so that it could also be used in situations involving a binary dependent variable, which is the case in our analysis.
12
where is a weighting matrix and I is the identity matrix. International literature has used
different weighting schemes in the decomposition analysis of relative inequalities (Oaxaca,
1978; Neumark, 1988). In this paper we apply the estimated coefficients of natives on the
distribution of immigrants ( = 1). Equation (1) refers to the case where natives’ coefficients
( ) are used as the non-discriminatory basis. Neumark (1988) argues that if men are paid
competitive wages while women are underpaid, the coefficients of men should be taken as the
non-discriminatory wage structure. Similarly, we can argue that the labour market position of
natives is the desirable outcome that immigrants should be able to achieve in a ‘fair’ world.
One can read this exercise as an ‘equal opportunity’ simulation, moreover because natives are
by far the largest group (Neumark, 1988; Neels, 2001; Kahanec and Zacieva, 2009). A
detailed decomposition can be used to determine how much each characteristic contributes to
explaining the gap. We use Fairlie’s (2005) method while sequentially switching the
coefficient of each covariate with the reference group and the immigrant group.
As mentioned, the decomposition divides the difference in employment between natives and
immigrants between an explained (composition effects) and unexplained gap. However, this
unexplained part is quite heterogeneous and may include differences in marginal effects and
interaction mechanisms between marginal and composition effects. We also present the
marginal effect of the ‘average’ person (i.e. a hypothetical individual with all characteristics
set at the mean values), which gives the change in the predicted probability of an outcome
resulting from an increase of one unit of the relevant variable, holding all other variables at
their respective means. Moreover, these marginal effects are easier to interpret than the probit
coefficients. Comparing the marginal effects between population groups, gives an indication
of the extent of the 'ethnic penalty' for the probability of employment.
4 A descriptive analysis of the labour market position of first generation immigrants and their children
In this section we describe the labour market position of immigrants using the two datasets we
dispose of. In a first section we use the ad hoc module of the LFS 2008 to put Belgium in an
international perspective. Next, we draw several labour market indicators from the
LFS&DWH database. We describe the socio-economic situation of natives and immigrants in
Belgium based on three different indicators: economic status according to the ILO definition
(employed, unemployed, inactive), socio-economic position based on an (administrative)

13
nomenclature8 and work intensity on the household level. In addition, also a number of
characteristics of labour are addressed: wages, contract type, full-time/part-time, job
categories and possible over-qualification in the lowest job category.
4.1 Belgium in an international perspective
We first compare the employment position of natives and different groups of immigrants in
Belgium with that in four neighbouring countries (France, Luxembourg, the Netherlands and
the United Kingdom). We make a distinction between EU27 and non-EU27 origin, using the
LFS ad hoc 2008.
Figure 4.1: Employment rates of first and second generation EU27 and non-EU27 immigrants in Belgium and neighbouring countries, 20-44 years (excl. students), 2nd quarter 2008
Source: Labour Force Survey, ad hoc module 2008
The first striking observation from Figure 4.1 is the considerable difference between EU27
and non-EU27 origin. In all countries, first generation EU27 immigrants have an employment
rate that is close to that of natives, while the non-EU27 first generation shows a very large
gap. The employment gap between natives and first non-EU27 generation immigrants is the
8 The nomenclature of the socio-economic position is a variable in the Data Warehouse Labour Market and Social Protection (DWH AM & SB) which is based on different administrative sources that are supplied by the various social security institutions. In the ‘basic’ nomenclature of socio-economic position (without ‘derived’ variables), the following positions are distinguished: employed (salaried, self-employment, combination), unemployed (with distinctions over different unemployment benefits), inactive (career interruption, pension, social assistance, child allowance, disabled) and other.
-40
-20
0
20
40
60
80
100
EU
Non
-EU EU
Non
-EU EU
Non
-EU EU
Non
-EU EU
Non
-EU EU
Non
-EU EU
Non
-EU EU
Non
-EU EU
Non
-EU EU
Non
-EU
1st 2nd 1st 2nd 1st 2nd 1st 2nd 1st 2nd
Belgium France Luxemburg Netherlands United Kingdom
%
employment rate difference in employment rate with natives

14
largest in Belgium (with 30 percentage points), although in other countries it is close to 20
percentage points. The United Kingdom has the lowest gap with 16 percentage points.
For the EU27 second generation, employment rate are similar to both natives and their first
generation, and this is the case for all countries. For most countries, the employment of the
non-EU27 second generation is much better than that of the first and in the case of
Luxemburg, the Netherlands and the United Kingdom very close to that of natives. Belgium is
here the exception: the employment rate is roughly the same for first and second non-EU
immigrants. As a consequence, the employment disadvantage of the non-EU27 second
generation is much greater in Belgium compared to neighbouring countries.
4.2 Differences in employment profile using the new database for Belgium
Given this particular position of Belgium we investigate into more depth these differences
using the linked dataset LFS&DWH. Table A.1.2 in Annex compares the employment rates of
natives and immigrants on the basis of the LFS 2008 ad hoc, the linked LFS&DWH dataset
2008 and 2012. There are some differences for 2008 between the two data sources: the
employment rate of the first generation is 2.5 à 3 percentage points lower according to the
LFS&DWH, while the non-EU second generation has a higher employment rate according to
this source (4.6 percentage points). As we already mentioned, LFS&DWH is probably more
reliable for defining the origin of the individuals, given that register data are used. An
additional factor is that the LFS ad hoc 2008 includes only data of the second quarter, while
the linked dataset includes the sample of the entire year, thus smoothing seasonal fluctuations.
4.2.1 Employment according to the ILO definition
Table 4.1 shows the activity, employment and unemployment rates of natives and immigrants
of the first and second generation according to origin for the years 2008-2012. The concepts
of activity, employment and unemployment are defined here as formulated by the
International Labour Organisation (ILO)9. Table 4.1 illustrates the difference between EU27
and non-EU27 immigrants, both in first and second generation. Within the first generation,
9 The (economic) activity rate measures the proportion of a working age population (in this case 20-44 years) who are active or potentially active members of the labour market. This rate combines employed and unemployed individuals and consequentially gives an indication of the proportion of people working or available for work (or training). The employment rate is calculated by dividing the number of persons aged 20 to 44 in employment (completed at least one hour of work in the period being measured, or are temporarily away from his or her job) by the total population of the same age group. The unemployment rate is defined as the percentage of the total labor force (all ‘active’ individuals) that is unemployed but actively seeking employment and willing to work.
15
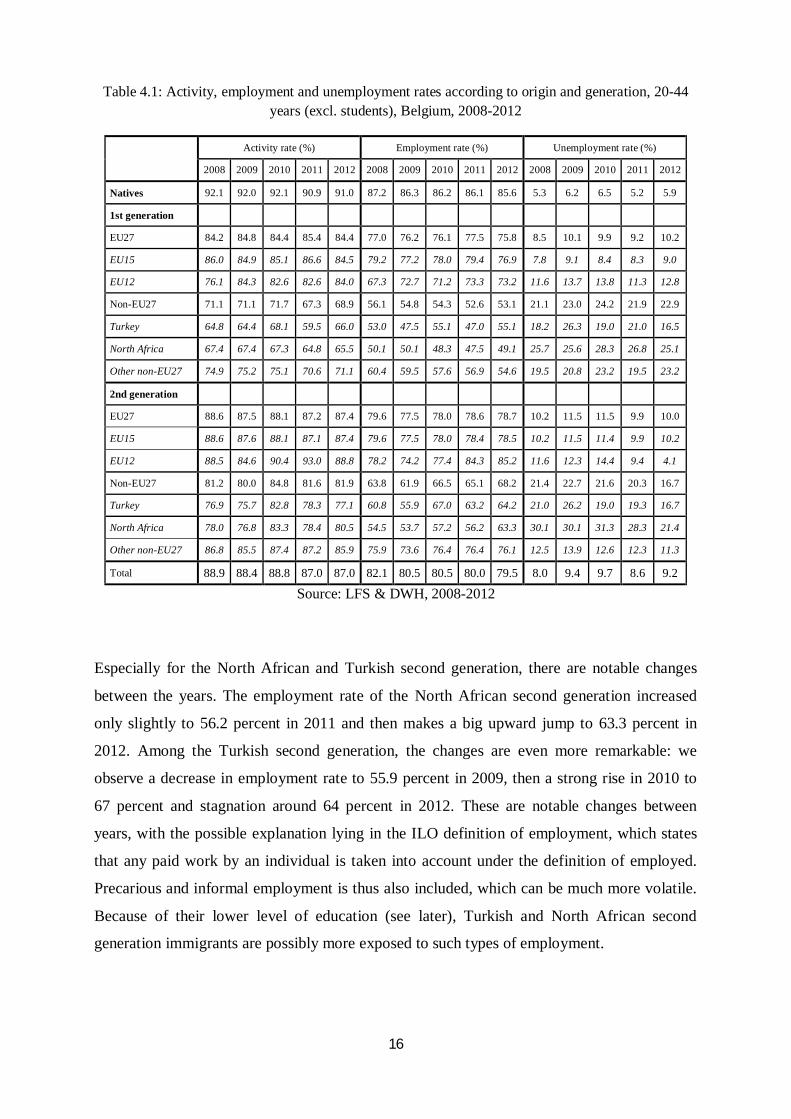
the employment rate of EU27 immigrants is 75.8 percent in 2012, which is almost 10
percentage points lower than native employment. Also, their unemployment rate is higher
than that of native unemployment (10 percent versus 5.9 percent). The employment of the
first generation born outside the EU27 is much lower. The group with the lowest employment
rate is the North African first generation, where only half of the population (49.1 percent) is at
work; for Turkish and other non-EU27 this is somewhat higher (55 percent). These
differences also show up in the second generation. For EU27 immigrants, the difference
between the two generations is rather small. Both the activity and employment rate of the
second generation with EU27 origin is about 2 to 4 percentage points higher than in the first
generation. For non-EU27 immigrants, the situation of the second generation is also better
than the first generation’s, with employment rates that are on average 15 percentage points
higher. There is within this group a strong difference according to origin. The second
generation with non-EU27-origin excluding Turkey and North Africa has a similar
employment situation compared to the second generation with EU27 origin. The situation of
the Turkish and North African second generation is better than the first generation, but still a
large gap with natives remains. Their employment rate is more than 20 percentage points
lower than that of natives (respectively 64.2 and 63.3 percent versus 85.6 percent). Also their
unemployment rate is strikingly higher than native unemployment (respectively 16.7 and 21.4
percent versus 5.9 percent).
Over the economic crisis period, we observe decreasing employment rates between 2008 and
2012 in general and for most groups. Compared to 2008, the employment position of natives
has fallen with 1.6 percentage points and for first generation EU27 it has decreased with 1.2
percentage points10. For non-EU27 immigrants, the drop is larger, namely 3 percentage
points. Decreases are much smaller for EU27 second generation, and for the non-EU27
second generation we even find an increase in employment rate from 63.8% to 68.2%. The
crisis effect has been strongest between 2008 and 2009, when roughly all groups experienced
a drop in employment rate and also the strongest increase in unemployment rates over the
period.
10 These changes are not statistically significant (p-value = 0.05).
16
Table 4.1: Activity, employment and unemployment rates according to origin and generation, 20-44 years (excl. students), Belgium, 2008-2012
Activity rate (%) Employment rate (%) Unemployment rate (%)
2008 2009 2010 2011 2012 2008 2009 2010 2011 2012 2008 2009 2010 2011 2012
Natives 92.1 92.0 92.1 90.9 91.0 87.2 86.3 86.2 86.1 85.6 5.3 6.2 6.5 5.2 5.9
1st generation EU27 84.2 84.8 84.4 85.4 84.4 77.0 76.2 76.1 77.5 75.8 8.5 10.1 9.9 9.2 10.2
EU15 86.0 84.9 85.1 86.6 84.5 79.2 77.2 78.0 79.4 76.9 7.8 9.1 8.4 8.3 9.0
EU12 76.1 84.3 82.6 82.6 84.0 67.3 72.7 71.2 73.3 73.2 11.6 13.7 13.8 11.3 12.8
Non-EU27 71.1 71.1 71.7 67.3 68.9 56.1 54.8 54.3 52.6 53.1 21.1 23.0 24.2 21.9 22.9
Turkey 64.8 64.4 68.1 59.5 66.0 53.0 47.5 55.1 47.0 55.1 18.2 26.3 19.0 21.0 16.5
North Africa 67.4 67.4 67.3 64.8 65.5 50.1 50.1 48.3 47.5 49.1 25.7 25.6 28.3 26.8 25.1
Other non-EU27 74.9 75.2 75.1 70.6 71.1 60.4 59.5 57.6 56.9 54.6 19.5 20.8 23.2 19.5 23.2
2nd generation EU27 88.6 87.5 88.1 87.2 87.4 79.6 77.5 78.0 78.6 78.7 10.2 11.5 11.5 9.9 10.0
EU15 88.6 87.6 88.1 87.1 87.4 79.6 77.5 78.0 78.4 78.5 10.2 11.5 11.4 9.9 10.2
EU12 88.5 84.6 90.4 93.0 88.8 78.2 74.2 77.4 84.3 85.2 11.6 12.3 14.4 9.4 4.1
Non-EU27 81.2 80.0 84.8 81.6 81.9 63.8 61.9 66.5 65.1 68.2 21.4 22.7 21.6 20.3 16.7
Turkey 76.9 75.7 82.8 78.3 77.1 60.8 55.9 67.0 63.2 64.2 21.0 26.2 19.0 19.3 16.7
North Africa 78.0 76.8 83.3 78.4 80.5 54.5 53.7 57.2 56.2 63.3 30.1 30.1 31.3 28.3 21.4
Other non-EU27 86.8 85.5 87.4 87.2 85.9 75.9 73.6 76.4 76.4 76.1 12.5 13.9 12.6 12.3 11.3
Total 88.9 88.4 88.8 87.0 87.0 82.1 80.5 80.5 80.0 79.5 8.0 9.4 9.7 8.6 9.2
Source: LFS & DWH, 2008-2012
Especially for the North African and Turkish second generation, there are notable changes
between the years. The employment rate of the North African second generation increased
only slightly to 56.2 percent in 2011 and then makes a big upward jump to 63.3 percent in
2012. Among the Turkish second generation, the changes are even more remarkable: we
observe a decrease in employment rate to 55.9 percent in 2009, then a strong rise in 2010 to
67 percent and stagnation around 64 percent in 2012. These are notable changes between
years, with the possible explanation lying in the ILO definition of employment, which states
that any paid work by an individual is taken into account under the definition of employed.
Precarious and informal employment is thus also included, which can be much more volatile.
Because of their lower level of education (see later), Turkish and North African second
generation immigrants are possibly more exposed to such types of employment.

17
Figure 4.2: 95% confidence interval employment rate by origin and generation, 20-44 years (excl. students),
Belgium, 2008 and 2012
Source: Own calculations, based on LFS & DWH, 2008-2012
Another possible, and probably more important, explanation is the structure of the sample.
The LFS is a cross-sectional sample with a different sampling for each year. The Turkish and
North African second generation is significantly younger than other groups (see later) and
therefore has a large new inflow in the selected age group every year. Also, there is a large
margin of error. When including confidence intervals (95 percent) for employment rates (see
Figure 4.2), several changes between 2008 and 2012 are not significant. In the second
generation, only for the North African second generation, the difference in employment
between 2008 and 2012 is significant. Overall, it appears that the crisis has had only a small
employment effect on migrants, as most differences are not significant. In Tables A.1.3a and
A.1.3b in Annex, the same numbers are given separately for men and women. The
employment of immigrant women born outside the EU27 is very low: about one third of the
female Turkish and North African first generation is at work, for other female immigrants
born outside the EU27 this is around one half. Turkish and North African women of the
second generation are more often active and more often employed than the first generation.
Their activity rate is much higher (nearly 30 percentage points for North African women).
This difference is also seen in employment (24 percentage points higher for North African
women of the second generation). The unemployment rate of the Turkish and North African
second generation remains high, with respectively 22.6 and 23.7 percent.
40
50
60
70
80
90
100
EU15 EU12 Turkey NorthernAfrica
Othernon-EU27
EU15 EU12 Turkey NorthernAfrica
Othernon-EU27
Natives 2nd generation 1st generation
2008 2012

18
In the following paragraphs, other dimensions of employment will be discussed. This
information is displayed for the most recent year for which data are available.
4.2.2 Employment according to the socio-economic nomenclature
The link with the DWH data allows verifying the administrative employment position. Where
the employment variable in the LFS is based on the ILO definition, the socio-economic base
nomenclature of data starts from social security rules. Figure 4.3 shows the distribution in our
sample according to the main source of income for each respondent according to the Belgian
social security. The category 'Other' are persons who are registered in the National Register,
but have no connection with the Belgian social security.
Figure 4.3: Socio-economic position according to socio-economic nomenclature by origin and generation, 20-44 years (excl. students), Belgium, 2012
Source: LFS & DWH 2012
These numbers largely confirm the outcomes according to the ILO definition. The share of
employees is much lower among all first generation groups when compared to natives; for the
second generation we observe shares close to natives for the EU27 immigrants. The share of
self-employed is relatively high among the EU12 group (especially for the first generation,
but also for the second); much smaller shares are found among the two North African groups
and the other non-EU27 first generation. There is a striking difference among non-employed
immigrants between the first and the second generation. When the second generation has no
job, they are much more likely to be found in unemployment. This is different from the first
0%10%20%30%40%50%60%70%80%90%
100%
EU15
EU12
EU27
Turk
ey
Nor
th A
fric
a
othe
r non
EU27
nonE
U27
EU15
EU12
EU27
Turk
ey
Nor
th A
fric
a
othe
r non
EU27
nonE
U27
native 1st generation 2nd generation
employee self-employed unemployed inactive social assistance disability other

19
generation, which is also characterized by high unemployment, but where much more
immigrants have no (more) link with the social security or enter social assistance, especially
in the group born outside the EU27.
4.2.3 Employment on the household level
The LFS&DWH data allows looking at the employment situation of the total household
where someone is residing, as it contains data on the work intensity of the household, more
specifically whether the household is or is not in a position of low work intensity (Low
Intensity Work). The work intensity of the household is seen as the ratio between the actual
volume of labour and the potential volume of labour of the household. The potential volume
of work is the maximum working volume of a household: this is achieved when all working-
age adults (excluding students) have worked full-time the entire year. A household is defined
as having low work intensity (LWI) if the work intensity is less than or equal to 0.2.
Table 4.2: Share of individuals in households with low work intensity by origin and generation, 20-44 years (excl. students), Belgium, 2010
Total Couples11 Singles
Natives 8.3% 4.9% 20.4% 1st generation EU27 23.5% 20.1% 33.3% EU15 25.2% 22.0% 34.7% EU12 19.9% 15.7% 30.3% Non-EU27 28.9% 23.74% 46.0% Turkey 22.8% 17.7% 56.2% North Africa 31.9% 27.5% 49.6% Other non-EU27 28.7% 23.2% 43.7% 2nd generation EU27 14.8% 8.8% 31.4% EU15 14.8% 8.7% 31.9% EU12 15.8% 15.4% 17.7% Non-EU27 21.7% 16.6% 34.8% Turkey 25.3% 20.4% 42.4% North Africa 25.9% 20.3% 39.8% Other non-EU27 14.9% 9.8% 26.8%
Source: LFS & DWH 2012
First generation non-EU27 immigrants have a high proportion of individuals in a LWI
household (28.9%) in comparison with natives (8.3%) (Table 4.2). The second generation
performs better on the level of work intensity than the first generation: the share of
individuals in households with low work intensity is lower for most origins. Nevertheless, the
11 Couples refer to households consisting of two working-age adults (irrespective of the presence of children). We present low household work intensity rates for individuals living in couples and single-adult households separately because household work intensity rates are, by definition, strongly dependent of household size.

20
proportion remains much higher than among natives, especially in the North African second
generation (26% live in an LWI household). Couples have a lower share of LWI than singles.
4.3 Wage differences
Not only do the first and second generation have different employment probabilities from
those of natives, also in terms of wage levels and other job characteristics, there are
substantial differences. The LFS&DWH contains earnings data of employees, self-employed
and civil servants. Figure 4.4 shows the wage distribution of gross earnings of employees
only. The data for civil servants and the self-employed are not presented as the number of
cases is too small for certain groups of immigrants for these categories to be analysed
separately. Moreover, reliability of income data on the self-employed is an issue and this
administrative data sample struggles with a very high proportion of missing values.
Figure 4.4: Gross yearly earned income distribution by origin and generation, 20-44 years (excl. students), Belgium, 2011
Source: LFS&DWH, 2012
The earnings distribution of first generation EU27 immigrants is close to that of natives, while
for the EU27 second generation low wages are somewhat more prevalent. For non-EU27
immigrants this pattern is even stronger, with a higher share of low wages for first generation
and especially second generation immigrants. Figure A.1.1 in Annex present more details and
shows that the disadvantage is largest for the Turkish second generation, with about 70%
0
5
10
15
20
25
native 1st generation EU27 1st generation nonEU27
1st generation nonEU27 2nd generation EU27 2nd generation nonEU27

21
having a gross income of less than 25,000 euros. This is similar to the situation of their first
generation. This different pattern of earnings relates mainly to differences in job
characteristics (e.g. type of contract and branch of activity), and less to differences in work
intensity (i.e. prevalence of part-time work), as we illustrate in the next section.
4.4 Differences in other job characteristics
Other indicators of job characteristics include type of contract, prevalence of part-time work,
job level and the occurrence of over qualification. We discuss these four topics in turn. An
important aspect of job quality is job security, measured here by type of contract. A
permanent contract provides greater protection against dismissal than a temporary contract.
The LFS provides information on the type of contract of each employee (permanent or
temporary) and provides additional information about the motive behind temporary labour.
One of the possible reasons is that the respondent wants a permanent job, but is unable to find
one. This can be interpreted as involuntary temporary employment.
Table 4.3: Share of temporary and involuntary temporary employment by origin and generation, Belgium, 20-44 years (excl. students), 2012
Temporary employment (as % of total employment)
Involuntary temporary employment (as % of temporary employed)
Natives 8.2% 12.6% 1st generation EU27 12.8% 17.3% EU15 12.7% 16.9% EU12 13.1% 18.3% Non-EU27 18.5% 12.7% Turkey 11.8% 14.1% North Africa 16.5% 16.1% Other non-EU27 20.8% 11.3% 2nd generation EU27 9.4% 10.7% EU15 9.3 11.0 EU12 10.8 0.0 Non-EU27 14.1% 8.8% Turkey 16.6 9.3 North Africa 13.0 6.4 Other non-EU27 14.3 11.0
Source: LFS & DWH, 2012
Table 4.3 shows the proportion of (involuntary) temporary employment of workers by origin
group. Temporary employment is more present among non-EU27 immigrants than among
natives, and this is the case for both generation groups. Interestingly, the prevalence of
involuntary temporary employment is relatively lower for these groups than for natives.

22
Table 4.4 shows the proportion of part-time work by origin for the total working population
and for men and women separately. For the total working population, differences between
natives, the first and the second generation are rather limited. For all origins, there is a higher
proportion of part-time work among women. For men, the proportion of part-time work is
only notably higher for the North African second generation (11% versus 5.7% for natives).
In the case of women, the proportion of part-time work is remarkably higher within the first
generation: more than half of the Turkish and North African women work part-time. Within
the female second generation, there is, except for the Turkish group, a lower proportion of
part-time work than for natives.
Table 4.4: Share of part-time by origin, generation and gender, 20-44 years (excl. students), Belgium, 2012
Total Men Women
Natives 20.7% 5.7% 37.7% 1st generation EU27 22.1% 6.9% 36.3% EU15 21.7% 6.9% 36.3% EU12 23.1% 6.8% 36.2% Non-EU27 24.3% 8.4% 47.2% Turkey 20.9% 5.9% 57.9% North Africa 21.0% 8.3% 50.9% Other non-EU27 26.5% 9.1% 44.8% 2nd generation EU27 20.1% 5.7% 37.3% EU15 20.5% 5.8% 38.1% EU12 7.0% 4.1% 10.9% Non-EU27 19.5% 7.9% 33.9% Turkey 20.1% 4.7% 44.0% North Africa 20.8% 11.0% 33.7% Other non-EU27 18.1% 5.9% 30.9%
Source: LFS & DWH, 2012
The job level is indicated by the codes of the International Standard Classification of
Occupations (ISCO). The ISCO scale ranks occupations according to job content and required
qualifications on a 9-point scale. The scale goes from the highest category 1 of high,
managerial positions to the lowest category 9 of low-skilled elementary jobs (category 0
includes armed forces occupations). As can be seen from Figure 4.5, almost half of employed
natives work in one of the three highest categories. For immigrants, there are large differences
according to origin. It is again the better position of the other non-EU27 second generation
that is remarkable, with nearly 6 out of 10 with a highly qualified job. However, this is an
exception, because the rest of both the first and second generation are overrepresented in the
lowest categories and underrepresented in the higher categories. But again, the position of the

23
second generation for most origins is better than for the first generation. Within the Turkish
and North African first generation, nearly 30 percent of the ILO-employed is working in the
lowest category of elementary labour. The position of the Turkish and North African second
generation is better, but especially the Turkish second generation is still working significantly
more often in lower categories than natives.
Figure 4.5: ISCO classification12 of employed population by origin and sex, Belgium, 20-44 years (excl. students), 2012
Source: LFS & DWH, 2012
Another factor in job quality is overqualification, where immigrants are indeed employed, but
at a lower job level than can be expected according to their level of education. This is an
indication of an underutilisation of their human capital. Table 4.5 shows the educational level
of natives and immigrants working in the lowest job category 9 of the ISCO scale. This is
only one possible definition of overqualification, but it shows already that the phenomenon is
more prevalent among the first generation than among the second. Except for the Turkish first
generation, just over 11 percent of the workers in the lowest job category is high-skilled,
among natives this is only 3.1 percent. In the second generation, this proportion of high-
educated in the ISCO 9 category is only slightly higher than for natives. The origin of degree
12 We distinguish three types of professions based on ISCO (International Standard Classification of Occupations), i.e. low-skilled (ISCO 9), medium-skilled (ISCO 4-8) and high-skilled (ISCO 0-3).
0%10%20%30%40%50%60%70%80%90%
100%
EU15
EU12
EU27
Turk
ey
Mor
occo
othe
r non
EU27
nonE
U27
EU15
EU12
EU27
Turk
ey
Mor
occo
othe
r non
EU27
nonE
U27
native 1st generation 2nd generation
Low-skilled Medium-skilled High-skilled

24
can play in role in this difference between the first (more likely foreign origin) and second
generation (more likely Belgian origin). Recognition of foreign degrees may be a barrier here.
Table 4.5: Level of education of the employed population in the ISCO 9 category by origin and sex, 20-44 years (excl. students), Belgium, 2012
Low-skilled
Medium-skilled High-skilled
Natives 37.2% 59.7% 3.1% 1st generation EU27 41.2 47.1 11.7 EU15 57.5 34.5 8.0 EU12 31.4 54.7 13.9 Non-EU27 55.6 34.2 10.1
Turkey 66.1 32.4 1.5
North Africa 55.6 33.2 11.2
Other non-EU27 52.9 35.3 11.9
2nd generation EU27 50.2 45.4 4.4
EU15 50.3 45.3 4.5
EU12 48.9 51.1 0.0
Non-EU27 47.8 46.7 5.6
Turkey 35.3 57.3 7.4
North Africa 56.2 38.7 5.1
Other non-EU27 45.5 50.5 4.0 Source: LFS & DWH, 2012
5 Description of explanatory variables of employment gap
In our statistical model we try to find an explanation for the employment rate gap of
immigrants and natives. Before we do this, we describe those factors that are included in the
model as explanatory variables, notably education (section 5.1), a set of socio-demographic
variables (section 5.2) and region of residence for the Belgian analysis only (section 5.3). In
each section we present the distribution of the characteristics for the countries we consider for
the international comparison using LFS ad hoc module, and for Belgium separately using
LFS&DWH. It is important to stress that for the international comparison, results relate to
2008, while for the LFS&DWH data we present here, we use the most recent data, notably
2012. As we have seen before, there are some important differences between the years 2008
and 2012 for Belgium, which is why the outcomes are not exactly the same for both analyses.
25
5.1 Education level
Human capital theory assumes that investment in education is rewarded by improved labour
market performance. We might expect that (lack of) human capital is a very important
determinant of individual employment chances. Hence, we include level of education in our
model as a possible important explanatory variable. Level of education is divided here into
three categories: low-skilled (ISCED13 0 through 2), medium-skilled (ISCED 3 and 4) and
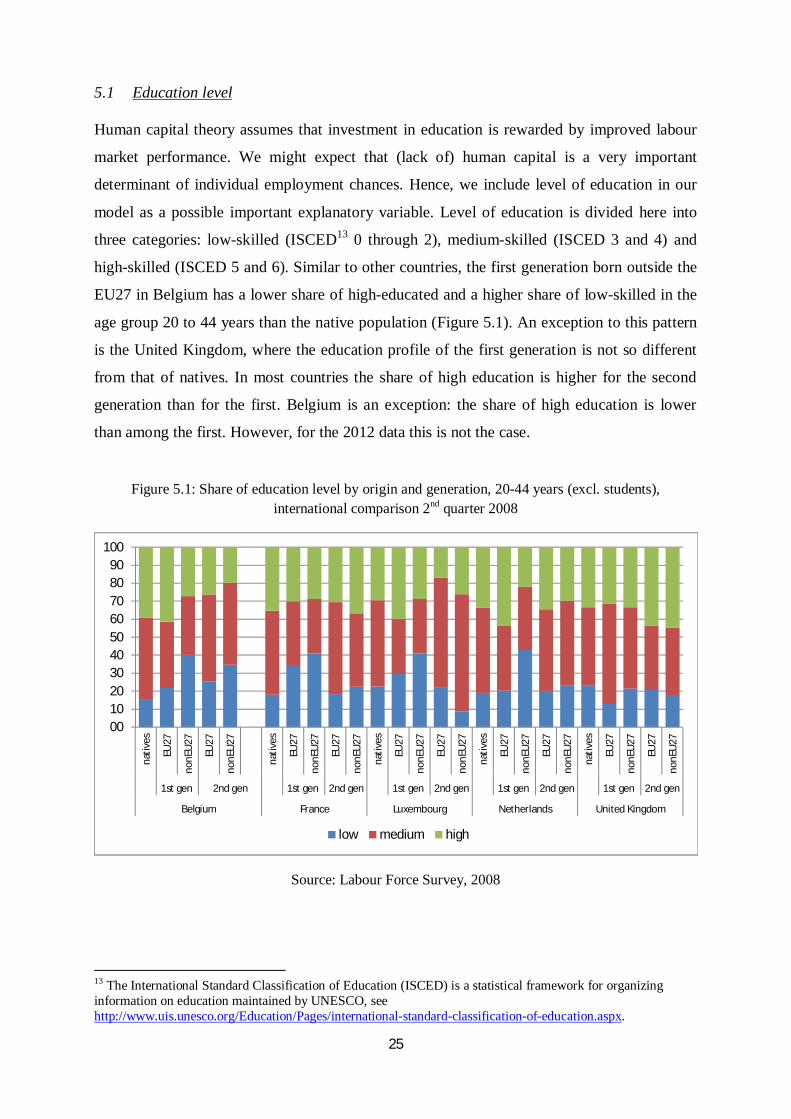
high-skilled (ISCED 5 and 6). Similar to other countries, the first generation born outside the
EU27 in Belgium has a lower share of high-educated and a higher share of low-skilled in the
age group 20 to 44 years than the native population (Figure 5.1). An exception to this pattern
is the United Kingdom, where the education profile of the first generation is not so different
from that of natives. In most countries the share of high education is higher for the second
generation than for the first. Belgium is an exception: the share of high education is lower
than among the first. However, for the 2012 data this is not the case.
Figure 5.1: Share of education level by origin and generation, 20-44 years (excl. students),
international comparison 2nd quarter 2008
Source: Labour Force Survey, 2008
13 The International Standard Classification of Education (ISCED) is a statistical framework for organizing information on education maintained by UNESCO, see http://www.uis.unesco.org/Education/Pages/international-standard-classification-of-education.aspx.
00102030405060708090
100
nativ
es
EU27
nonE
U27
EU27
nonE
U27
nativ
es
EU27
nonE
U27
EU27
nonE
U27
nativ
es
EU27
nonE
U27
EU27
nonE
U27
nativ
es
EU27
nonE
U27
EU27
nonE
U27
nativ
es
EU27
nonE
U27
EU27
nonE
U27
1st gen 2nd gen 1st gen 2nd gen 1st gen 2nd gen 1st gen 2nd gen 1st gen 2nd gen
Belgium France Luxembourg Netherlands United Kingdom
low medium high

26
Figure 5.2 shows the level of education of natives and immigrants for Belgium in 2012. The
second generation of immigrants generally has a higher level of education than the first and
this for all origins, which might indicate classic upward assimilation. However, there are still
large differences between the groups. The overrepresentation of low education levels among
Turkish and North African immigrants of the first generation (over 50%) is also seen in the
second generation (be it at a lesser degree). Compared to natives, a much higher proportion of
Turkish and North African second generation has not completed secondary education. The
opposite is seen in high education, where more than 40 percent of natives are high-skilled,
which is much lower among Turkish and North African origin groups (resp. 12.9% and
22.7%). Interestingly enough, the second generation from outside the EU27 has an education
profile that is even slightly stronger than that of natives, with a similar proportion of low-
educated and a higher share of high-skilled (54%, compared to 43% among natives).
Figure 5.2: Education level by origin and generation, Belgium, 20-44 years (excl. students), 2012
Source: LFS & DWH, 2012
5.2 Socio-demographic variables: age, gender and household composition
In the regression analysis in section 6 we include a set of socio-demographic variables as
controls. We briefly present here age and household composition; gender is also included in
the regression analysis, but as there were few differences across groups we do not present the
distribution of this variable.
0%10%20%30%40%50%60%70%80%90%
100%
EU15
EU12
EU27
Turk
ey
Nor
th A
fric
a
othe
r non
EU27
nonE
U27
EU15
EU12
EU27
Turk
ey
Nor
th A
fric
a
othe
r non
EU27
nonE
U27
native 1st generation 2nd generation
low medium high

27
Figure 5.3: Share of age groups by origin and generation, 20-44 years (excl. students), international
comparison, 2nd quarter 2008
Source: Labour Force Survey, 2008
Figure 5.4: Age distribution by origin and generation, 20-44 years (excl. students), Belgium, 2012
Source: LFS & DWH, 2012
0%
10%
20%
30%
40%
50%
60%
70%
80%
90%
100%na
tives
EU27
nonE
U27
EU27
nonE
U27
nativ
es
EU27
nonE
U27
EU27
nonE
U27
nativ
es
EU27
nonE
U27
EU27
nonE
U27
nativ
es
EU27
nonE
U27
EU27
nonE
U27
nativ
es
EU27
nonE
U27
EU27
nonE
U27
1st gen 2nd gen 1st gen 2nd gen 1st gen 2nd gen 1st gen 2nd gen 1st gen 2nd gen
Belgium France Luxembourg Netherlands United Kingdom
20-24 25-29 30-34 35-39 40-44
0%10%20%30%40%50%60%70%80%90%
100%
EU15
EU12
EU27
Turk
ey
Nor
th A
fric
a
othe
r non
EU27
nonE
U27
EU15
EU12
EU27
Turk
ey
Nor
th A
fric
a
othe
r non
EU27
nonE
U27
native 1st generation 2nd generation
20-24 25-29 30-34 35-39 40-44
28
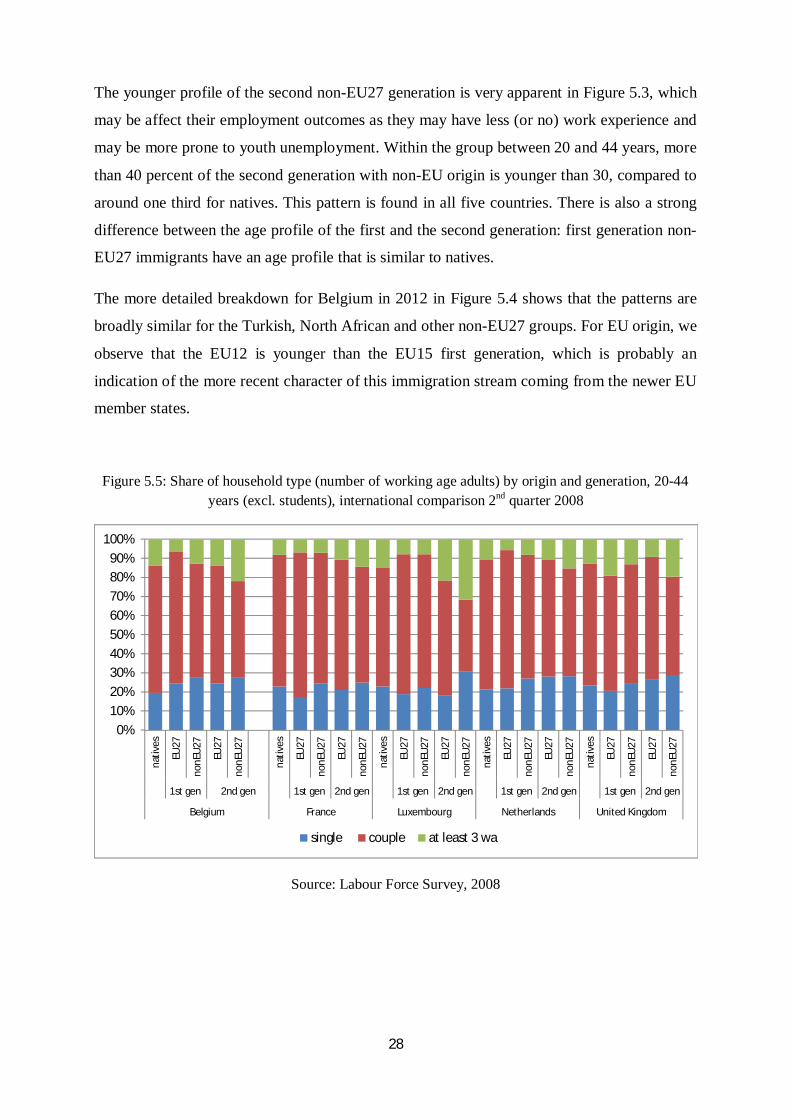
The younger profile of the second non-EU27 generation is very apparent in Figure 5.3, which
may be affect their employment outcomes as they may have less (or no) work experience and
may be more prone to youth unemployment. Within the group between 20 and 44 years, more
than 40 percent of the second generation with non-EU origin is younger than 30, compared to
around one third for natives. This pattern is found in all five countries. There is also a strong
difference between the age profile of the first and the second generation: first generation non-
EU27 immigrants have an age profile that is similar to natives.
The more detailed breakdown for Belgium in 2012 in Figure 5.4 shows that the patterns are
broadly similar for the Turkish, North African and other non-EU27 groups. For EU origin, we
observe that the EU12 is younger than the EU15 first generation, which is probably an
indication of the more recent character of this immigration stream coming from the newer EU
member states.
Figure 5.5: Share of household type (number of working age adults) by origin and generation, 20-44 years (excl. students), international comparison 2nd quarter 2008
Source: Labour Force Survey, 2008
0%10%20%30%40%50%60%70%80%90%
100%
nativ
es
EU27
nonE
U27
EU27
nonE
U27
nativ
es
EU27
nonE
U27
EU27
nonE
U27
nativ
es
EU27
nonE
U27
EU27
nonE
U27
nativ
es
EU27
nonE
U27
EU27
nonE
U27
nativ
es
EU27
nonE
U27
EU27
nonE
U27
1st gen 2nd gen 1st gen 2nd gen 1st gen 2nd gen 1st gen 2nd gen 1st gen 2nd gen
Belgium France Luxembourg Netherlands United Kingdom
single couple at least 3 wa
29
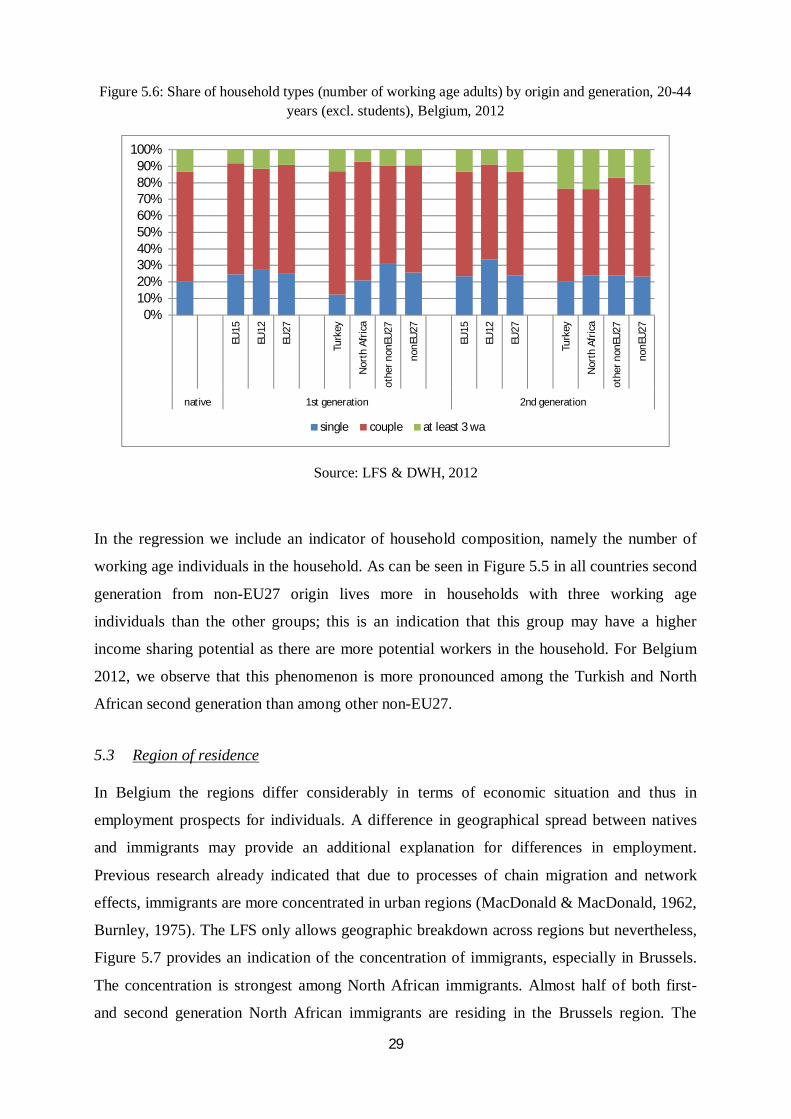
Figure 5.6: Share of household types (number of working age adults) by origin and generation, 20-44 years (excl. students), Belgium, 2012
Source: LFS & DWH, 2012
In the regression we include an indicator of household composition, namely the number of
working age individuals in the household. As can be seen in Figure 5.5 in all countries second
generation from non-EU27 origin lives more in households with three working age
individuals than the other groups; this is an indication that this group may have a higher
income sharing potential as there are more potential workers in the household. For Belgium
2012, we observe that this phenomenon is more pronounced among the Turkish and North
African second generation than among other non-EU27.
5.3 Region of residence
In Belgium the regions differ considerably in terms of economic situation and thus in
employment prospects for individuals. A difference in geographical spread between natives
and immigrants may provide an additional explanation for differences in employment.
Previous research already indicated that due to processes of chain migration and network
effects, immigrants are more concentrated in urban regions (MacDonald & MacDonald, 1962,
Burnley, 1975). The LFS only allows geographic breakdown across regions but nevertheless,
Figure 5.7 provides an indication of the concentration of immigrants, especially in Brussels.
The concentration is strongest among North African immigrants. Almost half of both first-
and second generation North African immigrants are residing in the Brussels region. The
0%10%20%30%40%50%60%70%80%90%
100%
EU15
EU12
EU27
Turk
ey
Nor
th A
fric
a
othe
r non
EU27
nonE
U27
EU15
EU12
EU27
Turk
ey
Nor
th A
fric
a
othe
r non
EU27
nonE
U27
native 1st generation 2nd generation
single couple at least 3 wa

30
overrepresentation in Brussels is present though less outspoken for Turkish immigrants,
where the distribution of the first and second generation is nearly equal.
Figure 5.7: Region of residence by origin and generation, 20-44 years (excl. students), Belgium, 2012
Source: LFS & DWH, 2012
The geographical spread of EU27 immigrants is different across generations. The first
generation is overrepresented in the Brussels region, while the children of EU27 immigrants
are overrepresented in the Walloon Region. This concentration of the first generation is
though biased by having limited the sample to the maximum age of 44 years.
6 Trying to understand the employment gap
In this section, we try to grasp the determining factors of these employment gaps and
investigate whether there are differences across countries in explanatory factors: is it due to
observable characteristics of the immigrant population, such as education level, or are there
unobservable factors, which is called in the literature 'ethnic penalty'? This is done by
applying a Fairlie decomposition of the binary variable of being ILO-employed or not, using
the unweighted sample (see section 3.2). We first put Belgium in international perspective
(section 6.1), and then go more deeply into the Belgium situation (section 6.2). Finally, we
0%
10%
20%
30%
40%
50%
60%
70%
80%
90%
100%EU
15
EU12
EU27
Turk
ey
Nor
th A
fric
a
othe
r non
EU27
nonE
U27
EU15
EU12
EU27
Turk
ey
Nor
th A
fric
a
oter
non
EU27
nonE
U27
native 1st generation 2nd generation
Flanders Wallonia Brussels
31
look at marginal effects for Belgium only, thus trying to capture the ethnic penalty (section
6.3).
6.1 Decomposition of the employment gap of immigrants: an international comparison
We first give the outcomes of the Fairlie decomposition for Belgium and neighbouring
countries on the basis of the LFS ad hoc module. As described in the previous section, the
explanatory variables are age, gender, household composition and education. We try to
explain the difference in employment rate gap between natives and the different origin groups
by these variables. The results are shown in Figure 6.1 for EU-27 and non-EU27 separately,
as the scale of the gap is very different for both groups. The expected employment rate gap is
the gap one would expect on the basis of the explanatory variables, i.e. the differences in
employment rate due to difference in composition of the sample. The unexplained part is the
difference between the observed and the expected employment rate gaps. In Belgium, France
and the Netherlands first generation EU immigrants have a larger unexplained part than the
second generation; in France and the Netherlands, the gap is almost entirely explained for the
second generation EU immigrants, and then especially by the difference in education level. In
Luxembourg and the United Kingdom, the gaps for EU immigrants are small, and a large part
is explained. In Belgium, the position of the EU second generation has improved somewhat
compared to the first; differences in education level, however, have become a more important
explanatory factor.
The special position of Belgium is even more striking when looking at non-EU27 immigrants:
as already indicated, the employment rate gap is very similar for the first and the second
generation; moreover, the unexplained part is similarly large for both groups (and much larger
than for the EU groups, note the difference in scale). This contrasts for instance with the
Netherlands (and to a lesser extent France and the United Kingdom), where the employment
rate gap declined substantially, especially accompanied by a steep drop in the unexplained
part. Differences in education level are the most important explaining factor in Belgium for
the second generation, while hardly playing a role in the other countries. This relates to the
education profiles which are more similar to natives in these countries than in Belgium (see
section 5.1).
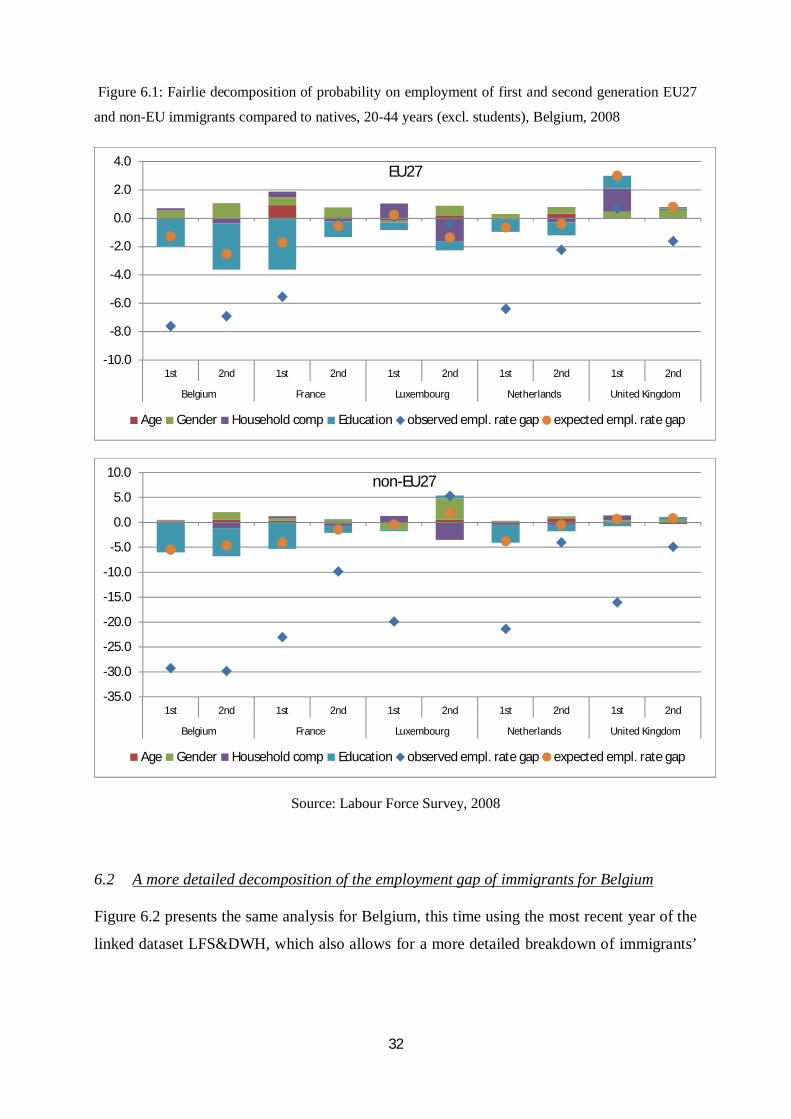
32
Figure 6.1: Fairlie decomposition of probability on employment of first and second generation EU27
and non-EU immigrants compared to natives, 20-44 years (excl. students), Belgium, 2008
Source: Labour Force Survey, 2008
6.2 A more detailed decomposition of the employment gap of immigrants for Belgium
Figure 6.2 presents the same analysis for Belgium, this time using the most recent year of the
linked dataset LFS&DWH, which also allows for a more detailed breakdown of immigrants’
-10.0
-8.0
-6.0
-4.0
-2.0
0.0
2.0
4.0
1st 2nd 1st 2nd 1st 2nd 1st 2nd 1st 2nd
Belgium France Luxembourg Netherlands United Kingdom
EU27
Age Gender Household comp Education observed empl. rate gap expected empl. rate gap
-35.0
-30.0
-25.0
-20.0
-15.0
-10.0
-5.0
0.0
5.0
10.0
1st 2nd 1st 2nd 1st 2nd 1st 2nd 1st 2nd
Belgium France Luxembourg Netherlands United Kingdom
non-EU27
Age Gender Household comp Education observed empl. rate gap expected empl. rate gap

33
groups14,15. For EU immigrants the gap between observed and expected employment rate is
relatively limited, and this is the case for both EU15 and EU12 immigrants, confirming the
pattern of the previous Figure. The unexplained part is very small for the second EU15
generation, with education and region of residence as the main explanatory variables.
Figure 6.2: Fairlie decomposition of probability on employment of first and second generation EU27 and non-EU27 immigrants compared to natives, 20-44 years (excl. students), Belgium 2012
Source: LFS&DWH, 2012
For non-EU27 immigrants the breakdown over different groups reveals some interesting
differences. For the first generation education is for the three groups the most important
explanatory factor, with region providing also a contribution to the explanation (household
composition has an opposite sign: this means that differences in household composition of the
Turkish and North African generation compared to natives are such that one would expect a
higher employment probability). For the second generation the unexplained part is still
important, though in absolute terms smaller than for the first generation (remember that the
14 The coefficients of the probit regressions and the employment probabilities for the different groups are given in Annex 2. 15 Region of residence is added as additional explanatory variable compared to the international comparison. For the first generation, nationality appeared also to be an important explanatory factor (see Corluy et al., 2011). This is, however, not a relevant variable for the second generation as more than 90% of the non-EU27 group has the Belgian nationality.
-40
-35
-30
-25
-20
-15
-10
-5
0
5
10
EU15 EU12 Turkey NorthAfrica
other nonEU27
EU15 EU12 Turkey NorthAfrica
other nonEU27
1st gen 2d gen
Age Gender Household composition Education Region observed empl. rate gap expected empl. rate gap

34
employment gap decreased for these groups from 2008 to 2012 due to a decreasing
employment rate of natives and increase for especially Turkish and North African second
generation, see table 4.1). Differences in education level provide for the Turkish and North
African second generation around 25% à 30% of the explanation of the employment gap
(shares that are rather similar to those of the first generation). This variable, however, plays
hardly a role in the explanation for the second generation of other non-EU27.
6.3 Marginal effects
In the previous analyses, we have attempted to determine to which extent composition effects
may explain differences in employment. It was, however, assumed that marginal effects were
equal between natives and the first and second generation of immigrants. The question may
be asked whether this assumption is adequate and whether there may be differences in
marginal effects between the different groups. As argued in section 3.2, average marginal
effects are another way of analysing the ethnic penalty. We perform a probit regression with
dependent variable whether the respondent is employed according to the ILO definition. The
explanatory variables consist of education, gender, age, household variables and region of
residence. Regarding education, the group of medium-skilled is taken as a reference group,
with dummy variables for high and low education. For age, dummy variables are given per
year added with a quadratic term, given the changing effect of age on employment over age.
The demographic variables are gender and household composition. The household variables
are a dummy variable for marriage or legal cohabitation and a dummy variable for having
children. Interaction terms are added for household composition and gender. We present the
average marginal effects for EU15 and EU12 together, as well as for Turkish and North
African, as the coefficients are very close to one another for these separate groups; providing
all the details would overburden the output.
The coefficients in Table 6.1 represent for Belgium 2012 the average marginal effects of the
independent variables on the probability of employment, estimated on the probability of
employment.

35
Table 6.1: Marginal effects on probability of employment, 20-44 years (excl. students), Belgium, 2012
Natives EU27 1st
generation
Turkish and North African 1st
generation
Other non-EU27 1st
generation
EU27 2nd generation
Turkish and North African 2nd generation
Other non-EU27 2nd generation
(N=19372) (N=2118) (N=2088) (N=1006) (N=658) (N=1410) (N=2042)
Low-skilled -0.135 *** -0.108 *** -0.111 *** -0.106 *** -0.121 *** -0.169 *** -0.161 ***
High-skilled 0.084 *** 0.123 *** 0.113 *** 0.109 *** 0.126 *** 0.183 *** 0.130 ***
Age 0.023 *** 0.022 *** 0.035 0.018 ** 0.040 *** 0.039 * 0.087 Age² 0.000 *** 0.000 *** 0.000 0.000 * -0.001 *** -0.001 -0.001
Female -0.027 *** 0.043 -0.085 -0.069 -0.022 ** -0.011 -0.086 **
Couple 0.056 *** -0.011 *** -0.058 0.023 0.071 *** -0.033 0.091 At least 1 child -0.022 *** -0.070 -0.094 *** -0.009 *** -0.019 -0.115 *** -0.041 Female*Couple -0.008 *** -0.076 *** -0.316 ** -0.111 ** -0.012 -0.202 * -0.032 ***
Female * At least 1 child -0.062 *** -0.105 *** -0.328 ** -0.126 ** -0.070 -0.216 * -0.060
Flemish Region 0.091 *** 0.084 *** 0.111 *** 0.032 *** 0.121 *** 0.116 *** 0.173 Walloon Region 0.015 0.043 0.010 *** -0.032 0.005 *** -0.003 0.109
Pseudo R² 0.143 0.137 0.090 0.123 0.148 0.139 0.063
Source: LFS & DWH, 2012. ***=p<0.01, **=p<0.05, *=p<0.1
The effects of education appear to be stronger for the second generation with non-EU27
origin than for the first generation and for natives. The effect of low education is more
negative and the effect of high education more positive on employment. This indicates that
the skill premium is larger for the second generation. We find this especially for those of
Turkish and North African origin: having a higher education degree increases their
employment probability substantially compared to having a secondary education degree. The
fact that the coefficients for higher education are smaller for the first generation probably
relates to the fact that often these degrees are of foreign origin16, which frequently face a
challenge of recognition in Belgium. Except in cases of foreign study, the high-skilled second
generation has obtained their degree at a Belgian institute of higher education. Therefore, this
human capital can be used immediately on the Belgian labour market. This is less self-evident
for the first generation.
A possible additional explanation may be differences in language skills, given the low
educational level of the sample. The effect of language skills should be much smaller for the
16 Moreover, reported levels of education in EU-LFS are self-defined.

36
non-EU 27 second generation than for the first generation, as the second generation was born
in Belgium and has participated in the Belgian education system, which is often in contrast to
the first generation. Unfortunately, the real impact of language skills cannot be examined
here.
Also interesting are the different marginal effects of the demographic variables. Earlier, it was
found that the employment of the female second generation, more specifically of Turkish and
North African origin, is remarkably low. Strangely enough, the effect of gender on
employment does not differ much in the second generation and is only significantly negative
for the second generation with non-EU27-origin. The crucial factor here is not female
employment as such, but the interaction between gender and household composition. The
interaction effect of gender and having children is not significant for the second generation of
EU27 origin, but strong and negative for the second generation of Turkish and North African
origin. It is thus apparent that the employment of the female 'non-Western' second generation
is only slightly lower when they are single or in a couple without children. However, as soon
as they have children, their employment is much lower, indicating a more difficult or absent
reintegration of the female Turkish and North African second generation after childbirth
compared to women of Belgian or EU27 origin.
7 Conclusion
In this report, we have examined the labour market position of second generation immigrants
in Belgium. Based on the LFS ad hoc 2008 data, it is shown that not only the first generation,
but also the second generation of non-EU27 origin has a much lower employment rate in
Belgium compared to neighbouring countries. While the employment gap between the first
generation and natives is similarly large in the five countries examined here, we observe that
in the neighbouring countries the second generation succeeds in closing the gap with natives.
According to the 2008 ad hoc module of LFS employment figures of the second generation in
Belgium are hardly better than those of the first generation. One would, however, expect the
second generation to perform better, as they should have a better knowledge of the local
language, better educational qualifications and greater opportunities for work experience on
the domestic labour market. To investigate this further, we have used a new database, namely
a link between LFS data with social security data of the Datawarehouse Arbeidsmarkt &
Sociale Bescherming. This new database allows for a much more accurate identification of the

37
second generation, as register data are used, compared to the self-reported variable in the LFS
ad hoc 2008. Given this difference, outcomes differ for Belgium 2008 when using the two
databases. The more accurate identification of second (and subsequent) generation migrants is
important if one wants to assess their socio-economic performance and the extent of labour
market assimilation. Hence, we recommend enabling such data matching in the future for
improved monitoring of labour market outcomes.
Based on this new dataset, we tried to uncover whether employment differences between the
first and second generation of immigrants in Belgium can be framed in the hypothesis of
respectively classical or segmented assimilation. When the second generation has a better
position on the labour market than the first generation of the same origin, this could point to
classical assimilation. We find indeed for 2008 that both EU27 and non-EU27 second
generation perform somewhat better than the first, but there are considerable differences
according to origin. Especially for other non-EU27 origin, we find a much better performance
of the second generation (15.5 percentage points higher employment rate than the first
generation). For those of Turkish and North African origin, the difference is smaller (around 5
percentage points). This rather points to segmented assimilation. For 2012, we find that the
employment gap between natives and the second generation has become smaller, on the one
hand because the native employment rate has decreased from 87.2% to 85.6%, while on the
other hand the rates for the second generation increased (contrary to what happened among
the first generation) to 64.2% for Turkish origin, 63.3% for North African origin and 76.1%
for other non-EU origin. Apparently, the crisis has hardly had a negative effect on the
employment of the second generation, which might indicate that the second generation
appears to be somewhat better equipped for the Belgian labour market than the first.
Summarizing, the Belgian case seems to correspond to the segmented socio-economic
assimilation theory than to the classical one, given the diversity in patterns across origin
groups.
We have also tried to detect explanations for the differences between natives and immigrants
of the first and second generation. Using a Fairlie decomposition we found for 2012 that the
second generation still has a large unexplained employment disadvantage, though it appears
to be smaller than among the first generation. Among the explanatory variables education is
the most important one, especially for those of Turkish and North African origin.
Analysis of marginal effects highlights the major differences between men and women.
Within the non-EU second generation, female employment remains very low and this seems

38
to be caused by different marginal effects of household composition. Within that particular
group, having children has a much stronger negative effect on employment than among
women of Belgian and EU origin.
However, important nuances must be placed in the results. The strong short-term fluctuations
in the employment of the Turkish and North African second generation between 2008 and
2012 are remarkable. Although their employment position over that period has improved, it is
still not a solid conclusion that the employment of the non-European second generation is
structurally improving. A period of four years is too short to determine whether these are
random fluctuations or a real trend of improved employment of the second generation. Further
research over a longer period seems recommended for this issue.
Despite these caveats the results allow for some indications of policy directions. Education is
not only for the first generation immigrants a crucial explanatory factor, also for the second
generation it is important, as part of the employment gap points to the lower educational
profile of especially children of Turkish and North African immigrants. Moreover, the skill
premium appears to be high for these groups: those that attain a higher degree have a much
higher employment probability than those that do not. Hence, further efforts are needed to
continue improving schooling trajectories and outcomes of the children of immigrants, as was
already found in the OECD PISA studies. Given the differences in outcomes across origin
group, a differentiated approach seems appropriate. Also the regional dimension illustrates
that special attention should go to the labour market position of the younger groups in
Brussels. Especially for the North African and other non-EU27 second generation, region was
part of the explanation of the employment gap, resulting from their overrepresentation in
Brussels. The data used in this paper do not allow to unravel whether this is due to labour
supply or demand factors. Next, given the strong impact of household composition (marriage
and presence of children) one might also consider to enhance use of formal childcare among
mothers with a non-European background, in order to improve their employment
opportunities. Finally, also the large unexplained part of the employment gap merits further
attention. Different factors may play a role here, some of them relating to the demand side of
the economy. Examples include discrimination, network effects, differences in preferences
etc. Even though these factors fall outside the scope of this study, they are part of the story of
attaining successful labour market inclusion of individuals with foreign origin.
39
References
Alba, R.D. & Nee, V. (1997). Rethinking Assimilation Theory for a New Era of Immigration. International Migration Review 31(4)
Algan, Y., Dustmann, C., Glitz, A. & Manning, A. (2009). The Economic Situation of First- and Second-Generation Immigrants in France, Germany, and the UK. Bonn: IZA
Aydemir, A. & Sweetman, A. (2006). First and Second Generation Immigrant Educational Attainment and Labor Market Outcomes: A Comparison of the United States and Canada. Bonn: IZA
Burnley, I.H. (1975). Immigrant Absorption in the Australian City, 1947-1971. International Migration Review 9(3), 319-333
Card, D. (2004). “Is the new Immigration really so bad?”. The Economic journal, 115(507), 300-323.
Changhwan, K., Hyeyoung, W. & Sakamoto, A. (2010). Does an Immigrant Background Ameliorate Racial Disadvantage? The Socioeconomic Attainments of Second-Generation African Americans. Sociological Forum 25(1), 123-146
Corluy, V., Marx, I. & Verbist, G. (2011), “Employment Chances and Changes of Immigrants in Belgium: The Impact of Citizenship”, International Journal of Comparative Sociology, vol.52 (4), pp.350-368.
Corluy, V. (2014). Labour Market Outcomes and Trajectories of Immigrants in Belgium. Doctoraatsthesis, Universiteit Antwerpen
Crul, M. & Doomernik, J. (2003). The Turkish and Moroccan Second Generation in the Netherlands: Divergent Trends between and Polarization within the Two Groups. International Migration Review 37(4), 1039-1064
Crul, M., Timmerman, C. & Vanderwaeren, E. (2003). The Second Generation in Belgium. International Migration Review 37(4), 1065-1090
De Keyser, T., Delhez, P. & Zimmer, H. (2012). De inschakeling van personen van buitenlandse origine op de arbeidsmarkt. NBB Economisch Tijdschrift 86(3), 25-45
Ekberg, J., Hammarstedt, M. & Shukur, G. (2010). Immigrant-native earnings differentials: SUR estimation applied on three generations. Annals of Regional Science 45, 705–720
Ekberg, J. & Rooth, D-O (2003). Unemployment and earnings for second generation immigrants in Sweden. Ethnic background and parent composition. Journal of Population Economics 16, 787–814
Eurostat (2011). Migrants in Europe: A statistical portrait of the first and second generation. Luxemburg: Europese Commissie
Fairlie, R.W. (2005). An extension of the Blinder-Oaxaca Decomposition Technique to Logit and Probit Models. Journals of Economic and Social Measurement 30, 305-316
Feliciano, C. & Waldinger, R. (2004). Will the new second generation experience downward assimilation? Segmented assimilation re-assessed. Ethnic and Racial Studies 27(3), 376-402
Fernández-Kelly, P. , Haller, W. & Portes, A. (2009). The Adaptation of the Immigrant Second Generation in America: A Theoretical Overview and Recent Evidence. Journal of Ethnic and Migration Studies 35(7), 1077-1104
40
Fibbi, R, Lerch, M. & Wanner, P. (2006). Unemployment and discrimination against youth of immigrant origin in Switzerland: when the name makes the difference. Journal of International Migration and Integration 7, 351–66
Fleischmann, F. & Dronkers, J. (2007). The effects of social and labour market policies of EU-countries on the socio-economic integration of first and second generation immigrants from different countries of origin. European University Institute Working Papers 2007(19)
Gans, H.J. (1992). Second- generation decline: Scenarios for the Economic and Ethnic Futures of the post-1965 American Immigrants. Ethnic and Racial Studies 15(2), 173-192
Greenman, E. & Xie, Y. (2005). Segmented Assimilation Theory: A Reformulation and Empirical Test. Ann Arbor: University of Michigan, Population Studies Center
Haller, W., Lynch, S.M. & Portes, A. (2011). Dreams Fulfilled, Dreams Shattered: Determinants of Segmented Assimilation in the Second Generation. Social Forces 89(3), 733-762
Hammarstedt, M. (2009). Intergenerational Mobility and the Earnings Position of First-, Second-, and Third-Generation Immigrants. Kyklos 62(2), 275–292
Heath, A.F. (2009). The Labour Market Integration of the Children of Immigrants. Oxford: Nuffield College, Oxford University
Heath, AF (2010), “Main Determinants of Education and Labour Market Outcomes”, in OECD (2010) Equal Opportunities? The Labour Market Integration of the Children of Immigrants, OECD Publishing, Paris, pp.115-127.
Heath, A.F. & Cheung, S.Y. (2007). Unequal Chances: Ethnic Minorities in Western Labour Markets. Oxford: Oxford University Press
Heath, A.F., Kilpi, E. & Rothon, C. (2008). The Second Generation in Western Europe: Education, Unemployment and Occupational Attainment. Annual Review of Sociology 34, 211-235
Herzog-Punzenberger, B. (2003). Ethnic Segmentation in School and Labor Market: 40 Year Legacy of Austrian Guestworker Policy. International Migration Review 37(4), 1120-1144
Husted, L., Nielsen, H.S., Rosholm, M. & Smith, N. (2003). The School-to-Work Transition of 2nd Generation Immigrants in Denmark. Journal of Population Economics 16(4), 755-786
Kahanec, M. and Zacieva, A. (2009), “Labor market outcomes of immigrants and non-citizens in the EU: an East-West comparison”, International Journal of Manpower, Vol. 30 No. 1, pp. 97-115
Kalter, F. & Kogan, I. (2006), “Ethnic Inequalities at the Transition from School to Work in Belgium and Spain: Discrimination or Self-Exclusion?”, Research in Social Stratification and Mobility, vol. 24, pp. 259-74.
Kasinitz, P., Mollenkopf, J.H. Tran, V.C & Waters, M.C. (2010). Segmented assimilation revisited: types of acculturation and socioeconomic mobility in young adulthood. Ethnic and Racial Studies 33(7), 1168-1193
Liebig, T. and S. Widmaier (2010), “Overview - Children of Immigrants in the Labour Markets of OECD and EU Countries”, in OECD (ed.), Equal Opportunities? The Labour Market Integration of the Children of Immigrants, OECD Publishing, Paris.
MacDonald, J.S. & MacDonald, L.D. (1962). Chain Migration, Ethnic Neighborhood Formation and Social Networks. Social Research 29, 433-448

41
Meurs, D. Pailhé, A. & Simon, P. (2006). The Persistence of Intergenerational Inequalities Linked to Immigration: Labour Market Outcomes for Immigrants and Their Descendants in France. Population 61(5/6), 645-682
Martens A. Ouali, N., Van de maele, M., Vertommen, S.,Dryon, P. & Verhoeven, H. (2005), Etnische discriminatie op de arbeidsmarkt in het Brusselse Hoofdstedelijk Gewest,KUL/ULB, Leuven/Brussel.
Neels, K. (2001), “Education and the transition to employment: young Turkish and Moroccan adults in Belgium”, in Lestaeghe, R. (Ed.), Communities and generations: Turkish and Moroccan populations in Belgium, NIDI-CBGS, Brussel, pp. 243-279.
Neumark, D (1988), “Employers’ discriminatory behavior and the estimation of wage discrimination”, Journal of Human Resources, Vol. 23 No. 3, pp. 279-295.
Nordin, M. & Rooth, D-O (2009). The Ethnic Employment and Income Gap in Sweden: Is Skill or Labor Market Discrimination the Explanation? Scandinavian Journal of Economics 111(3), 487–510
Oaxaca, R. (1973), “Male-female wage differentials in urban labor markets”, International Economic Review, Vol. 14 No. 3, pp. 693-709.
OECD (2010), Equal Opportunities? The Labour Market Integration of the Children of Immigrants, OECD Publishing, Paris.
Perlmann & Waldinger (1997). Second Generation Decline? Children of Immigrants, Past and Present, A Reconsideration. International Migration Review 31(4), 893-922
Phalet, K. & Heath, A. (2010). From Ethnic Boundaries to Ethnic Penalties: Urban Economies and the Turkish Second Generation. American Behavioral Scientist, 53(12), 1824-1850
Portes, A. & Zhou, M. (1993). The New Second Generation: Segmented Assimilation and its Variants among post-1965 Youth. Annals of the American Academy of Political and Social Science (530), 74-98
Simon, P. (2003). France and the Unknown Second Generation. International Migration Review 37(4), 1091-1119
Tu, J. (2010). Explaining the Labour Market Outcomes of First, Second and Third Generation Immigrants in Canada. Bonn: IZA
Worbs, S. (2003). The Second Generation in Germany: Between School and Labor Market. International Migration Review 37(4), 1011-1038
Zhou, M. (1997). Segmented Assimilation: Issues, Controversies and Recent Research on the New Second Generation. International Migration Review 31(4), 975-1008

42
Annex 1: Additional Figures and Tables
Figure A.1.1: Gross earned income wage earners Belgian population by origin and generation, 20-44 years, excluding students, 2011
Source: DWH, 2012
Table A.1.1: Share (%) of different groups of non-EU27 immigrants, 20-44 years (excl. students), Belgium, 2008-2012
1st generation 2nd generation
2008 2009 2010 2011 2012 2008 2009 2010 2011 2012 Turkey 14.8 13.9 13.5 12.5 12.5 17.5 17.8 19.0 20.0 16.9 North Africa 30.9 33.0 31.4 32.4 28.9 44.0 43.3 42.5 43.0 45.9 Central and Eastern Europe 19.4 20.0 18.4 19.2 20.9 22.2 23.4 23.0 23.5 22.4 Central and Southern Africa 12.3 11.5 12.4 11.8 14.4 3.7 3.5 2.6 1.8 2.9 Northern America 1.2 1.2 2.0 1.3 1.3 0.0 0.1 0.0 0.0 0.1 Latin America 5.1 5.2 5.1 5.9 5.2 1.3 0.9 1.4 1.4 1.4 Asia 15.9 15.0 16.9 16.7 16.8 4.0 3.9 4.4 3.9 4.2 Other 0.3 0.2 0.2 0.1 0.1 7.3 7.2 7.2 6.3 6.3 Total 100 100 100 100 100 100 100 100 100 100
Source: LFS & DWH, 2008-2012
0%
10%
20%
30%
40%
50%
60%
70%
80%
90%
100%EU
15
EU12
EU27
Turk
ey
Nor
th A
fric
a
othe
r non
EU27
nonE
U27
EU15
EU12
EU27
Turk
ey
Nor
th A
fric
a
othe
r non
EU27
nonE
U27
native 1st generation 2nd generation
0 - 5000 5000 - 15000 15000 - 25000 25000 - 35000
35000 - 45000 45000 - 55000 55000 - 65000 > 65000
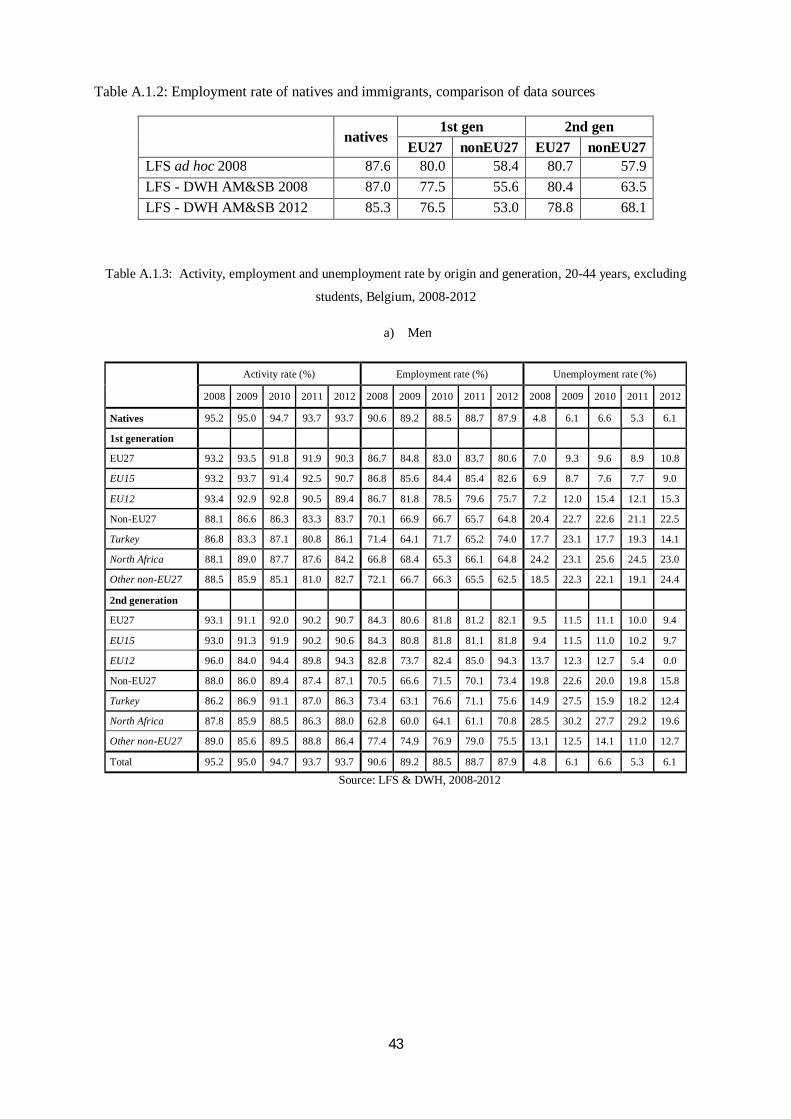
43
Table A.1.2: Employment rate of natives and immigrants, comparison of data sources
natives
1st gen 2nd gen EU27 nonEU27 EU27 nonEU27
LFS ad hoc 2008 87.6 80.0 58.4 80.7 57.9 LFS - DWH AM&SB 2008 87.0 77.5 55.6 80.4 63.5 LFS - DWH AM&SB 2012 85.3 76.5 53.0 78.8 68.1
Table A.1.3: Activity, employment and unemployment rate by origin and generation, 20-44 years, excluding
students, Belgium, 2008-2012
a) Men
Activity rate (%) Employment rate (%) Unemployment rate (%)
2008 2009 2010 2011 2012 2008 2009 2010 2011 2012 2008 2009 2010 2011 2012
Natives 95.2 95.0 94.7 93.7 93.7 90.6 89.2 88.5 88.7 87.9 4.8 6.1 6.6 5.3 6.1
1st generation EU27 93.2 93.5 91.8 91.9 90.3 86.7 84.8 83.0 83.7 80.6 7.0 9.3 9.6 8.9 10.8
EU15 93.2 93.7 91.4 92.5 90.7 86.8 85.6 84.4 85.4 82.6 6.9 8.7 7.6 7.7 9.0
EU12 93.4 92.9 92.8 90.5 89.4 86.7 81.8 78.5 79.6 75.7 7.2 12.0 15.4 12.1 15.3
Non-EU27 88.1 86.6 86.3 83.3 83.7 70.1 66.9 66.7 65.7 64.8 20.4 22.7 22.6 21.1 22.5
Turkey 86.8 83.3 87.1 80.8 86.1 71.4 64.1 71.7 65.2 74.0 17.7 23.1 17.7 19.3 14.1
North Africa 88.1 89.0 87.7 87.6 84.2 66.8 68.4 65.3 66.1 64.8 24.2 23.1 25.6 24.5 23.0
Other non-EU27 88.5 85.9 85.1 81.0 82.7 72.1 66.7 66.3 65.5 62.5 18.5 22.3 22.1 19.1 24.4
2nd generation EU27 93.1 91.1 92.0 90.2 90.7 84.3 80.6 81.8 81.2 82.1 9.5 11.5 11.1 10.0 9.4
EU15 93.0 91.3 91.9 90.2 90.6 84.3 80.8 81.8 81.1 81.8 9.4 11.5 11.0 10.2 9.7
EU12 96.0 84.0 94.4 89.8 94.3 82.8 73.7 82.4 85.0 94.3 13.7 12.3 12.7 5.4 0.0
Non-EU27 88.0 86.0 89.4 87.4 87.1 70.5 66.6 71.5 70.1 73.4 19.8 22.6 20.0 19.8 15.8
Turkey 86.2 86.9 91.1 87.0 86.3 73.4 63.1 76.6 71.1 75.6 14.9 27.5 15.9 18.2 12.4
North Africa 87.8 85.9 88.5 86.3 88.0 62.8 60.0 64.1 61.1 70.8 28.5 30.2 27.7 29.2 19.6
Other non-EU27 89.0 85.6 89.5 88.8 86.4 77.4 74.9 76.9 79.0 75.5 13.1 12.5 14.1 11.0 12.7
Total 95.2 95.0 94.7 93.7 93.7 90.6 89.2 88.5 88.7 87.9 4.8 6.1 6.6 5.3 6.1
Source: LFS & DWH, 2008-2012

44
b) Women
Activity rate (%) Employment rate (%) Unemployment rate (%)
2008 2009 2010 2011 2012 2008 2009 2010 2011 2012 2008 2009 2010 2011 2012
Natives 88.8 88.8 89.4 87.9 88.1 83.6 83.2 83.7 83.3 83.1 5.8 6.3 6.4 5.1 5.7
1st generation EU27 76.3 77.2 77.7 79.9 79.4 68.7 68.7 69.8 72.4 71.8 10.0 11.0 10.2 9.4 9.6
EU15 79.5 76.7 79.0 81.5 79.2 72.5 69.4 71.7 74.2 72.0 8.8 9.6 9.3 9.0 9.0
EU12 63.5 78.5 74.5 76.4 79.9 53.2 66.7 65.4 68.4 71.3 16.3 15.1 12.3 10.5 10.7
Non-EU27 55.5 55.9 58.3 52.3 55.1 43.2 42.9 42.9 40.2 42.1 22.2 23.4 26.3 23.1 23.5
Turkey 41.1 40.8 47.4 36.9 43.1 33.2 26.8 37.2 27.6 33.8 19.2 34.3 21.6 25.1 21.8
North Africa 42.9 42.3 45.9 40.6 44.3 30.3 28.9 30.4 27.6 31.2 29.2 31.7 33.8 32.0 29.6
Other non-EU27 64.6 66.3 66.8 61.7 61.7 51.4 53.6 50.5 49.5 48.2 20.4 19.2 24.4 19.8 21.9
2nd generation EU27 84.0 83.7 84.1 84.2 83.9 74.8 74.1 74.0 76.0 74.9 11.0 11.5 12.0 9.7 10.7
EU15 84.1 83.6 84.1 83.8 83.9 74.8 74.0 74.1 75.8 74.9 11.1 11.5 11.9 9.6 10.7
EU12 81.3 85.2 84.3 96.5 83.1 73.8 74.6 69.8 83.5 75.7 9.3 12.4 17.2 13.5 8.9
Non-EU27 74.3 74.8 80.1 75.8 76.4 57.1 57.7 61.4 60.0 62.8 23.2 22.8 23.3 20.9 17.8
Turkey 65.8 65.6 75.0 69.5 67.3 45.8 49.4 58.0 55.1 52.1 30.5 24.7 22.6 20.8 22.6
North Africa 68.9 69.4 78.1 71.2 72.6 46.9 48.6 50.6 51.7 55.4 32.0 29.9 35.3 27.4 23.7
Other non-EU27 84.6 85.5 85.1 85.3 85.2 74.4 72.5 75.9 73.5 76.8 12.0 15.2 10.8 13.9 9.8
Total 88.8 88.8 89.4 87.9 88.1 83.6 83.2 83.7 83.3 83.1 5.8 6.3 6.4 5.1 5.7
Source: LFS & DWH, 2008-2012
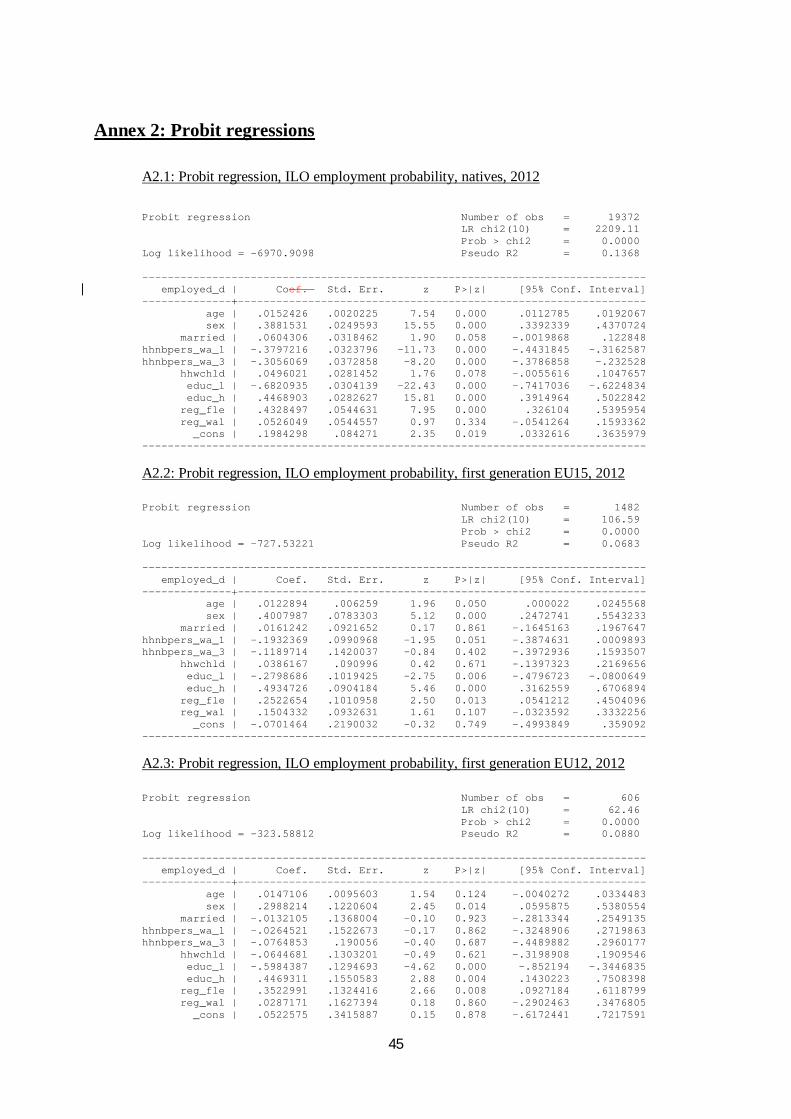
45
Annex 2: Probit regressions
A2.1: Probit regression, ILO employment probability, natives, 2012
Probit regression Number of obs = 19372 LR chi2(10) = 2209.11 Prob > chi2 = 0.0000 Log likelihood = -6970.9098 Pseudo R2 = 0.1368 ------------------------------------------------------------------------------- employed_d | Coef. Std. Err. z P>|z| [95% Conf. Interval] --------------+---------------------------------------------------------------- age | .0152426 .0020225 7.54 0.000 .0112785 .0192067 sex | .3881531 .0249593 15.55 0.000 .3392339 .4370724 married | .0604306 .0318462 1.90 0.058 -.0019868 .122848 hhnbpers_wa_1 | -.3797216 .0323796 -11.73 0.000 -.4431845 -.3162587 hhnbpers_wa_3 | -.3056069 .0372858 -8.20 0.000 -.3786858 -.232528 hhwchld | .0496021 .0281452 1.76 0.078 -.0055616 .1047657 educ_l | -.6820935 .0304139 -22.43 0.000 -.7417036 -.6224834 educ_h | .4468903 .0282627 15.81 0.000 .3914964 .5022842 reg_fle | .4328497 .0544631 7.95 0.000 .326104 .5395954 reg_wal | .0526049 .0544557 0.97 0.334 -.0541264 .1593362 _cons | .1984298 .084271 2.35 0.019 .0332616 .3635979 -------------------------------------------------------------------------------
A2.2: Probit regression, ILO employment probability, first generation EU15, 2012 Probit regression Number of obs = 1482 LR chi2(10) = 106.59 Prob > chi2 = 0.0000 Log likelihood = -727.53221 Pseudo R2 = 0.0683 ------------------------------------------------------------------------------- employed_d | Coef. Std. Err. z P>|z| [95% Conf. Interval] --------------+---------------------------------------------------------------- age | .0122894 .006259 1.96 0.050 .000022 .0245568 sex | .4007987 .0783303 5.12 0.000 .2472741 .5543233 married | .0161242 .0921652 0.17 0.861 -.1645163 .1967647 hhnbpers_wa_1 | -.1932369 .0990968 -1.95 0.051 -.3874631 .0009893 hhnbpers_wa_3 | -.1189714 .1420037 -0.84 0.402 -.3972936 .1593507 hhwchld | .0386167 .090996 0.42 0.671 -.1397323 .2169656 educ_l | -.2798686 .1019425 -2.75 0.006 -.4796723 -.0800649 educ_h | .4934726 .0904184 5.46 0.000 .3162559 .6706894 reg_fle | .2522654 .1010958 2.50 0.013 .0541212 .4504096 reg_wal | .1504332 .0932631 1.61 0.107 -.0323592 .3332256 _cons | -.0701464 .2190032 -0.32 0.749 -.4993849 .359092 -------------------------------------------------------------------------------
A2.3: Probit regression, ILO employment probability, first generation EU12, 2012 Probit regression Number of obs = 606 LR chi2(10) = 62.46 Prob > chi2 = 0.0000 Log likelihood = -323.58812 Pseudo R2 = 0.0880 ------------------------------------------------------------------------------- employed_d | Coef. Std. Err. z P>|z| [95% Conf. Interval] --------------+---------------------------------------------------------------- age | .0147106 .0095603 1.54 0.124 -.0040272 .0334483 sex | .2988214 .1220604 2.45 0.014 .0595875 .5380554 married | -.0132105 .1368004 -0.10 0.923 -.2813344 .2549135 hhnbpers_wa_1 | -.0264521 .1522673 -0.17 0.862 -.3248906 .2719863 hhnbpers_wa_3 | -.0764853 .190056 -0.40 0.687 -.4489882 .2960177 hhwchld | -.0644681 .1303201 -0.49 0.621 -.3198908 .1909546 educ_l | -.5984387 .1294693 -4.62 0.000 -.852194 -.3446835 educ_h | .4469311 .1550583 2.88 0.004 .1430223 .7508398 reg_fle | .3522991 .1324416 2.66 0.008 .0927184 .6118799 reg_wal | .0287171 .1627394 0.18 0.860 -.2902463 .3476805 _cons | .0522575 .3415887 0.15 0.878 -.6172441 .7217591

46
-------------------------------------------------------------------------------
A2.4: Probit regression, ILO employment probability, first generation Turkey, 2012 Probit regression Number of obs = 416 LR chi2(10) = 96.50 Prob > chi2 = 0.0000 Log likelihood = -238.36231 Pseudo R2 = 0.1683 ------------------------------------------------------------------------------- employed_d | Coef. Std. Err. z P>|z| [95% Conf. Interval] --------------+---------------------------------------------------------------- age | .0024013 .0114132 0.21 0.833 -.0199682 .0247708 sex | 1.063927 .1383778 7.69 0.000 .7927116 1.335142 married | -.0669094 .2286204 -0.29 0.770 -.5149972 .3811784 hhnbpers_wa_1 | -.2501947 .2443616 -1.02 0.306 -.7291345 .2287452 hhnbpers_wa_3 | -.3554531 .2072487 -1.72 0.086 -.761653 .0507469 hhwchld | .1822561 .1910231 0.95 0.340 -.1921424 .5566545 educ_l | -.3298096 .1460583 -2.26 0.024 -.6160787 -.0435405 educ_h | .3031165 .2728983 1.11 0.267 -.2317543 .8379872 reg_fle | .0989186 .175563 0.56 0.573 -.2451785 .4430157 reg_wal | -.5011894 .1919137 -2.61 0.009 -.8773333 -.1250454 _cons | -.2496211 .4759154 -0.52 0.600 -1.182398 .683156 -------------------------------------------------------------------------------
A2.5: Probit regression, ILO employment probability, first generation North Africa, 2012 Probit regression Number of obs = 994 LR chi2(10) = 176.64 Prob > chi2 = 0.0000 Log likelihood = -600.01813 Pseudo R2 = 0.1283 ------------------------------------------------------------------------------- employed_d | Coef. Std. Err. z P>|z| [95% Conf. Interval] --------------+---------------------------------------------------------------- age | .0335225 .0075531 4.44 0.000 .0187187 .0483262 sex | .8196452 .088403 9.27 0.000 .6463784 .9929119 married | -.0714076 .123002 -0.58 0.562 -.3124871 .1696719 hhnbpers_wa_1 | -.0565848 .1276531 -0.44 0.658 -.3067803 .1936108 hhnbpers_wa_3 | .1540244 .1658419 0.93 0.353 -.1710196 .4790685 hhwchld | .0327778 .1092294 0.30 0.764 -.1813078 .2468634 educ_l | -.3853062 .0959781 -4.01 0.000 -.5734198 -.1971926 educ_h | .3406034 .1286891 2.65 0.008 .0883774 .5928294 reg_fle | .2686874 .1021039 2.63 0.009 .0685675 .4688073 reg_wal | .1754673 .1067273 1.64 0.100 -.0337144 .384649 _cons | -1.57825 .2784213 -5.67 0.000 -2.123946 -1.032554 -------------------------------------------------------------------------------
A2.6: Probit regression, ILO employment probability, first generation other nonEU, 2012 Probit regression Number of obs = 2042 LR chi2(10) = 169.57 Prob > chi2 = 0.0000 Log likelihood = -1320.2108 Pseudo R2 = 0.0603 ------------------------------------------------------------------------------- employed_d | Coef. Std. Err. z P>|z| [95% Conf. Interval] --------------+---------------------------------------------------------------- age | .0259307 .0047951 5.41 0.000 .0165325 .0353288 sex | .4106159 .0595773 6.89 0.000 .2938466 .5273852 married | -.0504567 .0679495 -0.74 0.458 -.1836353 .0827219 hhnbpers_wa_1 | -.1681483 .0753275 -2.23 0.026 -.3157875 -.020509 hhnbpers_wa_3 | -.1319804 .1051033 -1.26 0.209 -.3379791 .0740183 hhwchld | .099342 .0675058 1.47 0.141 -.032967 .231651 educ_l | -.2838311 .0691406 -4.11 0.000 -.4193442 -.148318 educ_h | .3008409 .0713801 4.21 0.000 .1609385 .4407433 reg_fle | .084027 .0689535 1.22 0.223 -.0511194 .2191733 reg_wal | -.0893009 .0732257 -1.22 0.223 -.2328206 .0542189 _cons | -.893699 .1739602 -5.14 0.000 -1.234655 -.5527432 -------------------------------------------------------------------------------

47
A2.7: Probit regression, ILO employment probability, second generation EU15, 2012 Probit regression Number of obs = 2062 LR chi2(10) = 279.50 Prob > chi2 = 0.0000 Log likelihood = -930.50703 Pseudo R2 = 0.1306 ------------------------------------------------------------------------------- employed_d | Coef. Std. Err. z P>|z| [95% Conf. Interval] --------------+---------------------------------------------------------------- age | .0179399 .0055369 3.24 0.001 .0070878 .028792 sex | .4360948 .0699844 6.23 0.000 .2989278 .5732618 married | .0224387 .0891421 0.25 0.801 -.1522766 .197154 hhnbpers_wa_1 | -.5353379 .0866491 -6.18 0.000 -.705167 -.3655087 hhnbpers_wa_3 | -.2030474 .1060396 -1.91 0.056 -.4108813 .0047865 hhwchld | .1495284 .0793339 1.88 0.059 -.0059632 .3050199 educ_l | -.4854546 .0803851 -6.04 0.000 -.6430066 -.3279027 educ_h | .5314465 .0819154 6.49 0.000 .3708953 .6919977 reg_fle | .4722665 .1220192 3.87 0.000 .2331133 .7114198 reg_wal | .0071582 .1056126 0.07 0.946 -.1998387 .214155 _cons | -.0775049 .2094794 -0.37 0.711 -.488077 .3330671 -------------------------------------------------------------------------------
A2.8: Probit regression, ILO employment probability, second generation EU12, 2012 Probit regression Number of obs = 53 LR chi2(9) = 16.13 Prob > chi2 = 0.0642 Log likelihood = -12.622036 Pseudo R2 = 0.3898 ------------------------------------------------------------------------------- employed_d | Coef. Std. Err. z P>|z| [95% Conf. Interval] --------------+---------------------------------------------------------------- age | .1173433 .0701458 1.67 0.094 -.0201399 .2548265 sex | 1.682289 .7724008 2.18 0.029 .1684116 3.196167 married | -.2271792 .9740107 -0.23 0.816 -2.136205 1.681847 hhnbpers_wa_1 | -1.131572 .960624 -1.18 0.239 -3.01436 .7512165 hhnbpers_wa_3 | -.5194647 1.010101 -0.51 0.607 -2.499225 1.460296 hhwchld | -.8697491 .8209385 -1.06 0.289 -2.478759 .7392607 educ_l | 0 (omitted) educ_h | 1.188557 .6567913 1.81 0.070 -.0987306 2.475844 reg_fle | -1.101363 .8518225 -1.29 0.196 -2.770904 .5681787 reg_wal | .2947978 .7840128 0.38 0.707 -1.241839 1.831435 _cons | -2.59266 2.192664 -1.18 0.237 -6.890203 1.704883 -------------------------------------------------------------------------------
A2.9: Probit regression, ILO employment probability, second generation Turkey, 2012 Probit regression Number of obs = 272 LR chi2(10) = 54.61 Prob > chi2 = 0.0000 Log likelihood = -149.29215 Pseudo R2 = 0.1546 ------------------------------------------------------------------------------- employed_d | Coef. Std. Err. z P>|z| [95% Conf. Interval] --------------+---------------------------------------------------------------- age | .0110106 .016798 0.66 0.512 -.0219129 .0439342 sex | .899019 .1830104 4.91 0.000 .5403253 1.257713 married | .2221025 .2335607 0.95 0.342 -.2356681 .679873 hhnbpers_wa_1 | -.1419493 .2644316 -0.54 0.591 -.6602258 .3763271 hhnbpers_wa_3 | .3416085 .2713001 1.26 0.208 -.19013 .873347 hhwchld | .199028 .2035501 0.98 0.328 -.1999229 .5979788 educ_l | -.662886 .1898995 -3.49 0.000 -1.035082 -.2906899 educ_h | .5324992 .2831636 1.88 0.060 -.0224912 1.08749 reg_fle | .3911352 .2301501 1.70 0.089 -.0599507 .8422211 reg_wal | -.0846564 .2631172 -0.32 0.748 -.6003566 .4310437 _cons | -.7109898 .5621342 -1.26 0.206 -1.812753 .3907731 -------------------------------------------------------------------------------
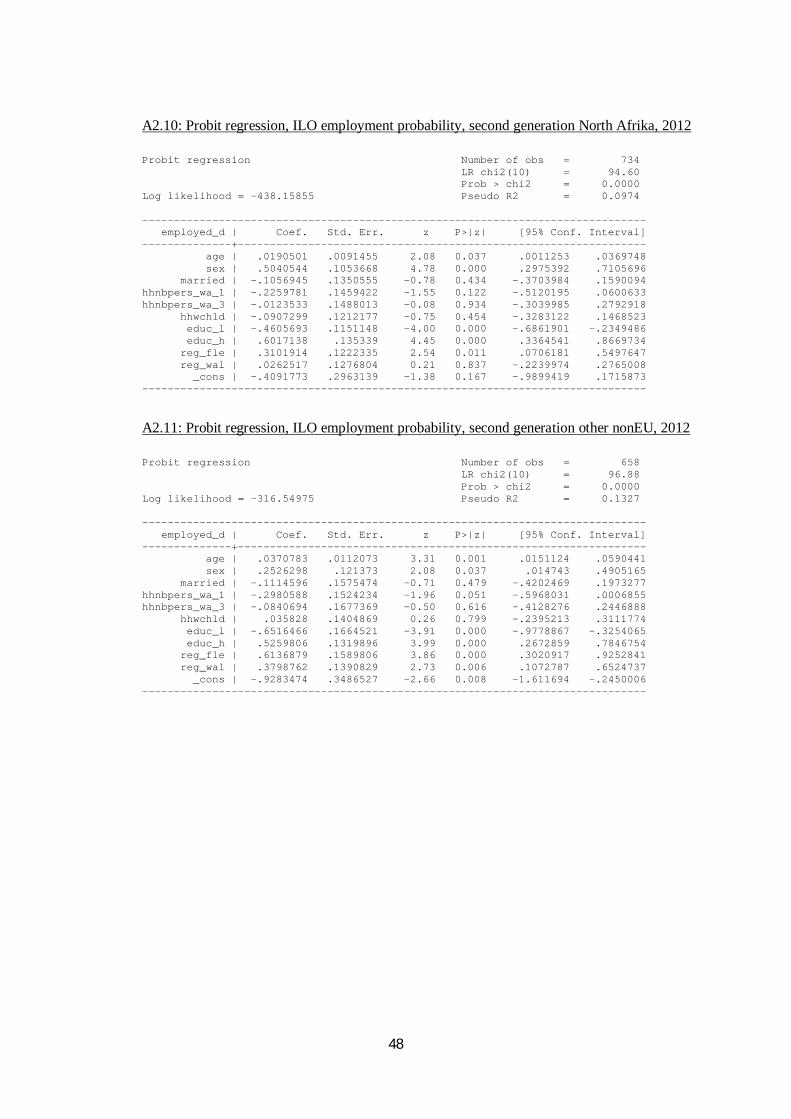
48
A2.10: Probit regression, ILO employment probability, second generation North Afrika, 2012 Probit regression Number of obs = 734 LR chi2(10) = 94.60 Prob > chi2 = 0.0000 Log likelihood = -438.15855 Pseudo R2 = 0.0974 ------------------------------------------------------------------------------- employed_d | Coef. Std. Err. z P>|z| [95% Conf. Interval] --------------+---------------------------------------------------------------- age | .0190501 .0091455 2.08 0.037 .0011253 .0369748 sex | .5040544 .1053668 4.78 0.000 .2975392 .7105696 married | -.1056945 .1350555 -0.78 0.434 -.3703984 .1590094 hhnbpers_wa_1 | -.2259781 .1459422 -1.55 0.122 -.5120195 .0600633 hhnbpers_wa_3 | -.0123533 .1488013 -0.08 0.934 -.3039985 .2792918 hhwchld | -.0907299 .1212177 -0.75 0.454 -.3283122 .1468523 educ_l | -.4605693 .1151148 -4.00 0.000 -.6861901 -.2349486 educ_h | .6017138 .135339 4.45 0.000 .3364541 .8669734 reg_fle | .3101914 .1222335 2.54 0.011 .0706181 .5497647 reg_wal | .0262517 .1276804 0.21 0.837 -.2239974 .2765008 _cons | -.4091773 .2963139 -1.38 0.167 -.9899419 .1715873 -------------------------------------------------------------------------------
A2.11: Probit regression, ILO employment probability, second generation other nonEU, 2012 Probit regression Number of obs = 658 LR chi2(10) = 96.88 Prob > chi2 = 0.0000 Log likelihood = -316.54975 Pseudo R2 = 0.1327 ------------------------------------------------------------------------------- employed_d | Coef. Std. Err. z P>|z| [95% Conf. Interval] --------------+---------------------------------------------------------------- age | .0370783 .0112073 3.31 0.001 .0151124 .0590441 sex | .2526298 .121373 2.08 0.037 .014743 .4905165 married | -.1114596 .1575474 -0.71 0.479 -.4202469 .1973277 hhnbpers_wa_1 | -.2980588 .1524234 -1.96 0.051 -.5968031 .0006855 hhnbpers_wa_3 | -.0840694 .1677369 -0.50 0.616 -.4128276 .2446888 hhwchld | .035828 .1404869 0.26 0.799 -.2395213 .3111774 educ_l | -.6516466 .1664521 -3.91 0.000 -.9778867 -.3254065 educ_h | .5259806 .1319896 3.99 0.000 .2672859 .7846754 reg_fle | .6136879 .1589806 3.86 0.000 .3020917 .9252841 reg_wal | .3798762 .1390829 2.73 0.006 .1072787 .6524737 _cons | -.9283474 .3486527 -2.66 0.008 -1.611694 -.2450006 -------------------------------------------------------------------------------

NBB WORKING PAPER No. 285 - SEPTEMBER 2015 49
NATIONAL BANK OF BELGIUM - WORKING PAPERS SERIES The Working Papers are available on the website of the Bank: http://www.nbb.be. 241. “The Influence of the Taylor rule on US monetary policy”, by P. Ilbas, Ø. Røisland and T. Sveen, Research
series, January 2013. 242. “Economic importance of the Belgian ports: Flemish maritime ports, Liège port complex and the port of
Brussels - Report 2011”, by C. Mathys, Document series, July 2013. 243. “The fragility of two monetary regimes: The European Monetary System and the Eurozone”, by
P. De Grauwe and Y. Ji, Research series, October 2013. 244. “Funding liquidity, market liquidity and TED spread: A two-regime model”, by K. Boudt, E. C.S. Paulus and
D. W.R. Rosenthal, Research series, November 2013. 245. “Robustifying optimal monetary policy using simple rules as cross-checks”, by P. Ilbas, Ø. Røisland and T.
Sveen, Research series, November 2013. 246. “Household and firm leverage, capital flows and monetary policy in a small open economy”, by
M. Pirovano, Research series, November 2013. 247. “The BIS and the Latin American debt crisis of the 1980s”, by P. Clement and I. Maes, Research series,
December 2013. 248. “The importance of the right amount of business resources for firms' exporting behavior”, by I. Paeleman,
C. Fuss and T. Vanacker, Research series, December 2013. 249. “The role of financial frictions during the crisis: An estimated DSGE model”, by R. Merola, Research series,
December 2013. 250. “Bank reactions after capital shortfalls”, by C. Kok and G. Schepens, Research series, December 2013. 251. “Why firms avoid cutting wages: Survey evidence from European firms”, by P. Du Caju, T. Kosma,
M. Lawless, J. Messina and T. Rõõm, Research series, December 2013. 252. “The distribution of debt across euro area countries: The role of individual characteristics, institutions and
credit conditions”, by O. Bover, J. M. Casado, S. Costa, Ph. Du Caju, Y. McCarthy, E. Sierminska, P. Tzamourani, E. Villanueva and T. Zavadil, Research series, December 2013.
253. “Micro-based evidence of EU competitiveness: The CompNet database”, by CompNet Task Force, Research series, March 2014.
254. “Information in the yield curve: A macro-finance approach”, by H. Dewachter, L. Iania and M. Lyrio, Research series, March 2014.
255. “The Single supervisory mechanism or ‘SSM’, part one of the Banking Union”, by E. Wymeersch, Research series, April 2014.
256. “Nowcasting Belgium”, by D. de Antonio Liedo, Research series, April 2014. 257. “Human capital, firm capabilities and productivity growth”, by I. Van Beveren and S. Vanormelingen,
Research series, May 2014. 258. “Monetary and macroprudential policies in an estimated model with financial intermediation”, by P. Gelain
and P. Ilbas, Research series, May 2014. 259. “A macro-financial analysis of the euro area sovereign bond market”, by H. Dewachter, L. Iania, M. Lyrio
and M. de Sola Perea, Research series, June 2014. 260. “Economic importance of the Belgian ports: Flemish maritime ports, Liège port complex and the port of
Brussels - Report 2012”, by C. Mathys, Document series, June 2014. 261. “European competitiveness: A semi-parametric stochastic metafrontier analysis at the firm level”, by
M. Dumont, B. Merlevede, G. Rayp and M. Verschelde, Document series, July 2014. 262. “Employment, hours and optimal monetary policy”, by M. Dossche, V. Lewis and C. Poilly, Research
series, September 2014. 263. “On the conjugacy of off-line and on-line Sequential Monte Carlo Samplers”, by A. Dufays, Research
series, September 2014. 264. “The effects of state aid on Total Factor Productivity growth”, by P. Van Cayseele, J. Konings and
I. Sergant, Research series, October 2014. 265. “Assessing the role of ageing, feminising and better-educated workforces on TFP growth”, by A. Ariu and
V. Vandenberghe, Research series, October 2014. 266. “A constrained nonparametric regression analysis of factor-biased technical change and TFP growth at the
firm level”, by M. Verschelde, M. Dumont, B. Merlevede and G. Rayp, Research series, October 2014. 267. “Market imperfections, skills and total factor productivity: Firm-level evidence on Belgium and the
Netherlands”, by S. Dobbelaere and M. Vancauteren, Research series, October 2014. 268. “Import competition, productivity and multi-product firms”, by E. Dhyne, A. Petrin, V. Smeets and
F. Warzynski, Research series, October 2014. 269. “International competition and firm performance: Evidence from Belgium”, by J. De Loecker, C. Fuss and
J. Van Biesebroeck, Research series, October 2014.
NBB WORKING PAPER No. 285 – SEPTEMBER 2015 50
270. “Acquisitions, productivity, and profitability: Evidence from the Japanese cotton spinning industry”, by S. Braguinsky, A. Ohyama, T. Okazaki and C. Syverson, Research series, October 2014.
271. “Total factor productivity: Lessons from the past and directions for the future”, by B. van Ark, Research series, October 2014.
272. “Outward Foreign Direct Investment and domestic performance: In search of a causal link”, by E. Dhyne and S. S. Guerin, Research series, October 2014.
273. “Economic importance of air transport and airport activities in Belgium - Report 2012”, by F. Van Nieuwenhove, Document series, November 2014.
274. “Fiscal policy and TFP in the OECD: Measuring direct and indirect effects”, by G. Everaert F. Heylen and R. Schoonackers, Research series, November 2014.
275. “Effectiveness and transmission of the ECB's balance sheet policies”, by J. Boeckx, M. Dossche and G. Peersman, Research series, December 2014.
276. “How do exporters react to changes in cost competitiveness?”, by S. Decramer, C. Fuss and J. Konings, Research series, January 2015.
277. “Optimal monetary policy response to endogenous oil price fluctuations”, by A. Stevens, Research series, January 2015.
278. “Comparing fiscal multipliers across models and countries in Europe”, by J. Kilponen, M. Pisani, S. Schmidt, V. Corbo, T. Hledik, J. Hollmayr, S. Hurtado, P. Júlio, D. Kulikov, M. Lemoine, M. Lozej, H. Lundvall, J. R. Maria, B. Micallef, D. Papageorgiou, J. Rysanek, D. Sideris, C. Thomas and G. de Walque, Research series, March 2015.
279. “Assessing European competitiveness: The new CompNet micro-based database”, by P. Lopez-Garcia, F. di Mauro and the CompNet Task Force, Research series, April 2015.
280. “FloGARCH: Realizing long memory and asymmetries in returns volatility”, by H. Vander Elst, Research series, April 2015.
281. “Does education raise productivity and wages equally? The moderating roles of age, gender and industry”, by F. Rycx, Y. Saks and I. Tojerow, Research series, April 2015.
282. “Assessing European firms’ exports and productivity distributions: The CompNet trade module”, by A. Berthou, E. Dhyne, M. Bugamelli, A.-M. Cazacu, C.-V. Demian, P. Harasztosi, T. Lalinsky, J. Merikül, F. Oropallo and A. C. Soares, Research series, May 2015.
283. “Economic importance of the Belgian ports: Flemish maritime ports, Liège port complex and the port of Brussels - Report 2013”, by Frank Van Nieuwenhove, Document series, June 2015.
284. “Crisis-proof services: Why trade in services did not suffer during the 2008-2009 collapse”, by A. Ariu, Research series, July 2015.
285. “The labour market position of second-generation immigrants in Belgium”, by V. Corluy, J. Haemels, I. Marx and G. Verbist, Research series, September 2015.

© Illustrations : National Bank of Belgium
Layout : Analysis and Research Group Cover : NBB AG – Prepress & Image
Published in September 2015
Editor
Jan SmetsGovernor of the National Bank of Belgium
National Bank of Belgium Limited liability company RLP Brussels – Company’s number : 0203.201.340 Registered office : boulevard de Berlaimont 14 – BE -1000 Brussels www.nbb.be