the labor market report - tn.gov · major appliance repair, newspapers, entertain-ment, and...
TRANSCRIPT
1
ACCRA Cost-of-Living Index- Third Quarter 2011
The Tennessee Department of Labor and Workforce
December 2002 Data
Bill Haslam, Governor
Karla Davis,
Commissioner
The Labor Market Report
Special Points of Interest: • The ACCRA Cost-of-
Living Index for the Third Quarter 2011
• Tennessee Historical
Civilian Labor Force Series, 1981 to Present
• County Unemployment
Rates • Civilian Labor Force
Summary (All Areas) • Hours and Earnings • State Unemployment
Insurance Activities • Consumer Price Index Inside This Issue:
Chattanooga MSA 7
Knoxville MSA 8
Memphis MSA 9
Nashville MSA 10
Smaller MSAs 11 Consumer Price Index 12
December 2011 Data
The Labor Market Report
The American Chamber of Commerce Researchers Association (ACCRA) Cost-of-Living Index is a quar-terly report that is de-signed to measure the rela-tive differences among ur-ban areas in the cost of consumer goods and ser-vices appropriate for pro-fessional and managerial households. This Index compares costs of a particu-lar standard of living in all areas. It does not matter whether that standard of living is typical of the over-all population in a particu-lar area. This is accom-plished by collecting the costs of uniform products/services in all areas. These data are published by the Council for Community and Economic Research (C2ER).
The data are for urban ar-eas whose chambers of commerce have agreed to participate in a survey. The average of all partici-pating cities equals 100.0, and each participant’s in-dex is read as a percentage of the average for all places. The index does not measure inflation (price change over time) because each quarterly report is a separate snapshot of prices at a single point in time. Staffs from local chambers of commerce conduct these cost surveys on a volunteer
basis in their particular area. This is why not all metropolitan areas report in every quarter. These data are a snapshot of costs at a particular time. Index data from different quar-ters cannot be compared, and the ACCRA Cost-of-Living index does not measure changes over time. While items seem self-descriptive for most catego-ries, the miscellaneous goods and services group-ing needs to be enumerated because of the vagueness of the heading and the weight carried (33.1 percent). This category includes men’s clothes and underwear, fast food items, health and beauty items, dry cleaning, major appliance repair, newspapers, entertain-ment, and alcoholic bever-ages. Taxes, both state and local, are an integral part of the cost-of-living and vary widely between state and metro areas. Due to the multiplicity of state and local taxes, taxing jurisdic-tions, and assessment pro-cedures, the ACCRA lead-ership felt it was not feasi-ble to measure taxes levied on real and intangible property, retail sales, and income.
The data provided on page
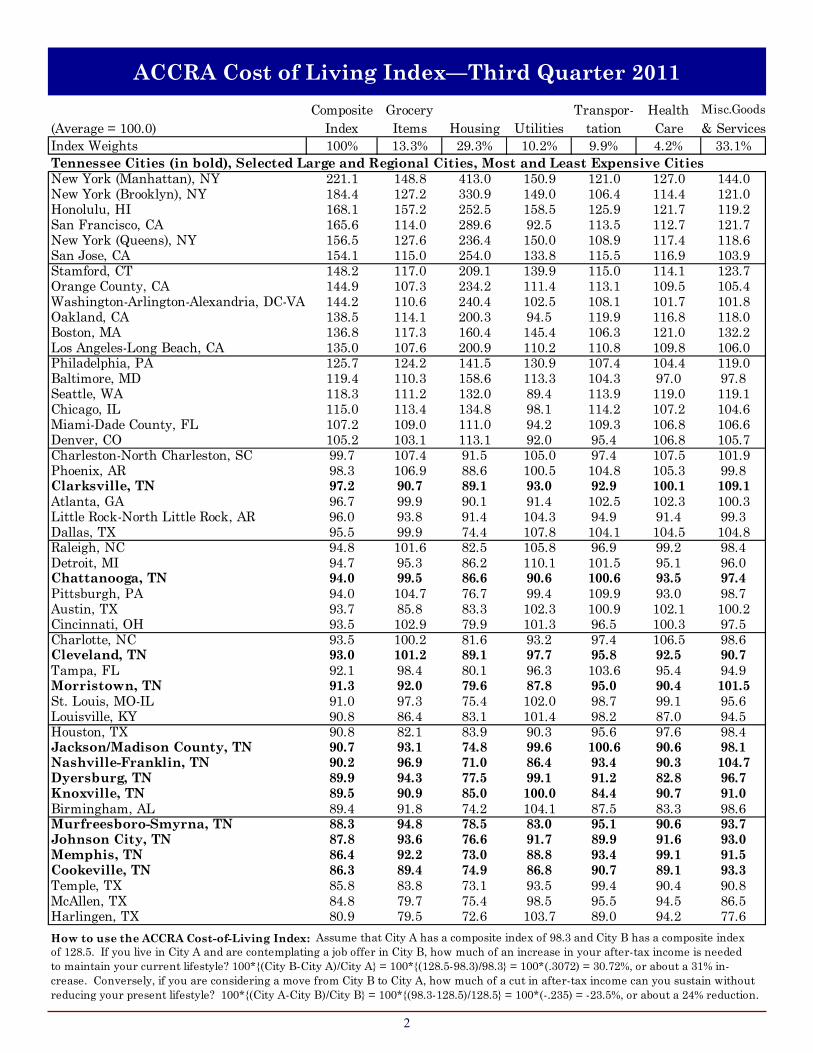
two include local urban ar-eas as well as some of the high and low indices in each sub-category. In this small sampling the highest and lowest costs by group are Grocery Items: New York (Manhattan) (148.8) and Harlingen, Texas (79.5); Housing: New York (Manhattan) (413.0) and Nashville-Franklin, Tennes-see (71.0); Utilities: Hono-lulu, Hawaii (158.5) and Murfreesboro-Smyrna, Ten-nessee (83.0); Transporta-tion: Honolulu, Hawaii (125.9) and Knoxville, Ten-nessee (84.4); Health Care: New York (Manhattan) (127.0) and Birmingham, Alabama (83.3); and Miscel-laneous Goods and Services: New York (Manhattan) (144.0) and Harlingen, Texas (77.6). ACCRA Cost-of-Living Index annual subscriptions are $165 while single issues are $82.50 per copy. Electronic subscriptions (in Excel) are also available. To purchase the entire cost-of-living sur-vey and other products pro-vided write to C2ER, P.O. Box 100127, Arlington, VA 22210 or visit their Web site at www.c2er.org. Special thanks go to Ms. Ramay Winchester at Retire Ten-nessee. You can get more information on their Web site at www.retiretennessee.org.
Methodology
The Data
2
ACCRA Cost of Living Index—Third Quarter 2011 Composite Grocery Transpor- Health Misc.Goods
(Average = 100.0) Index Items Housing Utilities tation Care & ServicesIndex Weights 100% 13.3% 29.3% 10.2% 9.9% 4.2% 33.1%Tennessee Cities (in bold), Selected Large and Regional Cities, Most and Least Expensive CitiesNew York (Manhattan), NY 221.1 148.8 413.0 150.9 121.0 127.0 144.0New York (Brooklyn), NY 184.4 127.2 330.9 149.0 106.4 114.4 121.0Honolulu, HI 168.1 157.2 252.5 158.5 125.9 121.7 119.2San Francisco, CA 165.6 114.0 289.6 92.5 113.5 112.7 121.7New York (Queens), NY 156.5 127.6 236.4 150.0 108.9 117.4 118.6San Jose, CA 154.1 115.0 254.0 133.8 115.5 116.9 103.9Stamford, CT 148.2 117.0 209.1 139.9 115.0 114.1 123.7Orange County, CA 144.9 107.3 234.2 111.4 113.1 109.5 105.4Washington-Arlington-Alexandria, DC-VA 144.2 110.6 240.4 102.5 108.1 101.7 101.8Oakland, CA 138.5 114.1 200.3 94.5 119.9 116.8 118.0Boston, MA 136.8 117.3 160.4 145.4 106.3 121.0 132.2Los Angeles-Long Beach, CA 135.0 107.6 200.9 110.2 110.8 109.8 106.0Philadelphia, PA 125.7 124.2 141.5 130.9 107.4 104.4 119.0Baltimore, MD 119.4 110.3 158.6 113.3 104.3 97.0 97.8Seattle, WA 118.3 111.2 132.0 89.4 113.9 119.0 119.1Chicago, IL 115.0 113.4 134.8 98.1 114.2 107.2 104.6Miami-Dade County, FL 107.2 109.0 111.0 94.2 109.3 106.8 106.6Denver, CO 105.2 103.1 113.1 92.0 95.4 106.8 105.7Charleston-North Charleston, SC 99.7 107.4 91.5 105.0 97.4 107.5 101.9Phoenix, AR 98.3 106.9 88.6 100.5 104.8 105.3 99.8Clarksville, TN 97.2 90.7 89.1 93.0 92.9 100.1 109.1Atlanta, GA 96.7 99.9 90.1 91.4 102.5 102.3 100.3Little Rock-North Little Rock, AR 96.0 93.8 91.4 104.3 94.9 91.4 99.3Dallas, TX 95.5 99.9 74.4 107.8 104.1 104.5 104.8Raleigh, NC 94.8 101.6 82.5 105.8 96.9 99.2 98.4Detroit, MI 94.7 95.3 86.2 110.1 101.5 95.1 96.0Chattanooga, TN 94.0 99.5 86.6 90.6 100.6 93.5 97.4Pittsburgh, PA 94.0 104.7 76.7 99.4 109.9 93.0 98.7Austin, TX 93.7 85.8 83.3 102.3 100.9 102.1 100.2Cincinnati, OH 93.5 102.9 79.9 101.3 96.5 100.3 97.5Charlotte, NC 93.5 100.2 81.6 93.2 97.4 106.5 98.6Cleveland, TN 93.0 101.2 89.1 97.7 95.8 92.5 90.7Tampa, FL 92.1 98.4 80.1 96.3 103.6 95.4 94.9Morristown, TN 91.3 92.0 79.6 87.8 95.0 90.4 101.5St. Louis, MO-IL 91.0 97.3 75.4 102.0 98.7 99.1 95.6Louisville, KY 90.8 86.4 83.1 101.4 98.2 87.0 94.5Houston, TX 90.8 82.1 83.9 90.3 95.6 97.6 98.4Jackson/Madison County, TN 90.7 93.1 74.8 99.6 100.6 90.6 98.1Nashville-Franklin, TN 90.2 96.9 71.0 86.4 93.4 90.3 104.7Dyersburg, TN 89.9 94.3 77.5 99.1 91.2 82.8 96.7Knoxville, TN 89.5 90.9 85.0 100.0 84.4 90.7 91.0Birmingham, AL 89.4 91.8 74.2 104.1 87.5 83.3 98.6Murfreesboro-Smyrna, TN 88.3 94.8 78.5 83.0 95.1 90.6 93.7Johnson City, TN 87.8 93.6 76.6 91.7 89.9 91.6 93.0Memphis, TN 86.4 92.2 73.0 88.8 93.4 99.1 91.5Cookeville, TN 86.3 89.4 74.9 86.8 90.7 89.1 93.3Temple, TX 85.8 83.8 73.1 93.5 99.4 90.4 90.8McAllen, TX 84.8 79.7 75.4 98.5 95.5 94.5 86.5Harlingen, TX 80.9 79.5 72.6 103.7 89.0 94.2 77.6How to use the ACCRA Cost-of-Living Index: Assume that City A has a composite index of 98.3 and City B has a composite index of 128.5. If you live in City A and are contemplating a job offer in City B, how much of an increase in your after-tax income is neededto maintain your current lifestyle? 100*{(City B-City A)/City A} = 100*{(128.5-98.3)/98.3} = 100*(.3072) = 30.72%, or about a 31% in- crease. Conversely, if you are considering a move from City B to City A, how much of a cut in after-tax income can you sustain without reducing your present lifestyle? 100*{(City A-City B)/City B} = 100*{(98.3-128.5)/128.5} = 100*(-.235) = -23.5%, or about a 24% reduction.
3
Statewide
(NUMBERS IN THOUSANDS) MONTHLY DATA NOT SEASONALLY ADJUSTED
Civilian Labor ForceEmployed Unemployed
Year Nonfarm Employmentand Employ- **Manu- Rate
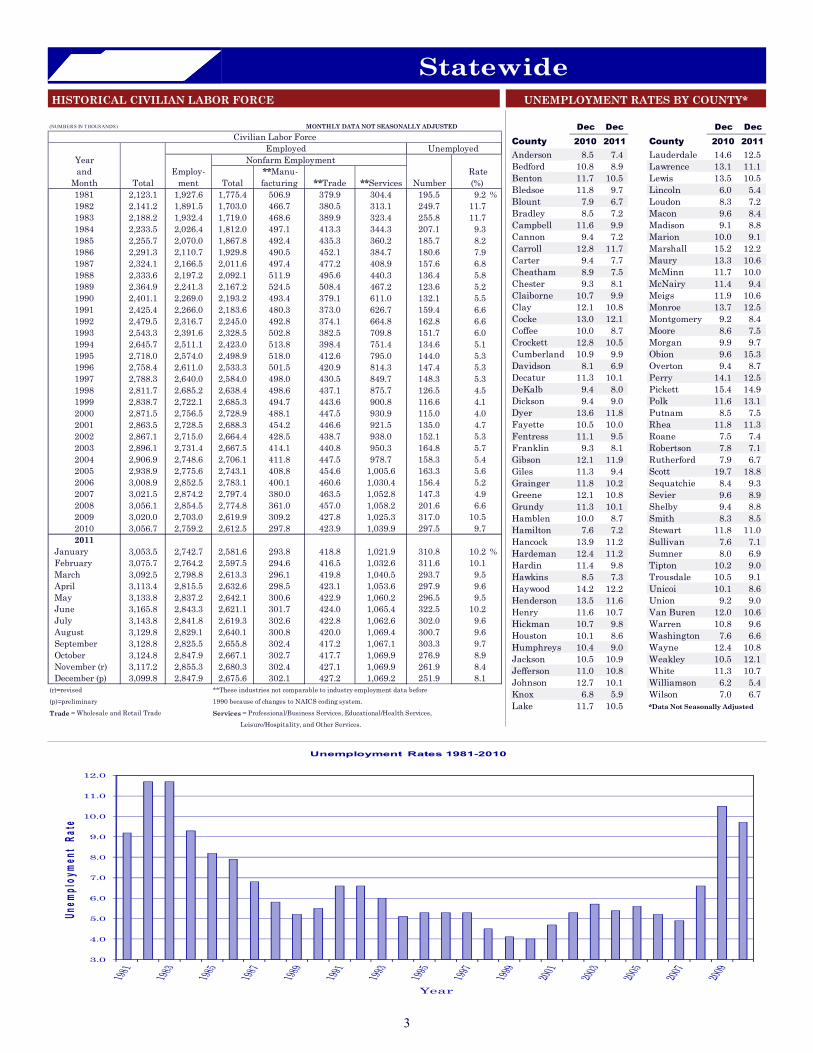
Month Total ment Total facturing **Trade **Services Number (%)1981 2,123.1 1,927.6 1,775.4 506.9 379.9 304.4 195.5 9.2 %1982 2,141.2 1,891.5 1,703.0 466.7 380.5 313.1 249.7 11.71983 2,188.2 1,932.4 1,719.0 468.6 389.9 323.4 255.8 11.71984 2,233.5 2,026.4 1,812.0 497.1 413.3 344.3 207.1 9.31985 2,255.7 2,070.0 1,867.8 492.4 435.3 360.2 185.7 8.21986 2,291.3 2,110.7 1,929.8 490.5 452.1 384.7 180.6 7.91987 2,324.1 2,166.5 2,011.6 497.4 477.2 408.9 157.6 6.81988 2,333.6 2,197.2 2,092.1 511.9 495.6 440.3 136.4 5.81989 2,364.9 2,241.3 2,167.2 524.5 508.4 467.2 123.6 5.21990 2,401.1 2,269.0 2,193.2 493.4 379.1 611.0 132.1 5.51991 2,425.4 2,266.0 2,183.6 480.3 373.0 626.7 159.4 6.61992 2,479.5 2,316.7 2,245.0 492.8 374.1 664.8 162.8 6.61993 2,543.3 2,391.6 2,328.5 502.8 382.5 709.8 151.7 6.01994 2,645.7 2,511.1 2,423.0 513.8 398.4 751.4 134.6 5.1 1995 2,718.0 2,574.0 2,498.9 518.0 412.6 795.0 144.0 5.31996 2,758.4 2,611.0 2,533.3 501.5 420.9 814.3 147.4 5.31997 2,788.3 2,640.0 2,584.0 498.0 430.5 849.7 148.3 5.31998 2,811.7 2,685.2 2,638.4 498.6 437.1 875.7 126.5 4.51999 2,838.7 2,722.1 2,685.3 494.7 443.6 900.8 116.6 4.12000 2,871.5 2,756.5 2,728.9 488.1 447.5 930.9 115.0 4.02001 2,863.5 2,728.5 2,688.3 454.2 446.6 921.5 135.0 4.72002 2,867.1 2,715.0 2,664.4 428.5 438.7 938.0 152.1 5.32003 2,896.1 2,731.4 2,667.5 414.1 440.8 950.3 164.8 5.72004 2,906.9 2,748.6 2,706.1 411.8 447.5 978.7 158.3 5.42005 2,938.9 2,775.6 2,743.1 408.8 454.6 1,005.6 163.3 5.62006 3,008.9 2,852.5 2,783.1 400.1 460.6 1,030.4 156.4 5.22007 3,021.5 2,874.2 2,797.4 380.0 463.5 1,052.8 147.3 4.92008 3,056.1 2,854.5 2,774.8 361.0 457.0 1,058.2 201.6 6.62009 3,020.0 2,703.0 2,619.9 309.2 427.8 1,025.3 317.0 10.52010 3,056.7 2,759.2 2,612.5 297.8 423.9 1,039.9 297.5 9.72011
January 3,053.5 2,742.7 2,581.6 293.8 418.8 1,021.9 310.8 10.2 % February 3,075.7 2,764.2 2,597.5 294.6 416.5 1,032.6 311.6 10.1 March 3,092.5 2,798.8 2,613.3 296.1 419.8 1,040.5 293.7 9.5 April 3,113.4 2,815.5 2,632.6 298.5 423.1 1,053.6 297.9 9.6 May 3,133.8 2,837.2 2,642.1 300.6 422.9 1,060.2 296.5 9.5 June 3,165.8 2,843.3 2,621.1 301.7 424.0 1,065.4 322.5 10.2 July 3,143.8 2,841.8 2,619.3 302.6 422.8 1,062.6 302.0 9.6 August 3,129.8 2,829.1 2,640.1 300.8 420.0 1,069.4 300.7 9.6 September 3,128.8 2,825.5 2,655.8 302.4 417.2 1,067.1 303.3 9.7 October 3,124.8 2,847.9 2,667.1 302.7 417.7 1,069.9 276.9 8.9 November (r) 3,117.2 2,855.3 2,680.3 302.4 427.1 1,069.9 261.9 8.4 December (p) 3,099.8 2,847.9 2,675.6 302.1 427.2 1,069.2 251.9 8.1(r)=revised **These industries not comparable to industry employment data before (p)=preliminary 1990 because of changes to NAICS coding system.
Trade = Wholesale and Retail Trade Services = Professional/Business Services, Educational/Health Services, Leisure/Hospitality, and Other Services.
Dec Dec Dec Dec County 2010 2011 County 2010 2011Anderson 8.5 7.4 Lauderdale 14.6 12.5Bedford 10.8 8.9 Lawrence 13.1 11.1Benton 11.7 10.5 Lewis 13.5 10.5Bledsoe 11.8 9.7 Lincoln 6.0 5.4Blount 7.9 6.7 Loudon 8.3 7.2Bradley 8.5 7.2 Macon 9.6 8.4Campbell 11.6 9.9 Madison 9.1 8.8Cannon 9.4 7.2 Marion 10.0 9.1Carroll 12.8 11.7 Marshall 15.2 12.2Carter 9.4 7.7 Maury 13.3 10.6Cheatham 8.9 7.5 McMinn 11.7 10.0Chester 9.3 8.1 McNairy 11.4 9.4Claiborne 10.7 9.9 Meigs 11.9 10.6Clay 12.1 10.8 Monroe 13.7 12.5Cocke 13.0 12.1 Montgomery 9.2 8.4Coffee 10.0 8.7 Moore 8.6 7.5Crockett 12.8 10.5 Morgan 9.9 9.7Cumberland 10.9 9.9 Obion 9.6 15.3Davidson 8.1 6.9 Overton 9.4 8.7Decatur 11.3 10.1 Perry 14.1 12.5DeKalb 9.4 8.0 Pickett 15.4 14.9Dickson 9.4 9.0 Polk 11.6 13.1Dyer 13.6 11.8 Putnam 8.5 7.5Fayette 10.5 10.0 Rhea 11.8 11.3Fentress 11.1 9.5 Roane 7.5 7.4Franklin 9.3 8.1 Robertson 7.8 7.1Gibson 12.1 11.9 Rutherford 7.9 6.7Giles 11.3 9.4 Scott 19.7 18.8Grainger 11.8 10.2 Sequatchie 8.4 9.3Greene 12.1 10.8 Sevier 9.6 8.9Grundy 11.3 10.1 Shelby 9.4 8.8Hamblen 10.0 8.7 Smith 8.3 8.5Hamilton 7.6 7.2 Stewart 11.8 11.0Hancock 13.9 11.2 Sullivan 7.6 7.1Hardeman 12.4 11.2 Sumner 8.0 6.9Hardin 11.4 9.8 Tipton 10.2 9.0Hawkins 8.5 7.3 Trousdale 10.5 9.1Haywood 14.2 12.2 Unicoi 10.1 8.6Henderson 13.5 11.6 Union 9.2 9.0Henry 11.6 10.7 Van Buren 12.0 10.6Hickman 10.7 9.8 Warren 10.8 9.6Houston 10.1 8.6 Washington 7.6 6.6Humphreys 10.4 9.0 Wayne 12.4 10.8Jackson 10.5 10.9 Weakley 10.5 12.1Jefferson 11.0 10.8 White 11.3 10.7Johnson 12.7 10.1 Williamson 6.2 5.4Knox 6.8 5.9 Wilson 7.0 6.7Lake 11.7 10.5 *Data Not Seasonally Adjusted
HISTORICAL CIVILIAN LABOR FORCE UNEMPLOYMENT RATES BY COUNTY*
3.0
4.0
5.0
6.0
7.0
8.0
9.0
10.0
11.0
12.0
U n e m
p l o y
m e n
t R a
t e
Year
Unemployment Rates 1981-2010

4
Statewide
UNEMPLOYMENT INSURANCE ACTIVITIES (MOST RECENT AVAILABLE)
STATE BENEFIT PROGRAM
CLAIMS Dec. 2010 Nov. 2011 Dec. 2011
Initial Claims 38,736 36,632 34,236Continued Weeks Claimed 255,003 192,882 203,376Nonmonetary Determinations 7,355 7,666 7,584Appeals Decisions 3,002 4,457 4,302 Lower Authority 2,143 4,011 3,884 Higher Authority 859 446 418BENEFITS
Amount Paid $46,858,787 $44,207,424 $47,548,467Benefit Weeks Paid 230,976 210,801 209,186Average Weekly Benefit Amount $234 $238 $237First Payments 16,460 12,446 14,945Final Payments 7,738 6,854 6,352Average Weeks Duration 17 15 15Trust Fund Balance $142,385,293 $346,460,922 $308,762,251
FEDERAL BENEFIT PROGRAMS
FORMER FEDERAL EMPLOYEES Dec. 2010 Nov. 2011 Dec. 2011
Benefits Paid $722,898 $568,612 $482,488Benefit Weeks Claimed 3,033 1,736 1,279Initial Claims 181 134 185Continued Weeks Claimed 3,237 1,537 1,283Appeals Decisions 10 23 13
FORMER MILITARY PERSONNEL
Benefits Paid $1,191,715 $937,897 $904,100Benefit Weeks Claimed 3,729 2,684 2,308Initial Claims 162 225 156Continued Weeks Claimed 3,762 2,467 2,298Appeals Decisions 11 16 20
BENEFIT PROGRAMS — DECEMBER 2011
CONTINUED WEEKS CLAIMED — DECEMBER 2011
0
75
150
225
300
375
450
525
600
JAN FEB MAR APR MAY JUN JUL AUG SEP OCT NOV DEC
C O N
T I N U
E D
C L A
I M S
Thousands
MONTH
MONTHLY CONTINUED WEEKS CLAIMED
2009 2010 2011
0
10
20
30
40
50
60
70
80
90
100
JAN FEB MAR APR MAY JUN JUL AUG SEP OCT NOV DEC
I n I t I
a l C
l a I m
s
Thousands
MONTH
MONTHLY INITIALCLAIMS
2009 2010 2011

5
Statewide
Industry December NovemberRevised
2010 2011
PreliminaryDec. Nov.
Net ChangeDecember
2011 Dec. 20102011
20112011Dec.
NONFARM EMPLOYMENT AND LABOR FORCE IN TENNESSEE
ESTIMATED NONFARM EMPLOYMENT (in thousands)
Total Nonfarm 2,644.4 2,680.3 2,675.6 31.2 -4.7 Total Private 2,207.2 2,233.9 2,231.4 24.2 -2.5 Goods-Producing 401.6 417.8 415.6 14.0 -2.2 Mining, Logging, & Construction 106.4 115.4 113.5 7.1 -1.9 Manufacturing 295.2 302.4 302.1 6.9 -0.3 Durable Goods Manufacturing 175.1 180.8 181.8 6.7 1.0 Wood Product Manufacturing 10.6 10.5 10.6 0.0 0.1 Nonmetallic Mineral Product Manufacturing 11.0 10.3 10.1 -0.9 -0.2 Primary Metal Manufacturing 8.8 9.4 9.6 0.8 0.2 Fabricated Metal Product Manufacturing 33.0 34.9 35.2 2.2 0.3 Machinery Manufacturing 24.8 26.5 27.1 2.3 0.6 Computer & Electronic Product Manufacturing 5.5 5.3 5.3 -0.2 0.0 Electrical Equipment & Appliance Manufacturing 16.9 16.6 16.7 -0.2 0.1 Transportation Equipment Manufacturing 40.4 43.6 43.7 3.3 0.1 Furniture & Related Product Manufacturing 9.4 9.1 8.9 -0.5 -0.2 Miscellaneous Manufacturing 14.7 14.6 14.6 -0.1 0.0 Nondurable Goods Manufacturing 120.1 121.6 120.3 0.2 -1.3 Textile Mills, Products, & Apparel 11.0 10.9 10.9 -0.1 0.0 Food Manufacturing 31.8 33.4 33.3 1.5 -0.1 Beverage & Tobacco Product Manufacturing 4.9 5.1 5.1 0.2 0.0 Paper Manufacturing 14.8 15.5 15.1 0.3 -0.4 Printing & Related Support Activities 11.1 10.7 10.5 -0.6 -0.2 Chemical Manufacturing 25.2 25.2 25.2 0.0 0.0 Plastics & Rubber Products Manufacturing 19.6 19.1 19.1 -0.5 0.0 Plastics Product Manufacturing 10.5 11.1 11.1 0.6 0.0 Rubber Product Manufacturing 9.1 8.0 8.0 -1.1 0.0 Service-Providing 2,242.8 2,262.5 2,260.0 17.2 -2.5 Trade, Transportation, & Utilities 569.8 563.8 564.3 -5.5 0.5 Wholesale Trade 118.2 116.7 116.4 -1.8 -0.3 Merchant Wholesalers, Durable Goods 59.3 59.7 59.5 0.2 -0.2 Merchant Wholesalers, Nondurable Goods 42.0 40.8 40.5 -1.5 -0.3 Wholesale Electronic Markets 16.9 16.2 16.4 -0.5 0.2 Retail Trade 314.6 310.4 310.8 -3.8 0.4 Motor Vehicle & Parts Dealers 37.9 37.2 37.6 -0.3 0.4 Furniture & Home Furnishings Stores 8.4 8.0 8.1 -0.3 0.1 Building Material, Garden Equipment, & Supplies 24.3 23.9 23.8 -0.5 -0.1 Food & Beverage Stores 50.5 51.4 50.9 0.4 -0.5 Health & Personal Care Stores 22.9 22.4 22.6 -0.3 0.2 Gasoline Stations 21.0 19.9 19.6 -1.4 -0.3 Clothing & Clothing Accessories Stores 27.9 28.5 29.2 1.3 0.7 Sporting Goods, Hobby, Book, & Music Stores 12.3 11.5 11.8 -0.5 0.3 General Merchandise Stores 74.2 74.2 74.3 0.1 0.1 Miscellaneous Store Retailers 15.9 15.0 15.0 -0.9 0.0 Nonstore Retailers 8.5 7.8 7.9 -0.6 0.1 Transportation, Warehousing, & Utilities 137.0 136.7 137.1 0.1 0.4 Utilities 3.3 3.3 3.3 0.0 0.0 Transportation & Warehousing 133.7 133.4 133.8 0.1 0.4 Truck Transportation 55.3 53.9 53.2 -2.1 -0.7 Information 45.4 43.5 44.1 -1.3 0.6 Financial Activities 137.6 138.9 138.2 0.6 -0.7 Finance & Insurance 106.2 106.1 106.3 0.1 0.2 Real Estate, Rental, & Leasing 31.4 32.8 31.9 0.5 -0.9 Professional & Business Services 317.2 318.4 323.8 6.6 5.4 Professional, Scientific, & Technical Services 108.6 105.9 108.1 -0.5 2.2 Management of Companies & Enterprises 27.5 28.5 28.7 1.2 0.2 Administrative, Support, & Waste Management 181.1 184.0 187.0 5.9 3.0 Educational & Health Services 378.8 385.3 383.6 4.8 -1.7 Educational Services 47.9 50.2 49.2 1.3 -1.0 Health Care & Social Assistance 330.9 335.1 334.4 3.5 -0.7 Ambulatory Health Care Services 126.8 128.7 128.5 1.7 -0.2 Hospitals 105.1 103.8 104.2 -0.9 0.4 Nursing & Residential Care Facilities 56.6 60.5 59.7 3.1 -0.8 Social Assistance 42.4 42.1 42.0 -0.4 -0.1 Leisure & Hospitality 257.2 264.5 261.0 3.8 -3.5 Arts, Entertainment, & Recreation 25.5 27.3 25.9 0.4 -1.4 Accommodation & Food Services 231.7 237.2 235.1 3.4 -2.1 Accommodation 30.4 31.1 30.1 -0.3 -1.0 Food Services & Drinking Places 201.3 206.1 205.0 3.7 -1.1 Other Services 99.6 101.7 100.8 1.2 -0.9 Government 437.2 446.4 444.2 7.0 -2.2 Federal Government 49.7 48.8 49.3 -0.4 0.5 State Government 98.6 102.5 99.9 1.3 -2.6 State Government Educational Services 50.0 53.6 51.1 1.1 -2.5 Local Government 288.9 295.1 295.0 6.1 -0.1 Local Government Educational Services 152.0 163.2 163.2 11.2 0.0
The data from all the nonfarm employment estimates tables in-clude all full- and part-time nonfarm wage and salary employees who worked during or received pay for any part of the pay period that includes the 12th of the month. This is a count of jobs by place of work. Agricultural workers, proprietors, self-employed persons, workers in private households, and unpaid family workers are excluded. These numbers may not add due to rounding. Data is based on the 2010 benchmark.
Total nonfarm employment increased by 31,200 jobs from December 2010 to December 2011. This includes seasonal increases in local government educational services (up 11,200 jobs); mining/logging/construction (up 7,100 jobs); professional/business services (up 6,600 jobs), which includes increases of 5,900 jobs in administrative/support/waste management and 1,200 jobs in management of companies/enterprises; food services/drinking places (up 3,700 jobs); health care/social assistance (up 3,500 jobs), which includes increases of 3,100 jobs in nursing/residential care facilities and 1,700 jobs in ambulatory health care services; transportation equipment manufacturing (up 3,300 jobs); machinery manufacturing (up 2,300 jobs); and fabricated metal products (up 2,200 jobs). This was partially offset by decreases in retail trade (down 3,800 jobs), which includes a decline of 1,400 jobs in gasoline stations; wholesale trade (down 1,800 jobs), which includes a drop of 1,500 jobs in wholesale trade nondurable goods; and information (down 1,300 jobs). During December, nonfarm employment decreased by 4,700 jobs. This included seasonal declines in leisure/hospitality (down 3,500 jobs), which includes drops of 2,100 jobs in accommodation/food services and 1,400 jobs in arts/entertainment/recreation; state government (down 2,600 jobs); mining/logging/construction (down 1.900 jobs); and educational/health services (down 1,700 jobs), which includes decreases of 1,000 jobs in educational services and 800 jobs in nursing/residential care facilities. This was offset by an increase in professional/business services (up 5,400 jobs), which includes increases of 3,000 jobs in administrative/support/waste management and 2,200 jobs in professional/scientific/technical services.
Tennessee's seasonally adjusted estimated unemployment rate for December 2011 was 8.7 percent, down 0.4 percentage point from the revised November 2011 rate. The last time the unemployment rate was lower was in December 2008. The United States unemployment rate was 8.5 percent in December 2011. In December 2010, thenational and state unemployment rates were both 9.4 percent. Across Tennessee, the unemployment rate decreased in 56 counties, increased in 27 counties, and remained the same in 12 counties. There were55 counties with an unemployment rate less than 10 percent of which nine had a rate below 7 percent, and two counties had a rate at or above 15 percent. In December, the lowest rate occurred in both Williamson and Lincoln counties at 5.4 percent. Williamson declined by 0.4 percentage point and Lincoln was down by 0.2 percentage point from the previous month. The highest rate was Scott County’s 18.8 percent, up from 17.5 percent in November 2011.
6
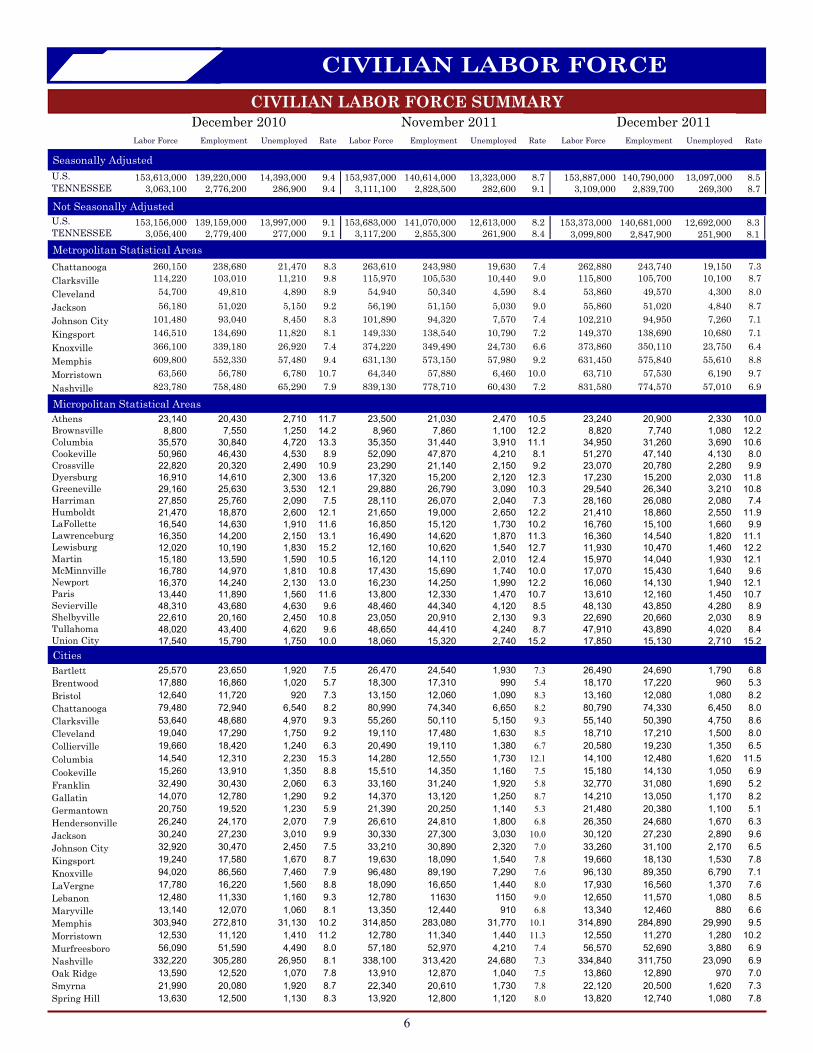
CIVILIAN LABOR FORCE CIVILIAN LABOR FORCE SUMMARY
Not Seasonally Adjusted
Metropolitan Statistical Areas
Micropolitan Statistical Areas
Seasonally Adjusted U.S. TENNESSEE
U.S. TENNESSEE
Labor Force Employment Unemployed Rate Labor Force Employment Unemployed Rate Labor Force Employment Unemployed Rate
Bartlett Brentwood Bristol Chattanooga Clarksville Cleveland Collierville Columbia Cookeville Franklin Gallatin Germantown Hendersonville Jackson Johnson City Kingsport Knoxville LaVergne Lebanon Maryville Memphis Morristown Murfreesboro Nashville Oak Ridge Smyrna Spring Hill
Cities
Chattanooga Clarksville Cleveland Jackson Johnson City Kingsport Knoxville Memphis Morristown Nashville
Athens Brownsville Columbia Cookeville Crossville Dyersburg Greeneville Harriman Humboldt LaFollette Lawrenceburg Lewisburg Martin McMinnville Newport Paris Sevierville Shelbyville Tullahoma Union City
23,140 20,430 2,710 11.7 23,500 21,030 2,470 10.5 23,240 20,900 2,330 10.0 8,800 7,550 1,250 14.2 8,960 7,860 1,100 12.2 8,820 7,740 1,080 12.2
35,570 30,840 4,720 13.3 35,350 31,440 3,910 11.1 34,950 31,260 3,690 10.6 50,960 46,430 4,530 8.9 52,090 47,870 4,210 8.1 51,270 47,140 4,130 8.0 22,820 20,320 2,490 10.9 23,290 21,140 2,150 9.2 23,070 20,780 2,280 9.9 16,910 14,610 2,300 13.6 17,320 15,200 2,120 12.3 17,230 15,200 2,030 11.8 29,160 25,630 3,530 12.1 29,880 26,790 3,090 10.3 29,540 26,340 3,210 10.8 27,850 25,760 2,090 7.5 28,110 26,070 2,040 7.3 28,160 26,080 2,080 7.4 21,470 18,870 2,600 12.1 21,650 19,000 2,650 12.2 21,410 18,860 2,550 11.9 16,540 14,630 1,910 11.6 16,850 15,120 1,730 10.2 16,760 15,100 1,660 9.9 16,350 14,200 2,150 13.1 16,490 14,620 1,870 11.3 16,360 14,540 1,820 11.1 12,020 10,190 1,830 15.2 12,160 10,620 1,540 12.7 11,930 10,470 1,460 12.2 15,180 13,590 1,590 10.5 16,120 14,110 2,010 12.4 15,970 14,040 1,930 12.1 16,780 14,970 1,810 10.8 17,430 15,690 1,740 10.0 17,070 15,430 1,640 9.6 16,370 14,240 2,130 13.0 16,230 14,250 1,990 12.2 16,060 14,130 1,940 12.1 13,440 11,890 1,560 11.6 13,800 12,330 1,470 10.7 13,610 12,160 1,450 10.7 48,310 43,680 4,630 9.6 48,460 44,340 4,120 8.5 48,130 43,850 4,280 8.9 22,610 20,160 2,450 10.8 23,050 20,910 2,130 9.3 22,690 20,660 2,030 8.9 48,020 43,400 4,620 9.6 48,650 44,410 4,240 8.7 47,910 43,890 4,020 8.4 17,540 15,790 1,750 10.0 18,060 15,320 2,740 15.2 17,850 15,130 2,710 15.2
25,570 23,650 1,920 7.5 26,470 24,540 1,930 7.3 26,490 24,690 1,790 6.8 17,880 16,860 1,020 5.7 18,300 17,310 990 5.4 18,170 17,220 960 5.3 12,640 11,720 920 7.3 13,150 12,060 1,090 8.3 13,160 12,080 1,080 8.2 79,480 72,940 6,540 8.2 80,990 74,340 6,650 8.2 80,790 74,330 6,450 8.0 53,640 48,680 4,970 9.3 55,260 50,110 5,150 9.3 55,140 50,390 4,750 8.6 19,040 17,290 1,750 9.2 19,110 17,480 1,630 8.5 18,710 17,210 1,500 8.0 19,660 18,420 1,240 6.3 20,490 19,110 1,380 6.7 20,580 19,230 1,350 6.5 14,540 12,310 2,230 15.3 14,280 12,550 1,730 12.1 14,100 12,480 1,620 11.5 15,260 13,910 1,350 8.8 15,510 14,350 1,160 7.5 15,180 14,130 1,050 6.9 32,490 30,430 2,060 6.3 33,160 31,240 1,920 5.8 32,770 31,080 1,690 5.2 14,070 12,780 1,290 9.2 14,370 13,120 1,250 8.7 14,210 13,050 1,170 8.2 20,750 19,520 1,230 5.9 21,390 20,250 1,140 5.3 21,480 20,380 1,100 5.1 26,240 24,170 2,070 7.9 26,610 24,810 1,800 6.8 26,350 24,680 1,670 6.3 30,240 27,230 3,010 9.9 30,330 27,300 3,030 10.0 30,120 27,230 2,890 9.6 32,920 30,470 2,450 7.5 33,210 30,890 2,320 7.0 33,260 31,100 2,170 6.5 19,240 17,580 1,670 8.7 19,630 18,090 1,540 7.8 19,660 18,130 1,530 7.8 94,020 86,560 7,460 7.9 96,480 89,190 7,290 7.6 96,130 89,350 6,790 7.1 17,780 16,220 1,560 8.8 18,090 16,650 1,440 8.0 17,930 16,560 1,370 7.6 12,480 11,330 1,160 9.3 12,780 11630 1150 9.0 12,650 11,570 1,080 8.5 13,140 12,070 1,060 8.1 13,350 12,440 910 6.8 13,340 12,460 880 6.6
303,940 272,810 31,130 10.2 314,850 283,080 31,770 10.1 314,890 284,890 29,990 9.5 12,530 11,120 1,410 11.2 12,780 11,340 1,440 11.3 12,550 11,270 1,280 10.2 56,090 51,590 4,490 8.0 57,180 52,970 4,210 7.4 56,570 52,690 3,880 6.9
332,220 305,280 26,950 8.1 338,100 313,420 24,680 7.3 334,840 311,750 23,090 6.9 13,590 12,520 1,070 7.8 13,910 12,870 1,040 7.5 13,860 12,890 970 7.0 21,990 20,080 1,920 8.7 22,340 20,610 1,730 7.8 22,120 20,500 1,620 7.3 13,630 12,500 1,130 8.3 13,920 12,800 1,120 8.0 13,820 12,740 1,080 7.8
260,150 238,680 21,470 8.3 263,610 243,980 19,630 7.4 262,880 243,740 19,150 7.3 114,220 103,010 11,210 9.8 115,970 105,530 10,440 9.0 115,800 105,700 10,100 8.7 54,700 49,810 4,890 8.9 54,940 50,340 4,590 8.4 53,860 49,570 4,300 8.0 56,180 51,020 5,150 9.2 56,190 51,150 5,030 9.0 55,860 51,020 4,840 8.7
101,480 93,040 8,450 8.3 101,890 94,320 7,570 7.4 102,210 94,950 7,260 7.1 146,510 134,690 11,820 8.1 149,330 138,540 10,790 7.2 149,370 138,690 10,680 7.1 366,100 339,180 26,920 7.4 374,220 349,490 24,730 6.6 373,860 350,110 23,750 6.4 609,800 552,330 57,480 9.4 631,130 573,150 57,980 9.2 631,450 575,840 55,610 8.8 63,560 56,780 6,780 10.7 64,340 57,880 6,460 10.0 63,710 57,530 6,190 9.7
823,780 758,480 65,290 7.9 839,130 778,710 60,430 7.2 831,580 774,570 57,010 6.9
153,613,000 139,220,000 14,393,000 9.4 3,063,100 2,776,200 286,900 9.4
153,937,000 140,614,000 13,323,000 8.7 3,111,100 2,828,500 282,600 9.1
153,887,000 140,790,000 13,097,000 8.5 3,109,000 2,839,700 269,300 8.7
153,156,000 139,159,000 13,997,000 9.1 3,056,400 2,779,400 277,000 9.1
153,683,000 141,070,000 12,613,000 8.2 3,117,200 2,855,300 261,900 8.4
153,373,000 140,681,000 12,692,000 8.3 3,099,800 2,847,900 251,900 8.1
December 2010 November 2011 December 2011
7
— TN-Hamilton, Marion, Sequatchie. GA-Catoosa, Dade, Walker
3.0
5.0
7.0
9.0
11.0
JAN FEB MAR APR MAY JUN JUL AUG SEP OCT NOV DEC
RA
TE
MONTH
C H A T T A N O O G A M S AU N E M P L O Y M E N T R A T E S
(NOT SEASONALLY ADJUSTED)
2009 2010 2011
Chattanooga MSA
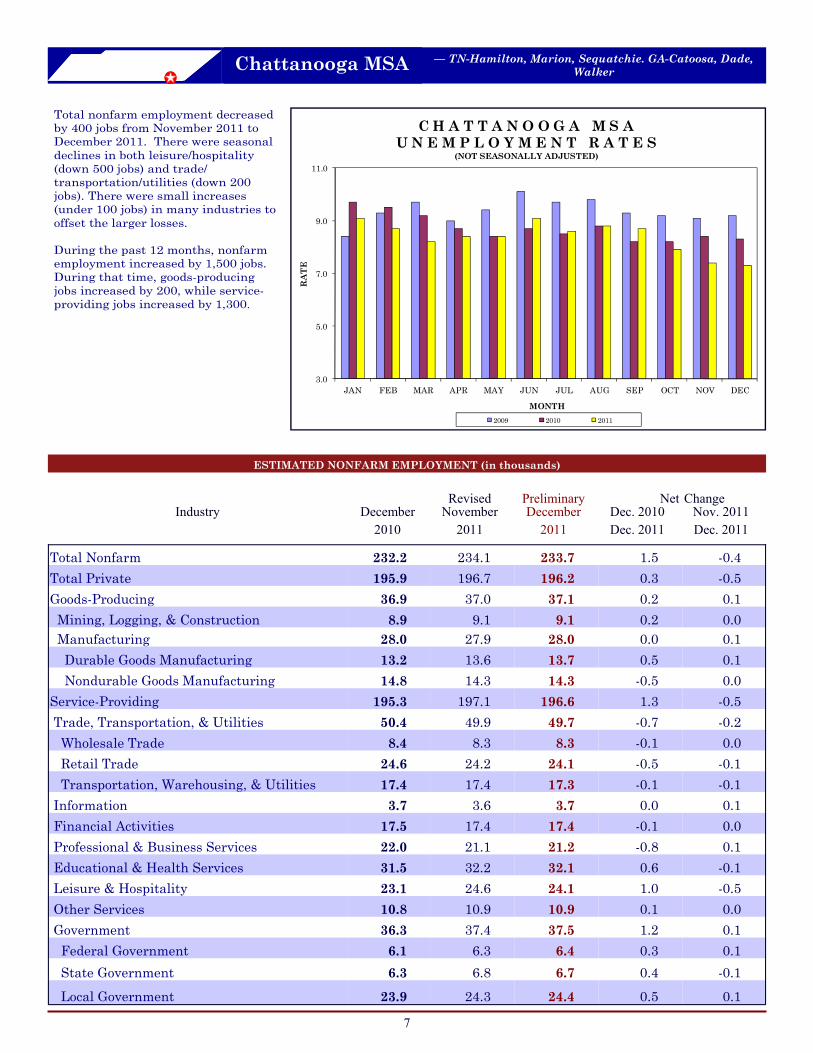
Total nonfarm employment decreased by 400 jobs from November 2011 to December 2011. There were seasonal declines in both leisure/hospitality (down 500 jobs) and trade/ transportation/utilities (down 200 jobs). There were small increases (under 100 jobs) in many industries to offset the larger losses. During the past 12 months, nonfarm employment increased by 1,500 jobs. During that time, goods-producing jobs increased by 200, while service-providing jobs increased by 1,300.
Revised Preliminary Net Change Industry December November December Dec. 2010 Nov. 2011
2010 2011 2011 Dec. 2011 Dec. 2011
ESTIMATED NONFARM EMPLOYMENT (in thousands)
Total Nonfarm 232.2 234.1 233.7 1.5 -0.4 Total Private 195.9 196.7 196.2 0.3 -0.5 Goods-Producing 36.9 37.0 37.1 0.2 0.1 Mining, Logging, & Construction 8.9 9.1 9.1 0.2 0.0 Manufacturing 28.0 27.9 28.0 0.0 0.1 Durable Goods Manufacturing 13.2 13.6 13.7 0.5 0.1 Nondurable Goods Manufacturing 14.8 14.3 14.3 -0.5 0.0 Service-Providing 195.3 197.1 196.6 1.3 -0.5 Trade, Transportation, & Utilities 50.4 49.9 49.7 -0.7 -0.2 Wholesale Trade 8.4 8.3 8.3 -0.1 0.0 Retail Trade 24.6 24.2 24.1 -0.5 -0.1 Transportation, Warehousing, & Utilities 17.4 17.4 17.3 -0.1 -0.1 Information 3.7 3.6 3.7 0.0 0.1 Financial Activities 17.5 17.4 17.4 -0.1 0.0 Professional & Business Services 22.0 21.1 21.2 -0.8 0.1 Educational & Health Services 31.5 32.2 32.1 0.6 -0.1 Leisure & Hospitality 23.1 24.6 24.1 1.0 -0.5 Other Services 10.8 10.9 10.9 0.1 0.0 Government 36.3 37.4 37.5 1.2 0.1 Federal Government 6.1 6.3 6.4 0.3 0.1 State Government 6.3 6.8 6.7 0.4 -0.1 Local Government 23.9 24.3 24.4 0.5 0.1

8
Knoxville MSA -Anderson, Blount, Knox, Loudon, Union
ESTIMATED NONFARM EMPLOYMENT (in thousands)
3.0
4.0
5.0
6.0
7.0
8.0
9.0
10.0
JAN FEB MAR APR MAY JUN JUL AUG SEP OCT NOV DEC
RAT
E
MONTH
K N O X V I L L E M S A U N E M P L O Y M E N T R A T E S
(NOT SEASONALLY ADJUSTED)
2009 2010 2011
Total nonfarm employment increased by 400 jobs from November 2011 to December2011. There were seasonal increases in professional/ business services (up 600 jobs) and durable goods manufacturing (up 300 jobs). This was partially offset by declines in state government (down 400 jobs) and retail trade (down 200 jobs). Over the past 12 months, nonfarm employment increased by 5,700 jobs. During that time, goods-producing jobs increased by 2,600, while service-providing jobs increased by 3,100.
Revised Preliminary Net Change Industry December November December Dec. 2010 Nov. 2011
2010 2011 2011 Dec. 2011 Dec. 2011
Total Nonfarm 326.6 331.9 332.3 5.7 0.4
Total Private 275.3 281.4 282.3 7.0 0.9 Goods-Producing 45.5 47.8 48.1 2.6 0.3 Mining, Logging, & Construction 16.2 18.1 18.0 1.8 -0.1 Manufacturing 29.3 29.7 30.1 0.8 0.4 Durable Goods Manufacturing 21.8 22.3 22.6 0.8 0.3 Nondurable Goods Manufacturing 7.5 7.4 7.5 0.0 0.1 Service-Providing 281.1 284.1 284.2 3.1 0.1 Trade, Transportation, & Utilities 68.7 69.3 69.2 0.5 -0.1 Wholesale Trade 15.8 15.9 15.9 0.1 0.0 Retail Trade 41.6 42.2 42.0 0.4 -0.2 Transportation, Warehousing, & Utilities 11.3 11.2 11.3 0.0 0.1 Information 5.5 5.4 5.4 -0.1 0.0 Financial Activities 16.7 16.6 16.6 -0.1 0.0 Professional & Business Services 45.1 47.7 48.3 3.2 0.6 Educational & Health Services 45.4 46.3 46.3 0.9 0.0 Leisure & Hospitality 34.2 33.9 34.0 -0.2 0.1 Other Services 14.2 14.4 14.4 0.2 0.0 Government 51.3 50.5 50.0 -1.3 -0.5 Federal Government 5.1 5.1 5.1 0.0 0.0 State Government 16.5 17.1 16.7 0.2 -0.4 Local Government 29.7 28.3 28.2 -1.5 -0.1
9
Memphis MSA - TN - Fayette, Shelby, Tipton. AR - Crittenden. MS - DeSoto, Marshall, Tate, Tunica
ESTIMATED NONFARM EMPLOYMENT (in thousands)
4.0
5.0
6.0
7.0
8.0
9.0
10.0
11.0
12.0
JAN FEB MAR APR MAY JUN JUL AUG SEP OCT NOV DEC
RA
TE
MONTH
M E M P H I S M S A U N E M P L O Y M E N T R A T E S
(NOT SEASONALLY ADJUSTED)
2009 2010 2011
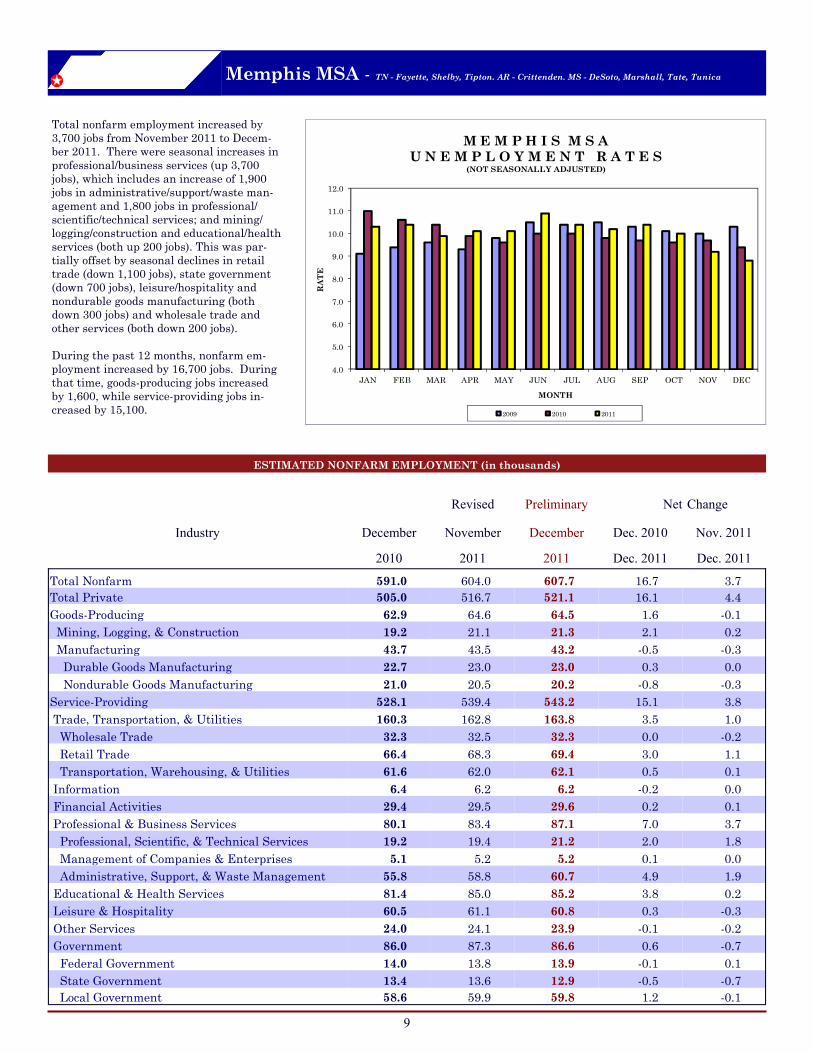
Total nonfarm employment increased by 3,700 jobs from November 2011 to Decem-ber 2011. There were seasonal increases in professional/business services (up 3,700 jobs), which includes an increase of 1,900 jobs in administrative/support/waste man-agement and 1,800 jobs in professional/scientific/technical services; and mining/logging/construction and educational/health services (both up 200 jobs). This was par-tially offset by seasonal declines in retail trade (down 1,100 jobs), state government (down 700 jobs), leisure/hospitality and nondurable goods manufacturing (both down 300 jobs) and wholesale trade and other services (both down 200 jobs). During the past 12 months, nonfarm em-ployment increased by 16,700 jobs. During that time, goods-producing jobs increased by 1,600, while service-providing jobs in-creased by 15,100.
Revised Preliminary Net Change
Industry December November December Dec. 2010 Nov. 2011
2010 2011 2011 Dec. 2011 Dec. 2011
Total Nonfarm 591.0 604.0 607.7 16.7 3.7 Total Private 505.0 516.7 521.1 16.1 4.4 Goods-Producing 62.9 64.6 64.5 1.6 -0.1 Mining, Logging, & Construction 19.2 21.1 21.3 2.1 0.2 Manufacturing 43.7 43.5 43.2 -0.5 -0.3 Durable Goods Manufacturing 22.7 23.0 23.0 0.3 0.0 Nondurable Goods Manufacturing 21.0 20.5 20.2 -0.8 -0.3 Service-Providing 528.1 539.4 543.2 15.1 3.8 Trade, Transportation, & Utilities 160.3 162.8 163.8 3.5 1.0 Wholesale Trade 32.3 32.5 32.3 0.0 -0.2 Retail Trade 66.4 68.3 69.4 3.0 1.1 Transportation, Warehousing, & Utilities 61.6 62.0 62.1 0.5 0.1 Information 6.4 6.2 6.2 -0.2 0.0 Financial Activities 29.4 29.5 29.6 0.2 0.1 Professional & Business Services 80.1 83.4 87.1 7.0 3.7 Professional, Scientific, & Technical Services 19.2 19.4 21.2 2.0 1.8 Management of Companies & Enterprises 5.1 5.2 5.2 0.1 0.0 Administrative, Support, & Waste Management 55.8 58.8 60.7 4.9 1.9 Educational & Health Services 81.4 85.0 85.2 3.8 0.2 Leisure & Hospitality 60.5 61.1 60.8 0.3 -0.3 Other Services 24.0 24.1 23.9 -0.1 -0.2 Government 86.0 87.3 86.6 0.6 -0.7 Federal Government 14.0 13.8 13.9 -0.1 0.1 State Government 13.4 13.6 12.9 -0.5 -0.7 Local Government 58.6 59.9 59.8 1.2 -0.1
10
Nashville MSA — Cannon, Cheatham, Davidson, Dickson, Hickman, Macon, Robertson, Rutherford, Smith, Sumner, Trousdale, Williamson, Wilson
3.0
4.0
5.0
6.0
7.0
8.0
9.0
10.0
11.0
JAN FEB MAR APR MAY JUN JUL AUG SEP OCT NOV DEC
RA
TE
MONTH
N A S H V I L L E M S A U N E M P L O Y M E N T R A T E S
(NOT SEASONALLY ADJUSTED)
2009 2010 2011
ESTIMATED NONFARM EMPLOYMENT (in thousands)
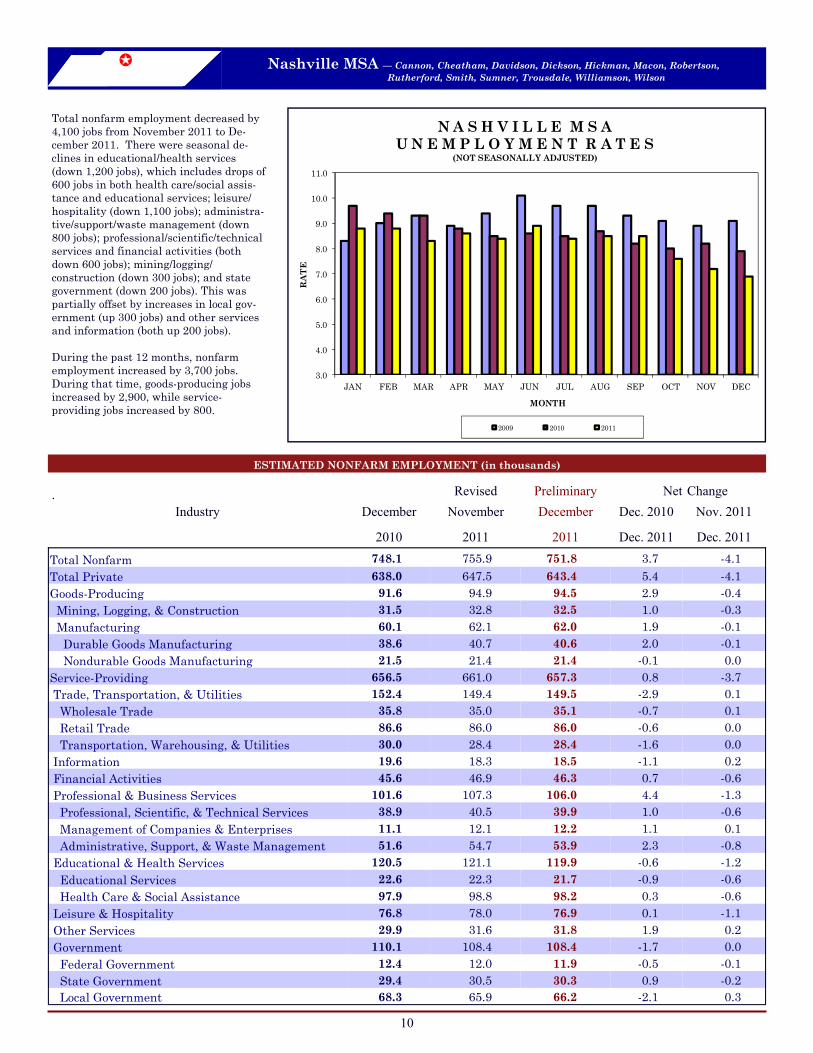
Total nonfarm employment decreased by 4,100 jobs from November 2011 to De-cember 2011. There were seasonal de-clines in educational/health services (down 1,200 jobs), which includes drops of 600 jobs in both health care/social assis-tance and educational services; leisure/hospitality (down 1,100 jobs); administra-tive/support/waste management (down 800 jobs); professional/scientific/technical services and financial activities (both down 600 jobs); mining/logging/construction (down 300 jobs); and state government (down 200 jobs). This was partially offset by increases in local gov-ernment (up 300 jobs) and other services and information (both up 200 jobs). During the past 12 months, nonfarm employment increased by 3,700 jobs. During that time, goods-producing jobs increased by 2,900, while service-providing jobs increased by 800.
. Revised Preliminary Net Change Industry December November December Dec. 2010 Nov. 2011
2010 2011 2011 Dec. 2011 Dec. 2011
Total Nonfarm 748.1 755.9 751.8 3.7 -4.1 Total Private 638.0 647.5 643.4 5.4 -4.1 Goods-Producing 91.6 94.9 94.5 2.9 -0.4 Mining, Logging, & Construction 31.5 32.8 32.5 1.0 -0.3 Manufacturing 60.1 62.1 62.0 1.9 -0.1 Durable Goods Manufacturing 38.6 40.7 40.6 2.0 -0.1 Nondurable Goods Manufacturing 21.5 21.4 21.4 -0.1 0.0 Service-Providing 656.5 661.0 657.3 0.8 -3.7 Trade, Transportation, & Utilities 152.4 149.4 149.5 -2.9 0.1 Wholesale Trade 35.8 35.0 35.1 -0.7 0.1 Retail Trade 86.6 86.0 86.0 -0.6 0.0 Transportation, Warehousing, & Utilities 30.0 28.4 28.4 -1.6 0.0 Information 19.6 18.3 18.5 -1.1 0.2 Financial Activities 45.6 46.9 46.3 0.7 -0.6 Professional & Business Services 101.6 107.3 106.0 4.4 -1.3 Professional, Scientific, & Technical Services 38.9 40.5 39.9 1.0 -0.6 Management of Companies & Enterprises 11.1 12.1 12.2 1.1 0.1 Administrative, Support, & Waste Management 51.6 54.7 53.9 2.3 -0.8 Educational & Health Services 120.5 121.1 119.9 -0.6 -1.2 Educational Services 22.6 22.3 21.7 -0.9 -0.6 Health Care & Social Assistance 97.9 98.8 98.2 0.3 -0.6 Leisure & Hospitality 76.8 78.0 76.9 0.1 -1.1 Other Services 29.9 31.6 31.8 1.9 0.2 Government 110.1 108.4 108.4 -1.7 0.0 Federal Government 12.4 12.0 11.9 -0.5 -0.1 State Government 29.4 30.5 30.3 0.9 -0.2 Local Government 68.3 65.9 66.2 -2.1 0.3
11
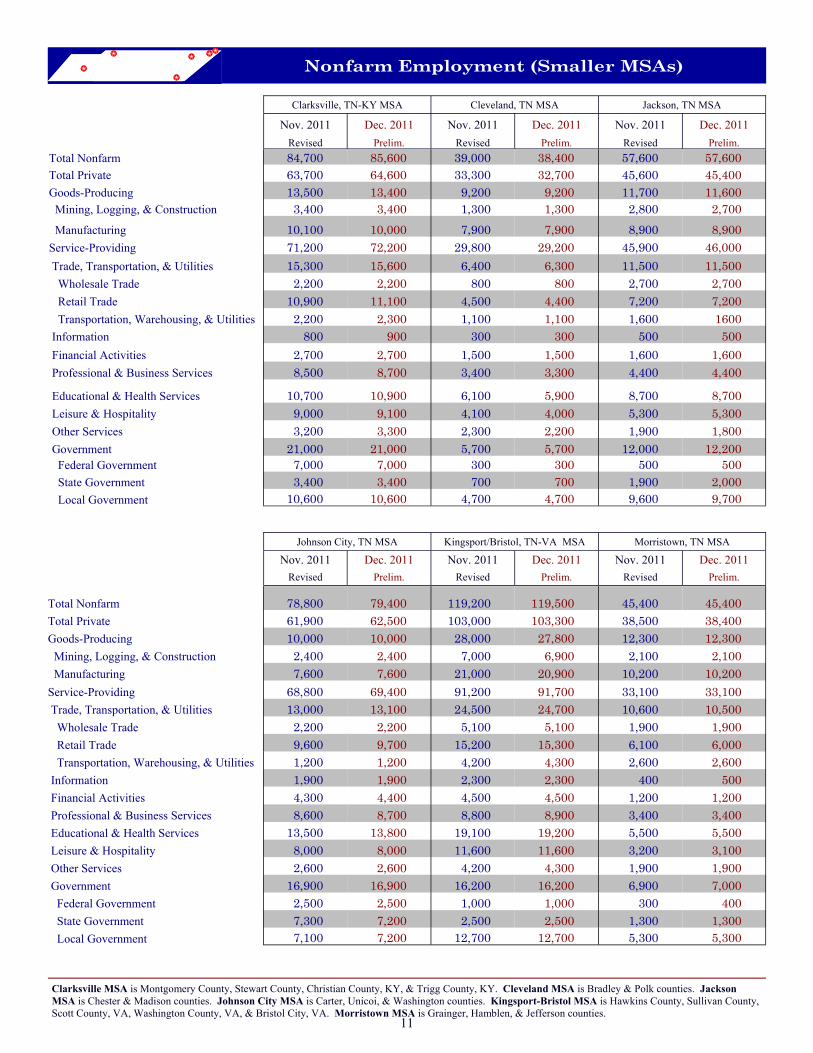
Clarksville MSA is Montgomery County, Stewart County, Christian County, KY, & Trigg County, KY. Cleveland MSA is Bradley & Polk counties. Jackson MSA is Chester & Madison counties. Johnson City MSA is Carter, Unicoi, & Washington counties. Kingsport-Bristol MSA is Hawkins County, Sullivan County, Scott County, VA, Washington County, VA, & Bristol City, VA. Morristown MSA is Grainger, Hamblen, & Jefferson counties.
Nonfarm Employment (Smaller MSAs)
Clarksville, TN-KY MSA Cleveland, TN MSA Jackson, TN MSA
Nov. 2011 Dec. 2011 Nov. 2011 Dec. 2011 Nov. 2011 Dec. 2011 Revised Prelim. Revised Prelim. Revised Prelim.
Johnson City, TN MSA Kingsport/Bristol, TN-VA MSA Morristown, TN MSA
Nov. 2011 Dec. 2011 Nov. 2011 Dec. 2011 Nov. 2011 Dec. 2011 Revised Prelim. Revised Prelim. Revised Prelim.
Total Nonfarm 84,700 85,600 39,000 38,400 57,600 57,600 Total Private 63,700 64,600 33,300 32,700 45,600 45,400 Goods-Producing 13,500 13,400 9,200 9,200 11,700 11,600 Mining, Logging, & Construction 3,400 3,400 1,300 1,300 2,800 2,700 Manufacturing 10,100 10,000 7,900 7,900 8,900 8,900 Service-Providing 71,200 72,200 29,800 29,200 45,900 46,000 Trade, Transportation, & Utilities 15,300 15,600 6,400 6,300 11,500 11,500 Wholesale Trade 2,200 2,200 800 800 2,700 2,700 Retail Trade 10,900 11,100 4,500 4,400 7,200 7,200 Transportation, Warehousing, & Utilities 2,200 2,300 1,100 1,100 1,600 1600 Information 800 900 300 300 500 500 Financial Activities 2,700 2,700 1,500 1,500 1,600 1,600 Professional & Business Services 8,500 8,700 3,400 3,300 4,400 4,400
Educational & Health Services 10,700 10,900 6,100 5,900 8,700 8,700 Leisure & Hospitality 9,000 9,100 4,100 4,000 5,300 5,300 Other Services 3,200 3,300 2,300 2,200 1,900 1,800 Government 21,000 21,000 5,700 5,700 12,000 12,200 Federal Government 7,000 7,000 300 300 500 500 State Government 3,400 3,400 700 700 1,900 2,000 Local Government 10,600 10,600 4,700 4,700 9,600 9,700
Total Nonfarm 78,800 79,400 119,200 119,500 45,400 45,400 Total Private 61,900 62,500 103,000 103,300 38,500 38,400 Goods-Producing 10,000 10,000 28,000 27,800 12,300 12,300 Mining, Logging, & Construction 2,400 2,400 7,000 6,900 2,100 2,100 Manufacturing 7,600 7,600 21,000 20,900 10,200 10,200 Service-Providing 68,800 69,400 91,200 91,700 33,100 33,100 Trade, Transportation, & Utilities 13,000 13,100 24,500 24,700 10,600 10,500 Wholesale Trade 2,200 2,200 5,100 5,100 1,900 1,900 Retail Trade 9,600 9,700 15,200 15,300 6,100 6,000 Transportation, Warehousing, & Utilities 1,200 1,200 4,200 4,300 2,600 2,600 Information 1,900 1,900 2,300 2,300 400 500 Financial Activities 4,300 4,400 4,500 4,500 1,200 1,200 Professional & Business Services 8,600 8,700 8,800 8,900 3,400 3,400 Educational & Health Services 13,500 13,800 19,100 19,200 5,500 5,500 Leisure & Hospitality 8,000 8,000 11,600 11,600 3,200 3,100 Other Services 2,600 2,600 4,200 4,300 1,900 1,900 Government 16,900 16,900 16,200 16,200 6,900 7,000 Federal Government 2,500 2,500 1,000 1,000 300 400 State Government 7,300 7,200 2,500 2,500 1,300 1,300 Local Government 7,100 7,200 12,700 12,700 5,300 5,300
12
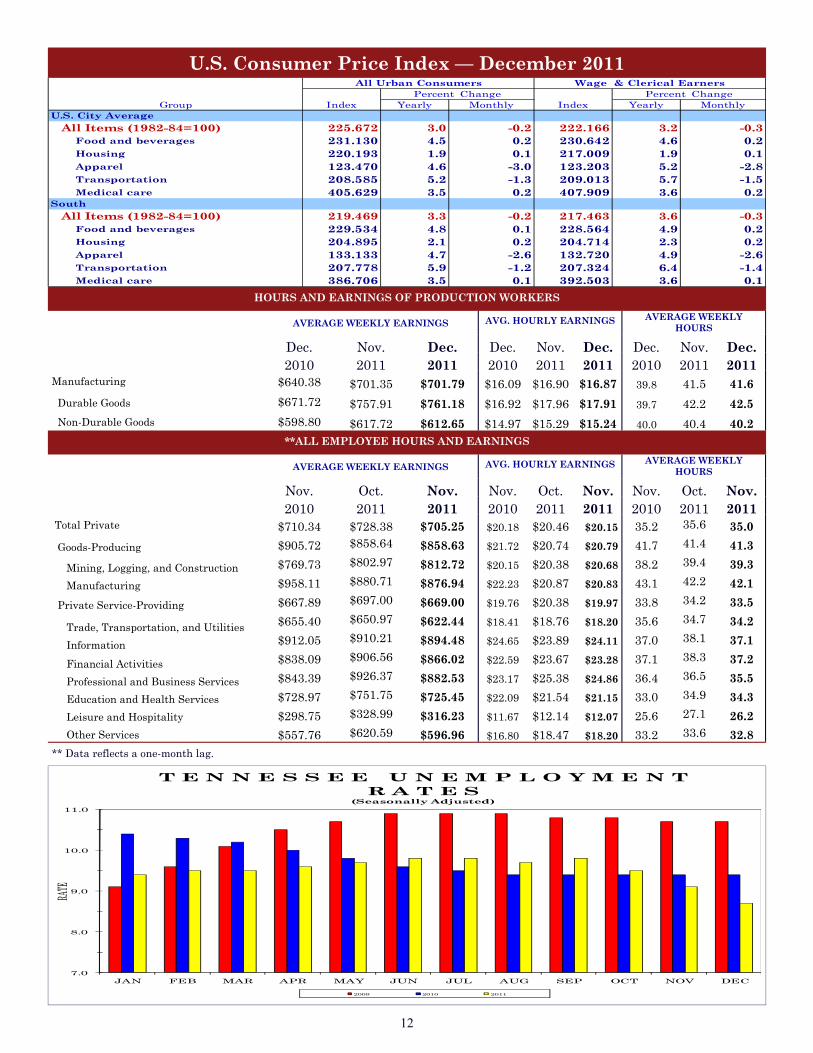
U.S. Consumer Price Index — December 2011
Group Index Yearly Monthly Index Yearly MonthlyU.S. City Average All Items (1982-84=100) 225.672 3.0 -0.2 222.166 3.2 -0.3 Food and beverages 231.130 4.5 0.2 230.642 4.6 0.2 Housing 220.193 1.9 0.1 217.009 1.9 0.1 Apparel 123.470 4.6 -3.0 123.203 5.2 -2.8 Transportation 208.585 5.2 -1.3 209.013 5.7 -1.5 Medical care 405.629 3.5 0.2 407.909 3.6 0.2South All Items (1982-84=100) 219.469 3.3 -0.2 217.463 3.6 -0.3 Food and beverages 229.534 4.8 0.1 228.564 4.9 0.2 Housing 204.895 2.1 0.2 204.714 2.3 0.2 Apparel 133.133 4.7 -2.6 132.720 4.9 -2.6 Transportation 207.778 5.9 -1.2 207.324 6.4 -1.4 Medical care 386.706 3.5 0.1 392.503 3.6 0.1
Percent Change Percent ChangeAll Urban Consumers Wage & Clerical Earners
HOURS AND EARNINGS OF PRODUCTION WORKERS
AVERAGE WEEKLY EARNINGS AVERAGE WEEKLY HOURS
AVG. HOURLY EARNINGS
Manufacturing
Durable Goods
Non-Durable Goods
$640.38 $671.72 $598.80
$701.35 $757.91 $617.72
$701.79 $761.18 $612.65
$16.09 $16.92 $14.97
$16.90 $17.96 $15.29
$16.87 $17.91 $15.24
39.8
39.7
40.0
41.5 42.2 40.4
41.6 42.5 40.2
2011 2010 2011 2011 2011 2011 2010 2011 2010 Dec. Dec. Dec. Dec. Dec. Dec. Nov. Nov. Nov.
**ALL EMPLOYEE HOURS AND EARNINGS
AVERAGE WEEKLY EARNINGS AVG. HOURLY EARNINGS AVERAGE WEEKLY HOURS
Nov. Nov. Nov. Nov. Nov. Nov. Oct. Oct. Oct. 2010 2010 2010 2011 2011 2011 2011 2011 2011
Total Private
Goods-Producing
Mining, Logging, and Construction Manufacturing
Private Service-Providing
Trade, Transportation, and Utilities Information Financial Activities Professional and Business Services Education and Health Services Leisure and Hospitality Other Services
$705.25 $858.63 $812.72 $876.94 $669.00 $622.44 $894.48 $866.02 $882.53 $725.45 $316.23 $596.96
$728.38 $858.64 $802.97 $880.71 $697.00 $650.97 $910.21 $906.56 $926.37 $751.75 $328.99 $620.59
$710.34 $905.72 $769.73 $958.11 $667.89 $655.40 $912.05 $838.09 $843.39 $728.97 $298.75 $557.76
$20.15 $20.79 $20.68 $20.83 $19.97 $18.20 $24.11 $23.28 $24.86 $21.15 $12.07 $18.20
$20.46 $20.74 $20.38 $20.87 $20.38 $18.76 $23.89 $23.67 $25.38 $21.54 $12.14 $18.47
$20.18 $21.72 $20.15 $22.23 $19.76 $18.41 $24.65 $22.59 $23.17 $22.09 $11.67 $16.80
35.0 41.3 39.3 42.1 33.5 34.2 37.1 37.2 35.5 34.3 26.2 32.8
35.6 41.4 39.4 42.2 34.2 34.7 38.1 38.3 36.5 34.9 27.1 33.6
35.2 41.7 38.2 43.1 33.8 35.6 37.0 37.1 36.4 33.0 25.6 33.2
** Data reflects a one-month lag.
7.0
8.0
9.0
10.0
11.0
JAN FEB MAR APR MAY JUN JUL AUG SEP OCT NOV DEC
RATE
T E N N E S S E E U N E M P L O Y M E N T R A T E S
(Seasonally Adjusted)
2009 2010 2011